 Cunmin Qu1,2†
 Huiyan Zhao1,2†
 Fuyou Fu3†
 Kai Zhang1,2
 Jianglian Yuan1,2
 Liezhao Liu1,2Rui Wang1,2
 Xinfu Xu1,2
 Kun Lu1,2*
 Jia-Na Li1,2*
- 1Chongqing Engineering Research Center for Rapeseed, College of Agronomy and Biotechnology, Southwest University, Chongqing, China
- 2Engineering Research Center of South Upland Agriculture of Ministry of Education, Southwest University, Chongqing, China
- 3Department of Botany and Plant Pathology, Purdue University, West Lafayette, IN, USA
Flavonoids are secondary metabolites that are extensively distributed in the plant kingdom and contribute to seed coat color formation in rapeseed. To decipher the genetic networks underlying flavonoid biosynthesis in rapeseed, we constructed a high-density genetic linkage map with 1089 polymorphic loci (including 464 SSR loci, 97 RAPD loci, 451 SRAP loci, and 75 IBP loci) using recombinant inbred lines (RILs). The map consists of 19 linkage groups and covers 2775 cM of the B. napus genome with an average distance of 2.54 cM between adjacent markers. We then performed expression quantitative trait locus (eQTL) analysis to detect transcript-level variation of 18 flavonoid biosynthesis pathway genes in the seeds of the 94 RILs. In total, 72 eQTLs were detected and found to be distributed among 15 different linkage groups that account for 4.11% to 52.70% of the phenotypic variance atrributed to each eQTL. Using a genetical genomics approach, four eQTL hotspots together harboring 28 eQTLs associated with 18 genes were found on chromosomes A03, A09, and C08 and had high levels of synteny with genome sequences of A. thaliana and Brassica species. Associated with the trans-eQTL hotspots on chromosomes A03, A09, and C08 were 5, 17, and 1 genes encoding transcription factors, suggesting that these genes have essential roles in the flavonoid biosynthesis pathway. Importantly, bZIP25, which is expressed specifically in seeds, MYC1, which controls flavonoid biosynthesis, and the R2R3-type gene MYB51, which is involved in the synthesis of secondary metabolites, were associated with the eQTL hotspots, and these genes might thus be involved in different flavonoid biosynthesis pathways in rapeseed. Hence, further studies of the functions of these genes will provide insight into the regulatory mechanism underlying flavonoid biosynthesis, and lay the foundation for elaborating the molecular mechanism of seed coat color formation in B. napus.
Introduction
Brassica napus L. (2n = 38, AACC) is an economically important oilseed crop that is widely cultivated as a source of vegetable oil, biodiesel, and protein-rich meal for animal feed (Kimber and Mcgregor, 1995). Yellow B. napus seeds are the most desirable, as they have thinner seed coats and higher seed oil and protein contents than do the dark-seeded varieties with a similar genetic background (Olsson, 1960; Tang et al., 1997; Meng et al., 1998). Several studies have shown that seed coat color is determined by the content of the phenolic compounds cyanidin and procyanidin in B. napus (Marles and Gruber, 2004; Lepiniec et al., 2006; Qu et al., 2013). These pigments are mainly composed of polymers of proanthocyanidin (PA), which is synthesized via the flavonoid-anthocyanin-proanthocyanidin pathway (simplified as flavonoid pathway here), a core branch of the phenylpropanoid pathway (Bharti and Khurana, 2003; Gachon et al., 2005). In A. thaliana, most of the structural and regulatory loci of the core flavonoid biosynthesis pathway have been cloned and functionally characterized, and over 22 Arabidopsis mutants (tt1–tt19, ttg1, ttg2, and aha10) with altered patterns of seed coat color have been identified. Loss-of-function mutations [tt (transparent testa) or tt-like] in any one of these single-copy loci change the seed coat color from dark brown to yellow (Wan et al., 2002; Winkel-Shirley, 2002; Baudry et al., 2004; Lepiniec et al., 2006). In addition, members of the MYB and R/B-like basic helix-loop-helix (bHLH) families were demonstrated to be involved in the flavonoid biosynthesis pathway; for example, a transcriptional activation MYB-bHLH-WD40 complex (MBW) consisting of R2R3 MYB, bHLH, and WD40 proteins was found to be directly involved in the regulation of anthocyanin biosynthetic genes and the bHLH proteins were found to play essential roles in the synergistic regulation of flavonid accumulation (Baudry et al., 2006; Dubos et al., 2008; Kitamura et al., 2010; Stracke et al., 2010). Furthermore, TT2 (R2R3-MYB), TT8 (bHLH), and TTG1 (WDR) affect the production of PA, which is a substrate of the flavonoid pathway (Baudry et al., 2004, 2006; Lepiniec et al., 2006), and AtMYB4, bHLHIN1, and AtICX1 regulate various flavonoid biosynthesis pathways (Burr et al., 1996; Jin et al., 2000; Wade et al., 2003). Moreover, some homologs of genes involved in flavonoid biosynthesis have been cloned and characterized in B. napus (Wei et al., 2007; Xu et al., 2007; Ni et al., 2008; Akhov et al., 2009; Auger et al., 2009; Chai et al., 2009; Lu et al., 2009; Chen et al., 2013). These results provide a foundation for further studies of the molecular and regulatory mechanisms underlying seed coat color formation in B. napus. Based on linkage mapping with DH, RIL, and F2 B. napus populations, a major QTL was identified on Chr. A09 that accounted for 40–60% of the phenotypic variance of seed coat color (Somers et al., 2001; Liu et al., 2005; Badani et al., 2006; Fu et al., 2007; Xiao et al., 2007; Rahman et al., 2010; Zhang et al., 2011). Candidate genes involved in seed coat color determination, such as TT10 and AHA10, have still not successfully been used in rapeseed breeding programs aimed at producing seeds with a particular coat color (Fu et al., 2007; Stein et al., 2013; Zhang et al., 2013). Efforts to breed yellow-seeded B. napus have been largely unsuccessful, since seed coat color is a typical quantitative trait under polygenic control (Rahman, 2001; Liu et al., 2005; Badani et al., 2006) that is influenced by factors such as maternal effects and the environment (Deynze et al., 1993). Hence, the molecular mechanism underlying yellow seed coat formation in Brassica is poorly understood.
Previous research suggested that one to four genes determine seed coat color in B. napus (Somers et al., 2001; Xiao et al., 2007; Zhang et al., 2011). Further, traditional studies for mapping quantitative trait loci (QTLs) had focused on identifying the major QTLs associated with seed coat color in different populations (Liu et al., 2005, 2006; Badani et al., 2006; Fu et al., 2007; Xiao et al., 2007; Yan et al., 2009; Zhang et al., 2011). However, these genes remain to be cloned and functionally characterized. Recently, the genome of the allopolyploid B. napus was released, and a total of 1097 and 1132 genes were annotated on the An and Cn subgenomes, respectively (Chalhoub et al., 2014). Moreover, genome-wide gene expression profiling has been extensively used to generate biological hypotheses based on differential expression. mRNAs that are differentially expressed among individuals can be considered as quantitative traits and their variation can be used to map expression quantitative trait loci (eQTLs) (Jansen and Nap, 2001). Based on the location of the eQTL relative to the location of the affected gene(s), each locus can be classified as cis acting (i.e., eQTL located near the affected gene) or trans acting (i.e., eQTL does not coincide with the affected gene) (Deutsch et al., 2005; Doss et al., 2005; Hubner et al., 2006). Therefore, this approach not only detects the expression of a specific gene and the genotype at that gene's locus, but it also reveals clustered trans-eQTLs that are simultaneously regulated by a large fraction of the transcriptome (Brem et al., 2002; Schadt et al., 2003; Morley et al., 2004). This approach has been successfully used in crop plants to detect transcript-level variation and downstream phenotypic trait variation (Jordan et al., 2007; Shi et al., 2007; West et al., 2007; Potokina et al., 2008; Xiao et al., 2013, 2014; Del Carpio et al., 2014; Basnet et al., 2015, 2016). Although eQTLs have successfully been cloned in plants (Werner et al., 2005; Zhang et al., 2006), global eQTL analysis in a large mapping population of plants has not hitherto been performed.
Here, we greatly increased the marker density of a RIL genetic map in rapeseed, from 420 loci with a total length of 1744 cM (Fu et al., 2007) to 1089 loci with a total length of 2775 cM. To decipher the upstream regulatory network underlying flavonoid biosynthesis, we used a sample of 94 recombinant inbred lines (RILs) from a population derived from a cross between the female parent GH06 and the male parent ZY821. The transcript levels of 18 flavonoid biosynthesis pathway genes were evaluated using RNA extracted from seeds of the RIL population at 30 days after flowering (DAF). Regarding the expressed transcript level of each gene in the RILs as a quantitative trait, we then performed eQTL analysis to detect eQTLs. Using this method, we were able to construct the regulatory pathway that contributes to the complex trait of seed coat color. We thus demonstrate that eQTL mapping can be successfully applied to B. napus.
Materials and Methods
Plant Materials and Total RNA Extraction
The recombinant inbred line (RIL) population was derived from a cross between the male parent Zhongyou 821 and the female parent GH06 followed by 10 successive generations of selfing by single seed propagation. Parental lines and RILs were sown in field trials at the plant breeding station at the Chongqing Rapeseed Technology Research Center (CRTRC) in 2012, as previously described (Fu et al., 2007). The seeds of 94 F2:10 RILs were harvested at 30 days after flowering (DAF) and used for total RNA isolation. Total RNA was extracted using the Plant RNA Mini Kit (Watson Biotechnologies, Inc., China). To remove contaminating genomic DNA, the total RNA was treated with RNase-free DNase I (TaKaRa, China). The quality and concentration of total RNA samples were assessed by agarose gel electrophoresis and spectrophotometry.
SSR Marker Assays
A total of 1850 SSR markers were developed to increase the density of the genetic map, including 1014 new developmental SSR markers (Supplementary Table S6), according to the B. rapa and B. oleracea genome (prefixed by “SWUA” and “SWUC,” respectively), 259 published SSR markers (Landry et al., 1991; Ferreira et al., 1994; Foisset et al., 1995; Uzunova et al., 1995; Lombard and Delourme, 2001; Xu et al., 2001; Zhao and Meng, 2003; Liu et al., 2005; Piquemal et al., 2005; Qiu et al., 2006; Fu et al., 2007; Radoev et al., 2008; Cheng et al., 2009; Kim et al., 2009), 447 SSR markers, and 130 intron-based polymorphism (IBP) markers provided by Dr. Beom-Seok Park and Dr. Soo-Jin Kwon of the National Academy of Agricultural Science (South Korea) (prefixed by “KC-,” “KR-,” “KA-,” “KS-,” “H-,” “B-,” and “S-”) and by Dr. Jingling Meng (Huazhong Agricultural University). Genomic DNA was extracted from the young leaves of five pooled plants per genotype using a standard CTAB extraction protocol.
PCR reactions were performed in 96-well plates in a volume of 10 μL. The composition of the mixture was as follows: 20 ng/μl of DNA template, 0.5 pmol of each primer, 0.2 mM dNTP mix, 1 mM MgCl2, 10 × PCR reaction buffer (with 15 mM MgCl2, TransGen Biotech), and 0.5 units of Taq DNA polymerase (TransGen Biotech). PCR was carried out in PTC-100 and PTC-200 thermocyclers with the following program (slightly modified from that of Piquemal et al., 2005): 94°C for 4 min; 35 cycles consisting of denaturation at 94°C for 45 s, annealing at 55°C for 45 s, and elongation at 72°C for 1 min; then a final elongation at 72°C 10 min. All PCR products were detected using non-denaturing polyacrylamide gel electrophoresis (10% polyacrylamide) on a DYCZ-30 electrophoresis gel with silver staining (Zhang et al., 2002).
Mapping and Alignments
All markers were tested for Mendelian segregation ratios using the Chi-square (χ2) test for goodness of fit with the expected 1:1 (a ≥ 0.05) ratio of individual markers in a RIL population. JoinMap 4.0 was used to build a high-density genetic linkage map with a minimum logarithm of odds score of 3.0. Genetic distances were calculated according to the Kosambi formula (Kosambi, 1944). To reconcile the linkage maps with Brassica and A. thaliana chromosomes, the genetic map was aligned with their pseudo-chromosomes using the base-sequences of each primer (Supplementary Table S3). Intron-based polymorphism (IBP) markers were developed directly from scaffold sequences, and the SSRs were considered anchored if the sequence of both primers matched the genome sequences (85% overlap and 98% identity). Similarly, the unigene sequences containing SSRs were aligned with A. thaliana genomic sequences using BLASTN. Sequences were regarded as homologs of loci in the A. thaliana genome if they had an e-value threshold of ≤ 1e−10. Regions that had conserved collinearity with A. thaliana were regarded as homologous syntenic regions.
Quantitative Real-Time Polymerase Chain Reaction Analysis
One microgram of each RNA sample was used to make first-strand cDNA in a 20 μl reaction with Oligo dT-Adaptor Primer using the RNA PCR Kit (AMV) Ver. 3.0 (TaKaRa, China). Primers for amplifying partial sequences of genes involved in the flavonoid biosynthesis pathway were designed from conserved nucleotide regions identified by multiple alignments of sequences from A. thaliana (http://www.arabidopsis.org/) and B. napus (Chalhoub et al., 2014; http://www.genoscope.cns.fr/brassicanapus/). Primers of genes for real-time PCR are listed in Supplementary Table S1. Real-time PCR was conducted using SYBR® Premix Ex Taq™ II (Perfect Real Time) (TaKaRa, China) in a PCR mixture consisting of 10 μl SYBR® Premix Ex Taq™ II, 1 to 5 μl of template cDNA, 0.8 μM of each PCR primer, and ddH2O to a final volume of 20 μl. Cycling conditions were 95°C for 2 min, followed by 40 cycles at 95°C for 10 s and 60°C for 20 s, and a dissociation curve consisting of a 10-s incubation at 95°C, 5-s incubation at 65°C, and a ramp up to 95°C, and amplifications were run on the Bio-Rad CFX96 Real Time System (USA). Melting curves were used to validate product specificity. The relative expression of the target genes was analyzed with the 2−ΔΔCt method (Supplementary Table S7) using BnACTIN7 (EV116054) and BnUBC21 (EV086936) as the internal controls (Wu et al., 2010). All samples were amplified in triplicate and used for the total RNA preparation. All qRT-PCR assays were repeated three times, and the mean value was used for further analysis. The Pearson correlation coefficient (r) and probability value (p) were used to display correlations and the significance of differences in expression between any two genes using SPSS 13.0. A probability value of p < 0.05 was considered to indicate statistical significance.
Expression Profiles of QTLs for Genes Associated With the Flavonoid Biosynthesis Pathway
The eQTLs for each gene were estimated by the composite interval method (CIM) with WinQTL Cartographer 2.5 software (Lander and Botstein, 1989; Wang et al., 2006). CIM was used to scan the genetic map and estimate the likelihood of a QTL and its corresponding effect at every 1 cM. A LOD (Log likelihood) of ≥2.5 indicated that the highest LOD score position in the interval was a QTL for a trait. The relative contribution of a genetic component was calculated as the proportion of the additive effect and phenotypic variance explained by that component. The linkage group order and QTLs in the map were processed using Mapchart 2.1 (Voorrips, 2002). QTL nomenclature, following a previously described system (Mccouch et al., 1997), started with “q” and was followed by an abbreviation of the trait name, the name of the linkage group, and the number of eQTLs in the linkage group that affect the trait. For instance, “qBAN-4-1” denotes the first eQTL associated with BAN expression and is detected and located on the fourth linkage group.
Analysis of Sequences Flanking trans-eQTLs
To determine the location of flavonoid biosynthesis pathway genes on B. napus chromosomes and to establish the type of eQTL, the cDNA sequences of orthologous genes in Arabidopsis and sequences of eQTL markers were used as query for a BLASTN search against the B. napus “Darmor-Bzh” reference genome (Cheng et al., 2014). The 200-kb sequences flanking each marker in B. napus were extracted from the reference genome. Genes in these flanking sequences were identified and annotated. cis-eQTLs coincide with the location of the underlying gene, whereas trans-eQTLs do not, implying that the observed eQTL represents the position of a locus that controls the expression variation of the target gene.
Results
Analysis of Expression Levels of 18 Genes Involved in Flavonoid Biosynthesis
We assayed the expression levels of 18 flavonoid biosynthesis genes (Supplementary Figure S3), including 12 structural genes (i.e., BnTT3, BnTT4, BnTT5, BnTT6, BnTT7, BnTT10, BnTT12, BnTT15, BnTT18, BnTT19, BnAHA10, and BnBAN) and six regulatory genes (BnTT1, BnTT2, BnTT8, BnTT16, BnTTG1, and BnTTG2) (Qu et al., 2013) in B. napus RILs derived from a cross between the male parent Zhongyou 821 and female parent GH06 by qRT-PCR, and normalized the gene expression levels according to the expression values of the male parent ZY821. We observed significant differences in the expression levels of these 18 genes between the parental lines and RILs (p < 0.01 or p < 0.05, Supplementary Table S2). Both skewness and kurtosis in absolute values implied that the expression levels of these genes had a normal distribution in the RILs, and that the expression levels were distributed continuously, as expected for a quantitative trait (Figure 1). In addition, the expression levels of all pairwise combinations of these 18 genes were subjected to correlation analysis, and significant positive and negative correlations were detected between the expression levels of gene pairs (Table 1), in accordance with their common function in the flavonoid biosynthesis pathway. For example, BnTT4 and BnTT5 catalyze the production of the precursor of all flavonoids and BnTT6 and BnTT3 convert naringenin into leucocyanidin and leucopelargonidin, respectively (Pelletier and Shirley, 1996; Burbulis and Winkel-Shirley, 1999; Abrahams et al., 2003; Kasai et al., 2007). Therefore, significant positive correlations were found among these genes (Table 1), but they exhibited a significant negative correlation with BnTT7 (Table 1), which encodes an enzyme that converts dihydrokaempferol into dihydroquercetin in the flavonoid biosynthesis pathway (Schoenbohm et al., 2000), suggesting that there is competition for catalyzing the same precursors of the flavonoid biosynthesis pathway. Furthermore, the expression of these genes was significantly positively correlated with that of structural (BnTT12, BnTT18, and BnAHA10) and regulatory (BnTT1, BnTT8, and BnTTG1) genes associated with flavonoid biosynthesis (Table 1), indicating that these genes are determined by a common upstream gene or activated by the same biosynthetic precursors of flavonoid in the biosynthesis pathway.
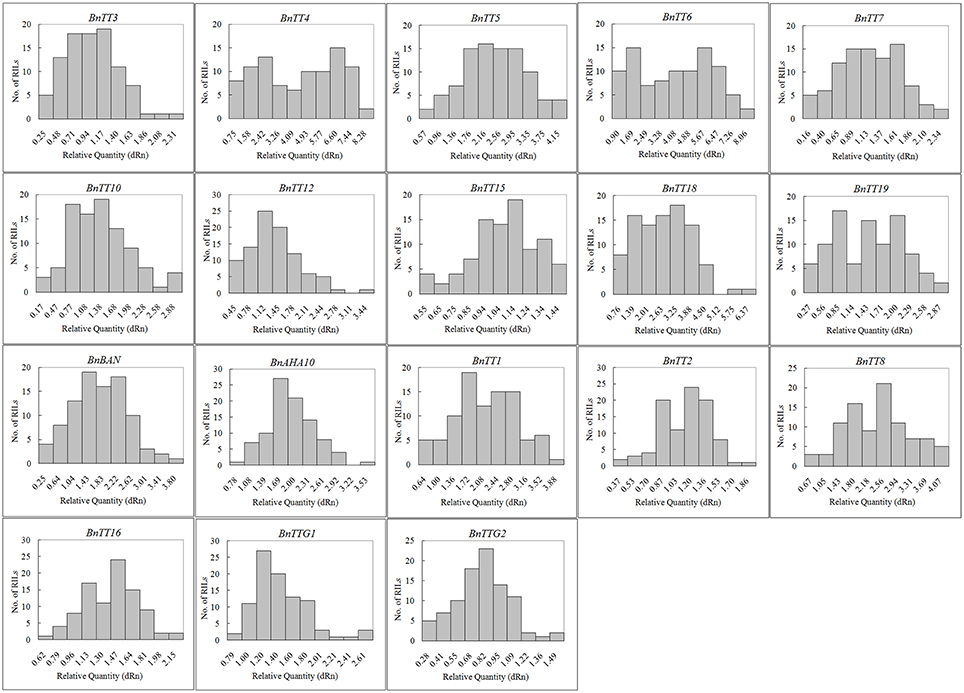
Figure 1. The frequency distribution of relative expression levels of flavonoid biosynthesis genes in B. napus. Abscissa: Relative expression level of each gene, Ordinate: The number of lines.
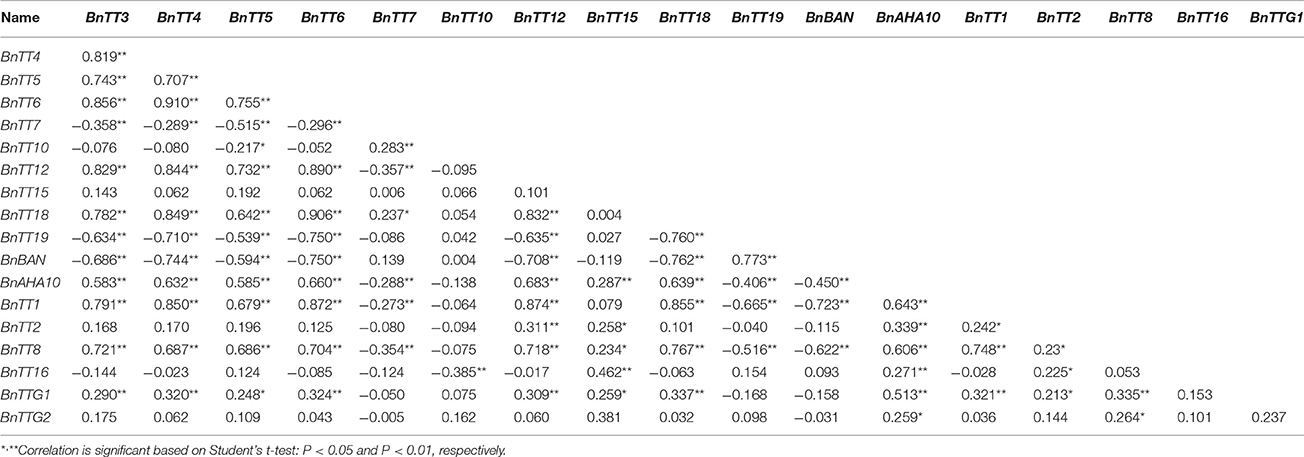
Table 1. Correlation coefficient among relative expression levels of all flavonoid genes in the RIL populations.
Linkage Map Construction and Alignments
A total of 1087 molecular markers, including 464 SSRs, 97 RAPDs, 451 SRAPs, and 75 IBP, were mapped on 19 linkage groups, covering 2, 775 cM of the B. napus genome, according to the Kosambi function previously published (Fu et al., 2007) (Figure 2). The average distance between two adjacent markers was 2.55 cM. The number of markers per linkage group varied from 6 to 184, and the length of each linkage group varied from 47.22 to 243.46 cM, with an average genetic distance of 0.83 cM on chromosome A09 and 7.87 cM on chromosome C02 (Table 2, Figure 2). Nineteen linkage groups were assigned to the public linkage maps based on anchored SSR markers. The results showed that the order of markers was relatively consistent with those in published maps (Piquemal et al., 2005; Radoev et al., 2008; Cheng et al., 2009; Kim et al., 2009; Xu et al., 2010). The number of anchored markers per chromosome ranged from 0 (C06) to 84 (A09), with an average of 12.47 for the 237 public markers evaluated, and from 2 (A04, A06) to 21 (A02), with an average of 10.32 for the 196 specific markers newly developed from the B. rapa and B. oleracea genomes. However, 13 interval gaps in which adjacent markers were separated by >15 cM were distributed on chromosomes A02, A03, A04, A06, A10, C01, C02, C04, C05, and C08, respectively (Table 2, Figure 2). These results show that the 19 linkage groups included in our linkage map have strong homology within particular linkage groups, and could be universally used in B. napus research.
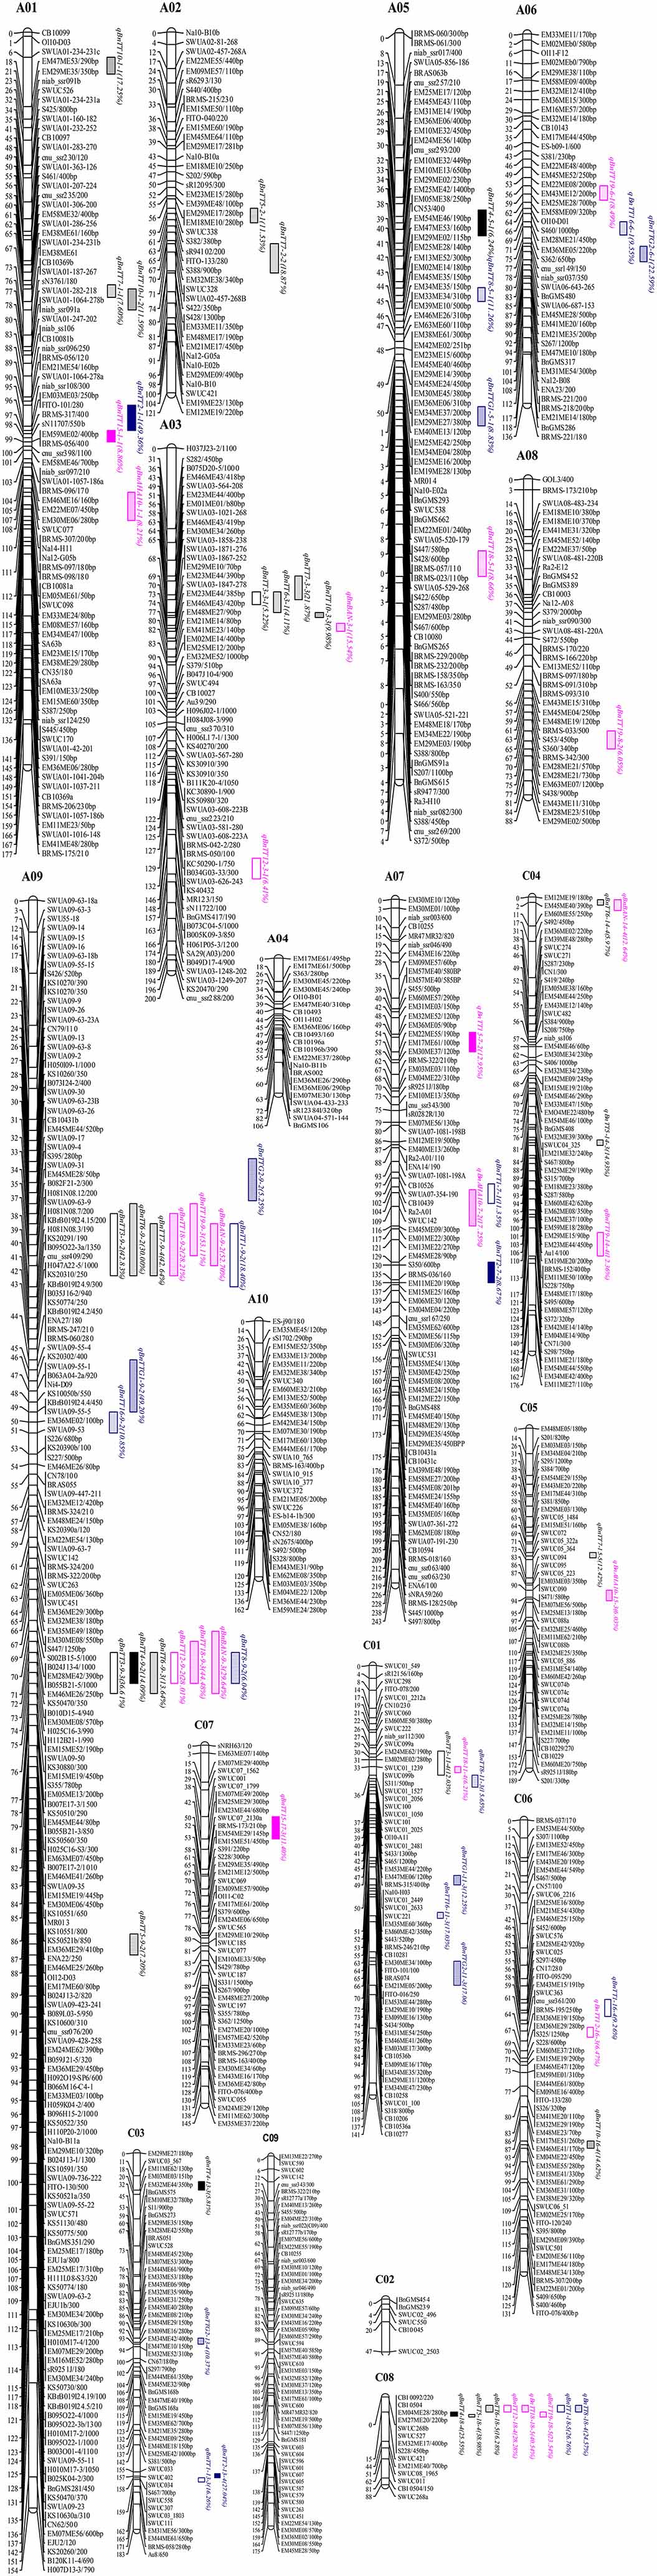
Figure 2. Linkage map of B. napus and eQTL detection for flavonoid biosynthesis genes in B. napus. The QTLs and markers were drawn using MapChart Version 2.0 software (Voorrips, 2002). The distances (in centiMorgan, cM) to the left of each linkage group were calculated using the Kosambi function.
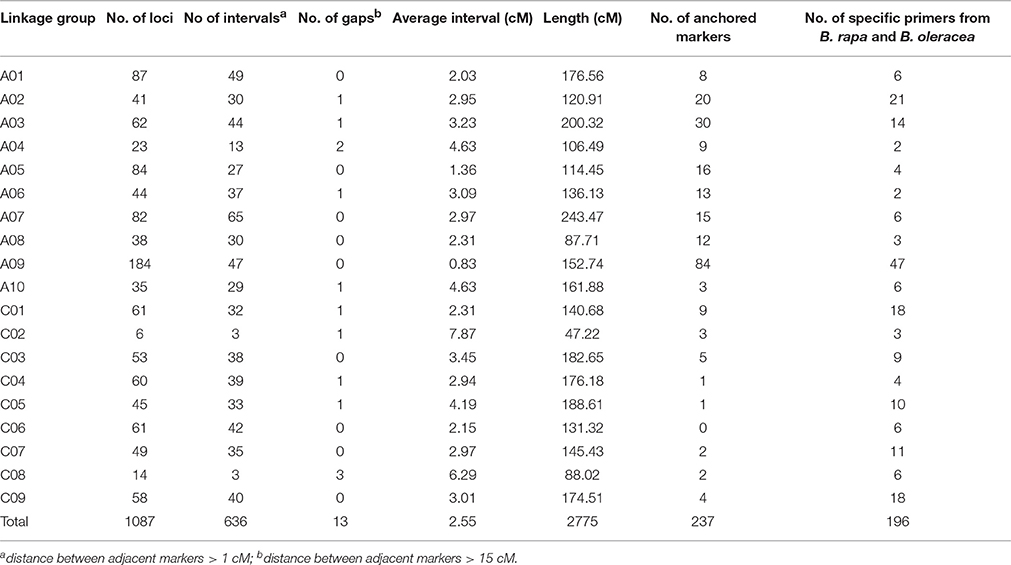
Table 2. Distribution of molecular markers on different linkage groups.
We identified 531 pairs of sequence-informative markers and mapped these markers to 19 linkage groups (Figure 2). Of these, 370 were anchored to the A and C sub-genomes of B. rapa and B. oleracea, which have high levels of nucleotide sequence similarity (E-value ≤ 1e-10), and 21 were mapped to two or three loci (Supplementary Table S3) that had high levels of sequence similarity with sequences in B. rapa (Supplementary Figure S1) and A. thaliana (Supplementary Figure S2). However, the relative position of some markers was inconsistent between the linkage map of B. napus and the physical map of B. rapa (Supplementary Figure S1), possibly due to genomic rearrangement events such as inversions and intra-chromosomal translocations and discrepancies related to different population sizes being used for mapping in the two species (Jiang et al., 2011). These results can be used to identify candidate genes involved in the flavonoid biosynthesis pathway based on the B. napus “Darmor-Bzh” reference genome (Chalhoub et al., 2014; http://www.genoscope.cns.fr/brassicanapus/) and The Arabidopsis Information Resource (TAIR, http://www.arabidopsis.org/index.jsp).
eQTL Analysis of 18 Genes Involved in Flavonoid Biosynthesis
In an analysis of orthologous regions of eQTLs, we identified 243 copies of 18 genes involved in flavonoid biosynthesis from A. thaliana (37), B. rapa (55), B. oleracea (52), and B. napus (99) (Supplementary Table S4; Figure 3) (Krzywinski et al., 2009), respectively. Seventy-two eQTLs for 18 flavonoid biosynthesis pathway genes were detected and found to be distributed among 15 different linkage groups, with 3 to 5 eQTLs per gene. Each eQTL could explain 4.11–52.70% of the phenotypic variance (Table 3, Figure 2). The results are consistent with sequences present as a single copy in the A. thaliana genome being present as 2–8 copies in B. napus (Cavell et al., 1998). Moreover, four eQTL hotspots were identified on chromosomes A03, A09, and C08, including 28 eQTLs for 12 genes. According to the value of additive effects, the positive alleles of 23 eQTLs for seven genes were derived from the male parent ZY821, whereas the remaining five eQTLs (i.e., qBnTT5-18-4, qBnTT7-3-3, qBnTT7-9-4, qBnTT18-18-5, and qBnTT19-18-5) were derived from the female parent GH06 (Table 3). Furthermore, two eQTL hotspots were located up- and down-stream of the major QTL region (32–36 cM of chromosome A09) for seed coat color, between regions 18–22 cM and 72–76 cM of chromosome A09, respectively. In addition, 22 major eQTLs explaining over 20% of the total phenotypic variation were found to be located on chromosomes A01, A03, A06, A09, C03, and C08 (Figure 2). Their positive alleles were derived from both of the parents.
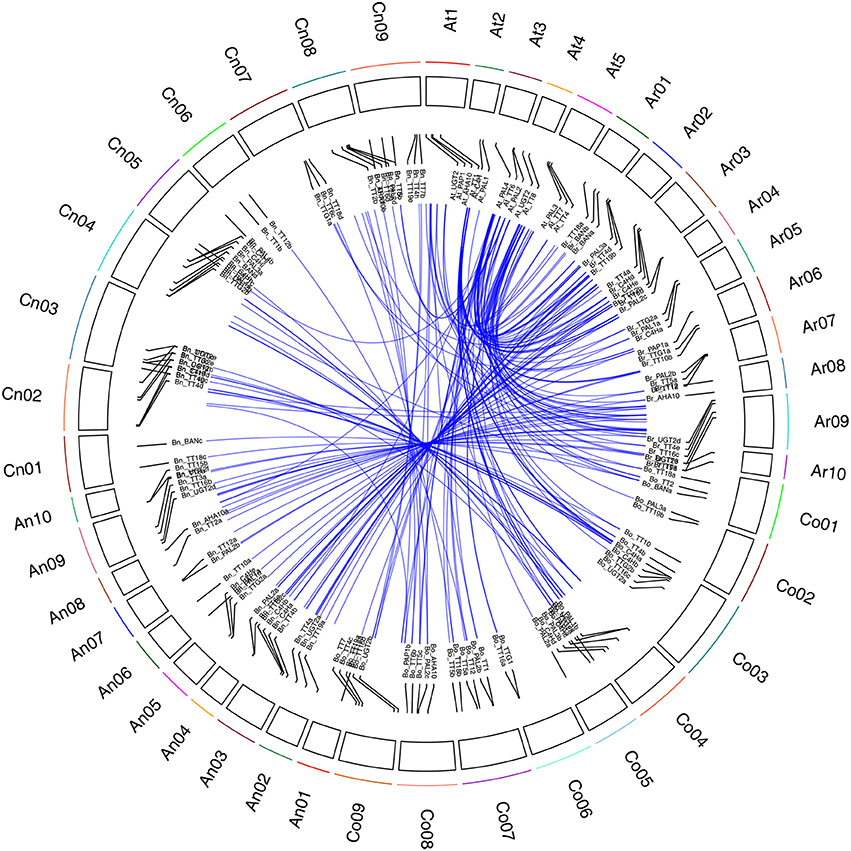
Figure 3. Syntenic relationship of flavonoid biosynthesis genes between A. thaliana and Brassica genomes. Black frame with different colors represents chromosomes of four species. Ar01 ~ Ar10 represent pseudo-chromosomes of the B. rapa genome, Co01 ~ Co09 represent pseudo-chromosomes of the B. oleracea genome, An01 ~ An10 and Cn01 ~ Cn09 represent pseudo-chromosomes of the B. napus genome, and At1 ~ At5 represent chromosomes of the A. thaliana genome. Blue lines represent the relationship between orthologous gene pairs from different species.
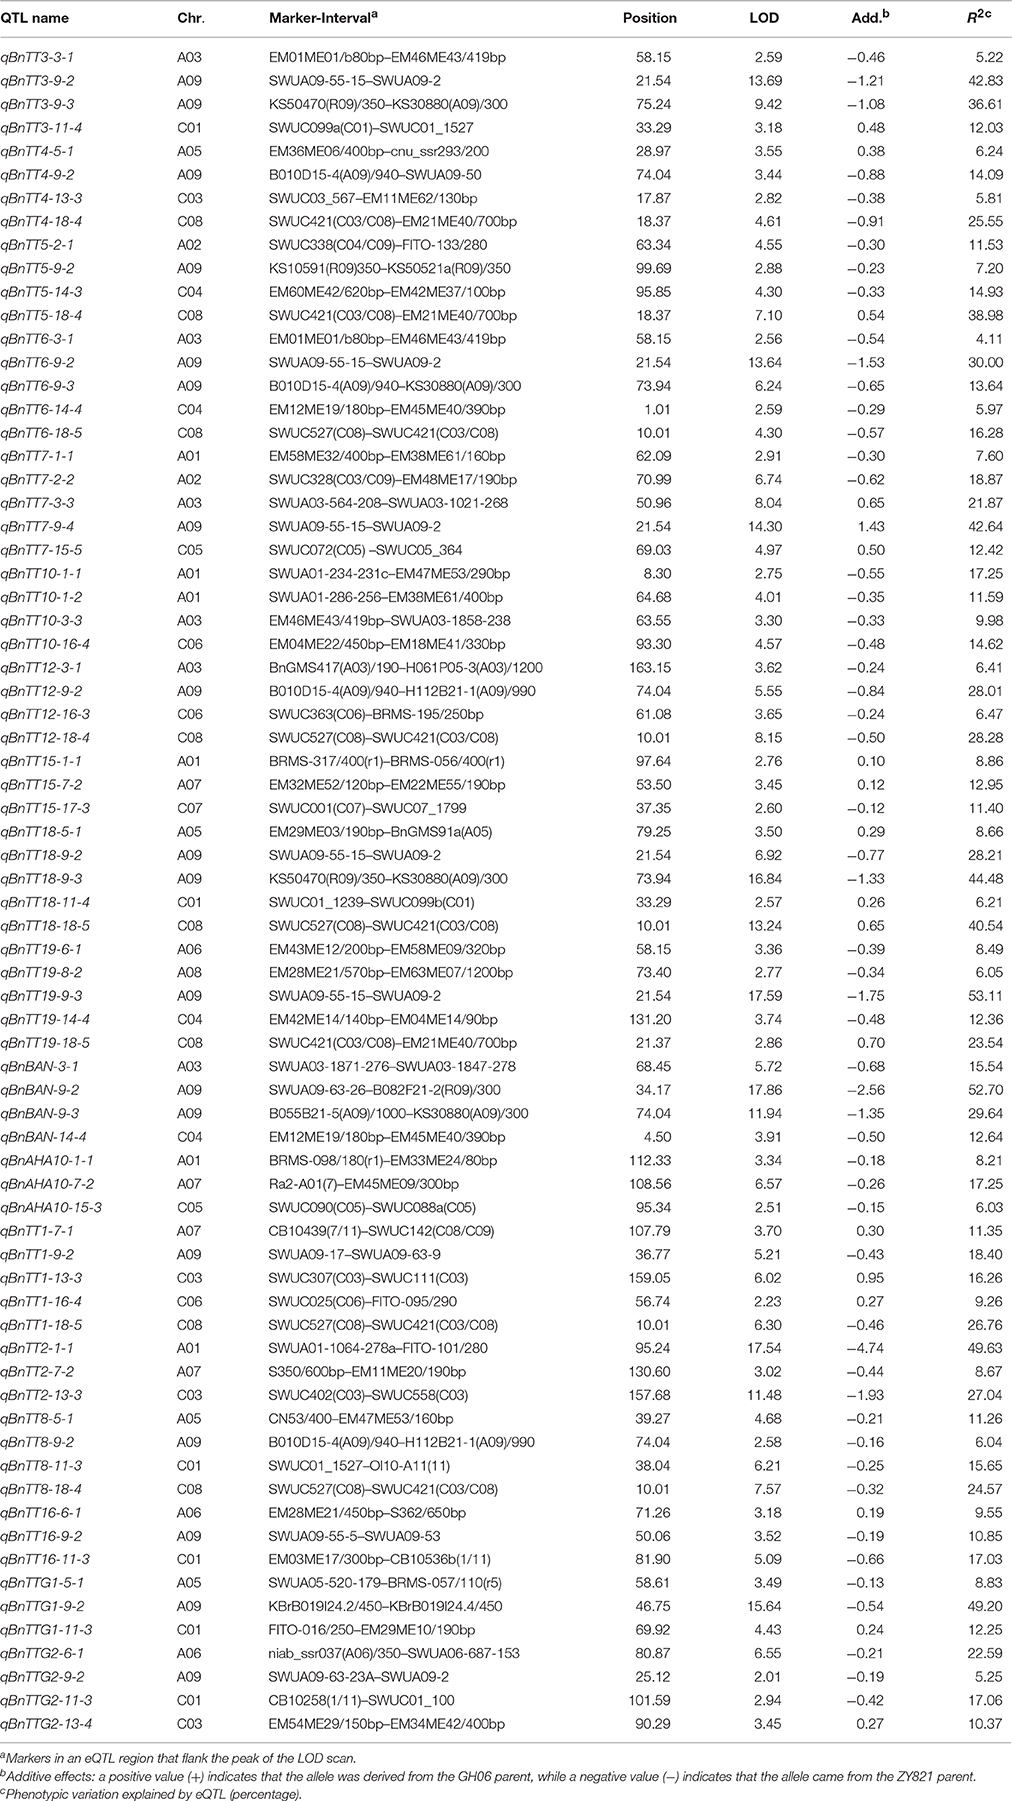
Table 3. eQTLs for flavonoid biosynthetic pathway genes detected from the B. napus RIL population.
Analysis of Flanking Sequences of trans-eQTLs
To determine whether the eQTLs were cis or trans, the chromosomal distribution of all characterized tt genes on B. napus, B. rapa, and B. oleracea were obtained based on BLASTN analysis. We found that only 5 of 18 genes were mapped to a similar chromosomal location as their eQTLs, implying that five eQTLs (i.e., qBnTT1-16-4, qBnTT3-9-2, qBnTT4-13-3, qBnTT5-9-2, and qBnTT18-11-4) were cis-eQTLs, whereas the remaining eQTLs were trans-eQTLs that controlled the expression of target genes at distant locations.
Twenty-eight eQTLs for 12 genes were identified in four eQTL hotspots that almost were trans-eQTLs. We thus assumed that four eQTL hotspots might include important regulators of flavonoid biosynthesis in B. napus. Hence, the 200-kb flanking sequences of core markers of each trans-eQTL in B. napus were extracted and annotated based on the B. napus “Darmor-Bzh” reference genome (http://www.genoscope.cns.fr/brassicanapus/) (Supplementary Table S5). The collinearity of these trans-eQTL flanking sequences among Brassica species was also determined from Brassica Synteny Blocks in the BRAD database (http://brassicadb.org/brad/viewsyntenic.php) (Figure 4). The flanking sequence of the eQTL hotspot on chromosome A03 of B. rapa displayed collinearity with chromosome 4 of A. thaliana and chromosome C06 of A. lyrata (Figure 4A), while the two hotspots on chromosome A09 of B. rapa shared synteny with chromosome C05 of A. lyrata and chromosome 1 of A. thaliana, respectively (Figures 4B,C). In addition, the flanking sequence of the hotspot on chromosome C08 of B. oleracea also showed synteny with chromosome 1 of A. thaliana (Figure 4D). Hence, we can identify the potential candidate genes related to in the trans-eQTL regions by analyzing the syntenic relationships among them and conducting a comparative genomics analysis.
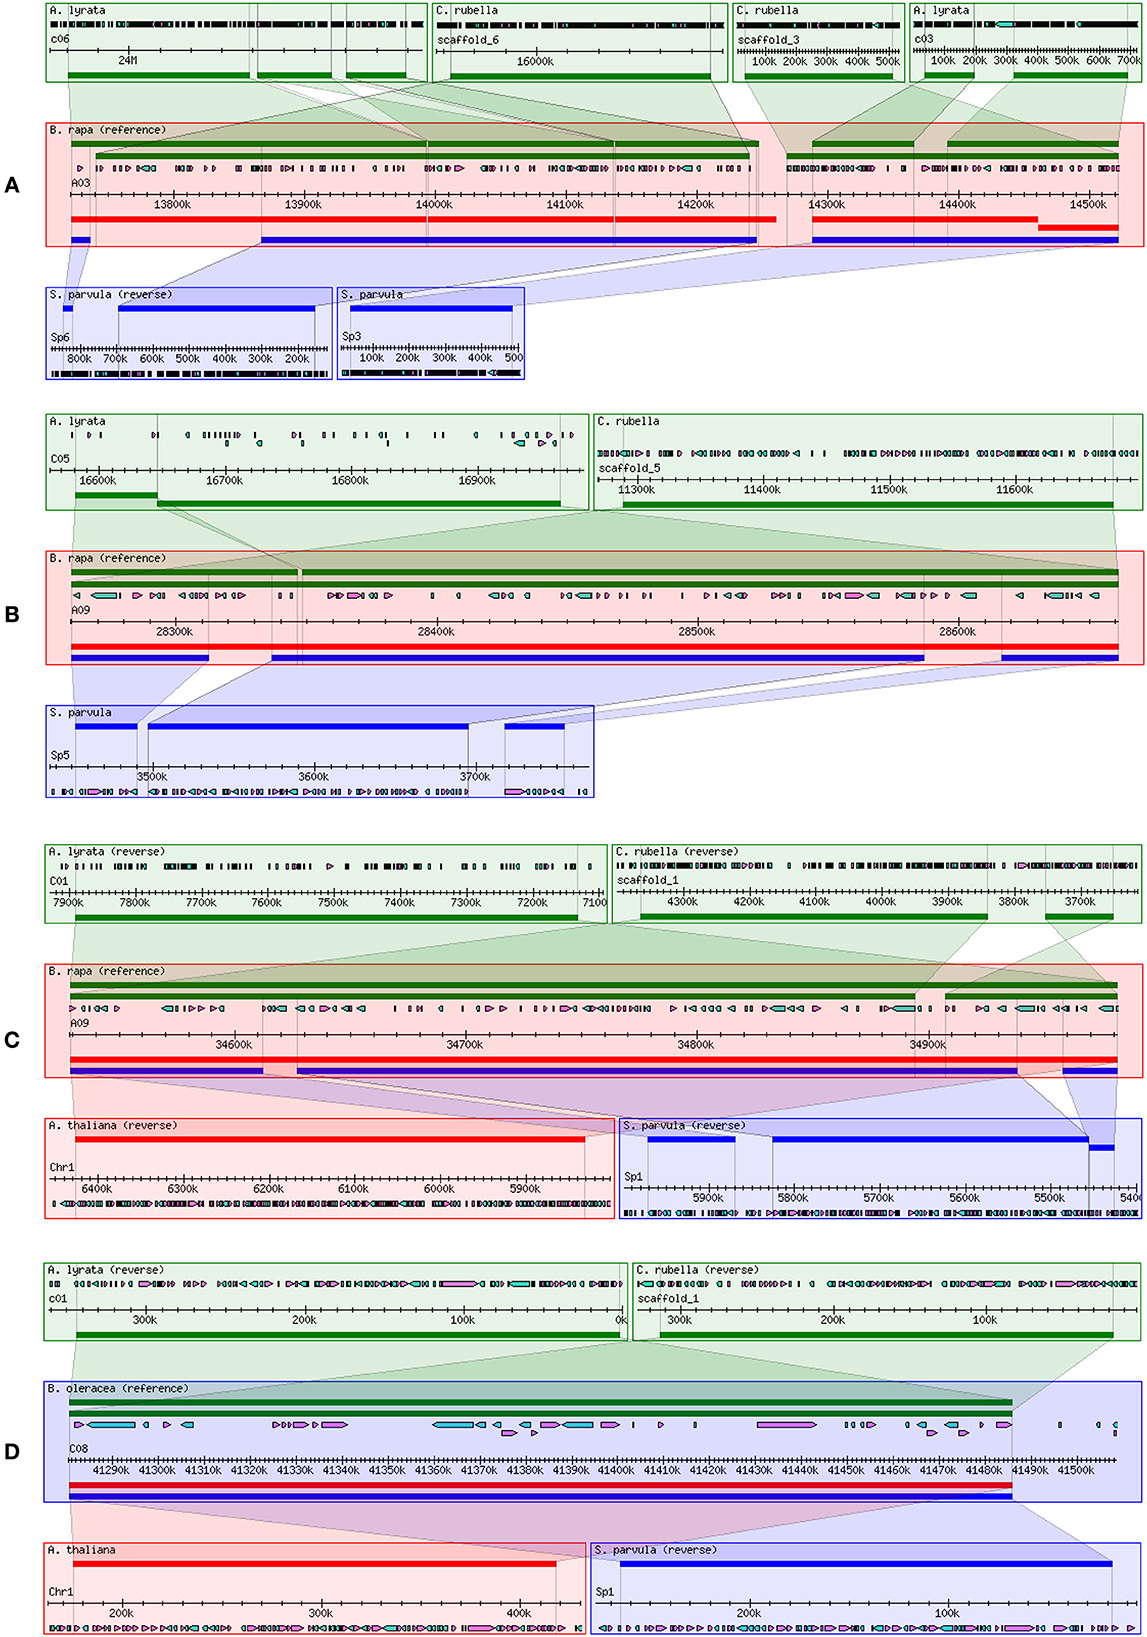
Figure 4. Comparison of collinearity of trans-eQTL flanking sequences between two Brassica species and their relatives. (A) eQTL hotspot on chromosome A03 of B. napus; (B) lower eQTL hotspot on chromosome A09 of B. napus; (C) upper eQTL hotspot on chromosome A09 of B. napus; and (D) eQTL hotspot on chromosome C08 of B. napus. Collinearity was analyzed and visualized using the Brassica Synteny Blocks tool in the BRAD database (http://brassicadb.org/cgi-bin/gbrowse_syn/brassica/).
The candidate genes in the 200-kb of nucleotide sequence flanking the four trans-eQTL hotspots were annotated by BLASTN analysis. Because each hotspot contained 6 to 8 trans-eQTLs (Figure 2), we inferred that the major candidate gene responsible for downstream expression variation was an upstream regulatory gene that encodes a transcription factor. The most interesting hotspot in our study was the lower hotspot on chromosome A09. A total of seven transcription factors were identified in this region (Supplementary Table S5), two of which belong to the flavonoid biosynthesis-related MYB transcription factor family, including MYB51 (BnaA09g44500D, positive regulator of indolic glucosinolate production) and MYB52 (BnaA09g44780D, positive regulator of cell wall thickening). Associated with the trans-eQTL hotspots on chromosomes A03 and C08, and the upper trans-eQTL hotspot on chromosome A09, we identified 5, 1, and 10 transcription factor genes, respectively (Supplementary Table S5). Among these genes, those encoding bZIP25 (BnaA03g18190D, positive regulator of seed maturation), MYC1 (BnaA09g51900D, positive regulator of epidermal cell differentiation), and transcription factors of unknown function could be regarded as candidate genes involved in flavonol biosynthesis.
Discussion
Genetic Map Construction and Alignment
Genetic maps offer a powerful approach for analyzing the structural and functional evolution of crop plants and for detecting QTLs that can be used for marker-assisted breeding programs. Using different populations, many genetic linkage maps have been constructed in B. napus based on different markers (Landry et al., 1991; Ferreira et al., 1994; Foisset et al., 1995; Uzunova et al., 1995; Lombard and Delourme, 2001; Xu et al., 2001; Zhao and Meng, 2003; Liu et al., 2005; Piquemal et al., 2005; Qiu et al., 2006; Fu et al., 2007; Radoev et al., 2008; Cheng et al., 2009; Kim et al., 2009). Moreover, many traits of agronomic importance in B. napus, such as seed coat color, oil content, and seed yield, are quantitative with complex genetic bases. Recently, a high-density linkage map was constructed using the Brassica 60 K Infinium BeadChip Array (Zou et al., 2012; Delourme et al., 2013; Liu et al., 2013; Zhang et al., 2014; Wang et al., 2015). Genome-specific SSR markers have been widely used for genetic mapping, association mapping, comparative mapping, QTL analysis, and marker-assisted selection (Li et al., 2011). Therefore, we constructed a high-density genetic linkage map using four different kinds of markers, and a total 1087 polymorphic loci (464 for SSR, 97 for RAPD, 451 for SRAP, and 75 for IBP) were mapped to 19 linkage groups, covering 2775 cM of the B. napus genome with an average distance between two adjacent markers of 2.55 cM. Furthermore, 184 loci were mapped to chromosome A09 with an average distance between adjacent markers of 0.83 cM, indicating that this approach could be used to identify candidate genes for seed coat color, oil content, and other important agronomic traits on chromosome A09 in B. napus. Although 13 interval gaps (adjacent markers > 15 cM) were present on 10 different linkage groups (Table 3, Figure 2), the high-density genetic linkage map constructed in this research could be helpful for fine-mapping and marker-assisted selection (MAS) of many important traits of oilseed rape.
Additionally, Brassica is an ideal genus for studying genome evolution and diversification, because it includes both diploid (B. rapa, A = 10; B. nigra, B = 8 and B. oleracea, C = 9) and allotetraploid (B. juncea, AB = 18; B. napus, AC = 19 and B. carinata, BC = 17) species. Moreover, Brassica and Arabidopsis diverged from a common ancestor approximately 14–20 million years ago (Yang et al., 1999), and the genome of Brassica species underwent polyploidization, accompanied by gene deletion and rearrangements (Cavell et al., 1998; Lagercrantz, 1998; Ryder et al., 2001; Babula et al., 2003; Lukens et al., 2003). Therefore, many comparative mapping studies have unraveled the extensive genome homology and microsynteny between the A, B, and C genomes of Brassica species and between Brassica species and A. thaliana (Parkin et al., 2005; Jiang et al., 2011; Wang et al., 2011; Yang et al., 2016). Here, we identified a total of 531 pairs of sequence-informative markers and found that these markers mapped on all 19 linkage groups (Figure 2). Moreover, 237/259 published markers were detected and their positions in the linkage map were found to be in good agreement with the aforementioned genetic maps. The linkage map included 196 specific markers that were newly developed from the B. rapa and B. oleracea genome (Supplementary Table S3, Figure 2). In addition, 370 of 531 markers were exactly anchored to the corresponding genomes of Brassica and Arabidopsis through BLASTN analysis, 349 of which were mapped to one locus, 20 to two loci, and 1 to three loci (Supplementary Table S3). Moreover, there was strong collinearity among B. napus, B. rapa, and Arabidopsis, but the markers were sometimes assigned to different genome linkage groups and the relative physical position of markers was inconsistent (Supplementary Table S3, Supplementary Figures S1, S2). There are two possible explanations for these observations. Firstly, the differences of markers may be inaccuracies in allocations of the RIL population, which could disturb the Mendelian segregation and chromosome abnormalities during map construction. Secondly, extensive segmental duplication and rearrangements are known to have occurred during the polyploidization process of Brassica (Teutonico and Osborn, 1994; Parkin et al., 2005; Panjabi et al., 2008; Yang et al., 2016). Therefore, our results provide insight into the differences in genome structure and gene evolution among Brassica species and A. thaliana, and can be used to generate an effective MAS strategy that can be used to develop lines with improved agronomic traits.
Association of Flavonoid Biosynthesis Pathway Genes in B. napus
Flavonoids are secondary metabolites that are extensively distributed in the plant kingdom, with essential roles in protecting plants against UV radiation, drought, and cold stress, and in color formation in fruits and flowers (Winkel-Shirley, 2002). In Arabidopsis thaliana, the flavonoid biosynthesis pathway has been characterized mainly using different tt mutants, which have transparent and colorless testa (seed coats) (Holton and Cornish, 1995; Devic et al., 1999; Wan et al., 2002; Xie et al., 2003; Baudry et al., 2006; Lepiniec et al., 2006; Routaboul et al., 2006; Cheng, 2013; Saito et al., 2013). The present study showed that TT10 and AHA10 were involved in seed color formation of rapeseed, but these genes have yet to be successfully used in rapeseed breeding programs (Fu et al., 2007; Stein et al., 2013; Zhang et al., 2013). The flavonoid biosynthesis pathways of Brassica species are much more complex than those of A. thaliana (Supplementary Figure S3); in addition to consisting of more synthesis-related genes, this pathway is also involved in multi-loci interactions, which have been shown to be involved in the formation of seed coat color in B. napus (Theander et al., 1977; Marles and Gruber, 2004; Akhov et al., 2009; Qu et al., 2013), and dozens of homologous genes in the B. napus flavonoid biosynthesis pathway have been cloned and characterized (Wei et al., 2007; Xu et al., 2007; Ni et al., 2008; Akhov et al., 2009; Auger et al., 2009; Chai et al., 2009; Lu et al., 2009; Chen et al., 2013). Prior to this study, no comprehensive analysis of the flavonoid biosynthesis pathway had been conducted in B. napus. Our previous results showed that the absence of pigment synthesis in the yellow-seeded line of B. napus involves the down-regulation, but not complete inactivation, of several key genes in the flavonoid pathway (Qu et al., 2013). In this study, our correlation analysis showed that the expression levels of any two structural genes (BnTT3, BnTT4, BnTT5, BnTT6, BnTT12, BnTT18, and BnAHA10) and regulatory genes (BnTT1, BnTT8, and BnTTG1) had a significant positive correlation (R2 < 0.01), but a significant negative correlation was observed between BnTT7 and BnTT10 or BnBAN and BnTT19, respectively (Table 1), in accordance with our previous research (Qu et al., 2013). Furthermore, we performed a genome-wide comparative analysis between A. thaliana and Brassica species. The orthologous genes identified in this analysis might be associated with the fact that they have a common evolutionary ancestor (Figure 3). Therefore, our results will be helpful for determining the relationship between and functionalization of these flavonoid biosynthesis genes, and it is necessary to identify the upstream regulatory network that modulates the flavonoid biosynthesis pathway in B. napus.
Studies have shown that eQTLs provide a basis for deciphering the regulatory networks of genes that modulate pathways in different plants (Brem et al., 2002; Schadt et al., 2003; Morley et al., 2004; Civelek and Lusis, 2014). In this study, the expression profile of each gene in the RILs was used as a quantitative trait, and the eQTLs of these genes was detected by QTL mapping using WinQTL Cartographer 2.5 software. In total, 72 eQTLs were detected and distributed on 15 different linkage groups, with 3 to 5 eQTLs per gene (Table 2, Figure 2). Importantly, 28 eQTLs associated with 12 genes in 4 eQTL hotspots were identified and distributed on chromosomes A03, A09, and C08, respectively. Moreover, the positive alleles of 23 eQTLs associated with seven genes were derived from the male parent ZY821 (Table 3), explaining 4.11–52.70% of the phenotypic variance. These results showed that the eQTLs are distributed in clusters on chromosomes, and help to identify the common regulator gene in major eQTL regions. Based on BLASTN analysis, however, most of the eQTLs were found to be trans-eQTLs, controlling the expression of distant target genes. Moreover, 6–8 trans-eQTLs were detected on the four hotspots (Table 3, Figure 2), suggesting that these trans-eQTLs had essential roles in the flavonoid biosynthesis pathway. Based on the B. napus reference genome, some transcription factors related to flavonoid biosynthesis were identified in the eQTL hotspot regions (Supplementary Table S5) associated with members of the R2R3-type MYB gene family (e.g., MYB51 and MYB52), which act as regulators of different pathways (Chen et al., 2006). In addition, one basic leucine zipper (bZIP) transcription factor (bZIP25) that interacted with bZIP10 and ABI3 to regulate their seed-specific expression during seed maturation (Lara et al., 2003), and one basic Helix-Loop-Helix (bHLH) transcription factor, MYC1, that controlled flavonoid biosynthesis and epidermal cell fate (Hichri et al., 2010; Pesch et al., 2013), were also identified. Findings in A. thaliana have confirmed that the MYB and bHLH proteins were involved in regulating the flavonoid biosynthesis pathways (Baudry et al., 2006; Dubos et al., 2008; Kitamura et al., 2010; Stracke et al., 2010). Moreover, MYB transcription factors interact with bHLH proteins to regulate flavonoid biosynthesis in plant species (Koes et al., 2005; Quattrocchio et al., 2006). In addition, TT2 (R2R3-MYB), TT8 (bHLH), and TTG1 (WDR) modulate proteins, including DFR, LDOX, BAN, and TT12, thereby affecting PA production, and form a complex called MBW (MYB-bHLH-WD40) in the flavonoid pathway (Baudry et al., 2004, 2006; Lepiniec et al., 2006). Previous studies have proposed TTG1, TT8, TT10, TT12, and AHA10 as candidate genes involved in seed coat color formation in Brassica species (Xie et al., 2003; Fu et al., 2007; Chai et al., 2009; Li et al., 2012; Stein et al., 2013; Zhang et al., 2013; Padmaja et al., 2014). Therefore, we predict that the candidate genes bZIP25, MYC1, and MYB51 are involved in the flavonoid biosynthesis pathway through different regulator networks in rapeseed (Figure 5). These results provide useful information for deciphering the upstream regulatory network of the flavonoid gene families and for characterizing transcription factors of unknown function. The genes identified in our study as being involved in flavonol biosynthesis provide insight into the molecular and biochemical mechanism underlying seed coat development in Brassicaceae, and might ultimately elucidate the regulatory network underlying seed coat color formation.
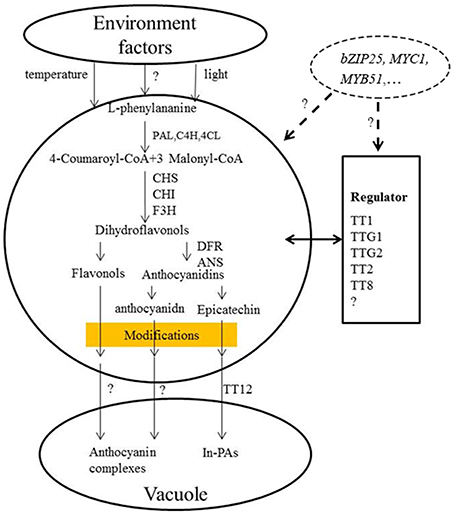
Figure 5. Proposed model for the flavonoid biosynthesis pathway underlying seed coat color in B. napus. BnPAL, l-phenylalanine ammonialyase; BnC4H, cinnamate 4-hydroxylase; Bn4CL, 4-coumarate:CoA ligase; BnCHS, chalcone synthase; BnCHI, chalcone isomerase; BnF3H, flavanone-hydroxylase; BnDFR, dihydroflavonol reductase; BnANS, anthocyanidin synthase; BnANR, anthocyanidin reductase (Qu et al., 2013).
Author Contributions
CQ, FF, and KL conceived of the study and drafted the manuscript. HZ and KZ performed the data mining and bioinformatics analysis. JY and LL carried out gene expression analysis and map construction. RW and XX acquired the reagents and conducted the field experiments. KL and JL interpreted the data and revised the manuscript. All authors read and approved of the final manuscript.
Conflict of Interest Statement
The authors declare that the research was conducted in the absence of any commercial or financial relationships that could be construed as a potential conflict of interest.
Acknowledgments
This work was supported by The Utilization of Heterosis and Selection of Strong Advantage of Hybrid (2016YFD0101300), the 973 Project (2015CB150201), the National Science Foundation of China (31401412, U1302266, 31571701), Projects in the National Science and Technology Pillar Program (2013BAD01B03-12), the 111 Project (B12006), Fundamental Research Funds for the Central Universities (XDJK2016B030), and the China Scholarship Council (CSC).
Supplementary Material
The Supplementary Material for this article can be found online at: http://journal.frontiersin.org/article/10.3389/fpls.2016.01691/full#supplementary-material
References
Abrahams, S., Lee, E., Walker, A. R., Tanner, G. J., Larkin, P. J., and Ashton, A. R. (2003). The Arabidopsis TDS4 gene encodes leucoanthocyanidin dioxygenase (LDOX) and is essential for proanthocyanidin synthesis and vacuole development. Plant J. 35, 624–636. doi: 10.1046/j.1365-313X.2003.01834.x
Akhov, L. L., Ashe, P. P., Tan, Y. T. Y., Datla, R. D. R., and Selvaraj, G. S. G. (2009). Proanthocyanidin biosynthesis in the seed coat of yellow-seeded, canola quality Brassica napus YN01-429 is constrained at the committed step catalyzed by dihydroflavonol 4-reductase. Botany 87, 616–625. doi: 10.1139/B09-036
Auger, B., Baron, C., Lucas, M. O., Vautrin, S., Bergès, H., Chalhoub, B., et al. (2009). Brassica orthologs from BANYULS belong to a small multigene family, which is involved in procyanidin accumulation in the seed. Planta 230, 1167–1183. doi: 10.1007/s00425-009-1017-0
Babula, D., Kaczmarek, M., Barakat, A., Delseny, M., Quiros, C. F., and Sadowski, J. (2003). Chromosomal mapping of Brassica oleracea based on ESTs from Arabidopsis thaliana: complexity of the comparative map. Mol. Genet. Genom. 268, 656–665. doi: 10.1007/s00438-002-0782-2
Badani, A. G., Snowdon, R. G., Wittkop, B., Lipsa, F. D., Baetzel, R., Horn, R., et al. (2006). Colocalization of a partially dominant gene for yellow seed colour with a major QTL influencing acid detergent fibre (ADF) content in different crosses of oilseed rape (Brassica napus). Genome 49, 1499–1509. doi: 10.1139/g06-091
Basnet, R. K., Del Carpio, D. P., Xiao, D., Bucher, J., Jin, M., Boyle, K., et al. (2016). A systems genetics approach identifies gene regulatory networks associated with fatty acid composition in Brassica rapa seed. Plant Physiol. 170, 568–585. doi: 10.1104/pp.15.00853
Basnet, R. K., Duwal, A., Tiwari, D. N., Xiao, D., Monakhos, S., Bucher, J., et al. (2015). Quantitative trait locus analysis of seed germination and seedling vigor in Brassica rapa reveals QTL hotspots and epistatic interactions. Front. Plant Sci. 6:1032. doi: 10.3389/fpls.2015.01032
Baudry, A., Caboche, M., and Lepiniec, L. (2006). TT8 controls its own expression in a feedback regulation involving TTG1 and homologous MYB and bHLH factors, allowing a strong and cell specific accumulation of flavonoids in Arabidopsis thaliana. Plant J. 46, 768–779. doi: 10.1111/j.1365-313X.2006.02733.x
Baudry, A., Heim, M. A., Dubreucq, B., Caboche, M., Weisshaar, B., and Lepiniec, L. (2004). TT2, TT8, and TTG1 synergistically specify the expression of BANYULS and proanthocyanidin biosynthesis in Arabidopsis thaliana. Plant J. 39, 366–380. doi: 10.1111/j.1365-313X.2004.02138.x
Bharti, A. K., and Khurana, J. P. (2003). Molecular characterization of transparent testa (tt) mutants of Arabidopsis thaliana (ecotype Estland) impaired in flavonoid biosynthetic pathway. Plant Sci. 165, 1321–1332. doi: 10.1016/S0168-9452(03)00344-3
Brem, R. B., Yvert, G., Clinton, R., and Kruglyak, L. (2002). Genetic dissection of transcriptional regulation in budding yeast. Science 296, 752–755. doi: 10.1126/science.1069516
Burbulis, I. E., and Winkel-Shirley, B. (1999). Interactions among enzymes of the Arabidopsis flavonoid biosynthetic pathway. Proc. Natl. Acad. Sci. U.S.A. 96, 12929–12934. doi: 10.1073/pnas.96.22.12929
Burr, F. A., Burr, B., Scheffler, B. E., Blewitt, M., Wienand, U., and Matz, E. C. (1996). The maize repressor-like gene intensifier1 shares homology with the r1/b1 multigene family of transcription factors and exhibits missplicing. Plant Cell 8, 1249–1259. doi: 10.1105/tpc.8.8.1249
Cavell, A. C., Lydiate, D. J., Parkin, I. A., Dean, C., and Trick, M. (1998). Collinearity between a 30-centimorgan segment of Arabidopsis thaliana chromosome 4 and duplicated regions within the Brassica napus genome. Genome 41, 62–69. doi: 10.1139/gen-41-1-62
Chai, Y. R., Lei, B., Huang, H. L., Li, J. N., Yin, J. M., Tang, Z. L., et al. (2009). TRANSPARENT TESTA12 genes from Brassica napus and parental species: cloning, evolution, and differential involvement in yellow seed trait. Mol. Genet. Genom. 281, 109–123. doi: 10.1007/s00438-008-0399-1
Chalhoub, B., Denoeud, F., Liu, S., Parkin, I. A., Tang, H., Wang, X., et al. (2014). Early allopolyploid evolution in the post-Neolithic Brassica napus oilseed genome. Science 345, 950–953. doi: 10.1126/science.1253435
Chen, G., Deng, W., Peng, F., Truksa, M., Singer, S., Snyder, C. L., et al. (2013). Brassica napus TT16 homologs with different genomic origins and expression levels encode proteins that regulate a broad range of endothelium-associated genes at the transcriptional level. Plant J. 74, 663–677. doi: 10.1111/tpj.12151
Chen, Y., Xiaoyuan, Y., Kun, H., Meihua, L., Jigang, L., Zhaofeng, G., et al. (2006). The MYB transcription factor superfamily of Arabidopsis: expression analysis and phylogenetic comparison with the rice MYB family. Plant Mol. Biol. 60, 107–124. doi: 10.1007/s11103-005-2910-y
Cheng, F., Wu, J., and Wang, X. (2014). Genome triplication drove the diversification of Brassica plants. Horticul. Res. 1:14024. doi: 10.1038/hortres.2014.24
Cheng, X., Xu, J., Xia, S., Gu, J., Yang, Y., Fu, J., et al. (2009). Development and genetic mapping of microsatellite markers from genome survey sequences in Brassica napus. Theor. Appl. Genet. 118, 1121–1131. doi: 10.1007/s00122-009-0967-8
Cheng, Y. (2013). Molecular mechanism of manipulating seed coat coloration in oilseed Brassica species. J. Appl. Genet. 54, 135–145. doi: 10.1007/s13353-012-0132-y
Civelek, M., and Lusis, A. J. (2014). Systems genetics approaches to understand complex traits. Nat. Rev. Genet. 15, 34–48. doi: 10.1038/nrg3575
Del Carpio, D. P., Basnet, R. K., Arends, D., Lin, K., De Vos, R. C., Muth, D., et al. (2014). Regulatory network of secondary metabolism in Brassica rapa: insight into the glucosinolate pathway. PLoS ONE 9:e107123. doi: 10.1371/journal.pone.0107123
Delourme, R., Falentin, C., Fomeju, B. F., Boillot, M., Lassalle, G., André, I., et al. (2013). High-density SNP-based genetic map development and linkage disequilibrium assessment in Brassica napus L. BMC Genomics 14:120. doi: 10.1186/1471-2164-14-120
Deutsch, S., Lyle, R., Dermitzakis, E. T., Attar, H., Subrahmanyan, L., Gehrig, C., et al. (2005). Gene expression variation and expression quantitative trait mapping of human chromosome 21 genes. Hum. Mol. Genet. 14, 3741–3749. doi: 10.1093/hmg/ddi404
Devic, M., Guilleminot, J., Debeaujon, I., Bechtold, N., Bensaude, E., Koornneef, M., et al. (1999). The BANYULS gene encodes a DFR-like protein and is a marker of early seed coat development. Plant J. 19, 387–398. doi: 10.1046/j.1365-313X.1999.00529.x
Deynze, A. V., Beversdorf, W., and Pauls, K. (1993). Temperature effects on seed color in black-and yellow-seeded rapeseed. Can. J. Plant Sci. 73, 383–387. doi: 10.4141/cjps93-057
Doss, S., Schadt, E. E., Drake, T. A., and Lusis, A. J. (2005). Cis-acting expression quantitative trait loci in mice. Genome Res. 15, 681–691. doi: 10.1101/gr.3216905
Dubos, C., Le Gourrierec, J., Baudry, A., Huep, G., Lanet, E., Debeaujon, I., et al. (2008). MYBL2 is a new regulator of flavonoid biosynthesis in Arabidopsis thaliana. Plant J. 55, 940–953. doi: 10.1111/j.1365-313X.2008.03564.x
Ferreira, M. E., Williams, P. H., and Osborn, T. C. (1994). RFLP mapping of Brassica napus using doubled haploid lines. Theor. Appl. Genet. 89, 615–621. doi: 10.1007/BF00222456
Foisset, N., Delourme, R., Barret, P., and Renard, M. (1995). Molecular tagging of the dwarf BREIZH (Bzh) gene in Brassica napus. Theor. Appl. Genet. 91, 756–761. doi: 10.1007/BF00220955
Fu, F. Y., Liu, L. Z., Chai, Y. R., Chen, L., Yang, T., Jin, M. Y., et al. (2007). Localization of QTLs for seed color using recombinant inbred lines of Brassica napus in different environments. Genome 50, 840–854. doi: 10.1139/G07-068
Gachon, C. M., Langlois-Meurinne, M., Henry, Y., and Saindrenan, P. (2005). Transcriptional co-regulation of secondary metabolism enzymes in Arabidopsis: functional and evolutionary implications. Plant Mol. Biol. 58, 229–245. doi: 10.1007/s11103-005-5346-5
Hichri, I., Heppel, S. C., Pillet, J., Léon, C., Czemmel, S., Delrot, S., et al. (2010). The basic helix-loop-helix transcription factor MYC1 is involved in the regulation of the flavonoid biosynthesis pathway in grapevine. Mol. Plant 3, 509–523. doi: 10.1093/mp/ssp118
Holton, T. A., and Cornish, E. C. (1995). Genetics and biochemistry of anthocyanin biosynthesis. Plant Cell 7, 1071–1083. doi: 10.1105/tpc.7.7.1071
Hubner, N., Yagil, C., and Yagil, Y. (2006). Novel integrative approaches to the identification of candidate genes in hypertension. Hypertension 47, 1–5. doi: 10.1161/01.HYP.0000197951.82190.c4
Jansen, R. C., and Nap, J.-P. (2001). Genetical genomics: the added value from segregation. Trends Genet. 17, 388–391. doi: 10.1016/S0168-9525(01)02310-1
Jiang, C., Ramchiary, N., Ma, Y., Jin, M., Feng, J., Li, R., et al. (2011). Structural and functional comparative mapping between the Brassica A genomes in allotetraploid Brassica napus and diploid Brassica rapa. Theor. Appl. Genet. 123, 927–941. doi: 10.1007/s00122-011-1637-1
Jin, H., Cominelli, E., Bailey, P., Parr, A., Mehrtens, F., Jones, J., et al. (2000). Transcriptional repression by AtMYB4 controls production of UV-protecting sunscreens in Arabidopsis. EMBO J. 19, 6150–6161. doi: 10.1093/emboj/19.22.6150
Jordan, M. C., Somers, D. J., and Banks, T. W. (2007). Identifying regions of the wheat genome controlling seed development by mapping expression quantitative trait loci. Plant Biotechnol. J. 5, 442–453. doi: 10.1111/j.1467-7652.2007.00253.x
Kasai, A., Kasai, K., Yumoto, S., and Senda, M. (2007). Structural features of GmIRCHS, candidate of the I gene inhibiting seed coat pigmentation in soybean: implications for inducing endogenous RNA silencing of chalcone synthase genes. Plant Mol. Biol. 64, 467–479. doi: 10.1007/s11103-007-9169-4
Kim, H. R., Choi, S. R., Bae, J., Hong, C. P., Lee, S. Y., Hossain, M. J., et al. (2009). Sequenced BAC anchored reference genetic map that reconciles the ten individual chromosomes of Brassica rapa. BMC Genomics 10:432. doi: 10.1186/1471-2164-10-432
Kimber, D., and Mcgregor, D. I. (eds.). (1995). “The species and their origin, cultivation and world production,” in Brassica Oilseeds-Production and Utilization (Oxon, UK: CAB International), 1–8.
Kitamura, S., Matsuda, F., Tohge, T., Yonekura-Sakakibara, K., Yamazaki, M., Saito, K., et al. (2010). Metabolic profiling and cytological analysis of proanthocyanidins in immature seeds of Arabidopsis thaliana flavonoid accumulation mutants. Plant J. 62, 549–559. doi: 10.1111/j.1365-313X.2010.04174.x
Koes, R., Verweij, W., and Quattrocchio, F. (2005). Flavonoids: a colorful model for the regulation and evolution of biochemical pathways. Trends Plant Sci. 10, 236–242. doi: 10.1016/j.tplants.2005.03.002
Kosambi, D. (1944). The estimation of map distances from recombination values. Ann. Eugen. 12, 172–175. doi: 10.1111/j.1469-1809.1943.tb02321.x
Krzywinski, M., Schein, J., Birol, I., Connors, J., Gascoyne, R., Horsman, D., et al. (2009). Circos: an information aesthetic for comparative genomics. Genome Res. 19, 1639–1645. doi: 10.1101/gr.092759.109
Lagercrantz, U. (1998). Comparative mapping between Arabidopsis thaliana and Brassica nigra indicates that Brassica genomes have evolved through extensive genome replication accompanied by chromosome fusions and frequent rearrangements. Genetics 150, 1217.
Lander, E. S., and Botstein, D. (1989). Mapping Mendelian factors underlying quantitative traits using RFLP linkage maps. Genetics 121, 185–199.
Landry, B. S., Hubert, N., Etoh, T., Harada, J. J., and Lincoln, S. E. (1991). A genetic map for Brassica napus based on restriction fragment length polymorphisms detected with expressed DNA sequences. Genome 34, 543–552. doi: 10.1139/g91-084
Lara, P., Oñate-Sánchez, L., Abraham, Z., Ferrándiz, C., Díaz, I., Carbonero, P., et al. (2003). Synergistic activation of seed storage protein gene expression in Arabidopsis by ABI3 and Two bZIPs related to OPAQUE2. J. Biol. Chem. 278, 21003–21011. doi: 10.1074/jbc.M210538200
Lepiniec, L., Debeaujon, I., Routaboul, J. M., Baudry, A., Pourcel, L., Nesi, N., et al. (2006). Genetics and biochemistry of seed flavonoids. Annu. Rev. Plant Biol. 57, 405–430. doi: 10.1146/annurev.arplant.57.032905.105252
Li, H., Chen, X., Yang, Y., Xu, J., Gu, J., Fu, J., et al. (2011). Development and genetic mapping of microsatellite markers from whole genome shotgun sequences in Brassica oleracea. Mol. Breed. 28, 585–596. doi: 10.1007/s11032-010-9509-y
Li, X., Chen, L., Hong, M., Zhang, Y., Zu, F., Wen, J., et al. (2012). A large insertion in bHLH transcription factor BrTT8 resulting in yellow seed coat in Brassica rapa. PLoS ONE 7:e44145. doi: 10.1371/journal.pone.0044145
Liu, L., Qu, C., Wittkop, B., Yi, B., Xiao, Y., He, Y., et al. (2013). A high-density SNP map for accurate mapping of seed fibre QTL in Brassica napus L. PLoS ONE 8:e83052. doi: 10.1371/journal.pone.0083052
Liu, Z. W., Fu, T. D., Tu, J. X., and Chen, B. Y. (2005). Inheritance of seed colour and identification of RAPD and AFLP markers linked to the seed colour gene in rapeseed (Brassica napus L.). Theor. Appl. Genet.. 110, 303–310. doi: 10.1007/s00122-004-1835-1
Liu, Z. W., Fu, T. D., Wang, Y., Tu, J. X., Chen, B. Y., Zhou, Y. M., et al. (2006). Development of SCAR and CAPS markers for a partially dominant yellow seed coat gene in Brassica napus L. Euphytica 149, 381–385. doi: 10.1007/s10681-006-9084-9
Lombard, V., and Delourme, R. (2001). A consensus linkage map for rapeseed (Brassica napus L.): construction and integration of three individual maps from DH populations. Theor. Appl. Genet. 103, 491–507. doi: 10.1007/s001220100560
Lu, J., Li, J., Lei, B., Wang, S., and Chai, Y. (2009). Molecular cloning and characterization of two Brassica napus TTG1 genes reveal Genus-Specific nucleotide preference, extreme protein-level conservation and fast divergence of organ-specificity. Genes Genom. 31, 129–142. doi: 10.1007/BF03191146
Lukens, L., Zou, F., Lydiate, D., Parkin, I., and Osborn, T. (2003). Comparison of a Brassica oleracea genetic map with the genome of Arabidopsis thaliana. Genetics 164, 359.
Marles, M., and Gruber, M. Y. (2004). Histochemical characterisation of unextractable seed coat pigments and quantification of extractable lignin in the Brassicaceae. J. Sci. Food Agric. 84, 251–262. doi: 10.1002/jsfa.1621
Mccouch, S., Cho, Y., Yano, M., Paul, E., Blinstrub, M., Morishima, H., et al. (1997). Report on QTL nomenclature. Rice Genet. Newsl. 14, 111–131.
Meng, J., Shi, S., Gan, L., Li, Z., and Qu, X. (1998). The production of yellow-seeded Brassica napus (AACC) through crossing interspecific hybrids of B. campestris (AA) and B. carinata (BBCC) with B. napus. Euphytica 103, 329–333. doi: 10.1023/A:1018646223643
Morley, M., Molony, C. M., Weber, T. M., Devlin, J. L., Ewens, K. G., Spielman, R. S., et al. (2004). Genetic analysis of genome-wide variation in human gene expression. Nature 430, 743–747. doi: 10.1038/nature02797
Ni, Y., Jiang, H., Lei, B., Li, J., and Chai, Y. (2008). Molecular cloning, characterization and expression of two rapeseed (Brassica napus L.) cDNAs orthologous to Arabidopsis thaliana phenylalanine ammonia-lyase 1. Euphytica 159, 1–16. doi: 10.1007/s10681-007-9448-9
Olsson, G. (1960). Species crosses within the genus Brassica. I. Artificial Brassica juncea Coss. Hereditas 46, 171–223. doi: 10.1111/j.1601-5223.1960.tb03082.x
Padmaja, L. K., Agarwal, P., Gupta, V., Mukhopadhyay, A., Sodhi, Y. S., Pental, D., et al. (2014). Natural mutations in two homoeologous TT8 genes control yellow seed coat trait in allotetraploid Brassica juncea (AABB). Theor. Appl. Genet. 127, 339–347. doi: 10.1007/s00122-013-2222-6
Panjabi, P., Jagannath, A., Bisht, N. C., Padmaja, K. L., Sharma, S., Gupta, V., et al. (2008). Comparative mapping of Brassica juncea and Arabidopsis thaliana using Intron Polymorphism (IP) markers: homoeologous relationships, diversification and evolution of the A, B and C Brassica genomes. BMC Genomics 9:113. doi: 10.1186/1471-2164-9-113
Parkin, I. P., Gulden, S. M., Sharpe, A. G., Lukens, L., Trick, M., Osborn, T. C., et al. (2005). Segmental structure of the Brassica napus genome based on comparative analysis with Arabidopsis thaliana. Genetics 171, 765–781. doi: 10.1534/genetics.105.042093
Pelletier, M. K., and Shirley, B. W. (1996). Analysis of flavanone 3-hydroxylase in Arabidopsis seedlings (Coordinate regulation with chalcone synthase and chalcone isomerase). Plant Physiol. 111, 339–345. doi: 10.1104/pp.111.1.339
Pesch, M., Schultheiss, I., Digiuni, S., Uhrig, J. F., and Hülskamp, M. (2013). Mutual control of intracellular localisation of the patterning proteins AtMYC1, GL1 and TRY/CPC in Arabidopsis. Development 140, 3456–3467. doi: 10.1242/dev.094698
Piquemal, J., Cinquin, E., Couton, F., Rondeau, C., Seignoret, E., Doucet, I., et al. (2005). Construction of an oilseed rape (Brassica napus L.) genetic map with SSR markers. Theor. Appl. Genet. 111, 1514–1523. doi: 10.1007/s00122-005-0080-6
Potokina, E., Druka, A., Luo, Z., Wise, R., Waugh, R., and Kearsey, M. (2008). Gene expression quantitative trait locus analysis of 16 000 barley genes reveals a complex pattern of genome-wide transcriptional regulation. Plant J. 53, 90–101. doi: 10.1111/j.1365-313X.2007.03315.x
Qiu, D., Morgan, C., Shi, J., Long, Y., Liu, J., Li, R., et al. (2006). A comparative linkage map of oilseed rape and its use for QTL analysis of seed oil and erucic acid content. Theor. Appl. Genet. 114, 67–80. doi: 10.1007/s00122-006-0411-2
Qu, C., Fu, F., Lu, K., Zhang, K., Wang, R., Xu, X., et al. (2013). Differential accumulation of phenolic compounds and expression of related genes in black-and yellow-seeded Brassica napus. J. Exp. Bot. 64, 2885–2898. doi: 10.1093/jxb/ert148
Quattrocchio, F., Verweij, W., Kroon, A., Spelt, C., Mol, J., and Koes, R. (2006). PH4 of Petunia is an R2R3 MYB protein that activates vacuolar acidification through interactions with basic-helix-loop-helix transcription factors of the anthocyanin pathway. Plant Cell 18, 1274–1291. doi: 10.1105/tpc.105.034041
Radoev, M., Becker, H. C., and Ecke, W. (2008). Genetic analysis of heterosis for yield and yield components in rapeseed (Brassica napus L.) by QTL mapping. Genetics 179, 1547–1558. doi: 10.1534/genetics.108.089680
Rahman, M. (2001). Production of yellow-seeded Brassica napus through interspecific crosses. Plant Breed. 120, 463–472. doi: 10.1046/j.1439-0523.2001.00640.x
Rahman, M., Li, G., Schroeder, D., and Mcvetty, P. B. E. (2010). Inheritance of seed coat color genes in Brassica napus (L.) and tagging the genes using SRAP, SCAR and SNP molecular markers. Mol. Breed. 26, 439–453. doi: 10.1007/s11032-009-9384-6
Routaboul, J. M., Kerhoas, L., Debeaujon, I., Pourcel, L., Caboche, M., Einhorn, J., et al. (2006). Flavonoid diversity and biosynthesis in seed of Arabidopsis thaliana. Planta 224, 96–107. doi: 10.1007/s00425-005-0197-5
Ryder, C. D., Smith, L. B., Teakle, G. R., and King, G. J. (2001). Contrasting genome organisation: two regions of the Brassica oleracea genome compared with collinear regions of the Arabidopsis thaliana genome. Genome 44, 808–817. doi: 10.1139/gen-44-5-808
Saito, K., Yonekura-Sakakibara, K., Nakabayashi, R., Higashi, Y., Yamazaki, M., Tohge, T., et al. (2013). The flavonoid biosynthetic pathway in Arabidopsis: Structural and genetic diversity. Plant Physiol. Biochem. 72, 21–34. doi: 10.1016/j.plaphy.2013.02.001
Schadt, E. E., Monks, S. A., Drake, T. A., Lusis, A. J., Che, N., Colinayo, V., et al. (2003). Genetics of gene expression surveyed in maize, mouse and man. Nature 422, 297–302. doi: 10.1038/nature01434
Schoenbohm, C., Martens, S., Eder, C., Forkmann, G., and Weisshaar, B. (2000). Identification of the Arabidopsis thaliana flavonoid 3′-hydroxylase gene and functional expression of the encoded P450 enzyme. Biol. Chem. 381, 749–753. doi: 10.1515/BC.2000.095
Shi, C., Uzarowska, A., Ouzunova, M., Landbeck, M., Wenzel, G., and Lübberstedt, T. (2007). Identification of candidate genes associated with cell wall digestibility and eQTL (expression quantitative trait loci) analysis in a Flint × Flint maize recombinant inbred line population. BMC Genomics 8:22. doi: 10.1186/1471-2164-8-22
Somers, D. J., Rakow, G., Prabhu, V. K., and Friesen, K. R. D. (2001). Identification of a major gene and RAPD markers for yellow seed coat colour in Brassica napus. Genome 44, 1077–1082. doi: 10.1139/gen-44-6-1077
Stein, A., Wittkop, B., Liu, L., Obermeier, C., Friedt, W., and Snowdon, R. J. (2013). Dissection of a major QTL for seed colour and fibre content in Brassica napus reveals colocalization with candidate genes for phenylpropanoid biosynthesis and flavonoid deposition. Plant Breed. 132, 382–389. doi: 10.1111/pbr.12073
Stracke, R., Jahns, O., Keck, M., Tohge, T., Niehaus, K., Fernie, A. R., et al. (2010). Analysis of PRODUCTION OF FLAVONOL GLYCOSIDES-dependent flavonol glycoside accumulation in Arabidopsis thaliana plants reveals MYB11-, MYB12- and MYB111-independent flavonol glycoside accumulation. New Phytol. 188, 985–1000. doi: 10.1111/j.1469-8137.2010.03421.x
Tang, Z., Li, J., Zhang, X., Chen, L., and Wang, R. (1997). Genetic variation of yellow-seeded rapeseed lines (Brassica napus L.) from different genetic sources. Plant Breed. 116, 471–474. doi: 10.1111/j.1439-0523.1997.tb01033.x
Teutonico, R. A., and Osborn, T. C. (1994). Mapping of RFLP and qualitative trait loci in Brassica rapa and comparison to the linkage maps of B. napus, B. oleracea, and Arabidopsis thaliana. Theor. Appl. Genet. 89, 885–894. doi: 10.1007/bf00224514
Theander, O., Aman, P., Miksche, G. E., and Yasuda, S. (1977). Carbohydrates, polyphenols, and lignin in seed hulls of different colors from turnip rapeseed. J. Agric. Food Chem. 25, 270–273. doi: 10.1021/jf60210a042
Uzunova, M., Ecke, W., Weissleder, K., and Röbbelen, G. (1995). Mapping the genome of rapeseed (Brassica napus L.). I. Construction of an RFLP linkage map and localization of QTLs for seed glucosinolate content. Theor. Appl. Genet. 90, 194–204. doi: 10.1007/BF00222202
Voorrips, R. (2002). MapChart: software for the graphical presentation of linkage maps and QTLs. J. Hered. 93, 77–78. doi: 10.1093/jhered/93.1.77
Wade, H. K., Sohal, A. K., and Jenkins, G. I. (2003). Arabidopsis ICX1 is a negative regulator of several pathways regulating flavonoid biosynthesis genes. Plant Physiol. 131, 707–715. doi: 10.1104/pp.012377
Wan, L., Xia, Q., Qiu, X., and Selvaraj, G. (2002). Early stages of seed development in Brassica napus: a seed coat-specific cysteine proteinase associated with programmed cell death of the inner integument. Plant J. 30, 1–10. doi: 10.1046/j.1365-313X.2002.01262.x
Wang, J., Lydiate, D. J., Parkin, I. A., Falentin, C., Delourme, R., Carion, P. W., et al. (2011). Integration of linkage maps for the Amphidiploid Brassica napus and comparative mapping with Arabidopsis and Brassica rapa. BMC Genomics 12:101. doi: 10.1186/1471-2164-12-101
Wang, S., Basten, C., and Zeng, Z. (2006). Windows QTL Cartographer. Version 2.5. Raleigh, NC: Department of Statistics, North Carolina State University.
Wang, X., Yu, K., Li, H., Peng, Q., Chen, F., Zhang, W., et al. (2015). High-density SNP map construction and QTL identification for the apetalous character in Brassica napus L. Front. Plant Sci. 6:1164. doi: 10.3389/fpls.2015.01164
Wei, Y. L., Li, J. N., Lu, J., Tang, Z. L., Pu, D. C., and Chai, Y. R. (2007). Molecular cloning of Brassica napus TRANSPARENT TESTA 2 gene family encoding potential MYB regulatory proteins of proanthocyanidin biosynthesis. Mol. Biol. Rep. 34, 105–120. doi: 10.1007/s11033-006-9024-8
Werner, J. D., Borevitz, J. O., Warthmann, N., Trainer, G. T., Ecker, J. R., Chory, J., et al. (2005). Quantitative trait locus mapping and DNA array hybridization identify an FLM deletion as a cause for natural flowering-time variation. Proc. Natl. Acad. Sci. U.S.A. 102, 2460–2465. doi: 10.1073/pnas.0409474102
West, M. A., Kim, K., Kliebenstein, D. J., Van Leeuwen, H., Michelmore, R. W., Doerge, R. W., et al. (2007). Global eQTL mapping reveals the complex genetic architecture of transcript-level variation in Arabidopsis. Genetics 175, 1441–1450. doi: 10.1534/genetics.106.064972
Winkel-Shirley, B. (2002). Biosynthesis of flavonoids and effects of stress. Curr. Opin. Plant Biol. 5, 218–223. doi: 10.1016/S1369-5266(02)00256-X
Wu, G., Zhang, L., Wu, Y., Cao, Y., and Lu, C. (2010). Comparison of Five endogenous reference genes for specific PCR detection and quantification of Brassica napus. J. Agric. Food Chem. 58, 2812–2817. doi: 10.1021/jf904255b
Xiao, D., Wang, H., Basnet, R. K., Zhao, J., Lin, K., Hou, X., et al. (2014). Genetic dissection of leaf development in Brassica rapa using a genetical genomics approach. Plant Physiol. 164, 1309–1325. doi: 10.1104/pp.113.227348
Xiao, D., Zhao, J. J., Hou, X. L., Basnet, R. K., Carpio, D. P., Zhang, N. W., et al. (2013). The Brassica rapa FLC homologue FLC2 is a key regulator of flowering time, identified through transcriptional co-expression networks. J. Exp. Bot. 64, 4503–4516. doi: 10.1093/jxb/ert264
Xiao, S. S., Xu, J. S., Li, Y., Zhang, L., Shi, S. J., Shi, S. W., et al. (2007). Generation and mapping of SCAR and CAPS markers linked to the seed coat color gene in Brassica napus using a genome-walking technique. Genome 50, 611–618. doi: 10.1139/G07-044
Xie, D. Y., Sharma, S. B., Paiva, N. L., Ferreira, D., and Dixon, R. A. (2003). Role of anthocyanidin reductase, encoded by BANYULS in plant flavonoid biosynthesis. Science 299, 396. doi: 10.1126/science.1078540
Xu, B. B., Li, J. N., Zhang, X. K., Wang, R., Xie, L. L., and Chai, Y. R. (2007). Cloning and molecular characterization of a functional flavonoid 3′-hydroxylase gene from Brassica napus. J. Plant Physiol. 164, 350–363. doi: 10.1016/j.jplph.2006.03.001
Xu, F., Wang, Y., and Meng, J. (2001). Mapping boron efficiency gene (s) in Brassica napus using RFLP and AFLP markers. Plant Breed. 120, 319–324. doi: 10.1046/j.1439-0523.2001.00583.x
Xu, J., Qian, X., Wang, X., Li, R., Cheng, X., Yang, Y., et al. (2010). Construction of an integrated genetic linkage map for the A genome of Brassica napus using SSR markers derived from sequenced BACs in B. rapa. BMC Genomics 11:594. doi: 10.1186/1471-2164-11-594
Yan, X. Y., Li, J. N., Fu, F. Y., Jin, M. Y., Chen, L., and Liu, L. Z. (2009). Co-location of seed oil content, seed hull content and seed coat color QTL in three different environments in Brassica napus L. Euphytica 170, 355–364. doi: 10.1007/s10681-009-0006-5
Yang, S., Chen, S., Geng, X. X., Yan, G., Li, Z. Y., Meng, J. L., et al. (2016). The first genetic map of a synthesized allohexaploid Brassica with A, B and C genomes based on simple sequence repeat markers. Theor. Appl. Genet. 129, 689–701. doi: 10.1007/s00122-015-2657-z
Yang, Y. W., Lai, K. N., Tai, P. Y., and Li, W. H. (1999). Rates of nucleotide substitution in angiosperm mitochondrial DNA sequences and dates of divergence between Brassica and other angiosperm lineages. J. Mol. Evol. 48, 597–604. doi: 10.1007/PL00006502
Zhang, D., Hua, Y., Wang, X., Zhao, H., Shi, L., and Xu, F. (2014). A high-density genetic map identifies a novel major QTL for boron efficiency in oilseed rape (Brassica napus L.). PLoS ONE 9:e112089. doi: 10.1371/journal.pone.0112089
Zhang, J., Guo, W. Z., and Zhang, T. (2002). Molecular linkage map of allotetraploid cotton (Gossypium hirsutum L. × Gossypium barbadense L.) with a haploid population. Theor. Appl. Genet. 105, 1166–1174. doi: 10.1007/s00122-002-1100-4
Zhang, K., Lu, K., Qu, C., Liang, Y., Wang, R., Chai, Y., et al. (2013). Gene silencing of BnTT10 family genes causes retarded pigmentation and lignin reduction in the seed coat of Brassica napus. PLoS ONE 8:e61247. doi: 10.1371/journal.pone.0061247
Zhang, Y., Li, X., Chen, W., Yi, B., Wen, J., Shen, J., et al. (2011). Identification of two major QTL for yellow seed color in two crosses of resynthesized Brassica napus line No. 2127–17. Mol. Breed. 28, 335–342. doi: 10.1007/s11032-010-9486-1
Zhang, Z., Ober, J. A., and Kliebenstein, D. J. (2006). The gene controlling the quantitative trait locus EPITHIOSPECIFIER MODIFIER1 alters glucosinolate hydrolysis and insect resistance in Arabidopsis. Plant Cell Online 18, 1524–1536. doi: 10.1105/tpc.105.039602
Zhao, J., and Meng, J. (2003). Genetic analysis of loci associated with partial resistance to Sclerotinia sclerotiorum in rapeseed (Brassica napus L.). Theor. Appl. Genet. 106, 759–764. doi: 10.1007/s00122-002-1171-2
Zou, G., Zhai, G., Feng, Q., Yan, S., Wang, A., Zhao, Q., et al. (2012). Identification of QTLs for eight agronomically important traits using an ultra-high-density map based on SNPs generated from high-throughput sequencing in sorghum under contrasting photoperiods. J. Exp. Bot. 63, 5451–5462. doi: 10.1093/jxb/ers205
Keywords: Brassica napus, expression profiles, flavonoid genes, genetic map, QTLs
Citation: Qu C, Zhao H, Fu F, Zhang K, Yuan J, Liu L, Wang R, Xu X, Lu K and Li J-N (2016) Molecular Mapping and QTL for Expression Profiles of Flavonoid Genes in Brassica napus. Front. Plant Sci. 7:1691. doi: 10.3389/fpls.2016.01691
Received: 19 May 2016; Accepted: 26 October 2016;
Published: 09 November 2016.
Edited by:
Xiaowu Wang, Biotechnology Research Institute (CAAS), ChinaReviewed by:
Igor Kovalchuk, University of Lethbridge, CanadaYong Xu, National Engineering Research Center for Vegetables, China
Copyright © 2016 Qu, Zhao, Fu, Zhang, Yuan, Liu, Wang, Xu, Lu and Li. This is an open-access article distributed under the terms of the Creative Commons Attribution License (CC BY). The use, distribution or reproduction in other forums is permitted, provided the original author(s) or licensor are credited and that the original publication in this journal is cited, in accordance with accepted academic practice. No use, distribution or reproduction is permitted which does not comply with these terms.
*Correspondence: Kun Lu, drlukun@swu.edu.cn
Jia-na Li, ljn1950@swu.edu.cn
†These authors have contributed equally to this work.