 An Long
 Jiang Zhang
 Lin-Tong Yang1
 Xin Ye
 Ning-Wei Lai
 Ling-Ling Tan
 Dan Lin
 Li-Song Chen
- 1Institute of Plant Nutritional Physiology and Molecular Biology, College of Resources and Environment, Fujian Agriculture and Forestry University, Fuzhou, China
- 2Fujian Provincial Key Laboratory of Soil Environmental Health and Regulation, College of Resources and Environment, Fujian Agriculture and Forestry University, Fuzhou, China
- 3The Higher Educational Key Laboratory of Fujian Province for Soil Ecosystem Health and Regulation, Fujian Agriculture and Forestry University, Fuzhou, China
Seedlings of “Xuegan” (Citrus sinensis) and “Sour pummelo” (Citrus grandis) were irrigated daily with a nutrient solution at a pH of 2.5, 3, 4, 5, or 6 for 9 months. Thereafter, the following responses were investigated: seedling growth; root, stem, and leaf concentrations of nutrient elements; leaf gas exchange, pigment concentration, ribulose-1,5-bisphosphate carboxylase/oxygenase activity and chlorophyll a fluorescence; relative water content, total soluble protein level, H2O2 production and electrolyte leakage in roots and leaves. This was done (a) to determine how low pH affects photosynthesis, related physiological parameters, and mineral nutrient profiles; and (b) to understand the mechanisms by which low pH may cause a decrease in leaf CO2 assimilation. The pH 2.5 greatly inhibited seedling growth, and many physiological parameters were altered only at pH 2.5; pH 3 slightly inhibited seedling growth; pH 4 had almost no influence on seedling growth; and seedling growth and many physiological parameters reached their maximum at pH 5. No seedlings died at any given pH. These results demonstrate that citrus survival is insensitive to low pH. H+-toxicity may directly damage citrus roots, thus affecting the uptake of mineral nutrients and water. H+-toxicity and a decreased uptake of nutrients (i.e., nitrogen, phosphorus, potassium, calcium, and magnesium) and water were likely responsible for the low pH-induced inhibition of growth. Leaf CO2 assimilation was inhibited only at pH 2.5. The combinations of an impaired photosynthetic electron transport chain, increased production of reactive oxygen species, and decreased uptake of nutrients and water might account for the pH 2.5-induced decrease in CO2 assimilation. Mottled bleached leaves only occurred in the pH 2.5-treated C. grandis seedlings. Furthermore, the pH 2.5-induced alterations of leaf CO2 assimilation, water-use efficiency, chlorophylls, polyphasic chlorophyll a fluorescence (OJIP) transients and many fluorescence parameters, root and leaf total soluble proteins, H2O2 production, and electrolyte leakage were all slightly greater in C. grandis than in C. sinensis seedlings. Hence, C. sinensis was slightly more tolerant to low pH than C. grandis. In conclusion, our findings provide novel insight into the causes of low pH-induced inhibition of seedling growth and leaf CO2 assimilation.
Introduction
Acidic soils that limit crop growth and productivity are often observed all over the world, especially in the tropics and subtropics. Approximately 30% of the world's ice-free land is acidic, and approximately 12% of crops are cultivated on acidic soils (von Uexküll and Mutert, 1995). What is worse, soil acidification is becoming an increasingly major problem due to the improper application of chemical fertilizers—particularly the overuse of nitrogen (N) fertilizers—alongside acid rain and intensive agriculture and monoculture (Wu et al., 2013; Yang et al., 2013). The effects of aluminum (Al)-toxicity—a major factor limiting crop productivity on acidic soils—on plants have drawn widespread attention, but few studies have investigated the damage to plants from low pH (Yang et al., 2015).
Poor crop growth and yield on acidic soils is usually due to the combination of toxicities of H+, Al, and manganese (Mn) and a lack of nutrients—namely phosphorus (P), calcium (Ca), magnesium (Mg), potassium (K), and molybdenum (Mo)— and a reduced uptake of water (von Uexküll and Mutert, 1995; Bian et al., 2013). In tropical America, over 70% of the acidic soils display Al-toxicity and Mg and Ca deficiencies, and almost all the acidic soils are P-deficient or have a high P-fixation capacity (George et al., 2012). For example, Zhang et al. (2014) showed that pH 3.0 decreased the uptake and utilization efficiency of P in Juglans regia seedlings. Forest ecosystems with acidic soils are often restricted by low Ca and Mg availability (St Clair and Lynch, 2005). Schubert et al. (1990) showed that transferring Vicia faba plants from pH 7 to pH 4 led to the reduced uptake of N, P, K, Ca, Mg, and sulfur (S). Malkanthi et al. (1995) observed that the levels of K, Ca, Mg, Mn, and Zn in the roots and tops of wheat, barley, and chili plants were lower at pH 3.8 than at pH 5.5. Similarly, the K, Ca, Mg, and Mn levels in Pinus pinaster roots and needles were lower at pH 3.5 than at pH 4.5, 5.5, and 6.5, whereas the levels of P and Fe were higher at pH 3.5 and 4.5 than at pH 5.5 and 6.5 (Arduini et al., 1998). However, Anugoolprasert et al. (2012) reported that the uptake of N, P, K, Ca, and Mg, and their concentration in roots, leaflets, petioles and whole plant, were not altered over the range of pH 3.6 to 5.7 for 4.5 months; this possibly explains the normal growth of sago palm seedlings at pH 3.6. Kidd and Proctor (2001) have suggested that the direct toxicity of H+ was the primary cause of the poor growth in H+-intolerant plants growing in very acidic soils.
Low pH can affects plant water uptake. Kamaluddin and Zwiazek (2004) observed that low pH caused a large and rapid decrease in both the water flow rate and the hydraulic conductivity in seedling roots of paper birch (Betula papyrifera). A pH 4.5 decreased the whole-root water conductivity in the H+-sensitive maize cultivar Adour 250, but it did not in the H+-tolerant maize cultivar BR 201 F (Gunsé et al., 1997). Tournaire-Roux et al. (2003) showed that the inhibition of water hydraulic conductivity (water uptake) in Arabidopsis roots by anoxia was primarily caused by cytosol acidosis, while changing the pH between 5.5 and 8.0 of a root-bathing solution did not affect the cytosol pH nor the root water hydraulic conductivity. Finally, Yang M. et al. (2011) observed that a low pH decreased the water content in Eucalyptus roots, stems, and leaves.
Low pH also inhibits CO2 assimilation in some plant species, including J. regia (Zhang et al., 2014), Eucalyptus (Yang et al., 2015), sugar maple (Acer saccharum) and red maple (Acer rubrum) (Ellsworth and Liu, 1994; St Clair and Lynch, 2005). St Clair and Lynch (2005) also reported that the base cation stimulation of photosynthesis in sugar maple on acidic soils was correlated with its foliar nutrient status. Ellsworth and Liu (1994) had earlier suggested that photosynthesis in sugar maple on acidic soils might be co-limited by N and Ca, or by Ca × Mg interactions. Yang M. et al. (2011) observed that a low pH decreased the chlorophyll (Chl) level in Eucalyptus leaves. Yang et al. (2015) further investigated the effects of low pH on leaf gas exchange and Chl in four vegetatively-propagated Eucalyptus clones (G9, G12, G3, and G4); they found that pH 3.0 decreased leaf photosynthesis, transpiration, and Chl level in the four clones as well as the leaf water-use efficiency (WUE) in the G4 leaves, but pH 3.0 did not affect WUE in the G9, G12, and G3 leaves. Zhang et al. (2014) reported that pH 3.0 decreased the leaf net photosynthetic rate, transpiration rate, actual quantum yield of the photosystem II (PSII) electron transport (ΦPSII), whereas it increased leaf non-photochemical quenching (NPQ); however, pH 3 had no effect upon leaf stomatal conductance, photochemical quenching (qP), and the maximum PSII efficiency of dark-adapted leaves (Fv/Fm), thus leading the authors to conclude that non-stomatal factors played a role in the low pH-induced inhibition of photosynthesis. Nonetheless, pH 4.0 did not influence spatial heterogeneity of Chl fluorescence, Fv/Fm, ΦPSII, and quantum yields of regulated (ΦNPQ) and nonregulated (ΦNO) energy dissipation in the leaves of Plantago algarbiensis and P. almogravensis (Martins et al., 2013a,c). Altering the pH between 5.7 and 3.6 did not reduce the Chl concentration, photosynthetic rate, stomatal conductance, and transpiration rate in sago palm leaves (Anugoolprasert et al., 2012). However, to our best knowledge, little is still known about the effects of low pH on PSII photochemistry (i.e., absorption flux, trapped energy flux, electron flux, and dissipated energy flux) of leaves.
Low pH can induce oxidative stress and electrolyte leakage via the enhanced production of active oxygen species (ROS). Martins et al. (2013b) found that lipid peroxidation (malondialdehyde, MDA) was elevated in the pH 4.0-treated P. algarbiensis shoots, but not in the pH 4.0-treated P. almogravensis ones, and that the activities of antioxidant enzymes were enhanced or not affected in the shoots of the two Plantago species—suggesting that the higher antioxidant enzyme activities were insufficient to protect the low pH-treated P. algarbiensis shoots against oxidative damage. In another experiment, Martins et al. (2011) observed that pH 4.5 led to an increase in the MDA level in P. algarbiensis roots and shoots and P. almogravensis roots, but not in P. almogravensis shoots. Yang M. et al. (2011) reported that low pH increased membrane permeability in Eucalyptus leaves. Hydroponic experimentation showed that pH 3.5 led to an accumulation of H2O2 and severe lipid peroxidation that was accompanied by an increased activity of ascorbate peroxidase (APX) and decreased activities of superoxide dismutase (SOD) and catalase (CAT) in the roots of two rice cultivars (Zhang et al., 2015). Cucumber roots treated with pH 4.5 had a higher level of MDA and activities of monodehydroascorbate reductase (DHAR), guaiacol peroxidase (GPX), APX, and glutathione reductase (GR), but had lower activities of Cu/Zn-SOD, than did the pH 6.5-treated roots (Shi et al., 2006). However, pH 4.0 did not affect H2O2, MDA and the total soluble protein levels, electrolyte leakage, protein oxidation, and the SOD, CAT, APX, and GPX activities in the roots and leaves of P. algarbiensis and P. almogravensis (Martins et al., 2013c).
Citrus plants are considered insensitive to acidic soils (Yuda and Okamoto, 1965). Fang et al. (2011) used a solution culture approach to investigate the effects of pH 1.0, 2.0, 3.0, 4.0, 5.0, and 6.0 on several citrus rootstock seedlings. At pH 1.0, all seedlings died within 10 days after treatment, but the pH 4-treated seedlings showed normal growth except for a yellow tip that occurred in some leaves within 30 days. Using sand and solution cultures, Guest and Chapman (1944) found that Citrus sinensis seedlings died within a few days at pH 2.0, but they were not killed for months at pH 2.5 and 3.0 though their growth was limited or negligible. Nevertheless, citrus do not thrive in trongly acidic soils, because serious problems may arise when the soil pH is 5.0 or lower (Chapman, 1968). Citrus will often display poor growth and have a shortened lifespan when cultivated on soil with a low pH and high active Al (Lin and Myhre, 1990). In China, most of the citrus are grown in acidic and strongly acidic soils. Li et al. (2015) reported that the pH values of 319 soils sampled from pummelo (Citrus grandis) orchards in Pinghe, Zhangzhou, China had an average value of 4.34 and ranged from 3.26 to 6.22, with up to 90.0% of the orchard soils having a pH lower than 5.0. So far, however, only a handful of reports have empirically investigated the effects of low pH on citrus growth (Yuda and Okamoto, 1965), mineral nutrient uptake (Randhawa and Iwata, 1968; He et al., 1999; Li et al., 2015), and ROS metabolism alongside a few other physiological parameters (Fang, 2011). Randhawa and Iwata (1968) reported that the N, Ca, and Mg (Ca, Mg, and P) levels decreased in the leaves (roots), whereas the K level increased in the roots and leaves of Citrus natsudaidai seedlings, as the pH decreased from 7.0 to 4.0. He et al. (1999) observed that Fe, Zn, and Mn (Ca) in grapefruit (Citrus paradisi) leaves increased (decreased) with decreasing soil pH. The concentration of P and Ca in pummelo leaves decreased with decreasing soil pH (Li et al., 2015). Fang (2011) found that the activities of SOD, GPX, and CAT and the level of total soluble proteins displayed an upward trend, as a whole, as the pH decreased from 6.0 to 2.0; in contrast, the level of MDA decreased first to reach its lowest value at pH 4, but then increased as the pH decreased further.
The objectives of this work were (a) to determine how low pH affects gas exchange, related physiological parameters, and the mineral nutrient profiles in citrus seedlings; and (b) to understand the mechanisms by which low pH may lead to a decrease in leaf CO2 assimilation.
Materials and Methods
Plant Materials and Culture Conditions
This study was conducted at the Fujian Agriculture and Forestry University (FAFU) in Fuzhou, China. Seedling culture was performed according to Han et al. (2008) and Peng et al. (2015), with some modifications. Briefly, seeds of “Sour pummelo” (C. grandis) and “Xuegan” (C. sinensis) were germinated in plastic trays filled with clean river sand. Four weeks after germination, uniform seedlings that had a single stem were chosen and transplanted into 6-L terracotta pots (two seedlings per pot) containing clean river sand. Seedlings were grown in a greenhouse under a natural photoperiod at FAFU. One week after transporting, each pot was irrigated every other day with 500 mL of a nutrient solution containing 2.5 mM Ca(NO3)2, 2.5 mM KNO3, 1 mM MgSO4, 0.5 mM KH2PO4, 20 μM Fe-EDTA, 10 μM H3BO3, 2 μM MnCl2, 2 μM ZnSO4, 0.5 μM CuSO4, and 0.065 μM (NH4)6Mo7O24. Seven weeks after transplanting, each pot was fertilized daily until saturated with the same nutrient solution (approximately 500 mL), except that the pH of the nutrient solution was adjusted to 2.5, 3, 4, 5, or 6 with 1 M HCl. There were 20 replicates (20 pots, 40 seedlings) per treatment in a completely randomized design. In this experiment, the pH 5 treatment served as the control because seedling growth and many physiological parameters reach their maximum at pH 5. Nine months after the pH treatment began, recent fully-expanded (approximately 7-week-old) leaves and approximately 5-mm-long white root apices were used for all measurements except that for root mineral element concentrations. After leaf gas exchange and Chl a fluorescence were measured, leaf disks (0.2826 cm2 in size) and approximately 5-mm-long white root apices from the same seedlings were harvested from randomly selected seedling at noon on a sunny day and immediately frozen in liquid N2, then stored at −80°C until they were used for the assays of ribulose-1,5-bisphosphate carbohylase/oxygenase (Rubisco), total soluble proteins, and pigments. The remaining seedlings that were not sampled were selected randomly to measure plant biomass, root and leaf relative water content (RWC), and electrolyte leakage, and the root, stem and leaf mineral element concentrations.
Measurements of Leaf, Stem and Root Dry Weight (DW), and Specific Leaf Weight
Nine months after the pH treatment began, 10 seedlings per treatment from 10 pots were collected. The seedlings were divided into leaves, stems, and roots. Their DW was measured after being dried at 70°C for 48 h. Specific leaf weight was calculated as the ratio of leaf weight to leaf area.
Leaf Pigments, and Root and Leaf Total Soluble Proteins
Leaf pigments were extracted with 80% (v/v) acetone. The Chl, Chl a and Chl b, and carotenoids (Car) in the extract were determined according to Lichtenthaler (1987).
Root and leaf total soluble proteins were extracted with 50 mM KH2PO4-Na2HPO4 (pH 7.0) and 5% (v/v) insoluble polyvinylpyrrilodone (PVP), and assayed according to Bradford (1976).
Electrolyte Leakage, RWC, and H2O2 Production
Root and leaf electrolyte leakage was assayed according to Han et al. (2008). Briefly, 20 fresh leaf disks (0.2826 cm2 in size) from the same leaf or 20 approximately 5-mm-long white root apices taken at midday under full sun, were immediately transferred to a 50-mL tube filled with 15 mL of distilled water. The tubes were placed at room temperature in the dark for 24 h and the first electrical conductance (C1) was measured. Then the tubes were incubated in a boiling water bath for 15 min and the second electrical conductance (C2) was measured after being cooled. The electrolyte leakage was calculated as: electrolyte leakage (%) = (C1/C2) × 100.
Root and leaf RWC were gravimetrically determined (Panković et al., 1999). After fresh weight (FW) was measured, approximately 0.2 g of roots and 0.5 g of leaves were floated on distilled water in Petri dishes in the dark. After reaching a constant turgid weight (ca. 6 h), the roots and leaves were dried. The RWC was calculated as: RWC (%) = (FW − DW)/(turgid weight − DW) × 100.
Root and leaf H2O2 production were determined according to Chen et al. (2005b). About 100 mg of roots and 15 leaf disks (0.2826 cm2 in size) were incubated in 2 mL of a 50 mM phosphate buffer (pH 7.0), 5 U horseradish GPX, and 0.05% (w/v) guaiacol for 2 h at room temperature in the dark. Then the absorbance was measured at 470 nm.
Measurements of Mineral Elements, and the Calculation of Nutrient Uptake and Element Distribution in Roots, Stems, and Leaves
Fibrous roots, the middle sections of stems, and approximately 7-week-old leaves (midribs and petioles removed) were collected and dried at 70°C for 48 h. Dried samples were ground in a mortar to pass through a 40-mesh sieve and stored for later analysis.
To measure the root, stem, and leaf concentrations of P, K, Fe, Mn, Cu, Zn, Ca, and Mg, approximately 0.3-g samples were digested in a 7 mL mixture of HNO3:H2O2 (5:2 v/v). P was determined colorimetrically as the blue molybdate-phosphate complexes according to Lu (1999). K was assayed using FP640 Flame Photometry (Shanghai Precision Scientific Instrument Co., Ltd, Shanghai, China). Fe, Mn, Cu, Zn, Ca, and Mg were determined using a PinAAcle 900F Atomic Absorption Spectrometer (Perkinelmer Singapore Pte Ltd, Singapore). N was measured using a Kjeltec 8200 Auto Distillation (FOSS Analytical AB, Höganäs, Sweden) after samples had been digested with H2SO4 and H2O2 (Lu, 1999). B was determined by the curcumin method after samples were ashed at 500°C for 5 h and dissolved in 0.1 M HCl (Kowalenko and Lavkulich, 1976). S was assayed using the simple turbidimetric method based on the formation of the BaSO4 precipitate in its colloid form after approximately 0.3-g samples were digested with a 6-mL mixture of HNO3:HClO4 (4:1 v/v; Lu, 1999).
Nutrient uptake per plant was the sum of the element content (element concentration × tissue DW) in the roots, stems, and leaves. Element distributions in roots, stems, or leaves (%) were calculated as: (element content in roots, stems, or leaves/the sum of element content in roots, stems, and leaves) × 100.
Leaf Gas Exchange and Rubisco Measurements
Leaf gas exchange was measured by a CIARS-2 portable photosynthesis system (PP Systems, Herts, UK) at an ambient CO2 concentration under a controlled light intensity of 996–1004 μmol m−2 s−1 between 9:30 and 12:30 on a clear day. During all of these measurements, the leaf temperature and relative humidity were 30.0 ± 0.2°C and 64.5 ± 0.6%, respectively. Leaf Rubisco was extracted and assayed according to Chen et al. (2005a) and Lin et al. (2009), respectively.
Measurements of Leaf OJIP Transients by Handy PEA and the JIP Test
The polyphasic Chl a fluorescence (OJIP) transients were measured by a Handy Plant Efficiency Analyzer (Handy PEA, Hansatech Instruments Limited, Norfolk, UK). The transient was induced by a saturating red light of approximately 3,400 μmol m−2 s−1, which was provided by an array of three light-emitting diodes (peak 650 nm) that were focused on the leaf surface to provide homogenous illumination over the exposed area of the leaf. All the measurements were performed on 3-h dark-adapted plants at room temperature.
The OJIP transients were analyzed according to the JIP test (Strasser et al., 2004; Jiang et al., 2008; Chen and Cheng, 2009). The following data from the original measurements were extracted and used: fluorescence intensities at 20 μs (F20μs, considered as the minimum fluorescence Fo), 50 μs (F50μs), 300 μs (F300μs), 2 ms (J-step, FJ), 30 ms (I-step, FI), and P-step (considered as the maximum fluorescence Fm). The following parameters that refer to “time 0” (start of fluorescence induction) are: (a) fluorescence parameters derived from the extracted data, i.e., the maximum variable fluorescence Fv = Fm − Fo and the approximated initial slope (in ms−1) of the fluorescence transient V = f(t) [Mo = 4(F300μs−Fo)/(Fm−Fo)]; (b) the specific energy fluxes per reaction center (RC) for energy dissipation (DIo/RC) and absorption (ABS/RC); (c) the yields of the flux ratios, i.e., quantum yield for energy dissipation (φDo = DIo/ABS = Fo/Fm), maximum quantum yield of primary photochemistry (φPo = TRo/ABS = Fv/Fm), quantum yield for the reduction of the end acceptors of photosystem I (PSI) per photon absorbed (φRo = REo/ABS), and quantum yield for electron transport (φEo = ETo/ABS); (d) the overall grouping probability (P2G); and (e) the total performance index (PItot, abs).
Measurements of Conventional Fluorescence Parameters by FMS-2
Conventional fluorescence parameters were determined by a pulse-modulated fluorometer FMS-2 (Hansatech Instruments, Norfolk, UK). Both Fm and Fo were measured after the leaves were dark-adapted for 40 min. Steady-state fluorescence (Fs) and the maximum (Fm′) and minimum (Fo′) fluorescences were measured under natural light at midday in full sun. For this determination, the Fs was monitored to ensure it was stable before a reading was taken; the Fm′ was obtained by imposing a 1-s saturating flash of approximately 6,000 μmol m−2 s−1 at the leaf surface to reduce all the PSII centers. To measure the Fo′, a black cloth covered the leaf when a far-red light was switched on to rapidly oxidize the PSII centers by drawing electrons from PSII to PSI. The NPQ was calculated as: Fm/Fm′−1. The photochemical quenching coefficient, qP, was expressed as: (Fm′−Fs)/(Fm′−Fo′). The non-photochemical quenching coefficient, qNP, was defined as: (Fm−Fm′)/(Fm−Fo′). The ΦPSII was calculated as: (Fm′−Fs)/Fm′. The efficiency of excitation transfer to PSII RCs under natural light (Fm′/Fv′) was defined as: (Fm′−Fo′)/Fm′. Finally, the electron transport rate through PSII was estimated from (Fm′−Fs)/Fm′ × 0.5 × LA × photosynthetic photon flux (PPF), for which the PSI photochemistry was assumed equivalent to that of PSII (Genty et al., 1990), and where LA is the leaf absorbance (0.84; Baker, 2008).
Statistical Analysis
There were 10 replicates for plant biomass; three replicates for Rubisco; four replicates for gas exchange, pigments, H2O2 production, RWC, electrolyte leakage, total soluble proteins, specific leaf weight, and mineral nutrients; and 7–15 replicates for the OJIP transients and the fluorescence parameters. The results are presented using the mean ± SE of 3–15 replicates. For a given dependent variable or parameter above, significant differences among the means of 10 treatment combinations were tested by a two (species) × five (pH levels) factorial ANOVA; the 10 means were compared on a pairwise basis by the Duncan's new multiple range test at P < 0.05. Linear and nonlinear regression was performed with the corresponding equations from SigmaPlot software (SigmaPlot 10.0, Systat Software Inc., USA).
Results
Effects of pH on Seedling Growth
Overall, the pH-2.5 treatment greatly decreased root, stem, leaf, and whole plant DW; pH 3 slightly inhibited seedling growth; pH 4 had almost no influence on seedling growth; and seedling growth reached a maximum at pH 5 (Figures 1, 2). At pH 2.5, many rotted fibrous roots were observed, and the living roots had turned abnormally dark brown (Figures 2A,D). Mottled bleached leaves were found in four C. grandis seedlings treated with pH 2.5 (Figure 2B). No seedling death was observed for the two citrus species at each given pH.
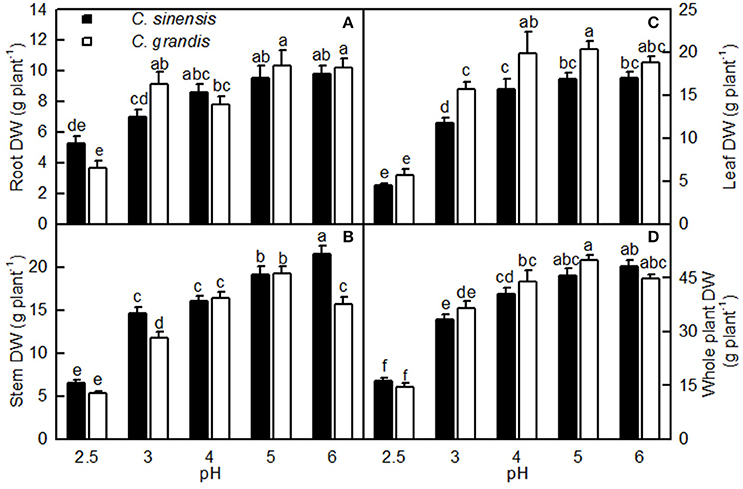
Figure 1. Effects of pH on root (A), stem (B), leaf (C), and whole plant (D) DW of Citrus sinensis and Citrus grandis seedlings. Bars represent means ± SE (n = 10). Differences among the 10 treatments were analyzed by two (species) × five (pH) factorial ANOVA. Different letters above the bars indicate a significant difference at P < 0.05.
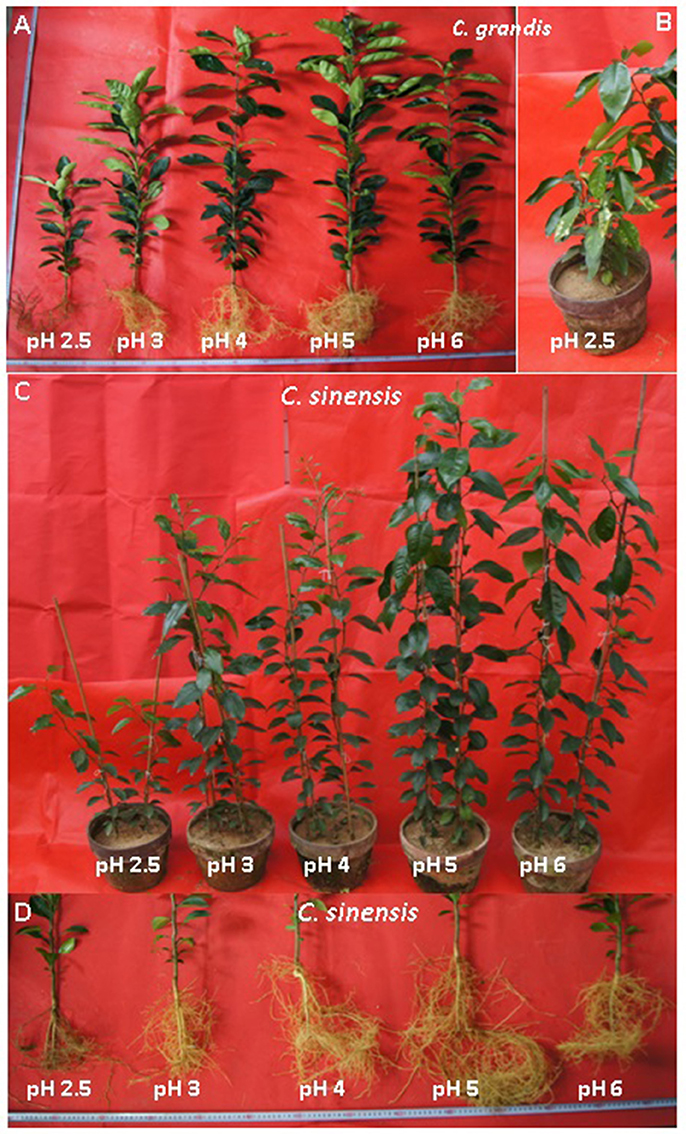
Figure 2. Effects of pH on the growth of Citrus grandis (A,B) and Citrus sinensis (C,D) seedlings.
Effects of pH on Leaf Gas Exchange, Rubisco Activity, and Pigment Levels
As shown in Figure 3, leaf CO2 assimilation, stomatal conductance, transpiration, and Rubisco activity were little changed as the pH decreased from 6 to 3, but they greatly decreased at pH 2.5. Leaf WUE was lower at pH 2.5 than at pH 5. All five parameters were similar between the two citrus species at each given pH. Intercellular CO2 concentration did not significantly differ among the 10 treatment combinations, but there was a slight increase observed in the pH 2.5-treated C. grandis leaves.
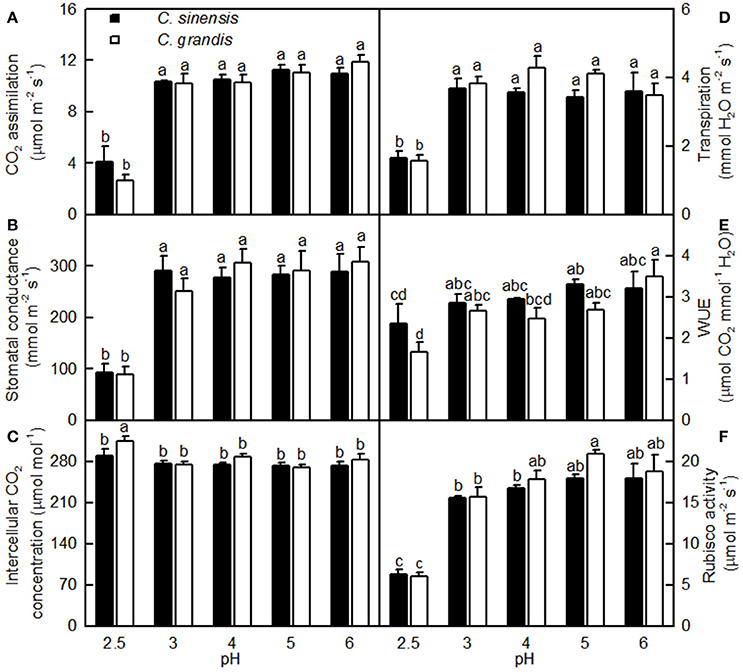
Figure 3. Effects of pH on CO2 assimilation (A), stomatal conductance (B), intercellular CO2 concentration (C), transpiration rate (D), water-use efficiency (WUE, E), and Rubisco activity (F) in Citrus sinensis and Citrus grandis leaves. Bars represent means ± SE (n = 3 for Rubisco or n = 4 for the other parameters). Differences among the 10 treatments were analyzed by two (species) × five (pH) factorial ANOVA. Different letters above the bars indicate a significant difference at P < 0.05.
As shown in Figure 4, leaf Chl a, Chl b, Chl a+b, and Car concentrations greatly increased as the pH increased from 2.5 to 3, after which they remained unchanged or were only slightly altered with increasing pH. These concentrations did not differ significantly between the two citrus species at pH 3, 4, 5, and 6, but they were lower in C. sinensis leaves than in C. grandis leaves at pH 2.5. Moreover, there was little difference in the ratios of leaf Chl a/b and Car/Chl among the 10 treatment combinations. The only exception was the lower Car/Chl ratio in the pH 2.5-treated C. sinensis leaves when compared with the other nine treatment combinations.
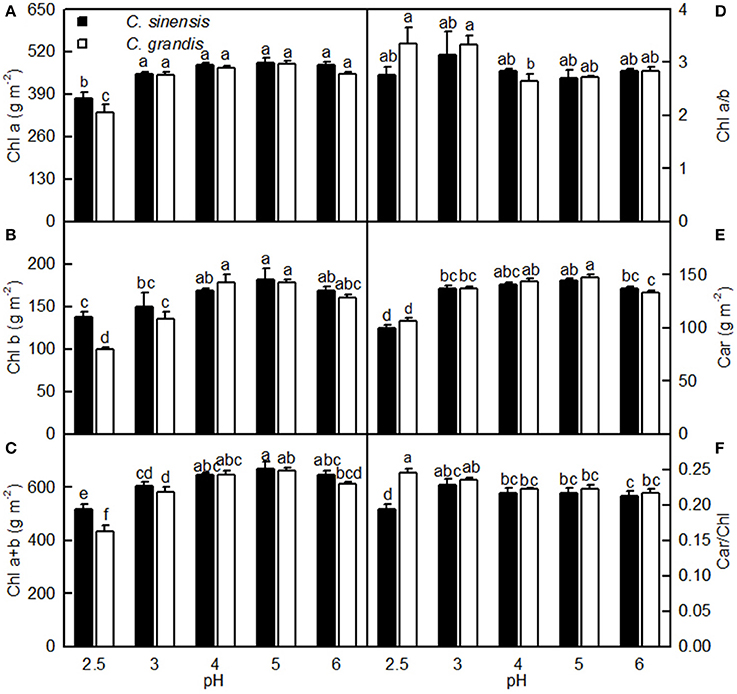
Figure 4. Effects of pH on Chl a (A), Chl b (B), Chl a+b (C), Chl a/b (D), Car (E), and Car/Chl (F) in C. sinensis and C. grandis leaves. Bars represent means ± SE (n = 4). Differences among the 10 treatments were analyzed by two (species) × five (pH) factorial ANOVA. Different letters above the bars indicate a significant difference at P < 0.05.
Leaf CO2 assimilation increased with increasing leaf stomatal conductance, the activity of Rubisco, and the concentration of Chl a, Chl b, or Chl a+b, but it decreased with an increasing intercellular CO2 concentration (Figure 5).
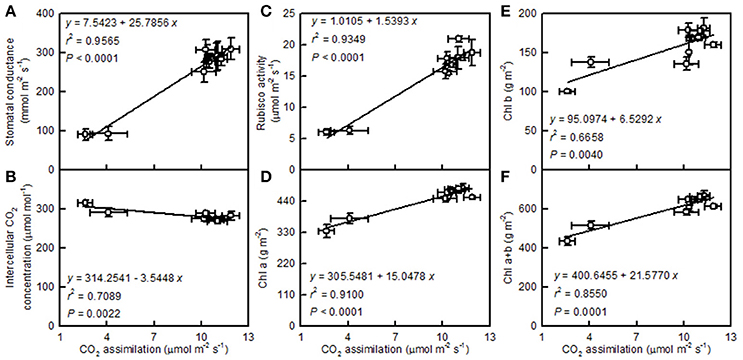
Figure 5. Leaf CO2 assimilation in relation to stomatal conductance (A), intercellular CO2 concentration (B), Rubisco activity (C), Chl a (D), Chl b (E), and Chl a+b (F). Points represent means ± SE for the independent variable (n = 4) and the dependent variables (n = 3 or 4). Data for CO2 assimilation, stomatal conductance, intercellular CO2 concentration, and Rubisco activity are from Figure 3. Data for Chl a, Chl b, and Chl a+b are from Figure 4. Data for the two citrus species were pooled together.
Effects of pH on Chl a Fluorescence and Related Parameters
Our results showed that pH 2.5 caused an increased O-step and P-step in C. sinensis and C. grandis leaves compared with pH 5, and that the pH 2.5-treated C. sinensis and C. grandis leaves had positive ΔI-, ΔJ-, ΔK-, and ΔL-bands around 30 ms, 2 ms, 300 μs, and 130 μs as compared with the pH 5-treated leaves, respectively. The pH 2.5-induced alterations of the OJIP transients and the ΔI- and ΔL-bands were greater in the leaves of C. grandis than in those of C. sinensis. Little, if any, differences were observed in the OJIP transients among the pH 3-, 4-, 5-, and 6-treated leaves (Figure 6).
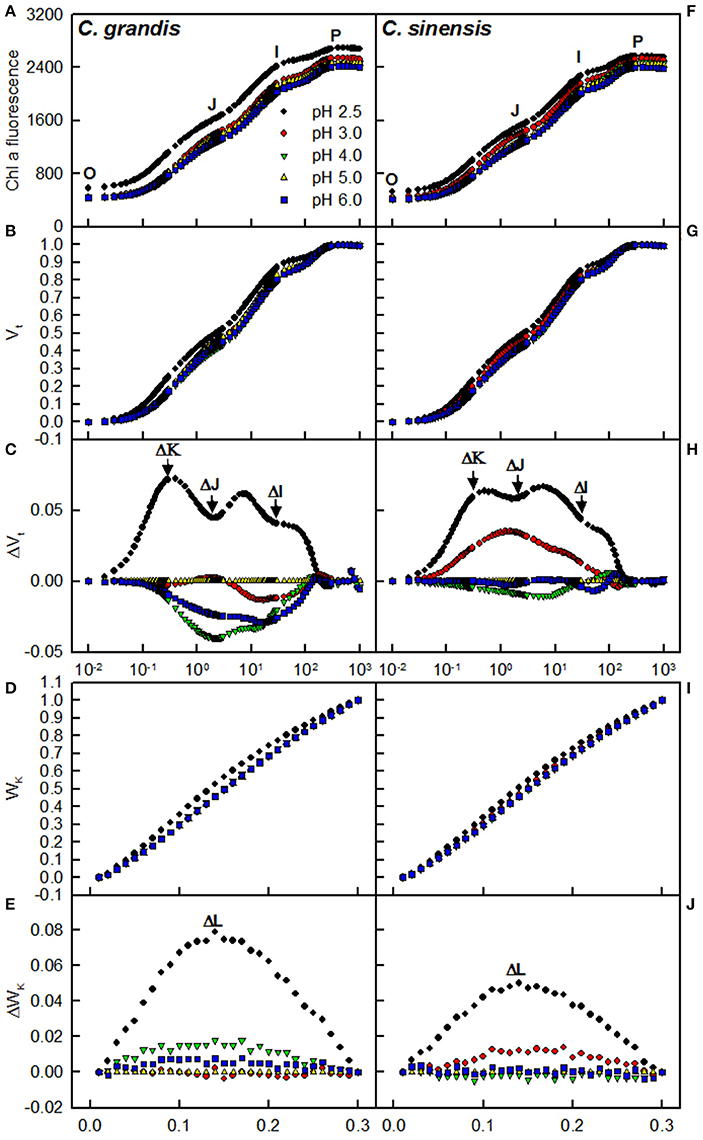
Figure 6. Effects of pH on the mean chlorophyll a fluorescence (OJIP) transients (A,F) and the different expressions derived from the transients in dark-adapted leaves: (B,G) between Fo and Fm: Vt = (Ft−Fo)/(Fm−Fo) and (C,H) the differences of the five samples to the reference sample treated with pH 5.0 (ΔVt); (D,I) between Fo and F300μs: WK = (Ft−Fo)/(F300μ−Fo) and (E,J) the differences of the five samples to the reference sample treated with pH 5.0 (ΔWK). Each point was the mean of 8–15 replicates.
As shown in Figure 7, the Fo, Fm, Mo, ABC/RC, DIo/RC, DIo/ABS, qNP, and NPQ all increased, and whereas the Fv/Fm, ETo/ABS, REo/ABS, P2G, PItot, abs, qP, Fm′/Fv′, ΦPSII, and ETR all decreased as the pH increased from 2.5 to 3, with further increasing pH there was hardly any change in all these parameters. Nonetheless, the Fv did not greatly change in response to pH. All these parameters were similar between the two citrus species at pH 3, 4, 5, or 6, but the pH 2.5-induced changes in Fo, Fv, Fm, Mo, ABC/RC, DIo/RC, DIo/RC, Fv/Fm, REo/ABS, P2G, PItot, abs, and ETR were slightly greater in C. grandis than in C. sinensis leaves.
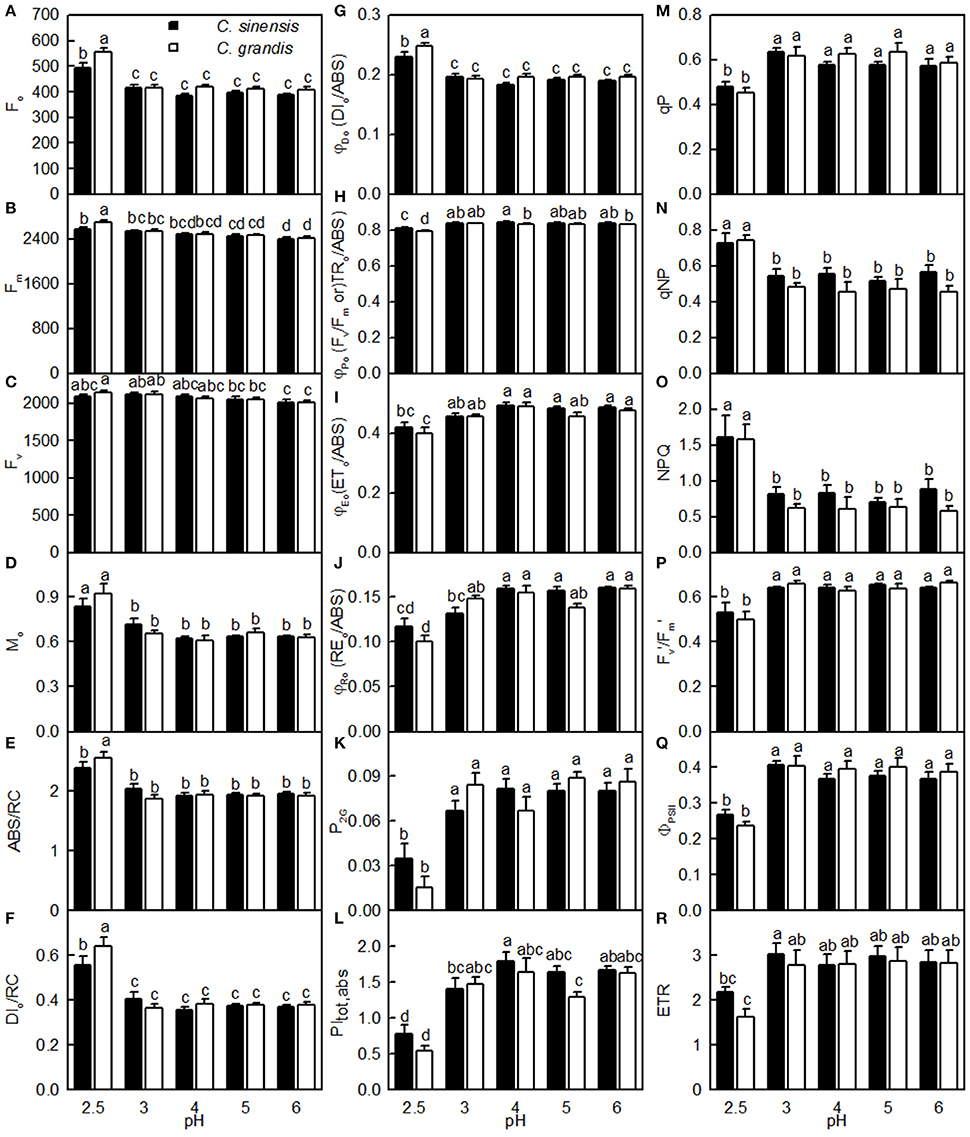
Figure 7. Effects of pH on Fo (A), Fm (B), Fv (C), Mo (D), ABS/RC (E), DIo/RC (F), DIo/ABS (G), Fv/Fm (H), ETo/ABS (I), REo/ABS (J), P2G (K), PItot, abs (L), qP (M), qNP (N), NPQ (O), / (P), ΦPSII (Q), and ETR (R) in dark-adapted C. grandis and C. sinensis leaves. Bars represent means ± SE (n = 7–15). Differences among the 10 treatments were analyzed by two (species) × five (pH) factorial ANOVA. Different letters above the bars indicate a significant difference at P < 0.05.
Leaf CO2 assimilation decreased with increasing Fo, Fm, Fv, Mo, ABC/RC, DIo/RC, DIo/ABS, qNP, or NPQ, whereas it increased with increasing Fv/Fm, ETo/ABS, REo/ABS, P2G, PItot, abs, qP, Fm′/Fv′, ΦPSII, or ETR (Figure 8).
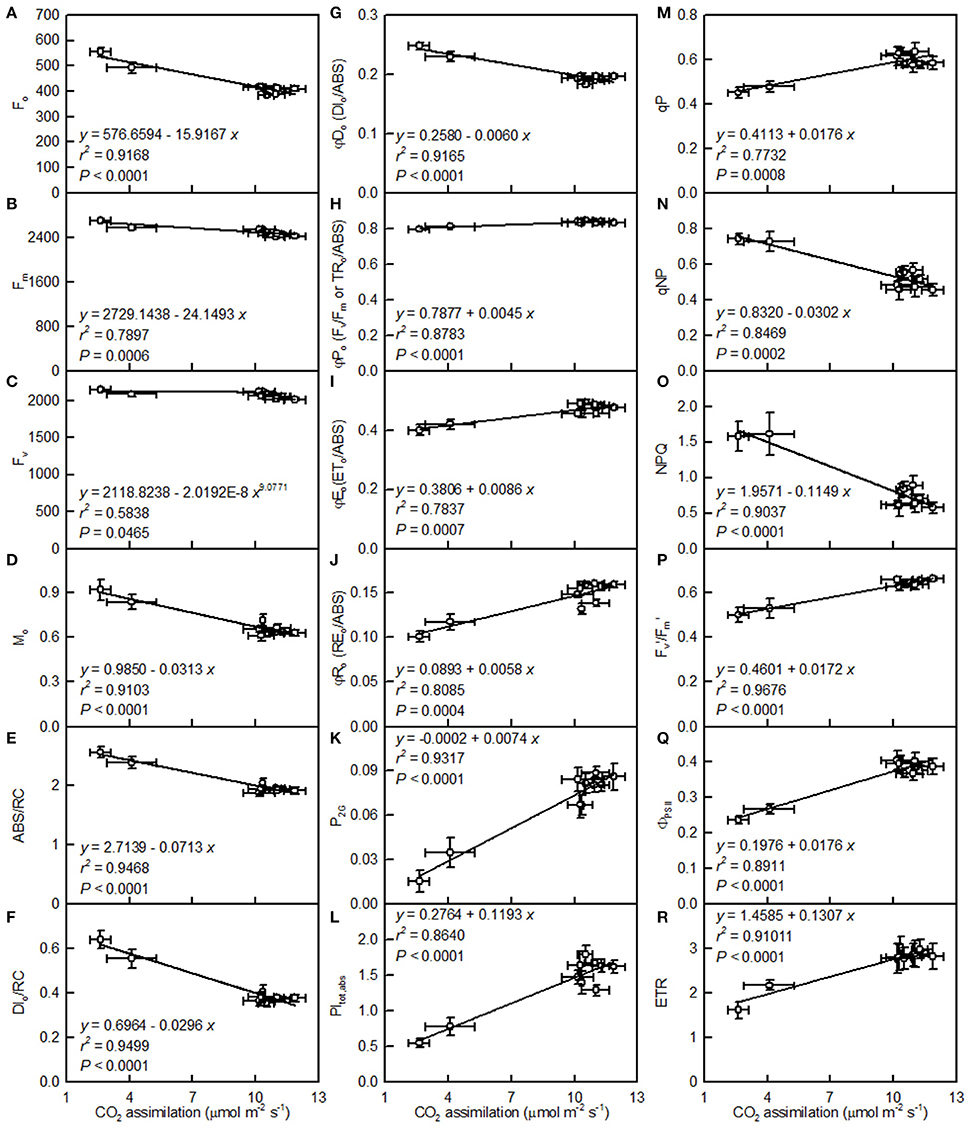
Figure 8. Leaf CO2 assimilation in relation to Fo (A), Fm (B), Fv (C), Mo (D), ABS/RC (E), DIo/RC (F), DIo/ABS (G), Fv/Fm (H), ETo/ABS (I), REo/ABS (J), P2G (K), PItot, abs (L), qP (M), qNP (N), NPQ (O), / (P), ΦPSII (Q), and ETR (R). Points represent means ± SE for the independent variable (n = 4) and the dependent variables (n = 7–15). Data for CO2 assimilation are from Figure 3. Data for the 18 fluorescence parameters are from Figure 7. Data for the two citrus species were pooled together.
Effects of pH on RWC, H2O2 Production, Electron Leakage, Total Soluble Proteins in Roots and Leaves and Specific Leaf Weight
Both pH 2.5 and 3 decreased the root RWC, while only pH 2.5 lowered the leaf RWC. Root and leaf RWCs were similar between the two citrus species at each given pH (Figures 9A,F).
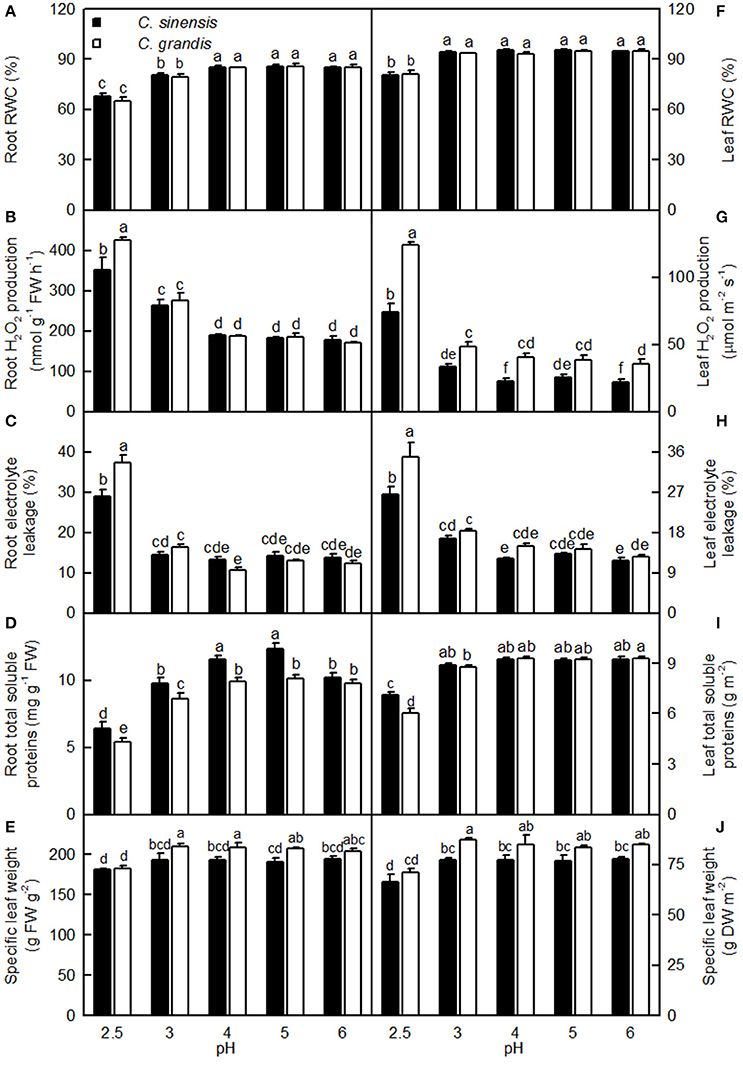
Figure 9. Effects of pH on root (A–D) and leaf (F–I) relative water content (RWC, A,F), H2O2 production (B,G), electrolyte leakage (C,H), concentrations of total soluble proteins (D,I), and specific leaf weight expressed on a fresh weight (FW, E) or dry weight (DW, J) basis in the C. sinensis and C. grandis seedlings. Bars represent means ± SE (n = 4). Differences among the 10 treatments were analyzed by two (species) × five (pH) factorial ANOVA. Different letters above the bars indicate a significant difference at P < 0.05.
Both pH 2.5 and 3 increased the root H2O2 production, while only pH 2.5 enhanced the leaf H2O2 production. Root (Leaf) H2O2 production was significantly higher in C. grandis than in C. sinensis at pH 2.5 (2.5, 3, 4, and 6), but similar between the citrus species at pH 3–6 (pH 5; Figures 9B,G).
Root and leaf electrolyte leakage increased as the pH increased from 2.5 to 3, after which leakage remained relatively stable under increasing pH. Root and leaf electrolyte leakage was higher in C. grandis than in C. sinensis at pH 2.5, but it was similar between the citrus species at pH 3–6 (Figures 9C,H).
For C. grandis, the total soluble protein level in roots increased as the pH increased from 2.5 to 4, after which it remained unchanged with increasing pH. For C. sinensis, the total soluble protein level in roots was lowest at pH 2.5, intermediate at pH 3 and 6, and highest at pH 4 and 5. The total soluble protein level in leaves of the two citrus species increased as the pH increased from 2.5 to 3, but these levels were little changed with increasing pH. The total soluble protein levels in roots and leaves were higher in C. grandis than in C. sinensis, or they were statistically similar between the two species at each given pH (Figures 9D,I).
The specific leaf weight was decreased at pH 2.5 and it was higher in C. grandis than in C. sinensis, or it was similar between the two species at each given pH irrespective of how the data were expressed (Figures 9E,J).
Leaf CO2 assimilation decreased with increasing root and leaf H2O2 production or electrolyte leakage, but it increased with increasing root and leaf RWC (Figure 10).
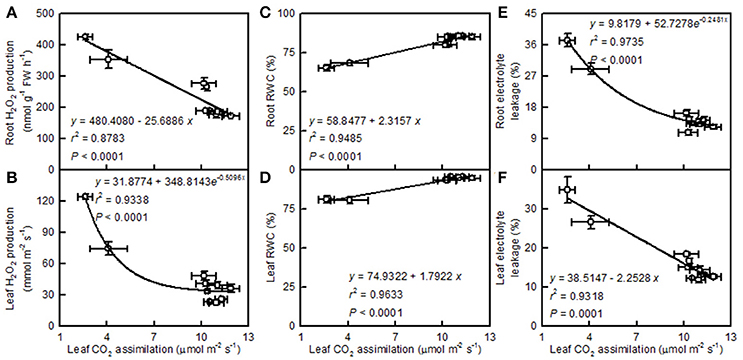
Figure 10. Leaf CO2 assimilation in relation to root (A,C,E) and leaf (B,D,F) H2O2 production (A,B), RWC (C,D), and electrolyte leakage (E,F). Points represent means ± SE for the independent variable (n = 4) and the dependent variables (n = 4). Data for CO2 assimilation came from Figure 3. Data for H2O2 production, RWC, and electrolyte leakage came from Figure 9. Data for the two citrus species were pooled together.
Effects of pH on Element Concentrations, Uptake, and Distributions
The leaf N level was lower at pH 2.5 than at pH 3–6, but the stem and root N levels remained little changed over the range of pH 2.5–6. The P level in C. grandis (C. sinensis) leaves and stems increased as the pH increased from 2.5 to 4 (3), but it went unchanged with increasing pH. The root P level increased as the pH increased from 2.5 to 5, but it then kept stable with increasing pH. The K concentration in the C. sinensis leaves and stems and in the C. grandis leaves displayed little change in the range of pH 2.5–6; however, the K level in the C. sinensis roots and in the C. grandis stems and leaves was lower at pH 2.5 than at pH 3–6. Generally viewed, the Ca levels in the leaves, stems, and roots all increased as the pH increased from 2.5 to 4, after which they were relatively stable with increasing pH. The Mg level in the C. grandis leaves and stems and in the C. sinensis leaves decreased with decreasing pH, but the Mg level in the C. sinensis stems did not change in response to pH. The Mg level in the C. sinensis roots was reduced at pH 2.5, 3, and 4, but especially at pH 2.5 and 3, while its level in the C. grandis roots was elevated at pH 2.5 and pH 3, though especially at pH 3. Leaf and root S decreased with increasing pH, while the stem S level was higher at pH 2.5 than at the other pH treatments. Leaf P, K, Ca, and S, stem P, K, and S, and root P levels were all higher in C. sinensis than in C. grandis seedlings; or similar between the two citrus species at each given pH. Conversely, the leaf Mg, stem Ca and Mg, and root N, K, Ca, Mg, and S levels were all lower in C. sinensis than in C. grandis seedlings, or they were similar between the two citrus species at each given pH (Figure 11).
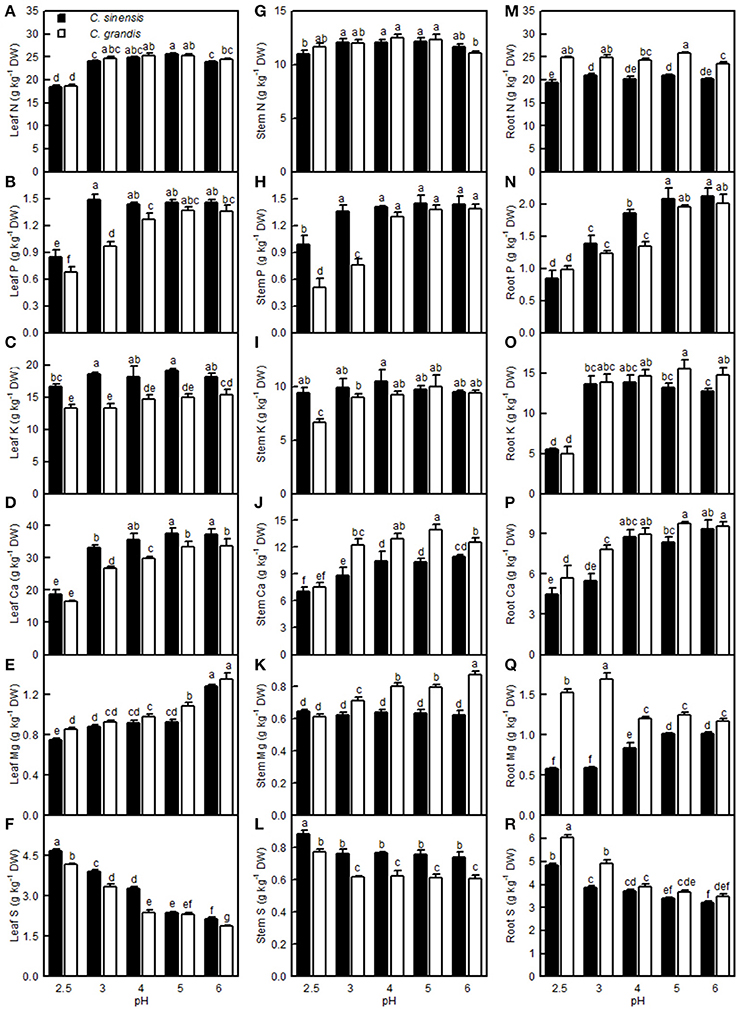
Figure 11. Effects of pH on the N (A,G,M), P (B,H,N), K (C,I,O), Ca (D,J,P), Mg (E,K,Q), and S (F,L,R) concentrations in C. sinensis and C. grandis leaves, stems, and roots. Bars represent means ± SE (n = 4). Differences among the 10 treatments were analyzed by two (species) × five (pH) factorial ANOVA. Different letters above the bars indicate a significant difference at P < 0.05.
The Fe level in the C. grandis leaves was lower at pH 2.5 and 3 than at pH 4–6, while the Fe level in the C. sinensis leaves did not differ among the five pH treatments. The Fe level in the C. sinensis (C. grandis) stems increased as the pH increased from 2.5 to 3 (4), but it then kept relatively stable with increasing pH, though it decreased at pH 6. The root Fe concentration decreased with increasing pH. Leaf and stem Mn levels decreased with increasing pH. The root Mn level increased as the pH decreased from 6 to 3, then it decreased or went unchanged at pH 2.5. Leaf B concentration in the two citrus species was decreased only at pH 2.5. The B level in the C. sinensis (C. grandis) stems increased as the pH increased from 2.5 to 4 (3), but then it went unchanged with increasing pH, though it decreased at pH 6. Although the root B concentration increased as the pH increased from 2.5 to 5, it decreased at pH 6. The Cu level in the C. grandis leaves increased as the pH decreased from 6 to 4, after which it was little changed with decreasing pH; the Cu level in the C. sinensis leaves was highest at pH 5 and lowest at pH 6. Root Cu level in the two citrus species decreased as the pH increased from 2.5 to 4, but it then remained stable with increasing pH. The Zn level in the C. sinensis leaves and stems were lower at pH 5 and 6 than at pH 2.5, 3, and 4, while its level in the C. grandis leaves and stems were lower at pH 6 than at pH 2.5–5. The Zn level in the C. sinensis roots increased as the pH decreased from 6 to 3, but it then decreased at pH 2.5; the Zn level in C. grandis roots was highest at pH 3 and lowest at pH 6. Generally viewed, the leaf Fe, Mn, B and Cu, stem Fe, Mn, B, Cu and Zn, root Fe, B, Mn, and Zn concentrations all were higher in C. grandis than in C. sinensis, or they were similar between the two citrus species at each given pH. The exceptions to this generalization were that the Mn (Cu) level was higher in C. sinensis than in C. grandis leaves at pH 2.5 (5), and the Fe level was higher in C. sinensis than in C. grandis stems at pH 2.5. By contrast, the leaf Zn and root Cu concentrations were higher in the C. sinensis than in those of C. grandis, or they were similar between the two citrus species at pH 2.5–5, albeit leaf Zn lower was lower in the C. sinensis vs. C. grandis at pH 6 (Figure 12).
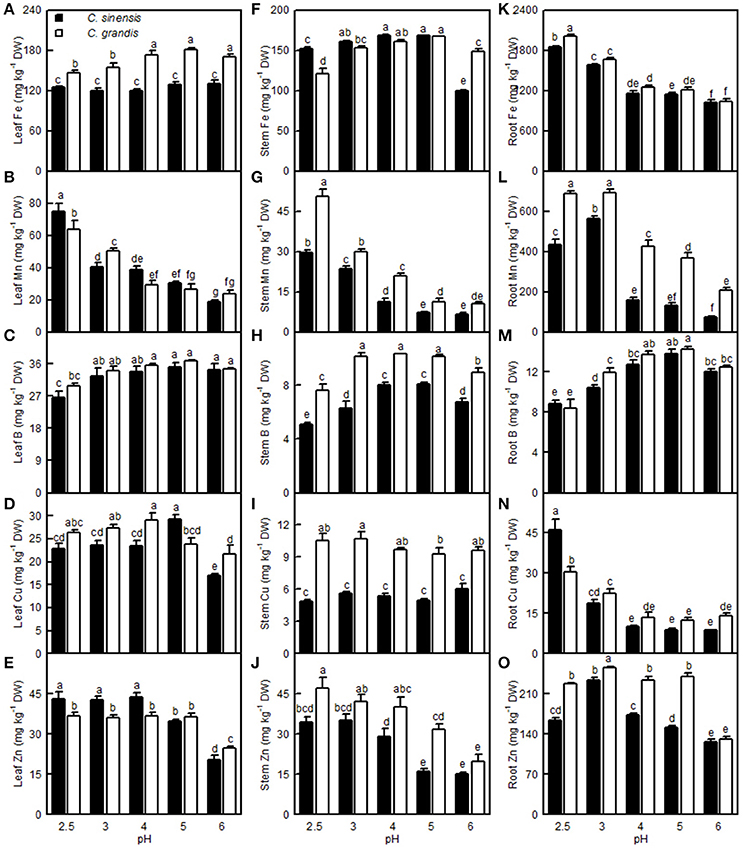
Figure 12. Effects of pH on the Fe (A,F,K), Mn (B,G,L), B (C,H,M), Cu (D,I,N), and Zn (E,J,O) concentrations in the C. sinensis and C. grandis leaves, stems, and roots. Bars represent means ± SE (n = 4). Differences among the 10 treatments were analyzed by two (species) × five (pH) factorial ANOVA. Different letters above the bars indicate a significant difference at P < 0.05.
For C. sinensis, the N, P, K, Ca, Mg, and B uptake per plant increased as the pH increased from 2.5 to 5, then continued to rise or kept unchanged with increasing pH; For C. grandis, these elemental uptake per plant increased as the pH increased from 2.5 to 5, but then it went unchanged or decreased with increasing pH. The Mn uptake per plant in the two citrus species increased as the pH increased from 2.5 to 3, but it then decreased with increasing pH. Treatment with pH 2.5 decreased the S, Fe, Cu, and Zn uptake per plant compared with the corresponding uptake at pH 5 (Figures 13A–F,M–Q).
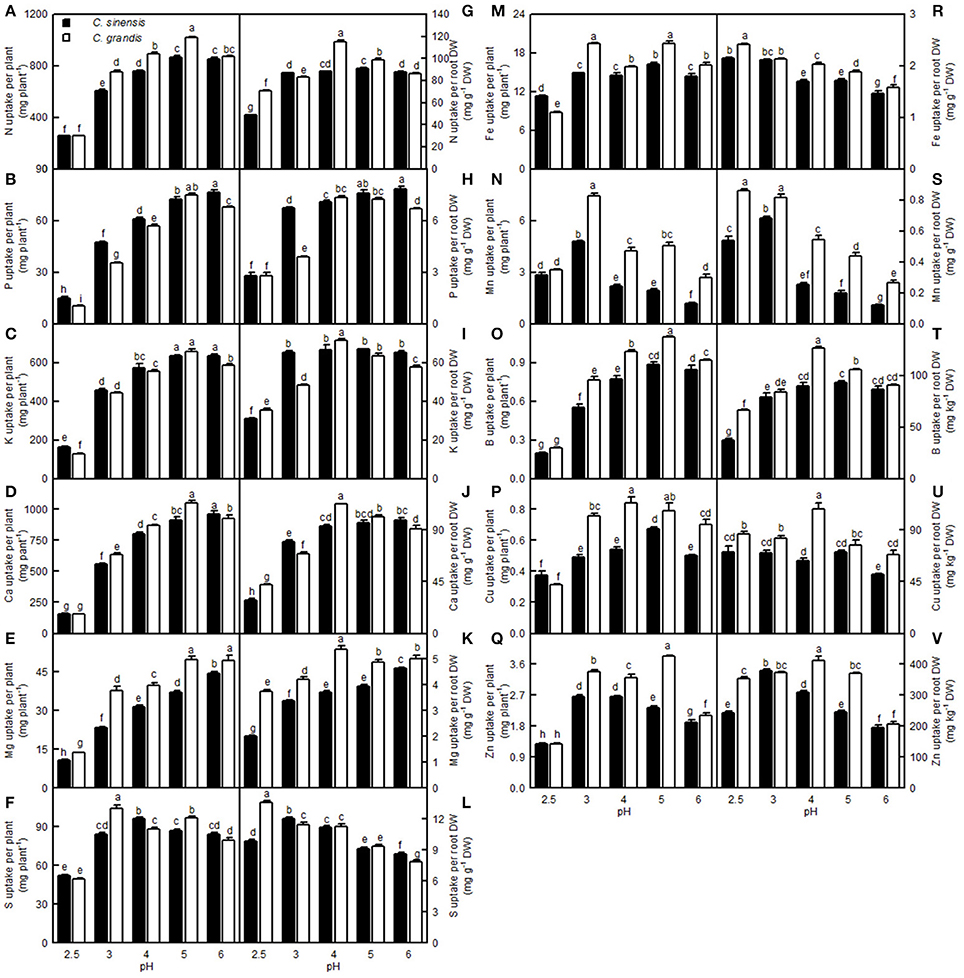
Figure 13. Effects of pH on mineral element uptake per plant (A–F,M–Q) and per root DW (G–L,R–V). Bars represent means ± SE (n = 4). Differences among the 10 treatments were analyzed by two (species) × five (pH) factorial ANOVA. Different letters above the bars indicate a significant difference at P < 0.05.
Compared with pH 5, treatment with pH 2.5 decreased the N, P, K, Ca, Mg, and B uptake per root DW, whereas it increased the S, Fe, Mn, and Zn uptake per root DW; however, pH 2.5 did not influence Cu and Zn uptake per root DW (Figures 13G–L,R–V).
Leaf CO2 assimilation increased with increasing leaf N, P, Ca, Mg, Fe, or B, whereas it decreased with increasing leaf S, Mn, Cu, or Zn—it did not display a significant relationship with leaf K. Except for the Mn uptake per plant, the leaf CO2 assimilation increased with increasing uptake per plant of the other elements (Figure 14).
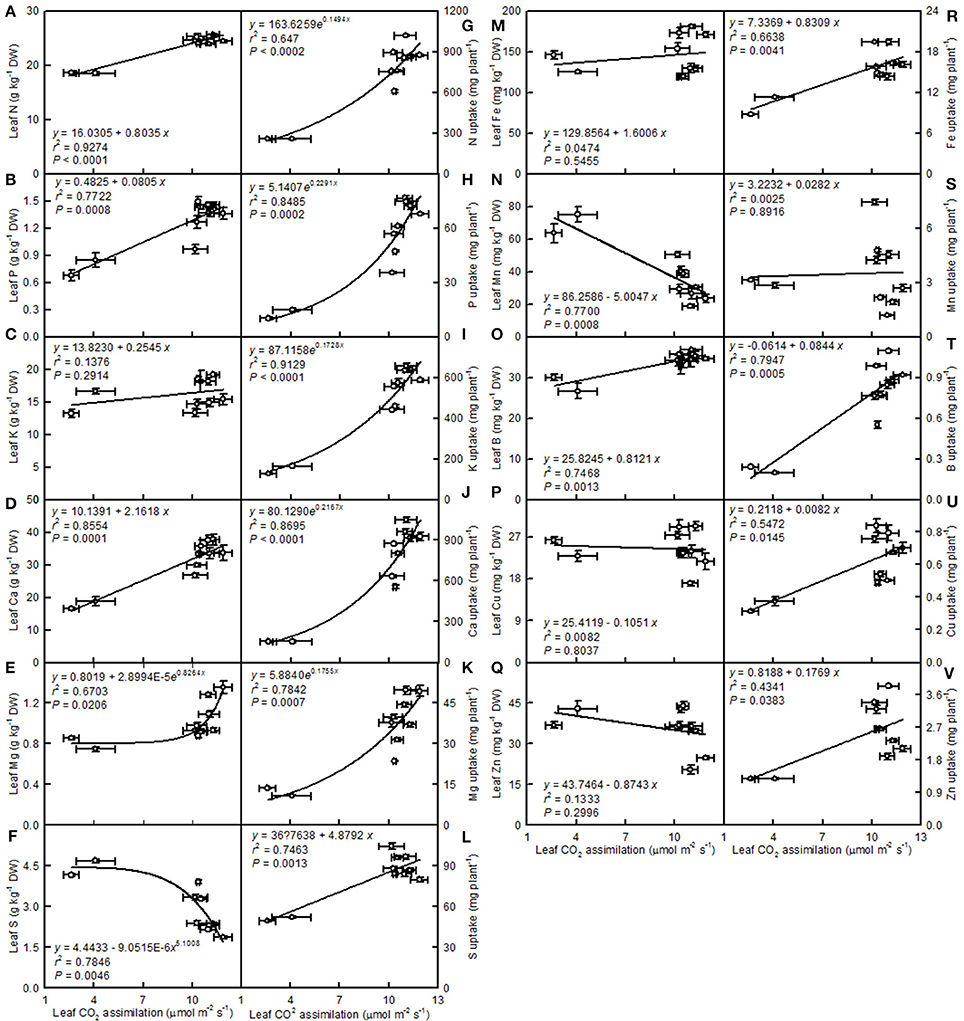
Figure 14. Leaf CO2 assimilation in relation to the mineral element concentrations in leaves (A–F,M–Q) and their uptake per plant (G–L,R–V). Points represent means ± SE for the independent variable (n = 4) and the dependent variables (n = 4). Data for CO2 assimilation came from Figure 3. Data for the mineral element concentrations (mineral element uptake per plant) came from Figures 11–13). Data for the two citrus species were pooled together.
Compared with pH 5, treatment with pH 2.5 lowered all the element distributions in the C. sinensis leaves and the S, Fe, and Cu distributions in the C. sinensis stems; it increased, or did not affect, the 11 element distributions in the C. sinensis roots and the N, P, K, Mg, Mn, B, and Zn distributions in the C. sinensis stems. Compared with pH 5, pH 2.5 decreased or did not influence the K distribution in the stems and roots and the distributions of the other 10 elements in the leaves and stems; pH 2.5 increased or did not influence the K distribution in the leaves and the distributions of the other 10 elements in the roots of the C. grandis seedlings (Figures S1, S2).
Discussion
Low pH very often affects the uptake of nutrients and water by plants (Kamaluddin and Zwiazek, 2004; Bian et al., 2013). As expected, pH 2.5 lowered the water uptake in citrus, as indicated by the reduced root and leaf RWC (Figures 9A,F). This result is supported by the finding that the water content was decreased in low pH-treated Eucalyptus roots, stems, and leaves (Yang M. et al., 2011). As shown in Figures 9–13, the uptakes of mineral nutrients were greatly altered at pH 2.5. Compared with pH 5, the pH 2.5 lowered N, P, K, Ca, and Mg uptake per plant or root DW, and the S uptake per plant. Low pH (4.0 relative to 7.0) induced decreases in the N, P, K, Ca, and Mg uptake per plant in V. faba (Schubert et al., 1990). Similarly, Malkanthi et al. (1995) observed that a pH 3.8 (relative to 5.5) decreased the K, Ca, and Mg uptake per plant in wheat, barley, and chili, and likewise in cowpea for Ca and Mg uptake per plant. However, the uptake of N, P, K, Ca, and Mg in sago palm seedlings was not changed in the range of pH 3.6–5.7 over a 4.5-month period (Anugoolprasert et al., 2012). Thus, it appears that the effects of low pH on macronutrient uptake per plant depend on both the plant species identity and the H+ strength (i.e., pH value).
On the whole, apart from a few exceptions, the concentrations of N, P, K, Ca, and Mg were decreased in the pH 2.5-treated C. grandis and C. sinensis roots, stems, and leaves (Figure 11). This agrees with the report that pH 3 decreased Ca and Mg levels in Picea abies roots and needles (George et al., 2012); that P, K, and Mg levels were lowered in the low pH-treated V. faba roots and shoots (Schubert et al., 1990); that the levels of K, Ca, and Mg in the roots and tops of wheat, barley, and chili were lower at pH 3.8 than at pH 5.7 (Malkanthi et al., 1995); and that P and Ca levels in pummelo leaves increased linearly with increasing soil pH (Li et al., 2015). However, the levels of N, P, K, Ca, and Mg in the roots, leaflets, petioles, and whole plant of sago palm seedlings did not differ among pH 3.6, 4.5, and 5.7 (Anugoolprasert et al., 2012). The concentrations of N, P, K, Ca, and Mg might have been reduced in sago palm seedlings if the pH was lower than pH 3.6, because the concentration of N, P, K, Ca, and Mg in citrus roots, stems, and leaves were greatly reduced at pH 2.5 but little affected at pH 4 relative to pH 5 (Figure 11). In contrast, the S level was increased in the low pH-treated C. grandis and C. sinensis roots, stems, and leaves (Figures 11F,L,R), which is consistent with the finding that the S concentration in the tops of ginger, maize, wheat, French bean, and tomato plants was higher at pH 3.3 than at pH 4.0 (Islam et al., 1980).
So far, however, there is little published information available on the effects of low pH on plant micronutrients. H+-toxicity is thought to inhibit the uptake of cations (George et al., 2012). However, treatment with pH 2.5 did not lower Fe, Cu, Mn, and Zn uptake per root DW in the two citrus species, or the Mn uptake per plant in C. sinensis, when compared with pH 5 (Figures 13N,R,S,U,V). This result may be related to the insensitivity of citrus plants to acidic soils, as reported previously by Yuda and Okamoto (1965). Interestingly, the B uptake per plant or per root DW was reduced by a low pH (Figures 13O,T). This result is supported by a work showing that B could alleviate low pH-induced damage in Arabidopsis roots (Koyama et al., 2001).
The Fe, Mn, Cu, and Zn concentrations in the C. grandis and C. sinensis roots, stems, and leaves were all higher at pH 2.5 than at pH 5, or they were similar between the two treatments, though there was a lower level of Fe detected in the C. grandis leaves at pH 2.5 than at pH 5 (Figures 12A,B,D–G,I–L,N–Q). The observed higher Fe, Mn, Cu, and Zn concentrations in the pH 2.5-treated C. grandis and C. sinensis roots, stems, and leaves might be associated with a reduced dilution due to decreased growth (Figure 1) and with higher uptake per root DW (Figures 13R,S,U,V). As shown in Figures 12A,D,F,I,K,N, the root Fe and Cu concentrations were higher at pH 2.5 than those at the other treatment levels of pH, while no such results were observed for the leaf and stem Fe and Cu concentrations; this may be explained by the increased Fe and Cu distributions in the roots, and the decreased or unchanged Fe and Cu distributions in the leaves and stems, at pH 2.5 (Figures S2A,D,F,I,K,N). By contrast, the B level was decreased in the pH 2.5-treated C. grandis and C. sinensis roots, stems, and leaves (Figures 12C,H,M) likely due to the decreased B uptake per plant or root DW (Figures 13O,T).
In this experiment, many of the fibrous roots became rotten and the living roots turned abnormally dark brown when exposed to pH 2.5 (Figures 2A,D). Thus, it is reasonable to presume that H+-toxicity may directly damage citrus roots, thus affecting the uptake of vital mineral nutrients and water.
Our results showed that pH 2.5 lowered the root, stem, leaf, and whole plant DW (Figures 1, 2). The low pH-induced poor growth of citrus seedlings may be due to the combined interplay of direct H+-toxicity—as shown by the damaged roots (Figures 2A,D)—deficiencies of macronutrients—as indicated by the decreased N, P, K, Ca, and Mg concentrations (Figures 11A–E)—and uptake per plant or root DW (Figures 13A–E,G–K), and the decreased water uptake—as indicated by the decreased root and leaf RWC (Figures 9A,F).
In spite of the reduced growth at pH 2.5, no seedling deaths occurred in the two citrus species at each given pH during the entire experiment. Similar results have been obtained for several citrus rootstocks (Fang, 2011; Fang et al., 2011), as well as for C. sinensis seedlings (Guest and Chapman, 1944). Based on the present results, we conclude that the two citrus species studied were insensitive to low pH. This above conclusion is supported by the fact that most of physiological parameters monitored in Figures 3, 4, 7, 9 were altered only at pH 2.5, and that pH 4 had almost no influence on these parameters and the OJIP transients (Figure 6).
As shown in Figure 2B, mottled bleached leaves were observed only in the pH 2.5-treated C. grandis seedlings (Figure 2B). Furthermore, the pH 2.5-induced alterations of many physiological parameters shown in Figures 3, 4, 7, 9, and of the JIP transients (Figure 6), were slightly greater in C. grandis than in C. sinensis leaves. Evidently, when the results are taken together, seedlings of C. sinensis had a slightly higher tolerance to a low pH than did those of C. grandis. However, the difference in low pH tolerance between the C. grandis and C. sinensis species is apparently lower than the difference between them in their Al-tolerance (Yang L. T. et al., 2011; Jiang et al., 2015; Li et al., 2016). This latter discrepancy is supported by a study showing that plant races were separately adapted to Al3+ or low pH- (H+-) toxicity (Kidd and Proctor, 2001).
We found that pH 2.5 greatly inhibited the CO2 assimilation in C. grandis and C. sinensis leaves, and that this inhibition was slightly greater in C. grandis than in C. sinensis leaves (Figure 3A). The pH 2.5-induced decrease in leaf CO2 assimilation could not be explained only by decreased stomatal conductance, because the intercellular CO2 concentration increased and stayed unchanged in pH 2.5-treated C. granddis and C. sinensis leaves, respectively (Figure 3C), and because leaf CO2 assimilation decreased with the increasing intercellular CO2 concentration (Figure 5B). Thus, the pH 2.5-induced decrease in leaf CO2 assimilation in citrus may be primarily driven by non-stomatal factors.
In this context, the pH 2.5-induced decreases in Chl a, Chl b, and Chl a+b were probably not the main factor inhibiting leaf CO2 assimilation because their reductions were much lower than that for leaf CO2 assimilation (Figures 3A, 4A–C). This conclusion is supported by our results showing that DIo/RC, DIo/ABS, NPQ, and qNP were all elevated in the pH 2.5-treated C. grandis and C. sinensis leaves (Figures 7F,G,N,O).
The observed positive ΔL-band at ca. 130 μs in the OJIP transients from the pH 2.5-treated leaves (Figures 6E,J) suggested that the grouping (stability) of the PSII units and the energy exchange between the independent PSII units were both reduced (Strasser et al., 2004; Liao et al., 2015). This interpretation is further supported by our result that P2G was decreased in the pH 2.5-treated leaves (Figure 7K). The appearance of a positive ΔK-band at 300 μs in the OJIP transients from the pH 2.5-treated leaves (Figures 6C,H) indicated that the oxygen evolving complex (OEC) had been damaged (Srivastava et al., 1997). The observed positive ΔJ- and ΔI-bands at 2 ms and 30 ms, respectively, in the OJIP transients from the pH 2.5-treated leaves (Figures 6C,H) suggested that the reduction of the PSII acceptor side had been elevated (Strasser et al., 2004). The amount of electrons from the RCs at the acceptor side depends on both the capacity of electron donation to the RCs and the capacity of the electron transport chain from the RCs to the electron acceptors. Based on these results, we conclude that at pH 2.5, the PSII acceptor side was more severely damaged than was the PSII donor side. We observed that pH 2.5 led to increased DIo/RC, decreased Fv/Fm and ETo/ABS (Figures 7F,H,I), and altered the OJIP transients (Figure 6) in leaves, together indicating that photoinhibition damaged the PSII complexes in these citrus leaves (Maxwell and Johnson, 2000; Force et al., 2003). In the present study, the pH 2.5-induced decrease in Fv/Fm was caused by an increased Fo, since the Fm slightly increased with decreasing pH (Figures 7A,B). The observed higher Fo in the pH 2.5-treated leaves was likely associated with an increased inactivation of the PSII RCs, as increased by the decreased qP (Figure 7M), and with the enhanced damage to OEC, as indicated by the positive ΔK-band (Figures 6C,H). Furthermore, the higher Fo may have arisen from the pH 2.5-induced accumulation of reduced QA (Bukhov et al., 1990), as indicated by the increased Mo (Figure 7D). In addition, the pH 2.5-treated leaves displayed decreased REo/ABS, PItot, abs, Fm′/Fv′, ΦPSII, and ETR (Figures 7J,L,P–R). Obviously, treatment with pH 2.5 impaired the whole electron transport chain from the donor side of PSII to the reduction of the PSII end acceptors, thus decreasing ETR. Regression analysis showed that leaf CO2 assimilation increased with increasing Fv/Fm, ETo/ABS, REo/ABS, P2G, PItot, abs, qP, Fm′/Fv′, ΦPSII, or ETR, (Figures 8H–M,P–R). Based on these results, we conclude that pH 2.5 damaged the whole photosynthetic electron transport chain, thus inhibiting leaf CO2 assimilation in seedlings of these two citrus species.
Light-driven ROS production can cause oxidative damage to vital photosynthetic components and thereby inhibit photosynthesis (Foyer and Shigeoka, 2011). We observed that pH 2.5 greatly increased the H2O2 production and the electrolyte leakage in C. grandis and C. sinensis leaves, though more so in the C. grandis leaves (Figures 9G,H), and that leaf CO2 assimilation decreased with increasing leaf H2O2 production and electrolyte leakage (Figures 10B,F). Hence, the observed higher ROS production may be responsible for the pH 2.5-induced inhibition of photosynthesis in citrus leaves.
The leaf photosynthetic rate decreases with decreasing leaf RWC (Lawlor, 2002). However, the relative importance of stomatal and non-stomatal limitations to photosynthesis under water stress is not yet fully understood. Typically, as the RWC decreases, the stomatal limitation of photosynthesis will also decrease and the metabolic limitation will increase (Lawlor, 2002; Zhou et al., 2007), which entails limitations to ribulose-1,5-disphosphate (RuBP) regeneration (Gunasekera and Berkowitz, 1993), photophosphorylation (Tezara et al., 1999), and Rubisco activity (Maroco et al., 2002; Parry et al., 2002). Zhou et al. (2007) observed that water stress decreased photosynthetic rate, Rubisco activity, the energy flux via linear electron transport, and increased ΔpH- and xanthophyll-mediated thermal dissipation. Our results showed that the pH 2.5-induced decrease in leaf CO2 assimilation (Figure 3A) was accompanied by decreases in root and leaf RWC (Figures 9A,F), leaf Rubisco activity (Figure 3F) and ETR, and by an increase in NPQ (Figures 7O,R). Furthermore, leaf CO2 assimilation decreased with decreasing root RWC, leaf RWC (Figures 10C,D), Rubisco activity (Figure 5C), or ETR (Figure 8R), and with increasing NPQ (Figure 8O); leaf Rubisco activity (y) increased with increasing leaf RWC (y = −61.1653 + 0.8351x, r2 = 0.9174, P < 0.0001). Thus, it is reasonable to assume that a low pH lowered the water uptake and induced water stress, thus inhibiting photosynthesis in the C. grandis and C. sinensis leaves.
A study has shown that the base cation-induced increase in sugar maple photosynthesis on acid soils was associated with an improved foliar nutrient status (St Clair and Lynch, 2005). Ellsworth and Liu (1994) suggested that leaf photosynthesis of sugar maple on acidic soils was co-limited by N and Ca, or by interactions of Ca with other nutrients, such as Mg. We observed that leaf CO2 assimilation decreased with increasing leaf N, P, Ca, or Mg concentrations (N, P, Ca, or Mg uptake per plant) (Figures 14A,B,D,E,G,H,J,K). Thus, the pH 2.5-induced decreases in these nutrients might be responsible for the observed lower leaf CO2 assimilation.
Our results also showed that the growth of seedlings (Figures 1, 2) and the status of many of their physiological parameters (Figures 3, 4, 7, 9, 11, 12) reached their maximum at pH 5. This seems to contradict the early view that serious problems for citrus might arise when the soil pH was 5.0 or lower (Chapman, 1968). In our study, citrus seedlings were grown under favorable conditions of mineral nutrients and the direct toxicity of H+ might be the primary cause for the poor seedling growth. However, a significant difference might also occur when citrus are grown on acidic soils due to the increased solubility of Al and Mn, and/or decreased availability of P, Ca, Mg, and Mo (George et al., 2012; Kochian et al., 2015; Li et al., 2015). Thus, the optimum pH for citrus might be higher in a soil culture than when grown in solution or a sand culture (Yuda and Okamoto, 1965). These findings indicate that suitable fertilizers might alleviate the toxicity of acidic soils upon citrus. Adjusting the soil nutrients via careful fertilization should contribute to greater harvest yield and the sustainable management of citrus across a range of acidic soils.
Conclusion
Our results demonstrate that citrus seedlings were insensitive to low pH, and that C. sinensis is slightly more tolerant to this low pH than is C. grandis. H+-toxicity could directly damage the citrus roots, thus affecting their uptake of mineral nutrients and water. The results suggest that the low pH-induced inhibition of growth was caused by the combination of H+-toxicity, deficiencies of nutrients, and decreased water uptake. Here, only pH 2.5 noticeably inhibited leaf CO2 assimilation, which was probably due to the combination of an impaired photosynthetic electron transport chain, increased ROS production, and decreased uptake of water and nutrients. In sum, these findings increase our understanding of the factors by which a low pH can decrease citrus growth, and of the mechanisms by which low pH inhibits leaf CO2 assimilation.
Author Contributions
AL performed most of the experiment and drafted the manuscript; JZ participated in the measurements of photosynthesis and fluorescence; LY participated in the direction of this study; XY and NL participated in the analysis of the nutrient elements; LT and DL participated in the cultivation of the experimental seedlings; LC designed and directed the study and also revised the manuscript. All authors have read and approved the final manuscript.
Funding
This work was financially supported by an earmarked fund for the China Agriculture Research System (No. CARS27).
Conflict of Interest Statement
The authors declare that the research was conducted in the absence of any commercial or financial relationships that could be construed as a potential conflict of interest.
Supplementary Material
The Supplementary Material for this article can be found online at: http://journal.frontiersin.org/article/10.3389/fpls.2017.00185/full#supplementary-material
References
Anugoolprasert, O., Kinoshita, S., Naito, H., Shimizu, M., and Ehara, H. (2012). Effect of low pH on the growth, physiological characteristics and nutrient absorption of sago palm in a hydroponic system. Plant Prod. Sci. 15, 125–131. doi: 10.1626/pps.15.125
Arduini, I., Kettner, C., Godbold, D. L., Onnis, A., and Stefani, A. (1998). The influence of pH on root morphology and mineral content of Pinus pinaster Ait. seedlings. Plant Biosyst. 132, 3–9. doi: 10.1080/11263504.1998.10654185
Baker, N. R. (2008). Chlorophyll fluorescence: a problem of photosynthesis in vivo. Annu. Rev. Plant Biol. 59, 89–113. doi: 10.1146/annurev.arplant.59.032607.092759
Bian, M., Zhou, M., Sun, D., and Li, C. (2013). Molecular approaches unravel the mechanism of acid soil tolerance in plants. Crop J. 1, 91–104. doi: 10.1016/j.cj.2013.08.002
Bradford, M. M. (1976). A rapid and sensitive method for quantitation of microgram quantities of protein utilizing the principle of protein-dye binding. Anal. Biochem. 72, 248–254. doi: 10.1016/0003-2697(76)90527-3
Bukhov, N. G., Sabat, S. C., and Mohanty, P. (1990). Analysis of chlorophyll a fluorescence changes in weak light in heat treated Amaranthus chloroplasts. Photosynth. Res. 23, 81–87. doi: 10.1007/BF00030066
Chapman, H. D. (1968). “The mineral nutrition of citrus,” in The Citrus Industry, Vol. 2, eds W. Reuther, H. J. Webber, and L. D. Batchelor (Berkeley, CA: Division of Agricultural Sciences, University of California), 127–189.
Chen, L. S., and Cheng, L. (2009). Photosystem 2 is more tolerant to high temperature in apple (Malus domestica Borkh.) leaves than in fruit peel. Photosynthetica 47, 112–120. doi: 10.1007/s11099-009-0017-4
Chen, L. S., Qi, Y. P., and Liu, X. H. (2005b). Effects of aluminum on light energy utilization and photoprotective systems in citrus leaves. Ann. Bot. 96, 35–41. doi: 10.1093/aob/mci145
Chen, L. S., Qi, Y. P., Smith, B. R., and Liu, X. H. (2005a). Aluminum-induced decrease in CO2 assimilation in citrus seedlings is unaccompanied by decreased activities of key enzymes involved in CO2 assimilation. Tree Physiol. 25, 317–324. doi: 10.1093/treephys/25.3.317
Ellsworth, D. S., and Liu, X. (1994). Photosynthesis and canopy nutrition of four sugar maple forests on acid soils in northern Vermont. Can. J. For. Res. 24, 2118–2127. doi: 10.1139/x94-272
Fang, Z. J. (2011). Evaluation of Acid Tolerance for Citrus Rootstock Seedlings and Their Differences in Physiological Characteristics. Master thesis, Jiangxi Agricultural University, Nanchang.
Fang, Z. J., Yang, L. L., Huang, C. H., Gu, Q. Q., and Xu, X. B. (2011). Analysis on acid tolerance of several citrus rootstock seedlings. South China Fruits 40, 8–11.
Force, L., Critchley, C., and van Rensen, J. J. S. (2003). New fluorescence parameters for monitoring photosynthesis in plants. 1. The effect of illumination on the fluorescence parameters of the JIP-test. Photosynth. Res. 78, 17–33. doi: 10.1023/A:1026012116709
Foyer, C. H., and Shigeoka, S. (2011). Understanding oxidative stress and antioxidant functions to enhance photosynthesis. Plant Physiol. 155, 93–100. doi: 10.1104/pp.110.166181
Genty, B., Harbinson, J., and Baker, N. R. (1990). Relative quantum efficiencies of the two photosystems of photorespiratory and non-respiratory conditions. Plant Physiol. Biochem. 28, 1–10.
George, E., Horst, W. J., and Neumann, E. (2012). “Adaptation of plants to adverse chemical soil conditions,” in Marschner's Mineral Nutrition of Higher Plants, 3rd Edn., ed P. Marschner (London: Academic Press), 409–472.
Guest, P. L., and Chapman, H. D. (1944). Some effects of pH on the growth of citrus in sand and solution cultures. Soil Sci. 58, 455–466. doi: 10.1097/00010694-194412000-00005
Gunasekera, D., and Berkowitz, G. A. (1993). Use of transgenic plants with Rubisco antisense DNA to evaluate the rate limitation of photosynthesis under water stress. Plant Physiol. 103, 629–635. doi: 10.1104/pp.103.2.629
Gunsé, B., Poschenrieder, C., and Barceló, J. (1997). Water transport properties of roots and root cortical cells in proton- and Al-stressed maize varieties. Plant Physiol. 113, 595–602. doi: 10.1104/pp.113.2.595
Han, S., Chen, L. S., Jiang, H. X., Smith, B. R., Yang, L. T., and Xie, C. Y. (2008). Boron deficiency decreases growth and photosynthesis, and increases starch and hexoses in leaves of citrus seedlings. J. Plant Physiol. 165, 1331–1341. doi: 10.1016/j.jplph.2007.11.002
He, Z. L., Alva, A. K., Calvert, D. V., Li, Y. C., and Banks, D. J. (1999). Effects of nitrogen fertilization of grapefruit trees on soil acidification and nutrient availability in a Riviera fine sand. Plant Soil 206, 11–19. doi: 10.1023/A:1004364805789
Islam, A. K. M. S., Edwards, D. G., and Asher, C. J. (1980). pH optima for crop growth. Results of a flowing solution culture experiment with six species. Plant Soil 54, 339–357. doi: 10.1007/BF02181830
Jiang, H. X., Chen, L. S., Zheng, J. G., Han, S., Tang, N., and Smith, B.R. (2008). Aluminum-induced effects on photosystem II photochemistry in citrus leaves assessed by the chlorophyll a fluorescence transient. Tree Physiol. 28, 1863–1871. doi: 10.1093/treephys/28.12.1863
Jiang, H. X., Yang, L. T., Qi, Y. P., Lu, Y. B., Huang, Z. R., and Chen, L. S. (2015). Root iTRAQ protein profile analysis of two citrus species differing in aluminum-tolerance in response to long-term aluminum-toxicity. BMC Genomics 16:949. doi: 10.1186/s12864-015-2133-9
Kamaluddin, M., and Zwiazek, J. J. (2004). Effects of root medium pH on water transport in paper birch (Betula papyrifera) seedlings in relation to root temperature and abscisic acid treatments. Tree Physiol. 24, 1173–1180. doi: 10.1093/treephys/24.10.1173
Kidd, P. S., and Proctor, J. (2001). Why plants grow poorly on very acid soils: are ecologists missing the obvious? J. Exp. Bot. 52, 791–799. doi: 10.1093/jexbot/52.357.791
Kochian, L. V., Piñeros, M. A., Liu, J., and Magalhaes, J. V. (2015). Plant adaptation to acid soils: the molecular basis for crop aluminum resistance. Annu. Rev. Plant Biol. 66, 571–598. doi: 10.1146/annurev-arplant-043014-114822
Kowalenko, C. G., and Lavkulich, L. M. (1976). A modified curcumin method for boron analysis of soil extracts. Can. J. Soil Sci. 56, 537–539. doi: 10.4141/cjss76-068
Koyama, H., Toda, T., and Hara, T. (2001). Brief exposure to low-pH stress causes irreversible damage to the growing root in Arabidopsis thaliana: pectin-Ca interaction may play an important role in proton rhizotoxicity. J. Exp. Bot. 52, 361–368. doi: 10.1093/jexbot/52.355.361
Lawlor, D. W. (2002). Limitation to photosynthesis in water-stressed leaves: stomata vs. metabolism and the role of ATP. Ann. Bot. 89, 871–885. doi: 10.1093/aob/mcf110
Li, H., Yang, L. T., Qi, Y. P., Gu, P., Lu, Y. B., and Chen, L. S. (2016). Aluminum-toxicity-induced alterations of leaf proteome in two citrus species differing in aluminum-tolerance. Int. J. Mol. Sci. 17:1180. doi: 10.3390/ijms17071180
Li, Y., Han, M. Q., Lin, F., Ten, Y., Lin, J., Zhu, D. H., et al. (2015). Soil chemical properties, ‘Guanximiyou’ pummelo leaf mineral nutrient status and fruit quality in the southern region of Fujian province, China. J. Soil Sci. Plant Nutr. 15, 615–628. doi: 10.4067/s0718-95162015005000029
Liao, X. Y., Yang, L. T., Lu, Y. B., Ye, X., and Chen, L. S. (2015). Roles of rootstocks and scions in aluminum-tolerance of citrus. Acta Physiol. Plant. 37:1743. doi: 10.1007/s11738-014-1743-1
Lichtenthaler, H. K. (1987). Chlorophylls and carotenoids: pigments of photosynthetic biomembranes. Methods Enzymol. 148, 350–382. doi: 10.1016/0076-6879(87)48036-1
Lin, Z. H., Chen, L. S., Chen, R. B., Zhang, F. Z., Jiang, H. X., and Tang, N. (2009). CO2 assimilation, ribulose-1,5-bisphosphate carboxylase/oxygenase, carbohydrates and photosynthetic electron transport probed by the JIP-test, of tea leaves in response to phosphorus supply. BMC Plant Biol. 9:43. doi: 10.1186/1471-2229-9-43
Lin, Z., and Myhre, D. L. (1990). Citrus root growth as affected by soil aluminum level under field conditions. Soil Sci. Soc. Am. J. 54, 1340–1344. doi: 10.2136/sssaj1990.03615995005400050023x
Lu, R. K. (1999). Methods of Soil and Agrochemistry Analysis. Beijing: China Agriculture Science and Technology Press.
Malkanthi, D. R. R., Yokoyama, K., Yoshida, T., Moritsugu, M., and Matsushita, K. (1995). Effects of low pH and Al on growth and nutrient uptake of several plants. Soil Sci. Plant Nutr. 41, 161–165. doi: 10.1080/00380768.1995.10419571
Maroco, J. P., Rodrigues, M. L., Lopes, C., and Chaves, M. M. (2002). Limitations to leaf photosynthesis in field-grown grapevine under drought-metabolic and modelling approaches. Funct. Plant Biol. 29, 451–459. doi: 10.1071/PP01040
Martins, N., Gonçalves, S., Palma, T., and Romano, A. (2011). The influence of low pH on in vitro growth and biochemical parameters of Plantago almogravensis and P. algarbiensis. Plant Cell Tiss. Organ Cult. 107, 113–121. doi: 10.1007/s11240-011-9963-1
Martins, N., Gonçalves, S., and Romano, A. (2013b). Metabolism and aluminum accumulation in Plantago almogravensis and P. algarbiensis in response to low pH and aluminum stress. Biol. Plant. 57, 325–331. doi: 10.1007/s10535-012-0271-3
Martins, N., Osório, M. L., Gonçalves, S., Osório, J., Palma, T., and Romano, A. (2013a). Physiological responses of Plantago algarbiensis and P. almogravensis shoots and plantlets to low pH and aluminum stress. Acta Physiol. Plant. 35, 615–625. doi: 10.1007/s11738-012-1102-z
Martins, N., Osório, M. L., Gonçalves, S., Osório, J., and Romano, A. (2013c). Differences in Al tolerance between Plantago algarbiensis and P. almogravensis reflect their ability to respond to oxidative stress. Biometals 26, 427–437. doi: 10.1007/s10534-013-9625-3
Maxwell, K., and Johnson, G. N. (2000). Chlorophyll fluorescence -a practical guide. J. Exp. Bot. 51, 659–668. doi: 10.1093/jexbot/51.345.659
Panković, D., Sakač, Z., Kevrešan, S., and Plesničar, M. (1999). Acclimation to long-term water deficit in the leaves of two sunflowe hybrids: photosynthesis, electron transport and carbon metabolism. J. Exp. Bot. 50, 127–138. doi: 10.1093/jexbot/50.330.127
Parry, M. A., Andralojc, P. J., Khan, S., Lea, P. J., and Keys, A. J. (2002). Rubisco activity: effects of drought stress. Ann. Bot. 89, 833–839. doi: 10.1093/aob/mcf103
Peng, H. Y., Qi, Y. P., Lee, J., Yang, L. T., Guo, P., Jiang, H. X., et al. (2015). Proteomic analysis of Citrus sinensis roots and leaves in response to long-term magnesium-deficiency. BMC Genomics 16:253. doi: 10.1186/s12864-015-1462-z
Randhawa, S. S., and Iwata, M. (1968). Effects of pH, calcium concentrations and sources of nitrogen on the growth and inorganic compositions of citrus seedlings in solution culture. J. Jap. Soc. Hortic. Sci. 37, 23–31. doi: 10.2503/jjshs.37.319
Schubert, S., Schubert, E., and Mengel, K. (1990). Effect of low pH of the root medium on proton release, growth, and nutrient uptake of field beans (Vicia faba). Plant Soil 124, 239–244. doi: 10.1007/BF00009266
Shi, Q. H., Zhu, Z. J., Juan, L. I., and Qian, Q. Q. (2006). Combined effects of excess Mn and low pH on oxidative stress and antioxidant enzymes in cucumber roots. Agri. Sci. China 5, 767–772. doi: 10.1016/S1671-2927(06)60122-3
Srivastava, A., Guisse, B., Greppin, H., and Strasser, R. J. (1997). Regulation of antenna structure and electron transport in photosystem II of Pisum sativum under elevated temperature probed by the fast polyphasic chlorophyll a fluorescence transient: OKJIP. Biochim. Biophys. Acta 1320, 95–106. doi: 10.1016/S0005-2728(97)00017-0
St Clair, S. B., and Lynch, J. P. (2005). Base cation stimulation of mycorrhization and photosynthesis of sugar maple on acid soils are coupled by foliar nutrient dynamics. New Phytol. 165, 581–590. doi: 10.1111/j.1469-8137.2004.01249.x
Strasser, R. J., Tsimilli-Micheal, M., and Srivastava, A. (2004). “Analysis of the chlorophyll a fluorescence transient,” in Chlorophyll a Fluorescence: A Signature of Photosynthesis, eds G. C. Papageorgiou and Govindjee (Berlin: Springer), 321–362.
Tezara, W., Mitchell, W. J., Driscoll, S. D., and Lawlor, D. W. (1999). Water stress inhibits plant photosynthesis by decreasing coupling factor and ATP. Nature 401, 914–917. doi: 10.1038/44842
Tournaire-Roux, C., Sutka, M., Javot, H., Gout, E., Gerbeau, P., Luu, D. T., et al. (2003). Cytosolic pH regulates root water transport during anoxic stress through gating of aquaporins. Nature 425, 393–397. doi: 10.1038/nature01853
von Uexküll, H. R., and Mutert, E. (1995). Global extent, development and economic impact of acid soils. Plant Soil 171, 1–15. doi: 10.1007/BF00009558
Wu, D. M., Fu, Y. Q., Yu, Z. W., and Shen, H. (2013). Status of red soil acidification and aluminum toxicity in south China and prevention. Soils 45, 577–584.
Yang, L. T., Jiang, H. X., Tang, N., and Chen, L. S. (2011). Mechanisms of aluminum-tolerance in two species of citrus: secretion of organic acid anions and immobilization of aluminum by phosphorus in roots. Plant Sci. 180, 521–530. doi: 10.1016/j.plantsci.2010.11.011
Yang, L. T., Qi, Y. P., Jiang, H. X., and Chen, L. S. (2013). Roles of organic acid anion secretion in aluminium tolerance of higher plants. BioMed Res. Int. 2013:173682. doi: 10.1155/2013/173682
Yang, M., Huang, S. X., Fang, S. Z., and Huang, X. L. (2011). Response of seedling growth of four Eucalyptus clones to acid and aluminum stress. Plant Nutr. Fert. Sci. 17, 195–201.
Yang, M., Tan, L., Xu, Y., Zhao, Y., Cheng, F., Ye, S., et al. (2015). Effect of low pH and aluminum toxicity on the photosynthetic characteristics of different fast-growing Eucalyptus vegetatively propagated clones. PLoS ONE 10:e0130963. doi: 10.1371/journal.pone.0130963
Yuda, E., and Okamoto, S. (1965). The effect of soil reaction on the growth of young citrus plants. I. Forms of nitrogen fertilizer and kinds of pH adjusting agent. J. Jap. Soc. Hortic. Sci. 34, 177–186. doi: 10.2503/jjshs.34.177
Zhang, C. P., Meng, P., Li, J. Z., and Wan, X. C. (2014). Interactive effects of soil acidification and phosphorus deficiency on photosynthetic characteristics and growth in Juglans regia seedlings. Chin. J. Plant Ecol. 38, 1345–1355. doi: 10.3724/SP.J.1258.2014.00129
Zhang, Y. K., Zhu, D. F., Zhang, Y. P., Chen, H. Z., Xiang, J., and Lin, X. Q. (2015). Low pH-induced changes of antioxidant enzyme and ATPase activities in the roots of rice (Oryza sativa L.) seedlings. PLoS ONE 10:e0116971. doi: 10.1371/journal.pone.0116971
Keywords: chlorophyll a fluorescence, Citrus grandis, Citrus sinensis, low pH, OJIP transient, photosynthesis, uptake of nutrient and water
Citation: Long A, Zhang J, Yang L-T, Ye X, Lai N-W, Tan L-L, Lin D and Chen L-S (2017) Effects of Low pH on Photosynthesis, Related Physiological Parameters, and Nutrient Profiles of Citrus. Front. Plant Sci. 8:185. doi: 10.3389/fpls.2017.00185
Received: 26 October 2016; Accepted: 30 January 2017;
Published: 21 February 2017.
Edited by:
Jairo A. Palta, University of Western Australia, AustraliaReviewed by:
Xuming Huang, South China Agricultural University, ChinaMei Yang, Guangxi University of China, China
Copyright © 2017 Long, Zhang, Yang, Ye, Lai, Tan, Lin and Chen. This is an open-access article distributed under the terms of the Creative Commons Attribution License (CC BY). The use, distribution or reproduction in other forums is permitted, provided the original author(s) or licensor are credited and that the original publication in this journal is cited, in accordance with accepted academic practice. No use, distribution or reproduction is permitted which does not comply with these terms.
*Correspondence: Li-Song Chen, lisongchen2002@hotmail.com