 Lubin Song
 Qingping Ma
 Zhongwei Zou
 Kang Sun
 Yuantao Yao
 Jihan Tao
 Najeeb A. Kaleri2
 Xinghui Li
- 1Tea Research Center, Shandong Institute of Pomology, Tai’an, China
- 2Tea Research Institute, College of Horticulture, Nanjing Agricultural University, Nanjing, China
- 3Department of Plant Science, University of Manitoba, Winnipeg, MB, Canada
‘Huangjinya’ is an excellent albino tea germplasm cultivated in China because of its bright color and high amino acid content. It is light sensitive, with yellow leaves under intense light while green leaves under weak light. As well, the flavonoid and carotenoid levels increased after moderate shading treatment. However, the mechanism underlying this interesting phenomenon remains unclear. In this study, the transcriptome of ‘Huangjinya’ plants exposed to sunlight and shade were analyzed by high-throughput sequencing followed by de novo assembly. Shading ‘Huangjinya’ made its leaf color turn green. De novo assembly showed that the transcriptome of ‘Huangjinya’ leaves comprises of 127,253 unigenes, with an average length of 914 nt. Among the 81,128 functionally annotated unigenes, 207 differentially expressed genes were identified, including 110 up-regulated and 97 down-regulated genes under moderate shading compared to full light. Gene ontology (GO) indicated that the differentially expressed genes are mainly involved in protein and ion binding and oxidoreductase activity. Antioxidation-related pathways, including flavonoid and carotenoid biosynthesis, were highly enriched in these functions. Shading inhibited the expression of flavonoid biosynthesis-associated genes and induced carotenoid biosynthesis-related genes. This would suggest that decreased flavonoid biosynthetic gene expression coincides with increased flavonoids (e.g., catechin) content upon moderate shading, while carotenoid levels and biosynthetic gene expression are positively correlated in ‘Huangjinya.’ In conclusion, the leaf color changes in ‘Huangjinya’ are largely determined by the combined effects of flavonoid and carotenoid biosynthesis.
Introduction
The tea plant [Camellia sinensis (L.) O. Kuntze] is an evergreen tree that is widely distributed in tropical and subtropical regions in the world. Tea is one of the most popular non-alcoholic beverages, and leaf color is an important indicator of tea quality (Taylor et al., 1992; Ravichandran, 2002). Catechins is a class of flavonoids and significantly correlated with chlorophyll content in tea (Wei et al., 2011). The catechins level is also affected by environmental factors especially light (Mariya et al., 2003; Premkumar et al., 2008).
Different environmental factors produce many variations in the leaf color of tea plant germplasms. However, some albino tea cultivars, such as the light-sensitive ‘Huangjinya,’ have exceptional qualities and a good taste (Li et al., 2016). Compared to normal green tea cultivars, the lower catechin levels of ‘Huangjinya’ make the tea taste less bitter (Feng et al., 2014). ‘Huangjinya’ has a different pigment composition than general tea cultivars: it has yellow leaves under intense light but green leaves under shade. However, the mechanism underlying the color changes in ‘Huangjinya’ is unclear.
Plant carotenoids are a family of pigments ranging in color from yellow to red that are involved in light harvesting and are indispensable for photoprotection against excess light. Carotenoids are synthesized in plastids such as chromoplasts and chloroplasts by various enzymes. Li et al. (2016) found that ‘Huangjinya’ leaves had higher amino acid and caffeine levels and lower polyphenol levels than tea cultivars with green leaves. They also suggested that 2-C-methyl-D-erythritol-4-phosphate (MEP) and carotenoid and chlorophyll metabolism-associated genes may contribute to the color changes in ‘Huangjinya.’ Nevertheless, whether the expression of these genes is the primary factor in color changes is still unclear.
It has also been reported that flavonoids participate in ultraviolet (UV) light-absorption (Xie et al., 2012), antioxidation and salinity stress tolerance (Agati et al., 2012; Ismail et al., 2015). The major flavonoids in tea plants are catechins, which are an important class of flavanols. Compared to green tea cultivars, ‘Huangjinya’ contains significant lower level of polyphenols or catechins (Feng et al., 2014; Li et al., 2016). In tea leaves, catechins is the main component of tea polyphenols. After moderate shading, the polyphenols content in ‘Huangjinya’ increased but remained less than that in green cultivars (Li et al., 2016). Catechins have been associated with antioxidant activity in plants (Škerget et al., 2005; Nakabayashi et al., 2014). However, the role flavonoid biosynthesis during the leaf color changes in ‘Huangjinya’ is unclear.
In the present study, we moderately shaded ‘Huangjinya’ plants for 10 days and the tea leaves turned from yellow to green colors. We therefore compared the phenotypes and de novo transcriptomes of ‘Huangjinya’ leaves grown in sunlight and in the shade to elucidate the mechanisms underlying the leaf color changes in ‘Huangjinya.’ We have also focused on the role of carotenoid and flavonoid biosynthesis played on the process of color changes in ‘Huangjinya.’
Materials and Methods
Plant Materials
Two-year-old tea plants growing well (Camellia sinensis cv. Huangjinya) in the experimental field of the Tea Institute of Shandong Academy of Agricultural Sciences in Tai’an, China (N36°11′, E117°10′, 153 m above sea level) were used in this experiment. One group of tea plants was shaded by a single layer shade net which reduced light intensity by about 45%, and another group of tea plants grown in the same field without the shade net was used as the control. The experiment was performed in late April with mean temperature of 26°C (day) and 13°C (night). After 10 days, at least 10 tender leaves at the third position from the top of both groups were harvested and frozen quickly in liquid nitrogen. Three biological repeats from different plants were performed for each group. These frozen leaves were stored at -80°C for further analysis.
Measurement of Chlorophyll Content
The levels of chlorophyll and carotenoids, which are the major pigments influencing leaf color, were measured. Briefly, 100 mg of fresh tea leaves was ground by using a disposable pestle and then were extracted with 15 ml of 95% ethanol and incubated in the dark for 30 min. The extracts were filtered and analyzed with a UV-5800PC spectrophotometer (Metash, China). The absorbance at the following wavelengths was recorded: 665 nm for chlorophyll a, 649 nm for chlorophyll b, and 470 nm for total carotenoids. Total chlorophyll (Chl mg/g), carotenoid content and the Chl a/b ratio were calculated according to the method of Welburn and Lichtenthaler (1984).
RNA Preparation and Sequencing
Total RNA was extracted using TRIzol (Vazyme Biotech, Nanjing, China). Briefly, 0.1 g tea leaves was ground in 1.5 ml Trizol by homogenizer (Scientz Biotech, Ningbo, China) and centrifuged for 5 min, 1/5 volume chloroform was added in the supernatant followed by centrifugation for 15 min. Thereafter, the equal volume isopropanol was added in supernatant for precipitating RNA. Finally, the precipitation was washed by 75% ethanol for three times and dissolved in 100 μl diethylpyrocarbonate treated water. RNA integrity and concentration was detected by 1.2% agarose gel electrophoresis and Agilent 2100 Bioanalyzer. cDNA libraries were obtained using the VAHTSTM Stranded mRNA-seq Library Prep Kit for Illumina® by Vazyme Biotech and were then sequenced using the Illumina HiSeq 4000 platform by Vazyme Biotech. All the samples were sequenced on the same lane.
De Novo Assembly
The raw data were filtered by removing the adapter sequences, low-quality reads (the rate of reads which quality value ≤ 10 is more than 20%) and the reads with unknown nucleotides larger than 5%, and clean reads were produced for further analysis. De novo transcriptome assembly was carried out using the Trinity program as described previously (Grabherr et al., 2011). The assembled unigenes were analyzed with the TGI Clustering Tool (TGICL) (Pertea et al., 2003) to remove redundant sequences and then clustered with the Phrap assembler1 to obtain distinct sequences. The fragments per kb per million fragments (FPKM) method was used to calculate the expression of unigenes (Audic and Claverie, 1997). The differentially expressed genes (DEGs) were screened by R software using DESeq package (Anders and Huber, 2010). False Discovery Rate (FDR) ≤ 0.001 and |log2Ratio|≥ 1 was considered as the threshold of the differential expression.
Annotation and CD Prediction
The GO classifications of unigenes were analyzed by Blast2Go software with default parameters (Conesa et al., 2005). To understand the categorization of gene functions of the tea leaves, Web Gene Ontology Annotation Plot (WEGO) software (Ye et al., 2006) was used to conduct GO functional classification thereafter. All of the unigenes were aligned to the Non-redundant protein sequences (NR), Swiss-Prot, Kyoto Encyclopedia of Genes and Genomes (KEGG), and Cluster of Orthologous Groups of proteins (COG) databases using Blastx, and nucleotide sequences database (NT) using Blastn with e-values < 1.0e-5.
For predicting coding regions (CDs), NR, Swiss-Prot, KEGG, COG were blasted in order with e-value < 1.0e-5. Unigenes that could not be aligned to any database were further scanned with ESTScan (Iseli et al., 1999).
Sequence Alignment and Phylogenetic Tree Construction
In order to understand the structure of a novel flavonoid-related gene senescence-related gene 1 (SRG1, CL6306.Contig1), the protein sequences of SRG1 and flavonol synthase (FLS) from different plants were aligned by CLUSTALW online2 with the default parameters and the phylogenetic tree was constructed by Mega 7.0 using the Neighbor-Joining method with 1000 bootstrap replications (Kumar et al., 2016). The evolutionary distances were computed using the Poisson correction method. The phylogenetic tree was rooted with the outgroup of flavanone-3-hydroxylase (F3H) protein sequences from Arabidopsis thaliana, Chrysanthemum × morifolium, C. sinensis, and Vitis rotundifolia. The motifs of the SRG1 sequences were predicted by Multiple Em for Motif Elicitation (MEME) Version 4.11.2 online3.
Quantitative Real-Time PCR Analysis
A total of 1 μg of extracted total RNA was used to synthesize first-strand cDNA with the RevertAidTM First Strand cDNA Synthesis Kit (Fermentas, Canada) as described in the manual. QRT-PCR analysis was performed in a 25 μl volume containing 9.5 μl ddH2O, 1 μl primers, 2 μl cDNA, and 12.5 μl SYBR Premix EX Taq (Takara, Japan). The qRT-PCR primers were listed in Table 1 and Supplementary Table S1. The GAPDH (GenBank: GE651107) of tea plant was used as the reference gene. The primers are F: TTGGCATCGTTGAGGGTCT and R: CAGTGGGAACACGGAAAGC. The following procedure was used on a CFX96 Real-Time PCR Detection System (BioRad, USA): 95°C for 30 s, followed by 40 cycles of 95°C for 5 s and 60°C for 30 s. Relative expression was calculated with the 2-ΔΔCt method (Livak and Schmittgen, 2001). The statistical analysis was performed using Excel 2010 and SigmaPlot 13.0 (Systat Software, Canada). Student t-test was used to evaluate the difference between two samples and P < 0.05 was considered significant statistically. Each of the two samples has three biological replicates.
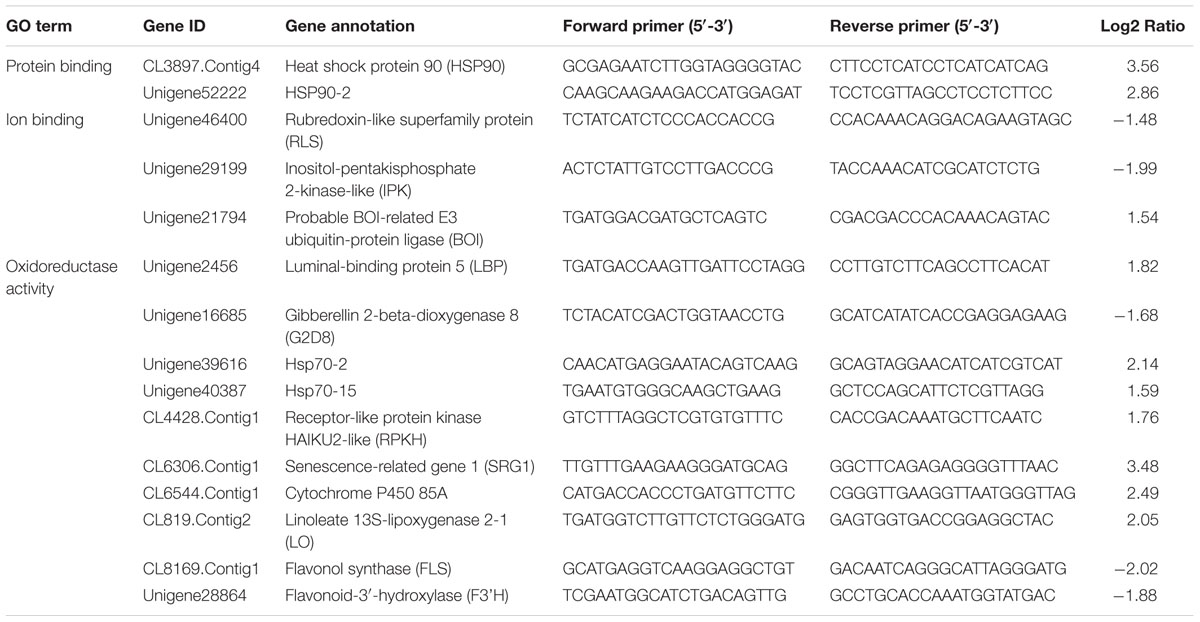
TABLE 1. The annotation of and primers for the genes verified by qRT-PCR.
Results
Phenotypic Changes in the Tea Plants after Shading
‘Huangjinya’ (Y) showed a significantly lighter leaf color and lower chlorophyll content than ‘Longjingchangye’ (LJ), a tea cultivar with green leaves (Figure 1).
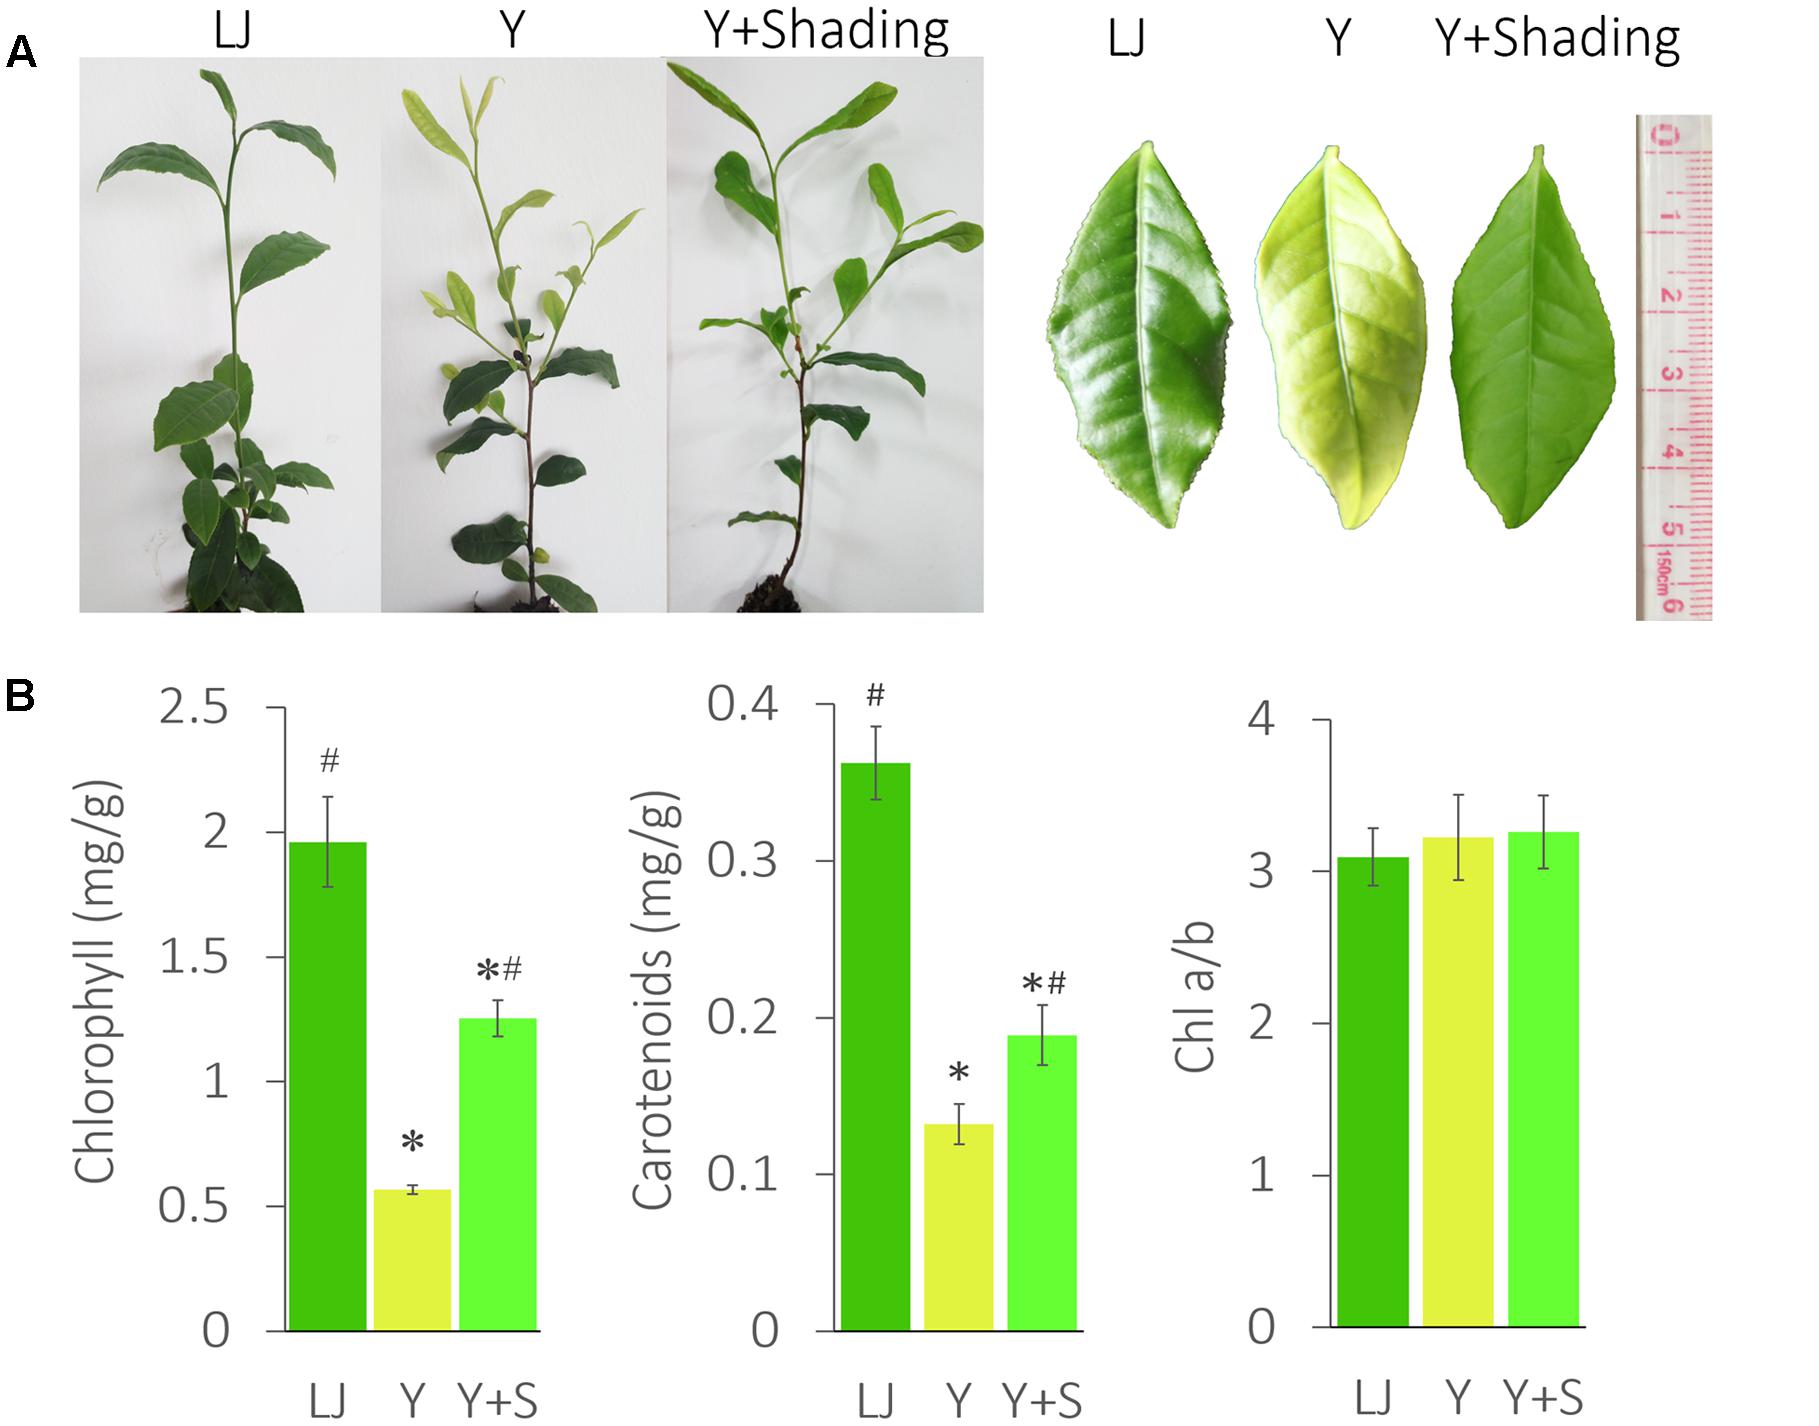
FIGURE 1. The phenotype and pigment changes in ‘Huangjinya.’ (A) The leaf color changes of ‘Huangjinya’ after shading. (B) The changes in chlorophyll and carotenoid content. LJ is the green tea cultivar ‘Longjingchangye,’ Y is ‘Huangjinya’ without shading, and Y+S is ‘Huangjinya’ with shading. ∗ indicates a significant difference compared to LJ (P < 0.05); # indicates a significant difference (P < 0.05) compared to Y. The data are presented as the mean ± standard deviation (n = 10).
The shaded ‘Huangjinya’ leaves (Y+Shading, Y+S) turned green within 7 days and were analyzed after 10 days. Chlorophyll content in shaded leaves clearly increased but was still lower than that in LJ plants. The carotenoid content changed in a manner similar to that observed for chlorophyll. Nevertheless, no significant difference was found in Chl a/b among the tea plants, indicating consistent photosynthetic performance in these tea plants.
De Novo Assembly
In order to explain the mechanism of color changes of ‘Huangjinya,’ the transcriptomes of ‘Huangjinya’ during sunlight and shading treatment were compared. A total of 32.5 billion nt of raw data were generated from Illumina HiSeq 4000 sequencing. All of the samples were high quality, with a minimum Q20 of 94.65% (Table 2). De novo assembly revealed 127,253 unigenes with a total length of 116.3 million nt, an average length of 914 nt and an N50 of 1,510 nt (Table 3). The length distribution of all of the unigenes was shown in Figure 2A. The assembly unigenes and expression data have been submitted to Gene expression Omnibus4 with accession number GSE97659.
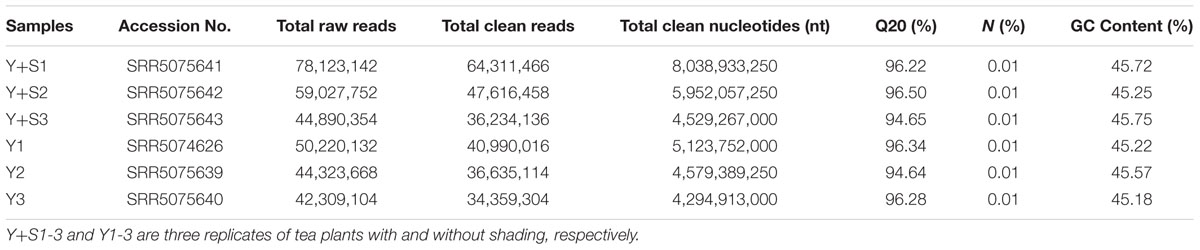
TABLE 2. Quality assessment of the raw data.
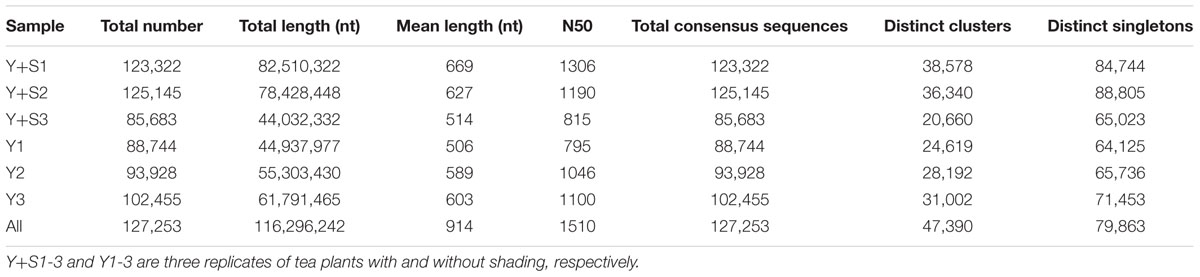
TABLE 3. Quality of the assembled unigenes.
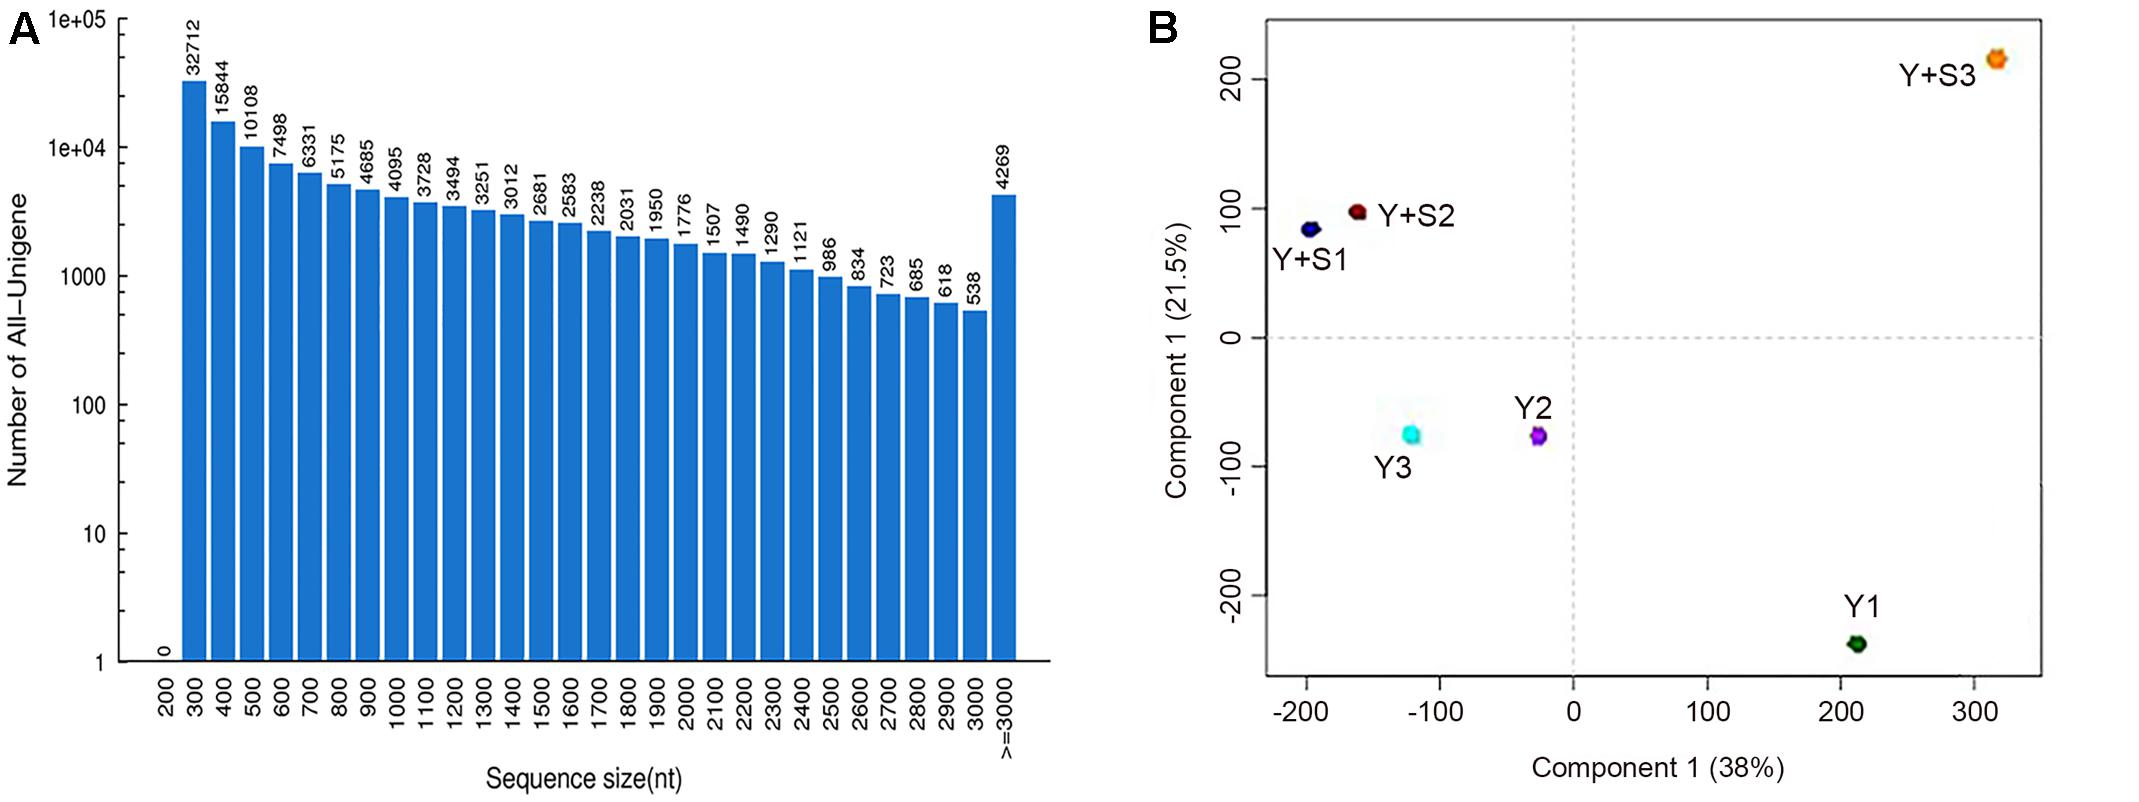
FIGURE 2. The sequence sizes of all the unigenes (A) and the correlation analysis of the samples (B). Y+S1-3 and Y1-3 are three replicates of tea plants with and without shading, respectively.
Principal component analysis (PCA) revealed that Y+S3 in the shaded group (with correlation coefficients of 0.71 and 0.51 compared to Y+S1 and Y+S2, respectively) and Y1 in the control group (with correlation coefficients of 0.86 and 0.85 compared to Y2 and Y3, respectively) deviated from the other two replicates (Figure 2B). Therefore, these two samples were removed when predicting DEGs. The high correlation coefficients of 0.89 (Y+S1 vs. Y+S2) and 0.99 (Y2 vs. Y3) indicated that other two samples in each group could be integrated in the search for DEGs.
Functional Annotation of the Tea Leaf Transcriptome
We obtained 81,128 annotated genes for functional annotation analysis, including 74,923, 66,959, 48,987, 45,566, 29,478, and 55,711 unigenes annotated by the NR, NT, Swiss-Prot, KEGG, COG, and GO databases, respectively. As shown in Figure 3, most of the predicted genes were mapped to “general function prediction only,” “transcription” and “replication, recombination, and repair” in the COG functional classification analysis. NR classification analysis showed that tea transcriptome had the highest similarity to that of Vitis vinifera (43.5%). GO classification revealed that more than half biological processes gathered 10% unigenes. GO cellular component classification indicated that cell part, membrane and organelle enriched the most unigenes in “Huangjinya.” In addition, most of the unigenes were found to act on binding and catalytic activity from the GO function analysis.
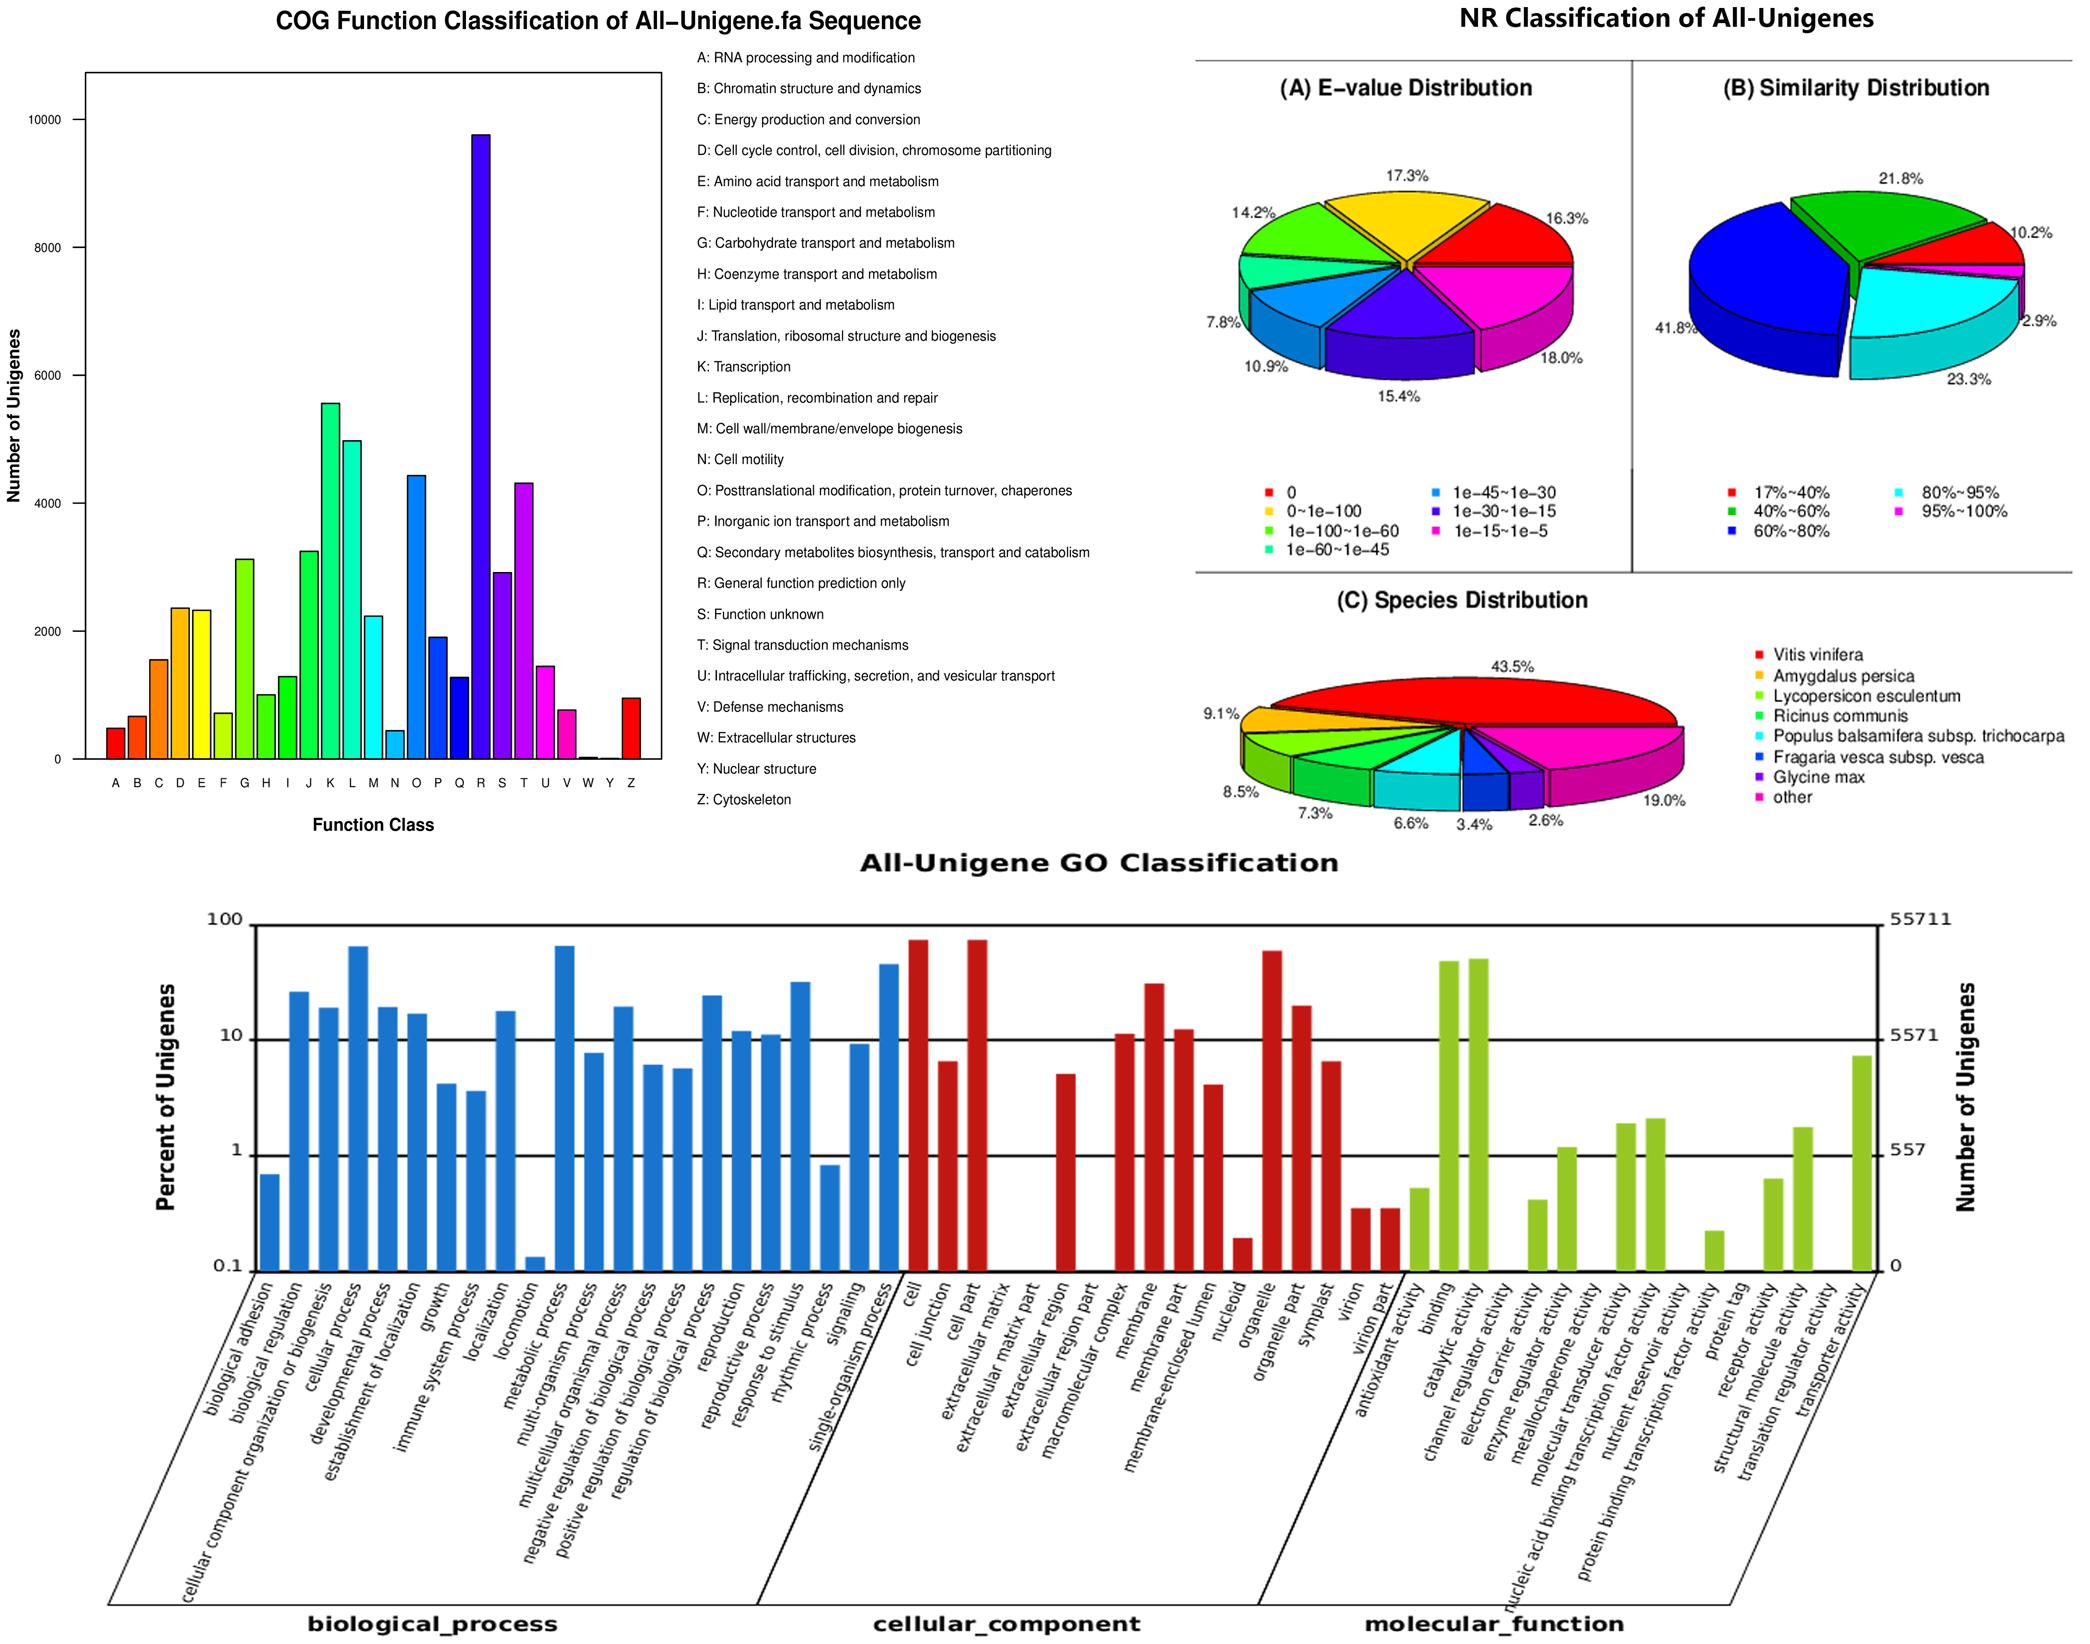
FIGURE 3. Functional annotation and classification of all the unigenes identified in the tea plant, as determined by the Cluster of Orthologous Groups (COG), Non-redundant (NR), and gene ontology (GO) databases.
For protein CD prediction analysis, a total of 81,573 proteins were identified, including 75,070 CDs from the protein databases by blastx and 6,503 predicted CDs from ESTScan analysis.
Gene Ontology and KEGG Analyses of Differentially Expressed Genes
A total of 207 DEGs, including 110 up-regulated and 97 down-regulated genes, were identified in the tea transcriptome after shading (Supplementary Table S2). As shown in Figure 4, GO analysis indicated that most of the DEGs were involved in the cellular process, metabolic process and response to stimulus. GO cellular component analysis revealed the cell part, membrane and organelle enriched the most DEGs. Meanwhile, GO function analysis showed that the DEGs contributed to binding and catalytic activity (oxidoreductase activity).
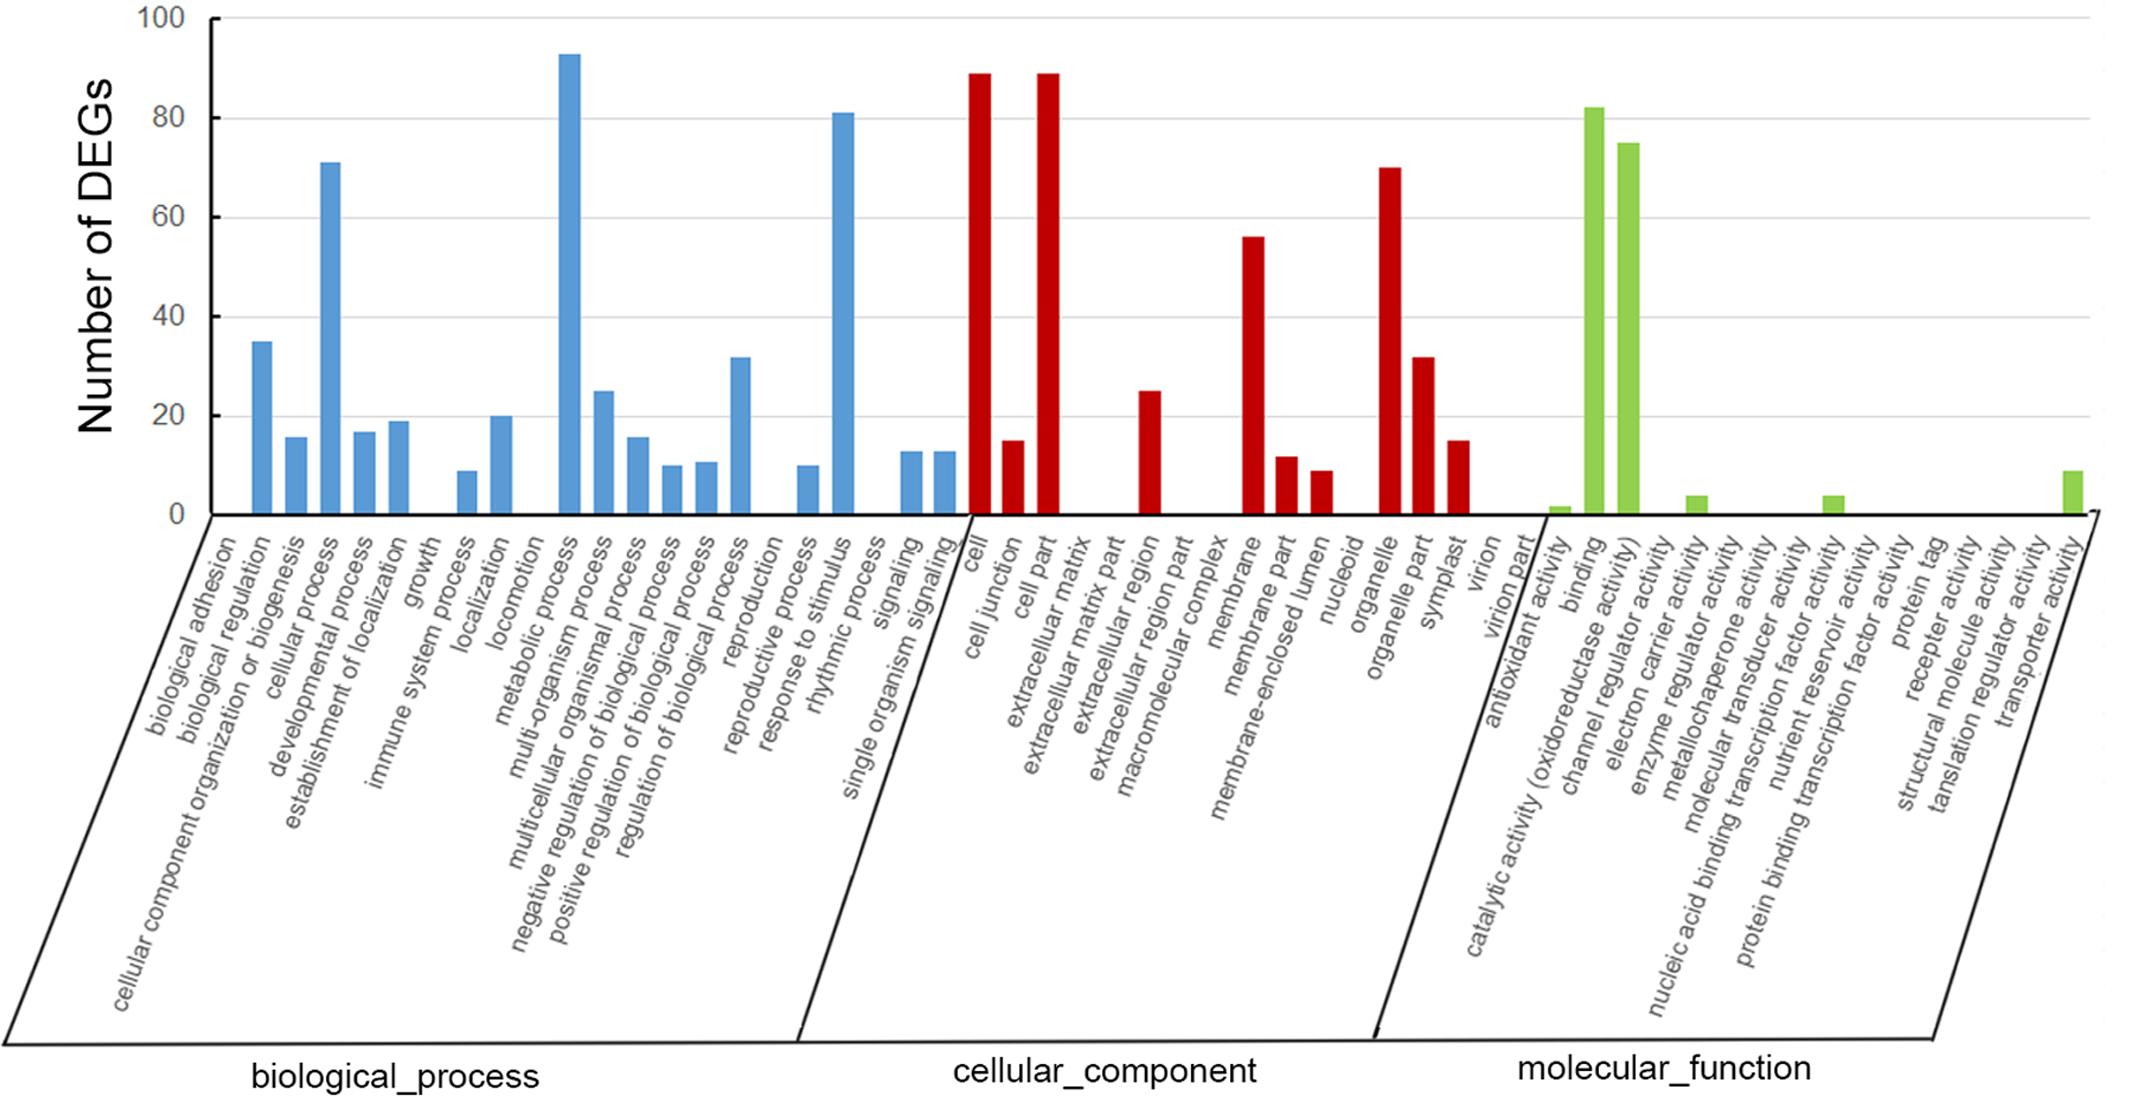
FIGURE 4. Gene ontology analysis of differentially expressed genes (DEGs) in ‘Huangjinya’ after shading treatment.
Kyoto Encyclopedia of Genes and Genomes enrichment analysis showed that these genes were involved in various metabolic pathways in tea plants (Figure 5). Most of the DEGs were enriched in protein processing (25.69%) and metabolism (30.28%). Flavonoid biosynthesis and linoleic acid metabolism pathways showed the highest enrichment factors. In addition, few DEGs were enriched in the photosynthesis pathway. Considering flavonoid-richness of tea and the color of ‘Huangjinya,’ we paid more attention to the metabolic pathways especially flavonoid and carotenoid biosynthesis. Besides FLS (CL8169.Contig2), another 2-oxoglutarate-dependent dioxygenase gene (SRG1, CL6306.Contig1) was differentially expressed and placed into the KEGG category flavonoid biosynthesis. Both SRG1 and FLS proteins contained two specific domains of DIOX_N and 2OG-FeII_Oxy which were conserved in 2OG-Fe(II) oxygenase superfamily (Figure 6 and Supplementary Figure S1). The phylogenetic tree showed that SRG1 proteins were classified into the same cluster, but deviated from all the FLS proteins, indicating that the SRG1 protein in tea plant is separate from FLS (Figure 7). Therefore, we suggest that SRG1 and FLS are different proteins but paralogs.
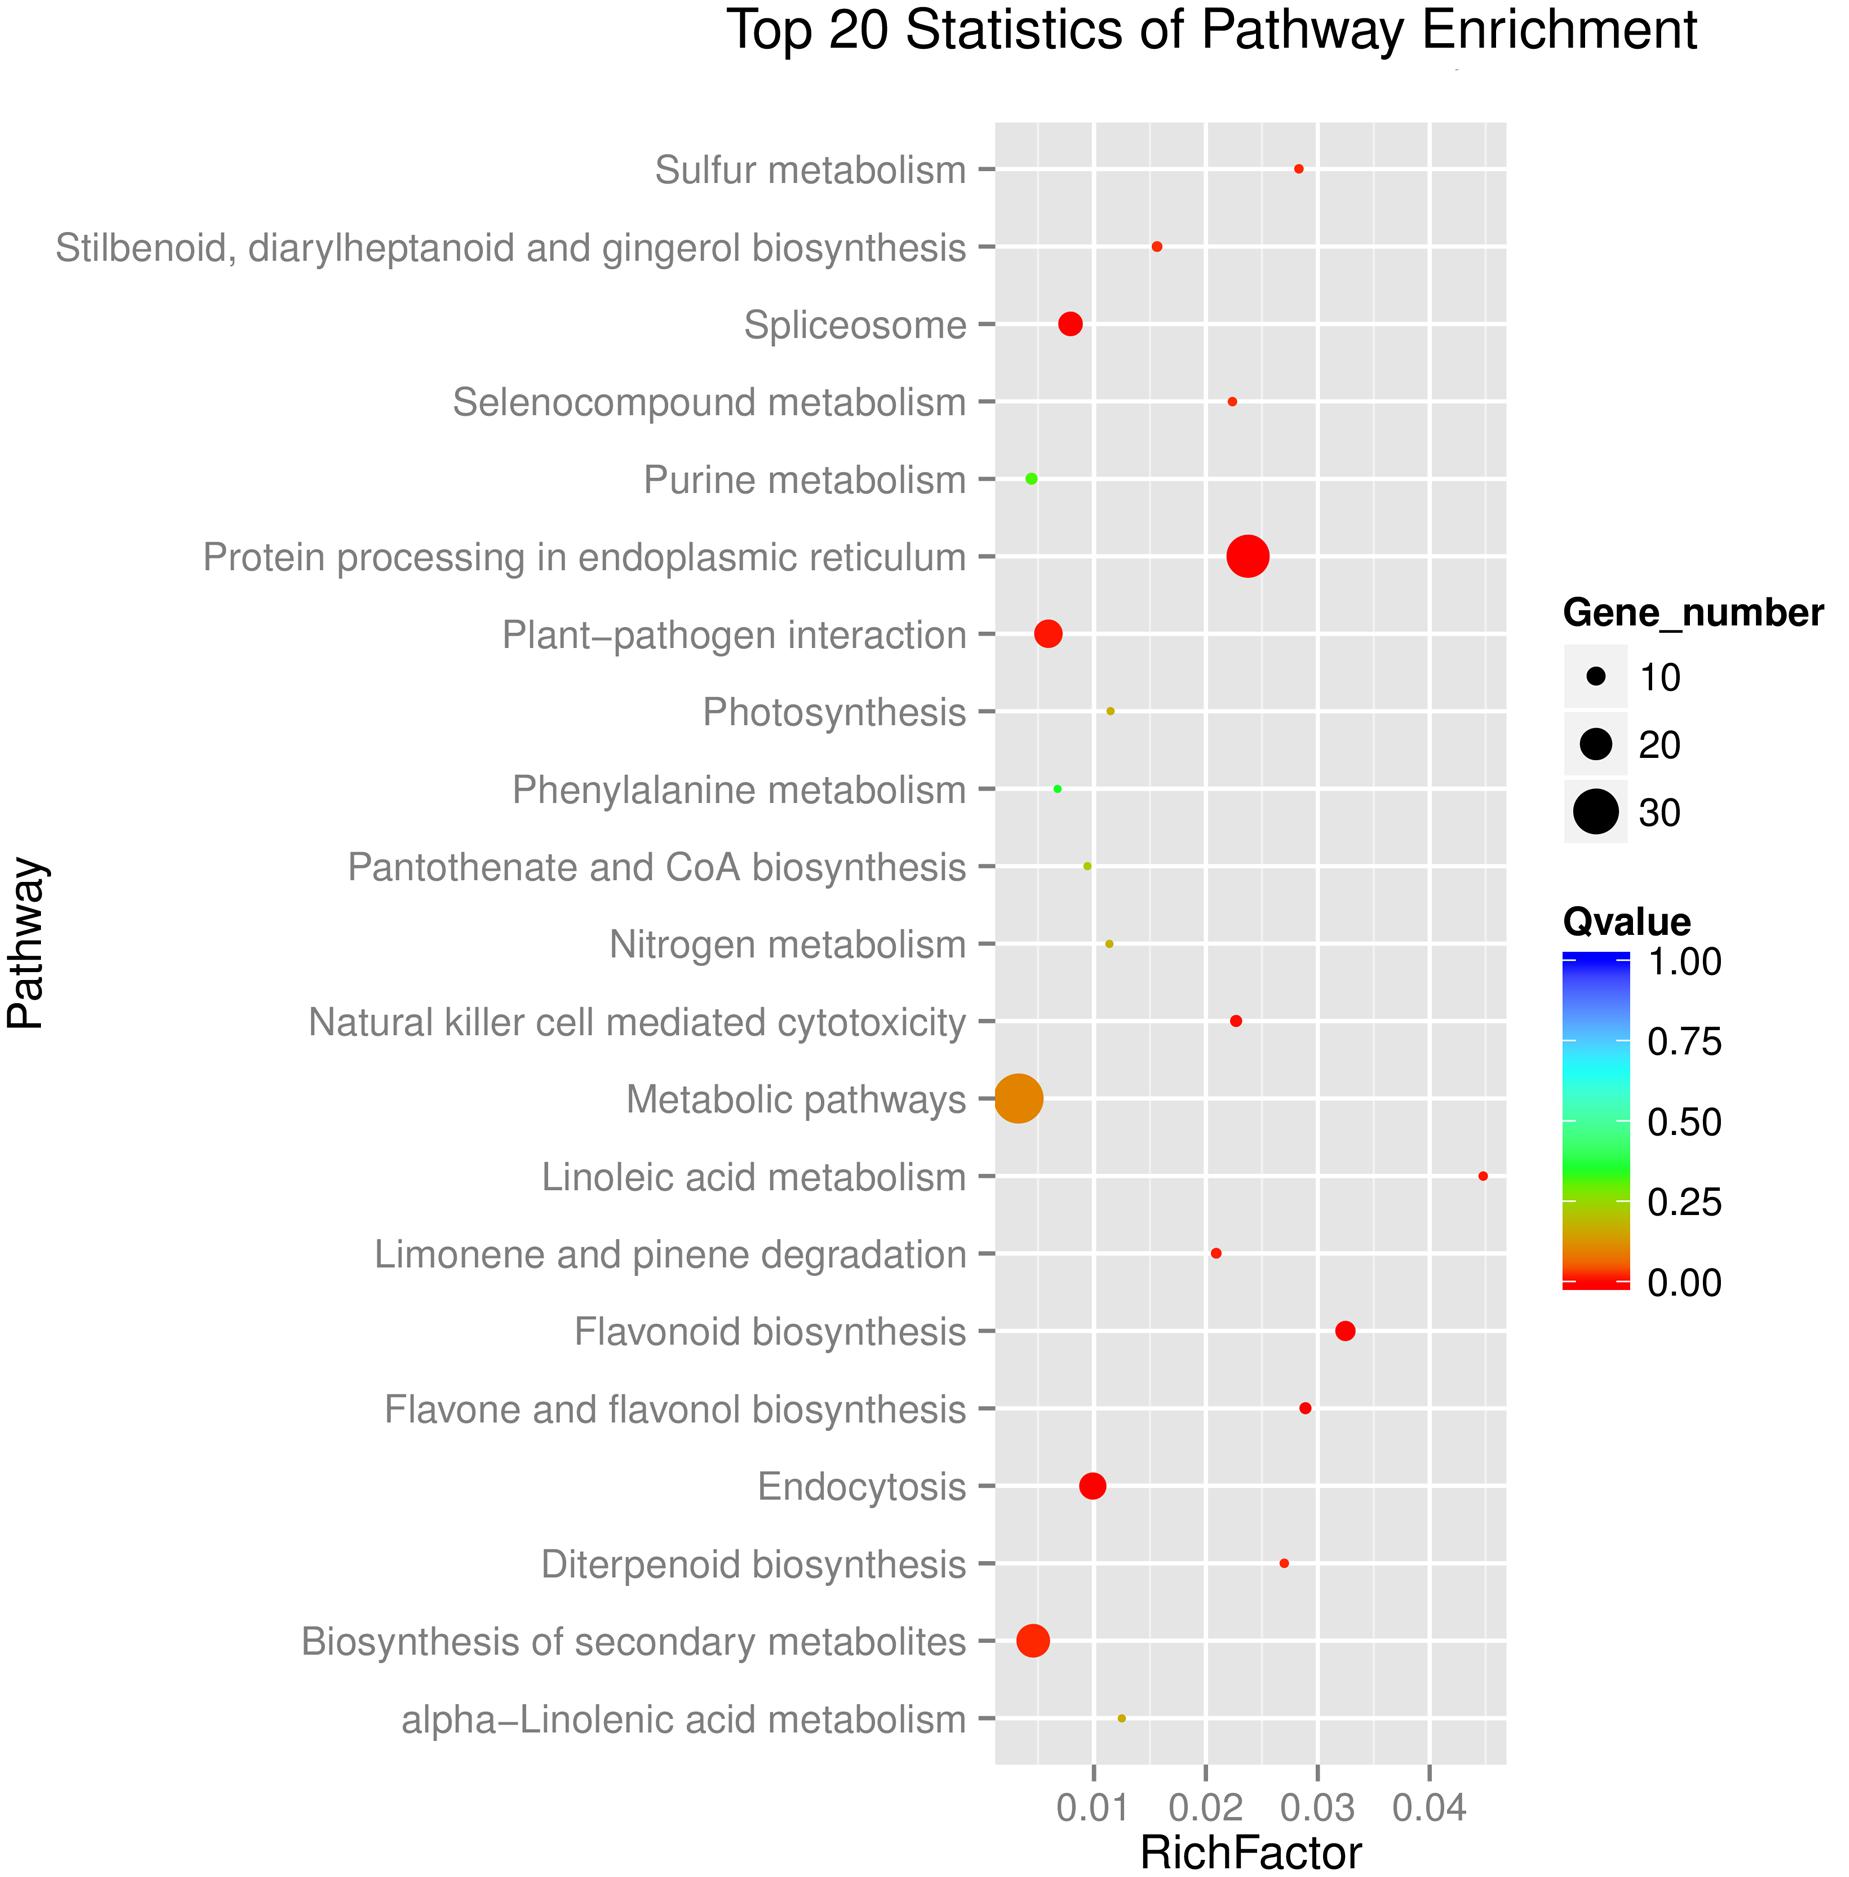
FIGURE 5. Functional distribution of the DEGs in the tea plant transcriptome. The enrichment factor is the ratio between DEGs in the pathway and all the annotated genes in the tea transcriptome. A large enrichment factor denotes a high degree of enrichment. The lower the Q-value is, the more significant the enrichment of the DEG.
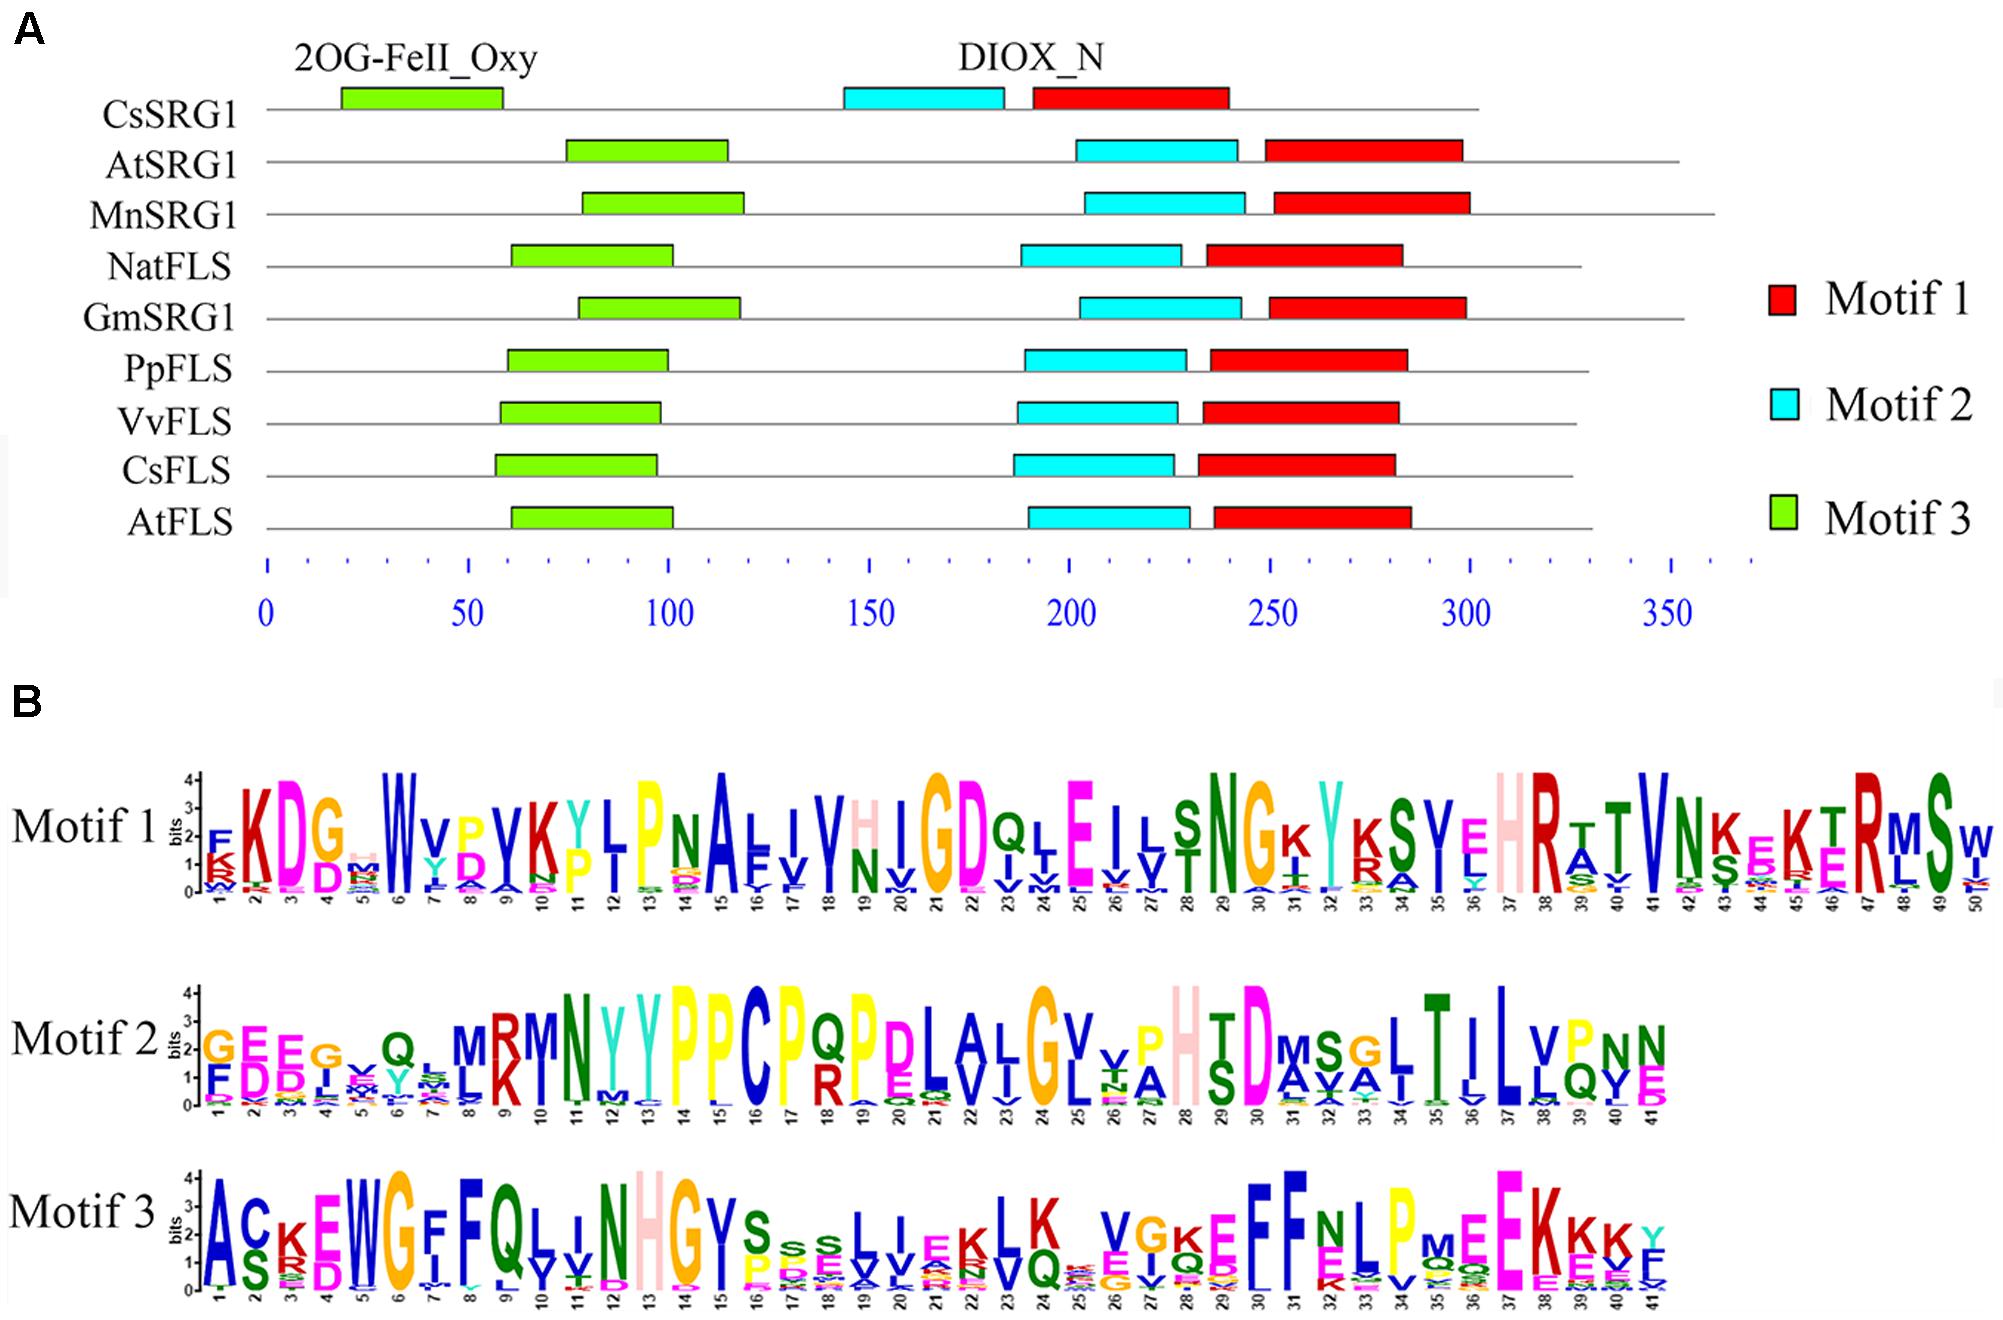
FIGURE 6. The motif analysis of senescence-related gene 1 (SRG1) and flavonol synthase (FLS) proteins from different plants. (A) The sequence alignment of SRG1 and FLS proteins. Camellia sinensis (CsSRG1, CL6306.Contig1; CsFLS, ABM88786.1), Arabidopsis thaliana (AtSRG1, Q39224.1; NP_001190266.1), Morus notabilis (MnSRG1, XM_010096827.1), Glycine max (GmSRG1, XM_003540470.3), Narcissus tazetta (NatFLS, AFS63899.1), Prunus persica (PpFLS, AJO70134.1), Vitis vinifera (VvFLS, BAE75810.1). (B) Motif sequences of the SRG1 and FLS proteins.
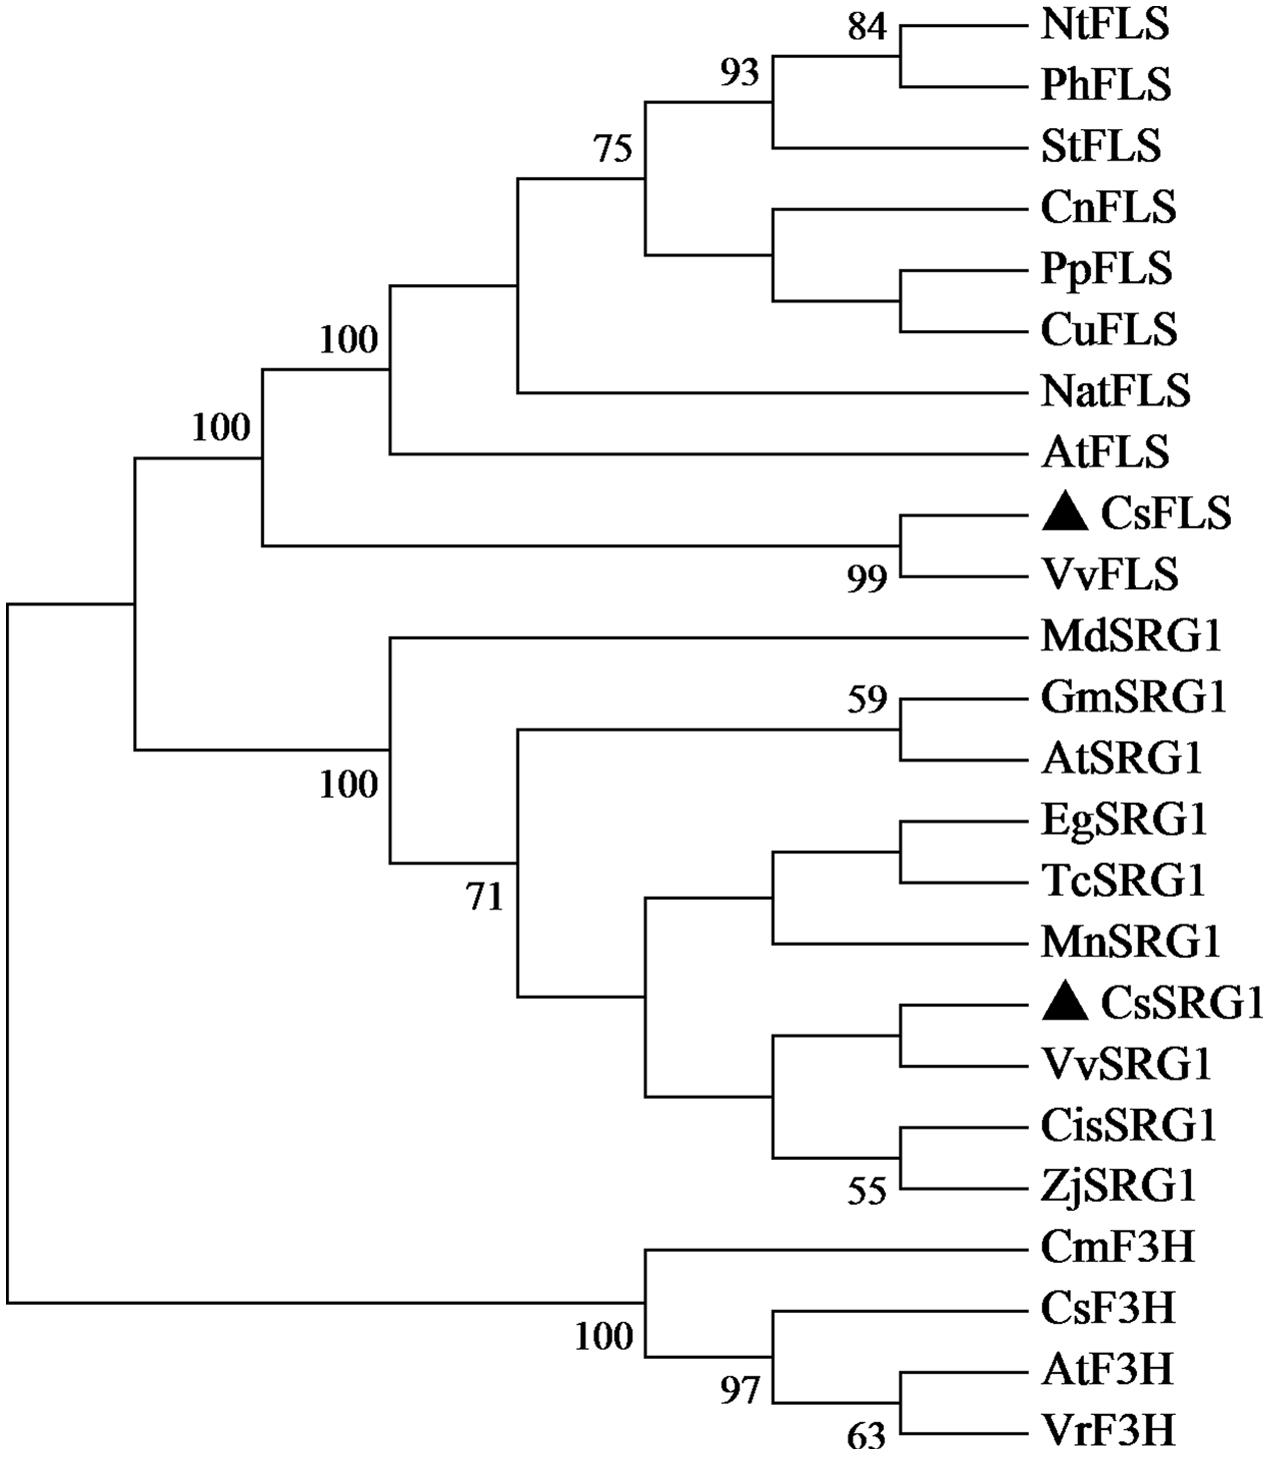
FIGURE 7. Phylogenetic tree of SRG1 and FLS genes. Camellia sinensis (CsSRG1, CL6306.Contig1; CsFLS, ABM88786.1; CsF3H, AAT68774.1), Eucalyptus grandis (EgSRG1, XM_018872917.1), Theobroma cacao (TcSRG1, XM_018123779.1), Vitis vinifera (VvSRG1, XM_002269051.2; VvFLS, BAE75810.1), Morus notabilis (MnSRG1, XM_010096827.1), Citrus sinensis (CisSRG1, XM_006489576.2), Ziziphus jujuba (ZjSRG1, XM_016021136.1), Glycine max (GmSRG1, XM_003540470.3), Arabidopsis thaliana (AtSRG1, Q39224.1; AtFLS, NP_001190266.1; AtF3H, NP_190692.1), Malus domestica (MdSRG1, XM_017335001.1), Narcissus tazetta (NatFLS, AFS63899.1), Nicotiana tabacum (NtFLS, ABE28017.1), Petunia hybrida (PhFLS, CAA80264.1), Solanum tuberosum (StFLS, CAA63092.1), Camellia nitidissima (CnFLS, ADZ28516.1), Prunus persica (PpFLS, AJO70134.1), Citrus unshiu (CuFLS, Q9ZWQ9.1), Chrysanthemum × morifolium (CmF3H, AEP37359.1), Vitis rotundifolia (VrF3H, AGS57503.1).
Relative Expression of the Differentially Expressed Genes
QRT-PCR was used for verification of the RNA-Seq results and samples used for qRT-PCR verification were independent of that for RNA-Seq analysis. Fifteen DEGs were selected for qRT-PCR verification (Figure 8). Of these genes, 2 were involved in ATP binding, 3 were associated with ion binding, and 10 were encoded proteins with oxidoreductase activity. The expression profile of most of the selected genes was similar in the qRT-PCR and RNA-Seq analyses, demonstrating that the RNA-Seq data was reliable.
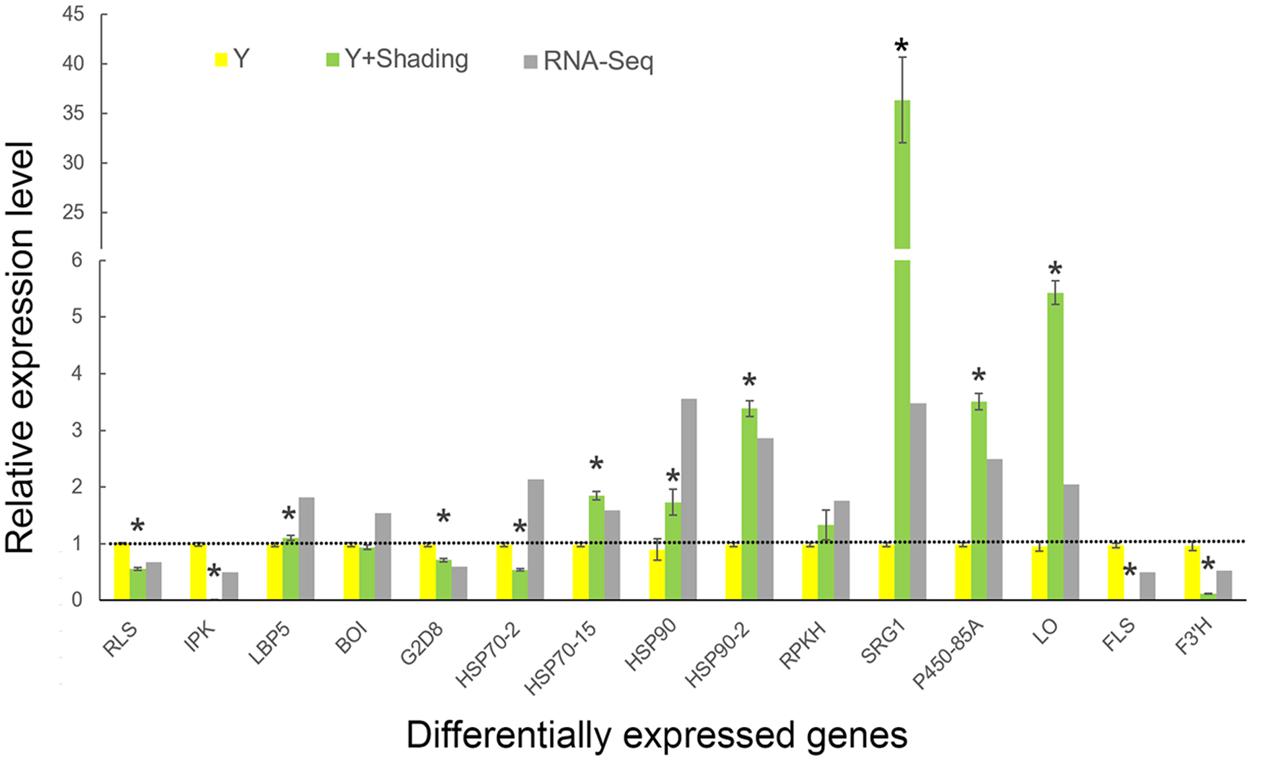
FIGURE 8. Comparison of RNA-Seq data and quantitative RT-PCR verification of the DEGs. Yellow and green bars represent expression of DEGs based on qRT-PCR data. Y indicates ‘Huangjinya’ exposed to sunlight. Gray bars represent fold change of DEG expression levels after shading based on RNA-Seq data. DEG expression levels under sunlight from RNA-Seq data were considered as 1, which were displayed as the dotted line. The qRT-PCR data were presented as the mean ± standard deviation (n = 3). ∗ means expressed significantly compared to Y (P < 0.05).
Flavonoid and carotenoid biosynthetic metabolisms are two important pathways associated with oxidoreductase activity. The expression of all genes associated with flavonoid and carotenoid biosynthesis were evaluated except for DEGs identified by RNA-Seq analysis (CL8169.Contig1, CL8169.Contig1, Unigene28864). QRT-PCR analysis showed that, with the exception of the leucoanthocyanidin dioxygenase gene (LODX), the genes involved in flavonoid synthesis were down-regulated in shading (Figure 9). In contrast, the genes associated with carotenoid biosynthesis were up-regulated in shading (Figure 10). These genes were not differentially expressed in RNA-Seq analysis may be due to the strict parameter setting of DEGs screening.
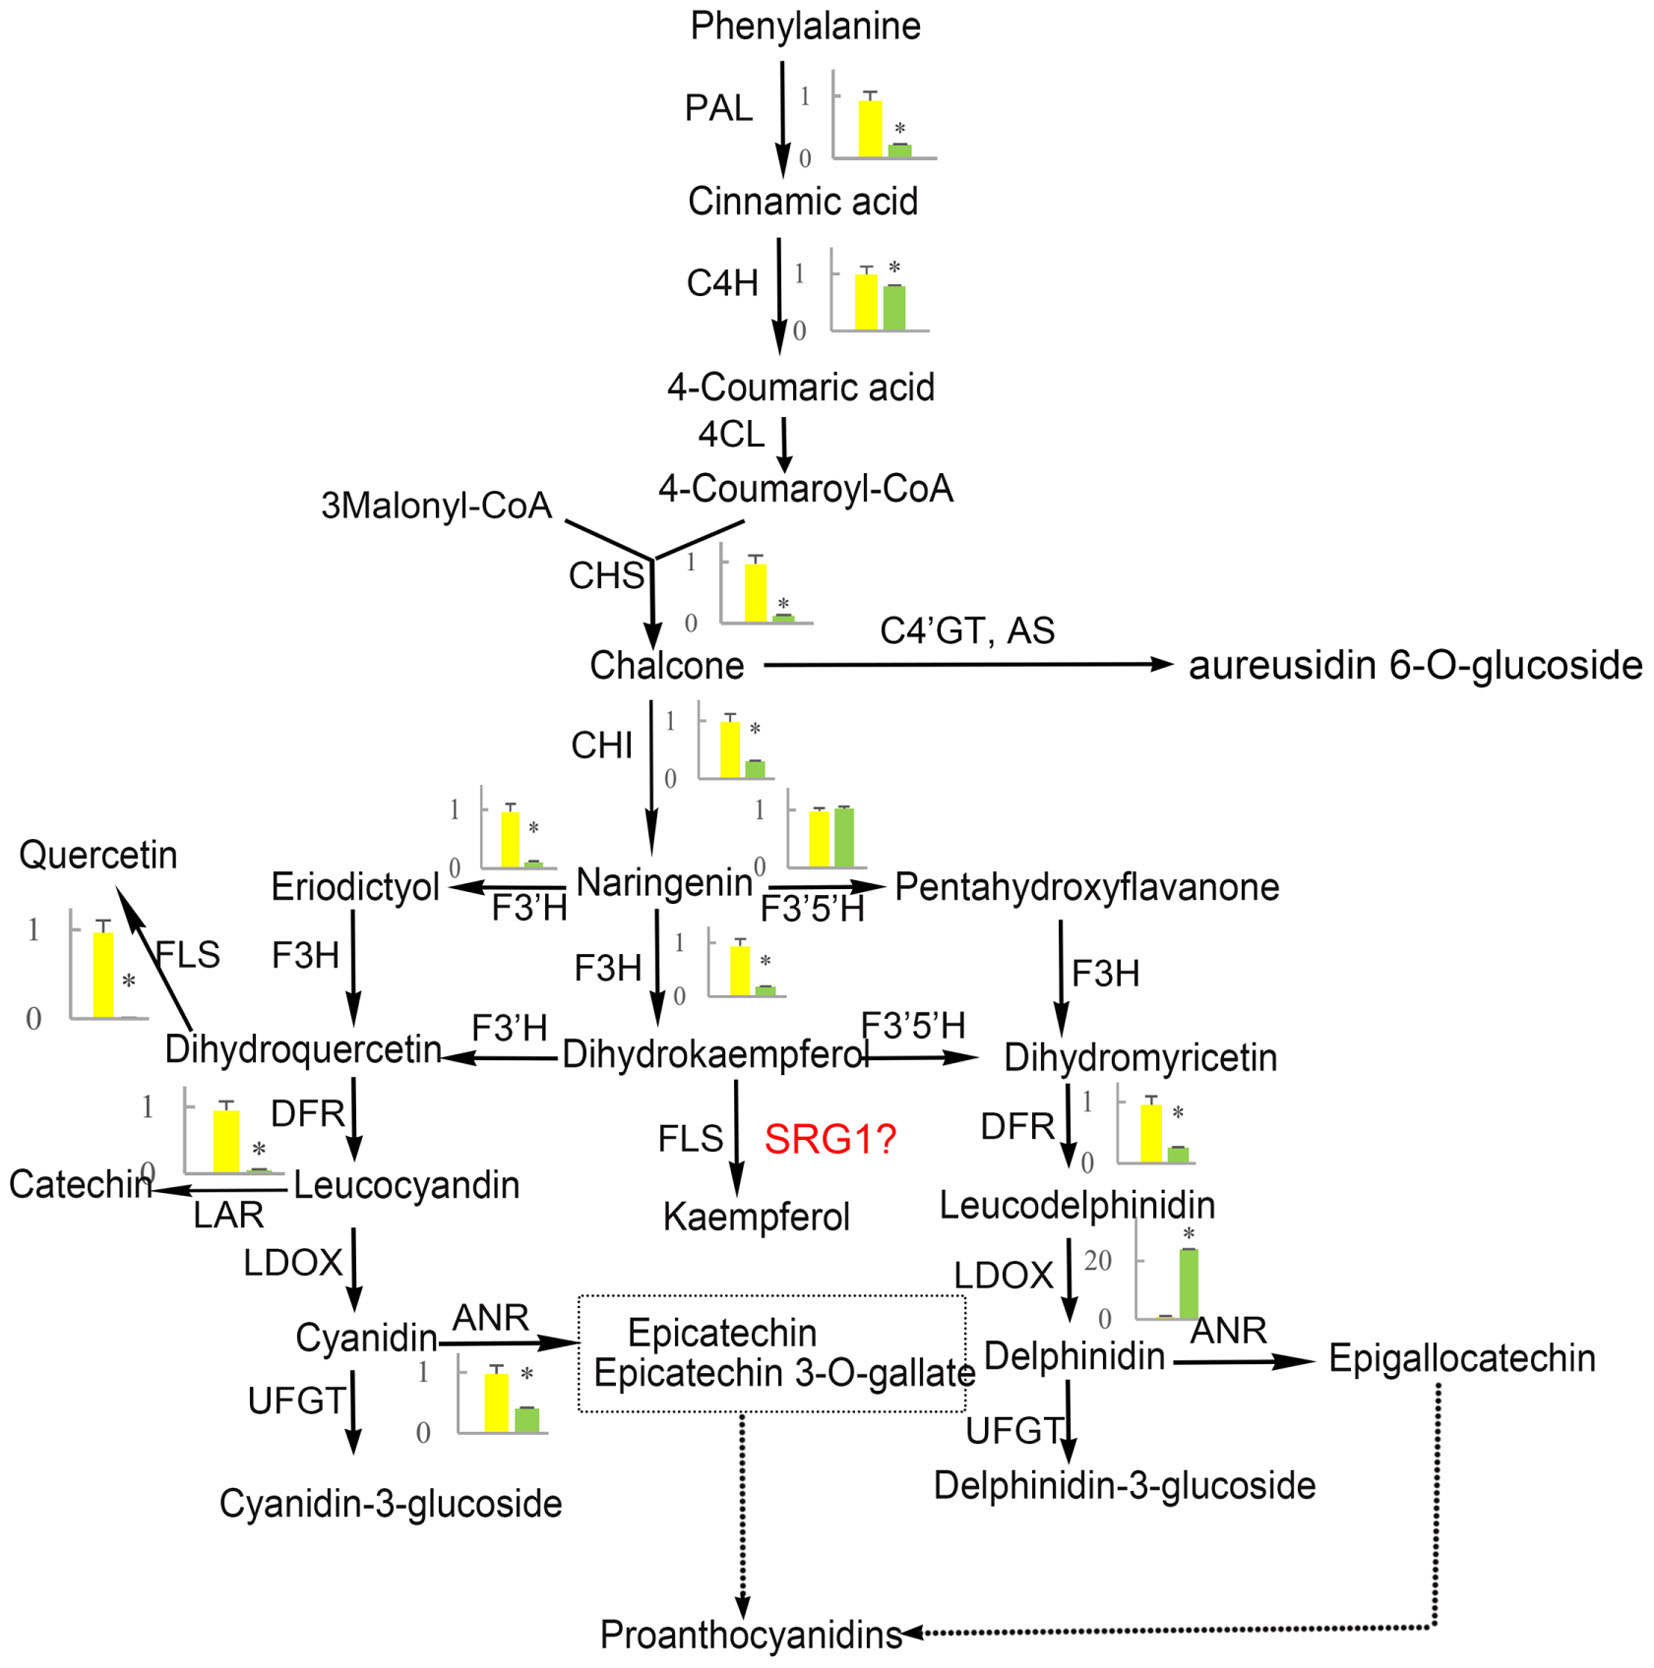
FIGURE 9. The effect of shading on the expression of flavonoid synthesis-related genes in ‘Huangjinya.’ PAL, phenylalanine ammonia-lyase; C4H, cinnamate 4-hydroxylase; 4CL, 4-coumarate: CoA-ligase; CHS, chalcone synthase; AS, aureusidin synthase; C4′GT, chalcone 4′-O-glucosyltransferase; CHI, chalcone isomerase; F3H, flavanone-3-hydroxylase; F3′H, flavonoid 3′-hydroxylase; F3′5′H, flavonoid 3′,5′-hydroxylase; FLS, flavonol synthase; DFR, dihydroflavonol 4-reductase; LDOX, leucoanthocyanidin dioxygenase; UFGT, UDP-glucose:flavonoid 3-O-glucosyltransferase; LAR, leucoanthocyanidin reductase; ANR, anthocyanidin reductase. Green and yellow represent the gene expression in ‘Huangjinya’ with and without shading, respectively. ∗ indicates a significant difference (P < 0.05).
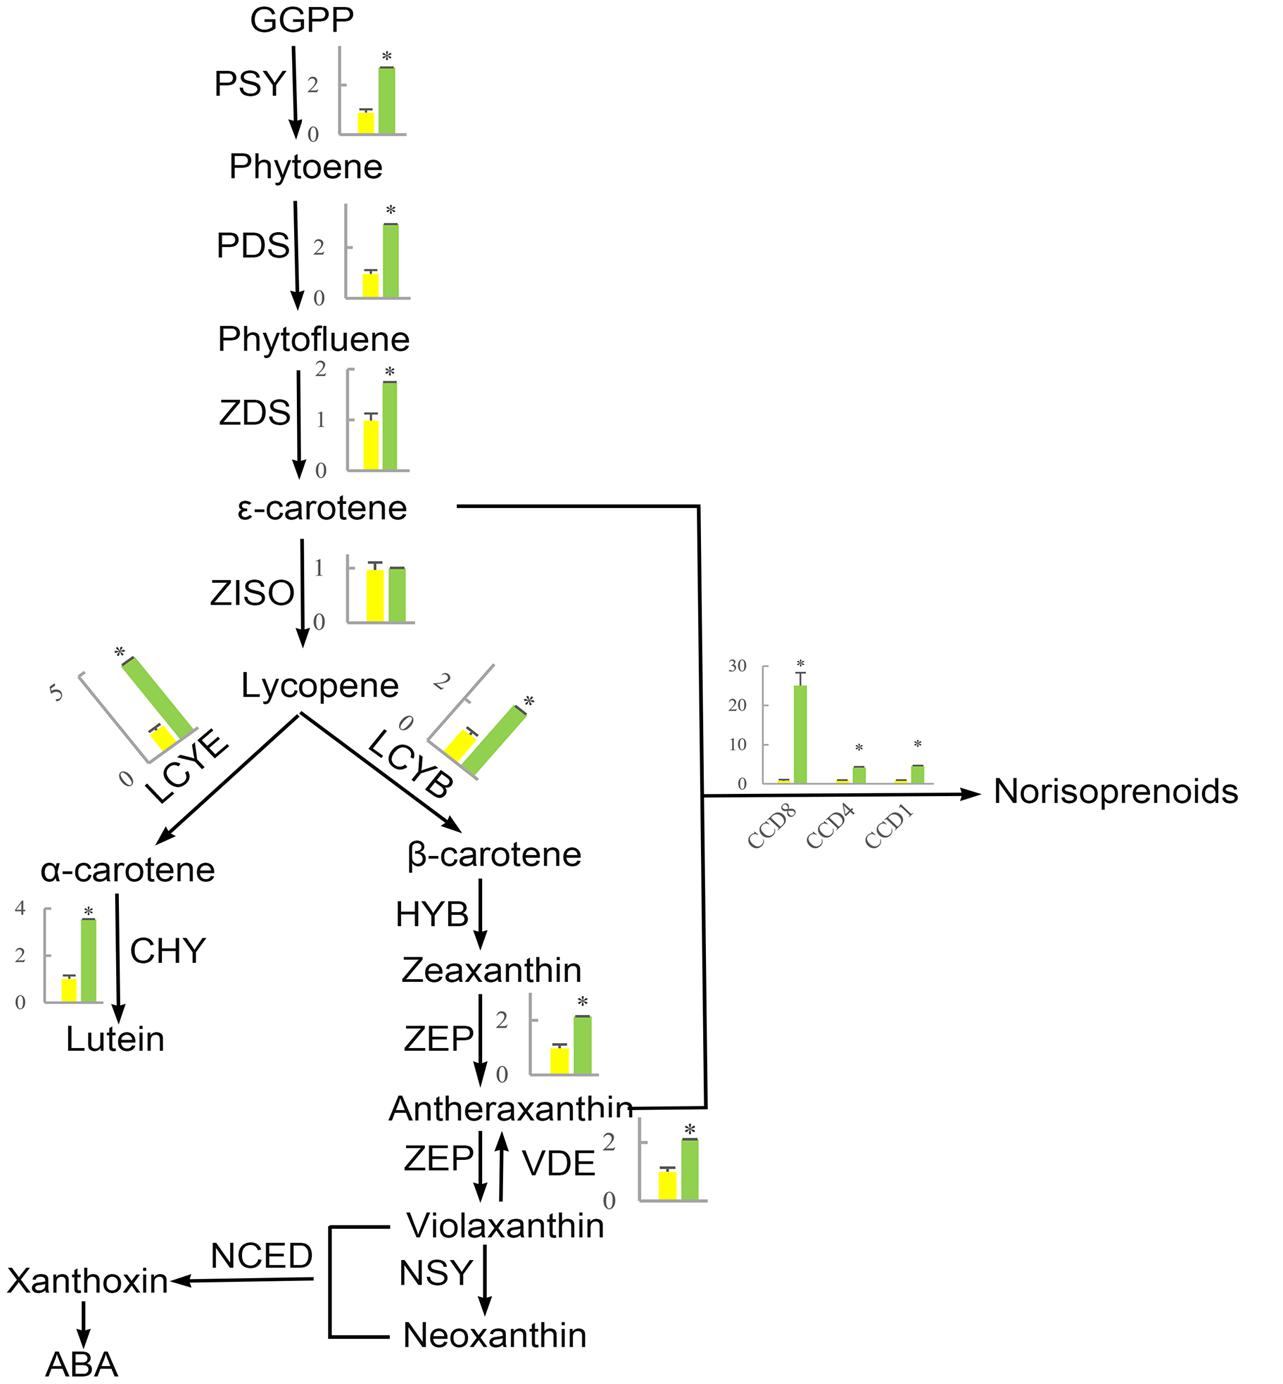
FIGURE 10. The effect of shading on the expression of carotenoid synthesis-related genes in ‘Huangjinya.’ PSY, phytoene synthase; PDS, phytoene desaturase; ZDS, ζ-carotene desaturase; ZISO, ζ-carotene isomerase; LCYE, lycopene 𝜀-cyclase; LCYB, lycopene β-cyclase; CHY, carotenoid hydroxylase; HYB, β-ring hydroxylase; ZEP, zeaxanthin epoxidase; VDE, violaxanthin de-epoxidase; NSY, neoxanthin synthase; NCED, 9-cis-epoxycarotenoid dioxygenase; CCD, carotenoid cleavage dioxygenase. Green and yellow bars represent the gene expression of ‘Huangjinya’ with and without shading, respectively. ∗ indicates a significant difference (P < 0.05).
Discussion
In this study, the transcriptome of a light-induced albino tea cultivar ‘Huangjinya’ was analyzed by RNA-Seq to explore the mechanisms responsible for the color changes in its leaves. Two hundred and seven genes were differentially expressed in shaded plants and plants grown under natural light. Data mining of comparative transcriptomes revealed that these DEGs are mainly involved in oxidoreductase activity and binding. KEGG pathway analysis indicated that metabolic pathways, including the carotenoid and flavonoid biosynthetic pathways, play important roles in the color change mechanisms of ‘Huangjinya.’
Flavonoid Biosynthesis is Responsible for Light-Induced Color Changes in Tea Leaves
Flavonoid biosynthesis is catalyzed by a series of enzymes, including oxoglutarate-dependent dioxygenases (F3H, FLS, and LDOX), NADPH-dependent reductases [dihydroflavonol 4-reductase (DFR)], and cytochrome P450 hydroxylases [flavonoid 3′-hydroxylase (F3′H) and flavonoid 3′,5′-hydroxylase (F3′5′H), Figure 9]. Our results indicated that, with the exception of F3′5′H and LDOX, all of the genes in the flavonoid biosynthesis pathway were down-regulated by shading. Meanwhile, the suppression of these genes promoted the production of catechins. This is not the first report about the negative correlation between catechin content and expression of flavonoid biosynthesis-related genes. The same result has been reported in another albino tea cultivar ‘Anjibaicha’ which showed that the expression of PAL controlling the first step of flavonoid biosynthesis was negatively associated with catechin (r = -0.683) or total polyphenol accumulation (r = -0.717) (Xiong et al., 2013). In addition, in a normal green tea cultivar ‘Shuchazao,’ the expression of flavonoid biosynthesis-related genes was also supressed by shading (Wang et al., 2012). However, there is a positive correlation between catechin content and expression of flavonoid biosynthesis-related genes in ‘Shuchazao.’ Nevertheless, in ‘Huangjinya,’ the expression of flavonoid biosynthesis associated genes was inhibited but polyphenols (whose major constitutes are catechins) were elevated after moderate shading (Li et al., 2016). However, tea polyphenols decreased under strong shading, suggesting tea polyphenols may be affected significantly by degree of shading. In our experiment, ‘Huangjinya’ were just shaded by a single layer shade net with about 45% decrease of light intensity, which conformed with the moderate shading by Li et al. (2016). As for increase of polyphenols under strong shading, it may be considered to be a possible stress induced by the light which is too weak to afford normal activities of plants.
It has been proved that chalcone and aureusidin are yellow pigments and contribute to the coloration of yellow flowers (Nakayama et al., 2000; Ono et al., 2006). In carnation, mutation of chalcone isomerase (CHI) and DFR led to the accumulation of chalcone 2′-glucoside and produced yellow flowers (Itoh et al., 2002). As well, knockdown of endogenous DFR and F3H from Antirrhinum would block anthocyanin biosynthesis and result in yellow flowers. In tea plants, yellow leaves of ‘Huangjinya’ showed obvious lower total catechins (precursor for biosynthesis anthocyanin) than green tea leaves (Feng et al., 2014), suggesting that the catechins biosynthesis was inhibited. Given that the negative correlation of polyphenols and the expression flavonoid biosynthesis-related genes in ‘Huangjinya,’ we surmise that light-induced expression of flavonoid biosynthesis-related genes would suppress the accumulation of polyphenols. This may be a part of the reason for the light color of ‘Huangjinya’ plants grown in sunlight.
Another cause of yellow color of ‘Huangjinya’ may be due to the antioxidative activity of flavonoids. Solar UV-B radiation may cause serious damage including reduction of the photosynthetic fluorescence parameters, thylakoid electron transport, and photosynthetic pigments (chlorophyll and carotenes), and then induce lipoperoxidation in chloroplast membranes (Lidon and Ramalho, 2011). Activation of flavonoid biosynthesis exposed to light may be a response that protects tea leaves from the damages caused by sunlight-derived UV irradiation (Agati et al., 2012). However, the lower flavonoid content in ‘Huangjinya’ plants grown under sunlight make it difficult to resist UV-induced damages. Shading increased catechins and avoided UV-induced damage, and then made the leaf color turn green.
In addition to the well-known flavonoid synthesis-related genes, a novel gene SRG1 was also mapped flavonoid biosynthesis in the present work. Although many SRG1 genes have been released, their function is still unclear. The first report of SRG1 showed that SRG1 gene was expressed in senescing organs of Arabidopsis (Callard et al., 1996). Recently, the SRG1 was found to have flavonoid-related functions in rice (Kim et al., 2013). In our study, the SRG1 was mapped on the same position of FLS in KEGG pathway analysis. However, if SRG1 also contribute to the catalysis of dihydroflavonols needs further confirmation. Moreover, SRG1 expression profile was opposite to FLS but similar to that of LDOX, indicating that functional differentiation occurred in the oxoglutarate-dependent dioxygenase gene family in flavonoid biosynthesis.
Carotenoid Biosynthesis is Responsible for ‘Huangjinya’ Color Changes
The first step in carotenoid biosynthesis is the production of phytoene from the condensation of geranylgeranyl diphosphate (GGPP) molecules, which are precursors of plastidial isoprenoids, including carotenoids (Bouvier et al., 2005; Ruiz-Sola et al., 2016). This biosynthetic process is catalyzed by phytoene synthase (PSY, Figure 10). Then, phytoene is sequentially desaturated and isomerized to produce phytofluene, 𝜀-carotene, and lycopene through desaturation reactions regulated by phytoene desaturase (PDS), ζ-carotene desaturase (ZDS), and ζ-carotene isomerase (ZISO), respectively. Furthermore, lycopene is cyclized to produce α-carotene and β-carotene, which are precursors of lutein (α-carotene) and zeaxanthin (β-carotene). In addition, carotenoids can be cleaved to produce apocarotenoids, including norisoprenoid, by carotenoid cleavage dioxygenases (CDDs) (Yahyaa et al., 2013; Hou et al., 2016).
The phenomenon that growing plants in the dark causes etiolation and that the green color could be recovered when the plants were returned to the light is previously known (Park et al., 2002; Tuan et al., 2013; Bou-Torrent et al., 2015). However, the opposite phenomenon appears to occur in ‘Huangjinya,’ which has yellow leaves when exposed to sunlight but green leaves when shaded. The etiolated leaves of ‘Huangjinya’ showed low carotenoid and total chlorophyll levels. However, both carotenoid and chlorophyll levels increased after shading (Figure 1). This observation is consistent with the expression patterns of carotenoid biosynthesis-related genes which were induced by shading treatment (Figure 10). Our result is similar to a previous study which found that down-regulation of PSY gene result in yellow leaves of Oncidium hybrid orchid (Liu et al., 2014). Silencing of PSY also impaired the chloroplast apparatus and chlorophyll level, and then reduce the photosynthetic efficiency (Liu et al., 2014). As well, the expression of carotenoid biosynthesis-related genes in this study is consistent with the study by Li et al. (2016) which showed that the expression of most carotenoid biosynthesis-related genes increased after moderate shading, and PDS, ZDS, lycopene 𝜀-cyclase (LCYE) increased significantly (P < 0.05). In ‘Huangjinya,’ carotenoid biosynthesis is light-sensitive and all of the carotenoid biosynthesis-related genes were down-regulated exposure to sunlight. These results support the notion that carotenoid biosynthesis in young leaves of ‘Huangjinya’ is inhibited by suppressing the expression of related genes under the light condition.
Other Potential Mechanisms Involved in the Leaf Color Changes
In this study, some stress responsive genes were induced by the shading of ‘Huangjinya,’ especially heat shock proteins 70 and 90 (HSP70 and HSP90, Figure 8), which are cellular chaperones that participate in many cellular processes and are sensitive to heat stress. Chloroplast HSP90 could function within a chaperone complex that includes Tic110, Tic40, Toc75, Tic22, and stromal chaperones (HSP70 and HSP93) in the chloroplast stroma to promote membrane translocation during protein import into the chloroplast (Inoue et al., 2013). Additionally, the chloroplast-targeted HSP70 contributes to the molecular protection and repair of photosystem II during and after photoinhibition (Schroda et al., 1999). Stromal HSP70 has been found to interact with PDS in the chromoplasts of Narcissus pseudonarcissus (Bonk et al., 1996). Thus, shade-induced gene expression of these HSPs suggest potential roles in carotenoid biosynthesis in ‘Huangjinya.’
Conclusion
Exposure to sunlight would inhibit the production of carotenoids and flavonoids in ‘Huangjinya’ by regulating flavonoid and carotenoid biosynthesis associated genes, and then result in the yellow color of ‘Huangjinya.’ Meanwhile, shading could reverse the process of flavonoid and carotenoid biosynthesis, and made the leaf color turn green. Thus, the leaf color changes in ‘Huangjinya’ are largely determined by the combined effects of flavonoid and carotenoid biosynthesis.
Author Contributions
LS and XL designed the experiment. QM carried out most of the experiments and drafted manuscript. ZZ, KS, and YY did the data analyses. JT and NK revised and finalized the paper.
Conflict of Interest Statement
The authors declare that the research was conducted in the absence of any commercial or financial relationships that could be construed as a potential conflict of interest.
Acknowledgments
This work was supported financially by Shandong Province Modern Agricultural Technology System Innovation Team (SDAIT-19-02), the China Earmarked Fund for Modern Agro-industry Technology Research System (CARS-23), and the National Natural Science Foundation of China (31570689).
Supplementary Material
The Supplementary Material for this article can be found online at: http://journal.frontiersin.org/article/10.3389/fpls.2017.00803/full#supplementary-material
Footnotes
- ^ http://www.phrap.org/
- ^ http://www.genome.jp/tools/clustalw/
- ^ http://meme-suite.org/tools/meme
- ^ https://www.ncbi.nlm.nih.gov/geo/
References
Agati, G., Azzarello, E., Pollastri, S., and Tattini, M. (2012). Flavonoids as antioxidants in plants: location and functional significance. Plant Sci. 196, 67–76. doi: 10.1016/j.plantsci.2012.07.014
Anders, S., and Huber, W. (2010). Differential expression analysis for sequence count data. Genome Biol. 11:R106. doi: 10.1186/gb-2010-11-10-r106
Audic, S., and Claverie, J.-M. (1997). The significance of digital gene expression profiles. Genome Res. 7, 986–995. doi: 10.1101/gr.7.10.986
Bonk, M., Tadros, M., Vandekerckhove, J., Al-Babili, S., and Beyer, P. (1996). Purification and characterization of chaperonin 60 and heat-shock protein 70 from chromoplasts of Narcissus pseudonarcissus. Plant Physiol. 111, 931–939. doi: 10.1104/pp.111.3.931
Bou-Torrent, J., Toledo-Ortiz, G., Ortiz-Alcaide, M., Cifuentes-Esquivel, N., Halliday, K. J., Martinez-Garcia, J. F., et al. (2015). Regulation of carotenoid biosynthesis by shade relies on specific subsets of antagonistic transcription factors and cofactors. Plant Physiol. 169, 1584–1594. doi: 10.1104/pp.15.00552
Bouvier, F., Rahier, A., and Camara, B. (2005). Biogenesis, molecular regulation and function of plant isoprenoids. Prog. Lipid Res. 44, 357–429. doi: 10.1016/j.plipres.2005.09.003
Callard, D., Axelos, M., and Mazzolini, L. (1996). Novel molecular markers for late phases of the growth cycle of Arabidopsis thaliana cell-suspension cultures are expressed during organ senescence. Plant Physiol. 112, 705–715. doi: 10.1104/pp.112.2.705
Conesa, A., Götz, S., García-Gómez, J. M., Terol, J., Talón, M., and Robles, M. (2005). Blast2GO: a universal tool for annotation, visualization and analysis in functional genomics research. Bioinformatics 21, 3674–3676. doi: 10.1093/bioinformatics/bti610
Feng, L., Gao, M.-J., Hou, R.-Y., Hu, X.-Y., Zhang, L., Wan, X.-C., et al. (2014). Determination of quality constituents in the young leaves of albino tea cultivars. Food Chem. 155, 98–104. doi: 10.1016/j.foodchem.2014.01.044
Grabherr, M. G., Haas, B. J., Yassour, M., Levin, J. Z., Thompson, D. A., Amit, I., et al. (2011). Full-length transcriptome assembly from RNA-Seq data without a reference genome. Nat. Biotechnol. 29, 644–652. doi: 10.1038/nbt.1883
Hou, X., Rivers, J., León, P., McQuinn, R. P., and Pogson, B. J. (2016). Synthesis and function of apocarotenoid signals in plants. Trends Plant Sci. 21, 792–803. doi: 10.1016/j.tplants.2016.06.001
Inoue, H., Li, M., and Schnell, D. J. (2013). An essential role for chloroplast heat shock protein 90 (Hsp90C) in protein import into chloroplasts. Proc. Natl. Acad. Sci. U.S.A. 110, 3173–3178. doi: 10.1073/pnas.1219229110
Iseli, C., Jongeneel, C. V., and Bucher, P. (1999). ESTScan: a program for detecting, evaluating, and reconstructing potential coding regions in EST sequences. Proc. Int. Conf. Intell. Syst. Mol. Biol. 99, 138–148.
Ismail, H., Dragišić Maksimović, J., Maksimović, V., Shabala, L., Živanović, B. D., Tian, Y., et al. (2015). Rutin, a flavonoid with antioxidant activity, improves plant salinity tolerance by regulating K+ retention and Na+ exclusion from leaf mesophyll in quinoa and broad beans. Funct. Plant Biol. 43, 75–86. doi: 10.1071/FP15312
Itoh, Y., Higeta, D., Suzuki, A., Yoshida, H., and Ozeki, Y. (2002). Excision of transposable elements from the chalcone isomerase and dihydroflavonol 4-reductase genes may contribute to the variegation of the yellow-flowered carnation (Dianthus caryophyllus). Plant Cell Physiol. 43, 578–585. doi: 10.1093/pcp/pcf065
Kim, C.-K., Lim, H.-M., Park, S.-H., Kim, A.-R., Lee, G.-S., Yoon, U.-H., et al. (2013). Multi-layered screening method identification of flavonoid-specific genes, using transgenic rice. Biotech. Biotechnol. Equip. 27, 3944–3951. doi: 10.5504/BBEQ.2013.0037
Kumar, S., Stecher, G., and Tamura, K. (2016). MEGA7: Molecular Evolutionary Genetics Analysis version 7.0 for bigger datasets. Mol. Biol. Evol. 33, 1870–1874. doi: 10.1093/molbev/msw054
Li, N., Yang, Y., Ye, J., Lu, J., Zheng, X., and Liang, Y. (2016). Effects of sunlight on gene expression and chemical composition of light-sensitive albino tea plant. Plant Growth Regul. 78, 253–262. doi: 10.1007/s10725-015-0090-6
Lidon, F., and Ramalho, J. (2011). Impact of UV-B irradiation on photosynthetic performance and chloroplast membrane components in Oryza sativa L. J. Photochem. Photobiol. B Biol. 104, 457–466. doi: 10.1016/j.jphotobiol.2011.05.004
Liu, J.-X., Chiou, C.-Y., Shen, C.-H., Chen, P.-J., Liu, Y.-C., Jian, C.-D., et al. (2014). RNA interference-based gene silencing of phytoene synthase impairs growth, carotenoids, and plastid phenotype in Oncidium hybrid orchid. Springerplus 3:478. doi: 10.1186/2193-1801-3-478
Livak, K. J., and Schmittgen, T. D. (2001). Analysis of relative gene expression data using real-time quantitative PCR and the 2-ΔΔCT method. Methods 25, 402–408. doi: 10.1006/meth.2001.1262
Mariya, J., Sasikumar, R., Balasubramanian, M., Saravanan, M., and RajKumar, R. (2003). Influence of light on catechin biosynthesis in tea. Tea 24, 80–86.
Nakabayashi, R., Yonekura-Sakakibara, K., Urano, K., Suzuki, M., Yamada, Y., Nishizawa, T., et al. (2014). Enhancement of oxidative and drought tolerance in Arabidopsis by overaccumulation of antioxidant flavonoids. Plant J. 77, 367–379. doi: 10.1111/tpj.12388
Nakayama, T., Yonekura-Sakakibara, K., Sato, T., Kikuchi, S., Fukui, Y., Fukuchi-Mizutani, M., et al. (2000). Aureusidin synthase: a polyphenol oxidase homolog responsible for flower coloration. Science 290, 1163–1166. doi: 10.1126/science.290.5494.1163
Ono, E., Fukuchi-Mizutani, M., Nakamura, N., Fukui, Y., Yonekura-Sakakibara, K., Yamaguchi, M., et al. (2006). Yellow flowers generated by expression of the aurone biosynthetic pathway. Proc. Natl. Acad. Sci. U.S.A. 103, 11075–11080. doi: 10.1073/pnas.0604246103
Park, H., Kreunen, S. S., Cuttriss, A. J., DellaPenna, D., and Pogson, B. J. (2002). Identification of the carotenoid isomerase provides insight into carotenoid biosynthesis, prolamellar body formation, and photomorphogenesis. Plant Cell 14, 321–332. doi: 10.1105/tpc.010302
Pertea, G., Huang, X., Liang, F., Antonescu, V., Sultana, R., Karamycheva, S., et al. (2003). TIGR Gene Indices clustering tools (TGICL): a software system for fast clustering of large EST datasets. Bioinformatics 19, 651–652. doi: 10.1093/bioinformatics/btg034
Premkumar, R., Ponmurugan, P., and Manian, S. (2008). Growth and photosynthetic and biochemical responses of tea cultivars to blister blight infection. Photosynthetica 46, 135–138. doi: 10.1007/s11099-008-0021-0
Ravichandran, R. (2002). Carotenoid composition, distribution and degradation to flavour volatiles during black tea manufacture and the effect of carotenoid supplementation on tea quality and aroma. Food Chem. 78, 23–28. doi: 10.1016/S0308-8146(01)00303-X
Ruiz-Sola, M. Á., Coman, D., Beck, G., Barja, M. V., Colinas, M., Graf, A., et al. (2016). Arabidopsis GERANYLGERANYL DIPHOSPHATE SYNTHASE 11 is a hub isozyme required for the production of most photosynthesis-related isoprenoids. New Phytol. 209, 252–264. doi: 10.1111/nph.13580
Schroda, M., Vallon, O., Wollman, F. A., and Beck, C. F. (1999). A chloroplast-targeted heat shock protein 70 (HSP70) contributes to the photoprotection and repair of photosystem II during and after photoinhibition. Plant Cell 11, 1165–1178. doi: 10.1105/tpc.11.6.1165
Škerget, M., Kotnik, P., Hadolin, M., Hraš, A. R., Simoniè, M., and Knez, Ž. (2005). Phenols, proanthocyanidins, flavones and flavonols in some plant materials and their antioxidant activities. Food Chem. 89, 191–198. doi: 10.1016/j.foodchem.2004.02.025
Taylor, S., Baker, D., Owuor, P., Orchard, J., Othieno, C., and Gay, C. (1992). A model for predicting black tea quality from the carotenoid and chlorophyll composition of fresh green tea leaf. J. Sci. Food Agric. 58, 185–191. doi: 10.1002/jsfa.2740580205
Tuan, P. A., Thwe, A. A., Kim, J. K., Kim, Y. B., Lee, S., and Park, S. U. (2013). Molecular characterisation and the light-dark regulation of carotenoid biosynthesis in sprouts of tartary buckwheat (Fagopyrum tataricum Gaertn.). Food Chem. 141, 3803–3812. doi: 10.1016/j.foodchem.2013.06.085
Wang, Y., Gao, L., Shan, Y., Liu, Y., Tian, Y., and Xia, T. (2012). Influence of shade on flavonoid biosynthesis in tea (Camellia sinensis (L.) O. Kuntze). Sci. Hortic. 141, 7–16. doi: 10.1016/j.scienta.2012.04.013
Wei, K., Wang, L., Zhou, J., He, W., Zeng, J., Jiang, Y., et al. (2011). Catechin contents in tea (Camellia sinensis) as affected by cultivar and environment and their relation to chlorophyll contents. Food Chem. 125, 44–48. doi: 10.1016/j.foodchem.2010.08.029
Welburn, A., and Lichtenthaler, H. (1984). Formulae and Program to Determine Carotenoids and Chlorophyll a and b of Leaf Extracts in Different Solvents: Advances in Photosyntesis Research. Vol. II. Hague: Junk Publisher.
Xie, Y., Xu, D., Cui, W., and Shen, W. (2012). Mutation of Arabidopsis HY1 causes UV-C hypersensitivity by impairing carotenoid and flavonoid biosynthesis and the down-regulation of antioxidant defence. J. Exp. Bot. 63, 3869–3883. doi: 10.1093/jxb/ers078
Xiong, L., Li, J., Li, Y., Yuan, L., Liu, S., Huang, J. A., et al. (2013). Dynamic changes in catechin levels and catechin biosynthesis-related gene expression in albino tea plants (Camellia sinensis L.). Plant Physiol. Biochem. 71, 132–143. doi: 10.1016/j.plaphy.2013.06.019
Yahyaa, M., Bar, E., Dubey, N. K., Meir, A., Davidovich-Rikanati, R., Hirschberg, J., et al. (2013). Formation of norisoprenoid flavor compounds in carrot (Daucus carota L.) roots: characterization of a cyclic-specific carotenoid cleavage dioxygenase 1 gene. J. Agric. Food Chem. 61, 12244–12252. doi: 10.1021/jf404085k
Keywords: Camellia sinensis cv. Huangjinya, color changes, transcriptome, flavonoid biosynthesis, carotenoid biosynthesis
Citation: Song L, Ma Q, Zou Z, Sun K, Yao Y, Tao J, Kaleri NA and Li X (2017) Molecular Link between Leaf Coloration and Gene Expression of Flavonoid and Carotenoid Biosynthesis in Camellia sinensis Cultivar ‘Huangjinya’. Front. Plant Sci. 8:803. doi: 10.3389/fpls.2017.00803
Received: 18 October 2016; Accepted: 28 April 2017;
Published: 24 May 2017.
Edited by:
Danièle Werck, Centre National de la Recherche Scientifique (CNRS), FranceCopyright © 2017 Song, Ma, Zou, Sun, Yao, Tao, Kaleri and Li. This is an open-access article distributed under the terms of the Creative Commons Attribution License (CC BY). The use, distribution or reproduction in other forums is permitted, provided the original author(s) or licensor are credited and that the original publication in this journal is cited, in accordance with accepted academic practice. No use, distribution or reproduction is permitted which does not comply with these terms.
*Correspondence: Xinghui Li, lxh@njau.edu.cn
†These authors have contributed equally to this study.