 Sijia Liu
 Chunxiang Fu
 Jiqing Gou
 Liang Sun
 David Huhman
 Yunwei Zhang1*
 Zeng-Yu Wang
- 1Department of Grassland Science, China Agricultural University, National Energy R&D Center for Biomass, Beijing, China
- 2Forage Improvement Division, The Samuel Roberts Noble Foundation, Ardmore, OK, United States
- 3Qingdao Institute of Bioenergy and Bioprocess Technology, Chinese Academy of Sciences, Qingdao, China
- 4BioEnergy Science Center, Oak Ridge National Laboratory (DOE), Oak Ridge, TN, United States
- 5Computing Services, The Samuel Roberts Noble Foundation, Ardmore, OK, United States
- 6Plant Biology Division, The Samuel Roberts Noble Foundation, Ardmore, OK, United States
Switchgrass (Panicum virgatum) has been developed into a model lignocellulosic bioenergy crop. Downregulation of caffeic acid O-methyltransferase (COMT), a key enzyme in lignin biosynthesis, has been shown to alter lignification and increase biofuel yield in switchgrass. Methylenetetrahydrofolate reductase (MTHFR) mediates C1 metabolism and provides methyl units consumed by COMT. It was predicted that co-silencing of MTHFR and COMT would impact lignification even more than either of the single genes. However, our results showed that strong downregulation of MTHFR in a COMT-deficient background led to altered plant growth and development, but no significant change in lignin content or composition was found when compared with COMT plants. Another unexpected finding was that the double MTHFR/COMT downregulated plants showed a novel lesion-mimic leaf phenotype. Molecular analyses revealed that the lesion-mimic phenotype was caused by the synergistic effect of MTHFR and COMT genes, with MTHFR playing a predominant role. Microarray analysis showed significant induction of genes related to oxidative and defense responses. The results demonstrated the lack of additive effects of MTHFR and COMT on lignification. Furthermore, this research revealed an unexpected role of the two genes in the modulation of lesion-mimic cell death as well as their synergistic effects on agronomic performance.
Introduction
As an essential cofactor, tetrahydrofolate (THF) mediates the transfer of one-carbon (C1) units in various methylated anabolic pathways, mainly those for lignin, alkaloids and betaines (Hanson et al., 2000). Methylenetetrahydrofolate reductase (MTHFR) catalyzes the reduction of 5, 10-methylene-THF to 5-methyl-THF, which is the most reduced C1 derivative (Roje et al., 1999; Hanson et al., 2000). The latter then provides a methyl group to generate methionine (Met) from homocysteine (Roje et al., 1999; Hanson et al., 2000). Subsequently, nearly 80% of Met is converted to S-adenosyl-L-methionine (SAM), a universal methyl donor that is consumed by various methylation reactions in plant primary and secondary metabolic pathways (Giovanelli et al., 1985; Hanson et al., 2000; Hung et al., 2013).
In plants, MTHFRs have been cloned and identified in Arabidopsis (Arabidopsis thaliana), maize (Zea mays) and tobacco (Nicotiana tabacum) (Roje et al., 1999; Hung et al., 2013). Downregulation of NtMTHFR1 dramatically induced the expression of a nicotine N-demethylase gene CYP82E4 and altered the alkaloid profile in transgenic tobacco (Hung et al., 2013). A study in maize has confirmed that the brown midrib 2 (bm2) phenotype is caused by MTHFR mutation (Tang et al., 2014). The bm2 mutant with reduced transcriptional level of MTHFR showed decreased lignin content and altered lignin composition (Tang et al., 2014).
Caffeic acid O-methyltransferase (COMT) is one of the key enzymes involved in lignin biosynthesis. The maize brown midrib 3 (bm3) and sorghum bmr12 phenotypes characterized by the reddish-brown coloration at the leaf midribs are both caused by COMT mutation (Vignols et al., 1995; Bout and Vermerris, 2003); the mutants showed a reduction in lignin content and a strong decrease in S-lignin units (Kuc et al., 1968; Muller et al., 1972; Barrière et al., 2007; Guillaumie et al., 2008; Palmer et al., 2008). Suppressing COMT activity in switchgrass resulted in 6.4–14.7% decrease of acetyl bromide (AcBr) lignin content and reduced S/G ratio (Fu et al., 2011). In addition to the function associated with lignin biosynthesis, COMT has also been reported as a defense-related protein due to its strong response during pathogen infection and fungal-elicitor treatment (Quentin et al., 2009; Funnell-Harris et al., 2010). The Arabidopsis comt1 mutants were more susceptible to two necrotophic fungi, one biotrophic fungus and two bacterial pathogens, but showed higher resistance to the biotrophic oomycete Hyaloperonospora arabidopsis, possibly due to the overaccumulation of 5-hydroxyferuloyl malate (OH-FM) in the mutant (Quentin et al., 2009). These evidences suggested a role of COMT in host defense mechanisms.
Tetrahydrofolate-mediated C1 metabolism controls carbon flux from MTHFR to methyltransferases (e.g., COMT) through the intermediate compound SAM. Thus, perturbing MTHFR expression would putatively impair the production of SAM, further reduce the availability of substrates required by enzymes involved in lignin biosynthesis. In a recent study involving folylpolyglutamate synthetase (FPGS), Srivastava et al. (2015) reported that the reduced lignin in Arabidopsis fpgs1 mutants might not only be due to reduced flux of methyl units to lignin precursors, but also a result of changes in the expression of genes related to lignin biosynthesis and cell wall remodeling (Srivastava et al., 2015). Disruption of MTHFR may have similar effects because FPGS is an enzyme that acts upstream of MTHFR in the C1 pathway.
Gene stacking approaches for co-silencing both COMT and a gene involved in C1 metabolism could develop into potential strategies for further lignin manipulation. In maize, each single bm2 or bm4 mutant caused an 11% reduction in Klason lignin content in the midribs, and this effect is additive (20%) in the bm2-bm4 double mutant (Vermerris et al., 2010). The bm4 phenotype was recently identified to be caused by FPGS mutation (Li et al., 2015). In the case of maize bm2-bm3 (MTHFR-COMT) double mutant, only plant height was measured and no significant difference was found between the mutant and wild type (Vermerris et al., 2010). Growth defects were observed in triple mutants containing bm2 and bm4. Bm1-bm2-bm4 stopped growing at an early seedling stage, while the combination of bm2-bm3-bm4 arrested growth even prior to seedling emergence (Vermerris et al., 2010).
Switchgrass (Panicum virgatum) is a dedicated lignocellulosic bioenergy crop due to its high biomass productivity and low input requirements (Schmer et al., 2008). Molecular tools have been applied to genetic improvement of switchgrass (Casler et al., 2011; Wang and Brummer, 2012; Nageswara-Rao et al., 2013; Li et al., 2014). We generated low lignin switchgrass by COMT downregulation and showed that the transgenic plants had improved sugar release and ethanol yield (Fu et al., 2011). Field studies further confirm that COMT downregulation in switchgrass can confer real-world improvements in biofuel yield without negative impact on biomass productivity, disease susceptibility, soil chemistry or carbon storage potential (Baxter et al., 2014, 2015, 2016; DeBruyn et al., 2016; Dumitrache et al., 2016; Li et al., 2016).
In this study, we target MTHFR and COMT to investigate the function of these two genes in lignification and their potential synergetic effects on morphology in switchgrass. Our results showed that strong downregulation of MTHFR in a COMT-deficient background led to reduced plant growth. However, lignin content of the MTHFR/COMT-RNAi plants was similar to that of the single COMT downregulated plant. To our surprise, a novel lesion-mimic leaf phenotype was observed. Molecular analyses revealed that the lesion-mimic phenotype was regulated by both MTHFR and COMT, with MTHFR playing a predominant role. Microarray analysis demonstrated significant induction of genes related to oxidative and defense responses. This research not only demonstrated the synergistic effects of MTHFR and COMT on plant performance, but also revealed an unexpected role of the two genes in the modulation of lesion-mimic cell death.
Materials and Methods
Plant Materials
Lowland switchgrass cultivar Alamo (2n = 4 × = 36) was used for all the experiments described in this study. Plants were grown in the greenhouse with 16-h light photoperiod (390 μ Em-2 S-1) and 26°C. Three biological replications of plants were re-potted by splitting the same number of tillers. The development of switchgrass was divided into five elongation (E1, E2, E3, E4, and E5) and three reproductive (R1, R2, and R3) stages according to Hardin et al. (2013).
When switchgrass plants reached R1 stage, dry matter biomass, plant height, tiller number, leaf blade length and width, leaf sheath length, internode length, internode diameter and number, and flowering time were measured. Internode three (I3) and the leaf and leaf sheath of I3 were used for measurement.
Vector Construction and Plant Transformation
Full-length mRNA sequence of MTHFR was identified from the switchgrass EST database1. Two MTHFR sequences (Pavir.Ia00159 and Pavir.J04665.1) were cloned, these sequences showed 98.5% similarity at the amino acid level. A 506-bp of RNAi cDNA fragment was amplified by PCR with primers shown in Supplementary Table S9 and cloned into the pENTR/D-TOPO Cloning vector (Invitrogen, Chicago, IL, United States). The pENTR-MTHFR plasmid was ligated to pANIC8D gateway vector through the LR Gateway cloning reaction (Invitrogen). The binary construct was transformed into Agrobacterium tumefaciens strain AGL1. Embryogenic calli induced from immature inflorescence of wild-type switchgrass plants were used for transformation (Xi et al., 2009). The COMT-RNAi transgenic plants were developed as previously described (Fu et al., 2011). The double MTHFR/COMT-RNAi transgenics were generated by transforming the MTHFR-RNAi vector into embryogenic calli induced from immature inflorescence of COMT-RNAi transgenics.
Molecular Identification of Transgenic Plants
Genomic DNA was isolated from young leaves of wild-type and transgenic plants using 2xCTAB method (Doyle, 1987). Positive transgenics were identified by PCR amplification with specific bar and hph primers (Supplementary Table S9). The expected sizes of PCR amplification product for bar and hph were 444- and 403-bp, respectively.
Total RNA was isolated from switchgrass young leaves by TRIzol reagent (Invitrogen). First-strand cDNA was synthesized from the purified total RNA using Superscript III Kit (Invitrogen) and used for quantitative RT-PCR (qRT-PCR). Primers used for qRT-PCR were listed in Supplementary Table S9. Calculation of cycle threshold, qRT-PCR condition and data normalization was performed as described by Fu et al. (2012). PvUbiquitin1 transcripts (GenBank accession number: FL899020) were used as internal control.
Determination of Lignin Content and Composition
Stem tissues were harvested at R1 stage. Lyophilized extractive-free cell wall residues (CWR) were obtained as described by Chen and Dixon (2007), and used for determination of lignin content and composition. Lignin content was quantified by the Acetyl bromide (AcBr) method (Hatfield et al., 1999). Lignin composition was determined by the thioacidolysis method (Lapierre et al., 1995). Lignin-derived monomers (H, S, and G units) were identified and quantified by gas chromatography mass spectrometry (GC/MS) using a Hewlett-Packard 5890 series II gas chromatograph with a 5971 series mass selective detector (Fu et al., 2011).
Trypan Blue and Diaminobenzidine (DAB) Staining
Leaves with lesion-mimic-like phenotype were collected and placed in trypan blue solution (Cat # 93595, Sigma, St. Louis, MO, United States) for determination of cell death. Chlorophyll was removed by soaking the stained leaves in 95% ethanol for 1–2 days until the leaves are free of chlorophyll. Leafs 2–5 collected at R1 stage were stained with 1 mg/ml (pH 3.8) 3,3C-diaminobenzidine (DAB) for determination of H2O2 as described by Daudi and O’Brien (2012). ImageJ software was used to quantify the area of the lesions on the leaf surface.
Microarray Analysis
High-quality total RNA from duplicate biological replicates of the transgenic lines MT/CO-37 and MT/CO-47 (severe phenotype group), MT/CO-38 and MT/CO-67 (moderate phenotype group) was isolated from young leaves (Leaf 4) at E4 stage using SpectrumTM Plant Total RNA Kit (Sigma–Aldrich). To eliminate background differences among transgenics, except wild-type plant, MT/CO-60 with no more than 40% decrease in expression of both MTHFR and COMT genes was also selected as a control. Leaf 4 at E4 stage was used because the lesion phenotype fully emerged at this stage in leaf 2, moderately developed in leaf 3, but could not be observed in leaf 4. RNA amplification, labeling and hybridization were done as described by Fu et al. (2012). Data normalization was performed by using the robust multi-array average (RMA) (Irizarry et al., 2003). Differentially expressed genes were selected based on associative t-test (Dozmorov and Centola, 2003) using Matlab (MathWorks, Natick, MA, United States). By using the method described by Dozmorov and Centola (2003), residual for each gene between sample groups was compared against residual of a group of background stable genes to obtain significant P-values. Bonferroni corrected threshold was applied to this P-value in order to remove false positives. Common differentially expressed genes were analyzed by venn diagram software2. Functional enrichments were conducted by PageMan (Usadel et al., 2006). Significance of pathway analysis was conducted by MAPMAN (Thimm et al., 2004). Nine upregulated genes were selected for qRT-PCR verification. Primers used for qRT-PCR were listed in Supplementary Table S9.
Metabolite Analysis and Quantification of Amino Acids
Primary metabolites were analyzed using gas chromatography mass spectrometry (GC-MS). Leaf tissues (leafs 2 and 4) at E4 stage were collected and lyophilized. Sample grinding and extraction were achieved by a Labman Automation Robot (Labman Automation, Inc.). Totally, 10 mg of pulverized tissue was used for polar and non-polar extractions; the derivatization of extracts and GC-MS analysis followed the descriptions by Broeckling et al. (2005). Mass spectra deconvolution and metabolite identification were carried out using AMDIS software3 and a custom in-house EI-MS metabolite library. Peak picking, alignment and quantification were conducted using MET-IDEA software (Broeckling et al., 2006).
For quantification of amino acids, derivatization of polar extracts was done as described above. Polar samples were also analyzed by gas chromatography with Time-of-Flight mass spectrometer (GC-TOF-MS). Data format conversion was performed by R software4 and peak area of each amino acid was calculated by MET-IDEA software as mentioned. Authentic amino acid mixture (Sigma) was used as reference for quantitative analyses.
Statistical Analysis
Data were analyzed using means ± SE of triplicate samples. Data from each trait were subjected to one-way ANOVA. Duncan’s multiple range test (P < 0.05 or 0.01) was applied to analyze the significant differences among means using SPSS software.
Results
Generation, Molecular Identification and Categorization of Transgenic Plants
To generate single MTHFR knockdown transgenic plants, a 506-bp RNAi cDNA fragment was designed at the conserved region of switchgrass MTHFR to downregulate the two homologous alleles after multiple alignment analysis (Supplementary Figure S1). An antisense and a sense MTHFR cDNA fragment were connected by a gus-linker to generate the hairpin RNA (Supplementary Figure S2a). Resistant embryogenic calli harboring the MTHFR RNAi vector were obtained after Agrobacterium-mediated transformation and phosphinothricin (PPT) selection. Fifteen positive transgenic MTHFR-RNAi plants were generated. qRT-PCR was performed to detect MTHFR expression levels (Supplementary Figure S3a). Out of the 15 transgenic events, two lines (MT-20 and MT-15) with approximately 50% decrease of MTHFR expression were selected for further analysis (Supplementary Figure S3a). It should be noted that compared to other gene constructs, it was surprisingly difficult and much more effort was needed to generate transgenic plants using the MTHFR-RNAi construct.
A COMT-RNAi line with more than 90% downregulation of COMT expression was selected as the background plant for MTHFR-RNAi vector transformation. Resistant calli of double MTHFR/COMT-RNAi plants were obtained after hygromycin and PPT selection. More than forty double MTHFR/COMT knockdown transgenic events were obtained. Positive events were detected by the presence of both hph and bar genes using PCR (Supplementary Figure S2b). Unlike single MTHFR knockdown, MTHFR in COMT-deficient background was easily downregulated. Some lines (MT/CO-37, 46, 47) showed more than 90% decrease in both MTHFR and COMT expression (Supplementary Figure S3b).
The expression profiles of selected transgenic plants were further confirmed by three independent qRT-PCR experiments, and consistent results were obtained (Figures 1A,B). We categorized the double gene knockdown transgenic switchgrass plants into three groups based on MTHFR and COMT expression levels. Group I plants were heavily downregulated in COMT but the MTHFR expression level was similar to wild type. Group II plants showed moderate downregulation of both MTHFR and COMT. Group III plants exhibited severe downregulation of both MTHFR and COMT (Figures 1A,B).
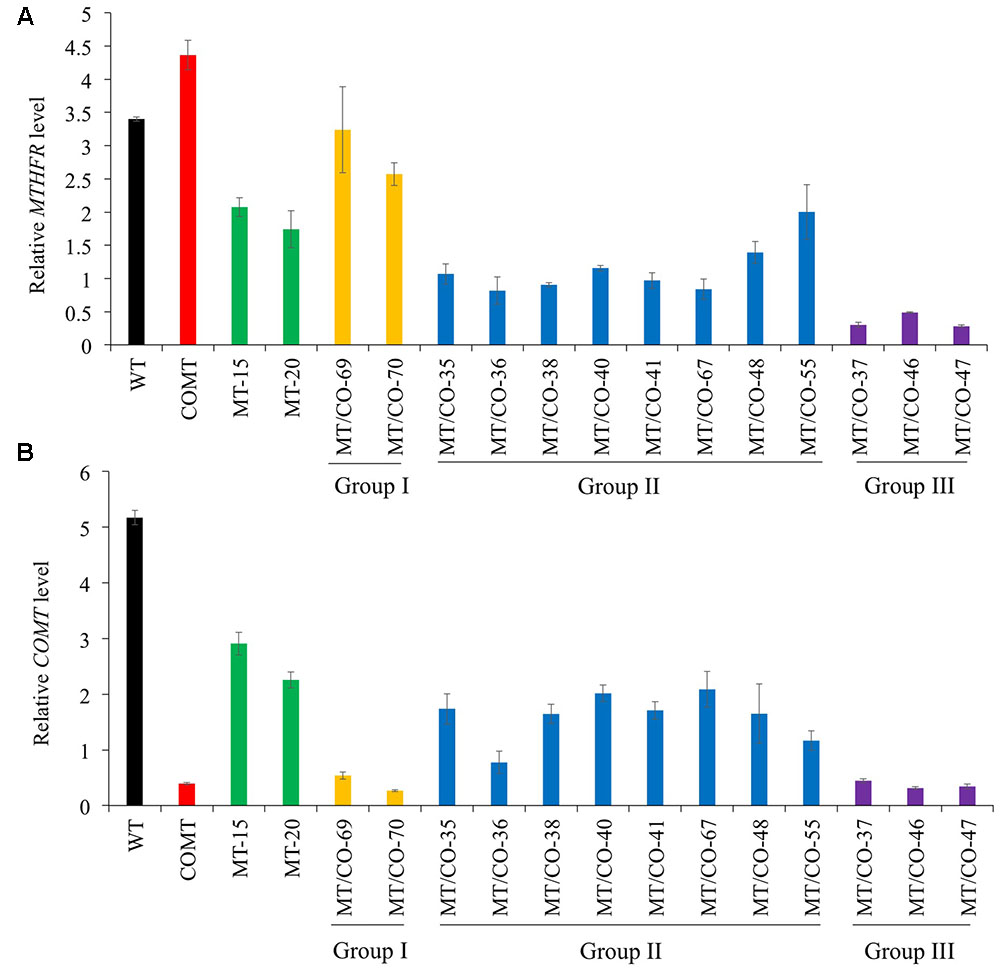
FIGURE 1. Molecular identification and categorization of transgenic switchgrass plant. Relative transcript levels of MTHFR (A) and COMT (B) in wild-type (WT) and transgenic plants detected by quantitative real-time PCR (qRT-PCR). Switchgrass Ubiquitin 1 was used as the reference gene.
Effects of MTHFR and COMT Downregulation on Plant Growth and Development
To evaluate whether downregulation of single MTHFR or double MTHFR/COMT affects switchgrass growth and development, transgenic lines were analyzed regarding their morphological characteristics. Single MTHFR knockdown lines MT-15 and MT-20 displayed normal morphology with no obvious changes in plant height, leaf width, leaf sheath length, internode length, internode diameter, or internode number (Supplementary Table S1), nor were significant changes observed in tiller number or biomass yield (Supplementary Figure S4 and Figure 2A). The only change observed in MT-15 and MT-20 was delayed flowering time (Supplementary Table S1). In double MTHFR/COMT knockdown plants, morphological traits, tiller number and dry matter biomass were not affected in group I (MT/CO-69 and MT/CO-70) and group II (MT/CO-38 and MT/CO-67) plants (Figures 2A,B, Supplementary Figure S4 and Table S1). The group III transgenic lines (MT/CO-37 and MT/CO-47), however, displayed severe defects in plant growth and development. They showed 33–46% reduction in plant height, 16–34% reduction in leaf blade length, 15–27% reduction in leaf blade width, 16–31% reduction in leaf sheath length (Supplementary Table S1). Even though tiller number was not affected (Supplementary Figure S4), the strong growth defects of group III lines led to 45–61% reduction in biomass yield (Figure 2A). Besides, the group III plants also exhibited delayed flowering time (Supplementary Table S1). These results revealed that decreasing MTHFR expression delays switchgrass flowering time without affecting plant normal growth, while strong downregulation of both MTHFR and COMT affects switchgrass growth and development.
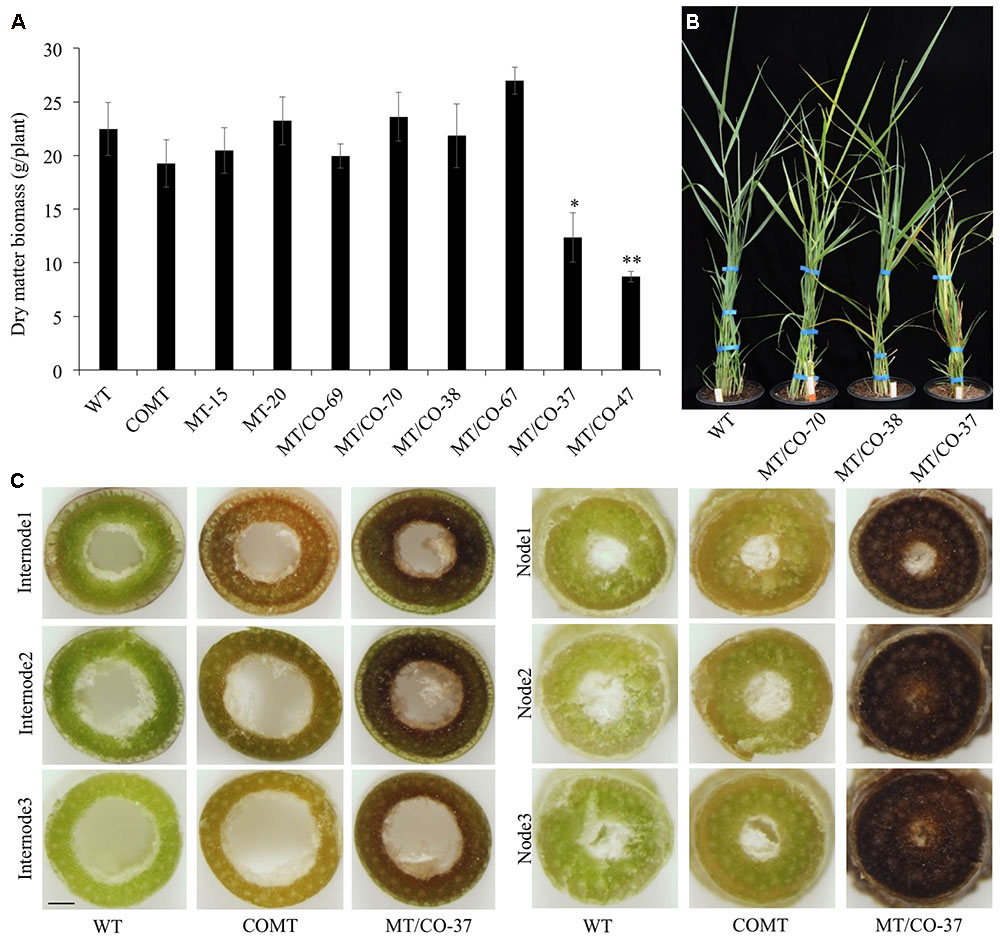
FIGURE 2. Dry matter biomass, plant growth and cross sections of WT and transgenic plants at Rl stage. (A) Dry matter biomass at Rl stage. One or two asterisks indicate significant difference of P < 0.05 or P < 0.01 by one way ANOVA. (B) Morphological observation of WT and representative transgenic plants (MTV CO-70 from group I, MT/CO-38 from group II, MT/CO-37 from group III). (C) Coloration of the cross sections of internode and node (without staining). Bar, 1 mm.
Cross section analysis (without staining) showed obvious dark-brown coloration at each node and basal internode of group III lines compared with wild type and the original COMT-RNAi plants (Figure 2C). This coloration trend weakens in the younger internode, but it was not reduced in the younger node (Figure 2C).
Effects of MTHFR and COMT Downregulation on Lignin Content and Lignin Composition
Transgenic lines (MT/CO-37 and MT/CO-47) with heavily downregulated MTHFR and COMT were subjected to lignin analysis. Single gene knockdown lines COMT, MT-15, and MT-20 were also analyzed. Double transgenic lines showed a significant decrease in AcBr lignin content (8–9%) compared to wild type (Figure 3A). The reduction of AcBr lignin content in double gene knockdown plants was similar to that of the COMT-RNAi line. Lignin composition was also altered in double transgenic plants. Compared with the wild-type plant, the total thioacidolysis lignin yield, S lignin, G lignin, and S/G ratios, respectively, decreased 39–43%, 55–59%, 27–29%, 38–42% in MT/CO-37 and MT/CO-47 lines. However, compared with the COMT-RNAi line, only G lignin showed a reduction (9–13%) in the double gene knockdown lines, while S lignin and H lignin were not altered (Figure 3B). Lignin composition, measured by S/G ratio, did not show consistent change in the MTHFR/COMT-RNAi lines when compared with the COMT-RNAi line (Figure 3C). In single MTHFR knockdown lines, lignin content was not reduced and lignin composition was not consistently altered (Figure 3).
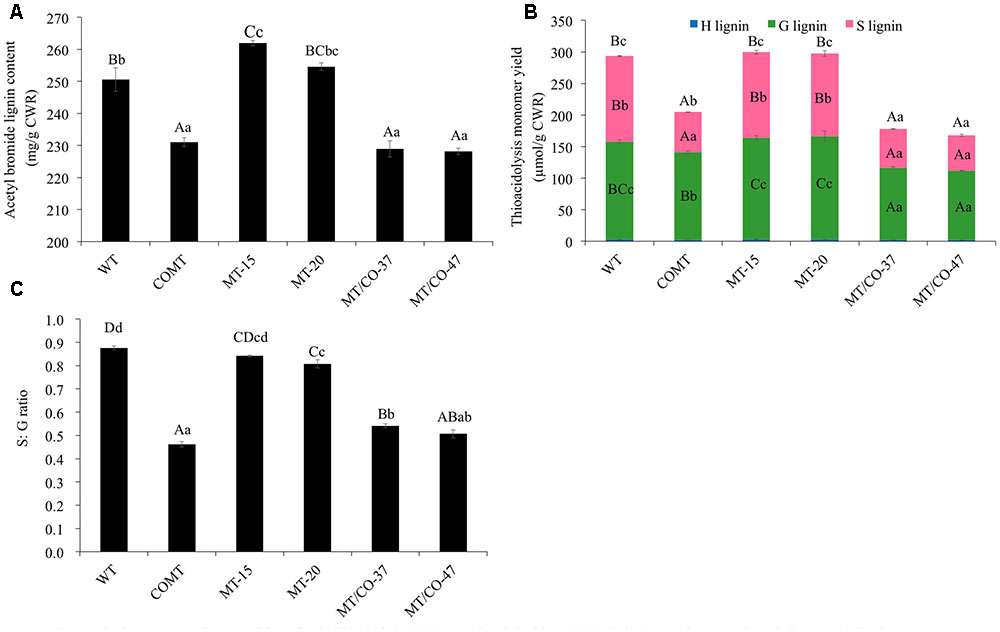
FIGURE 3. Lignin content and composition of COMT-RNAi, MTHFR-RNAi and double MTHFR/COMT-RNAi transgenic switchgrass. (A) Lignin content of transgenic plants as determined by acetyl bromide method, (B) lignin composition of transgenic plants as determined by thioacidolysis. S, syringyl unit; G, guaiacyl unit; H, p-hydroxyphenyl unit, (C) S: G ratio of transgenic plants from thioacidolysis. CWR, cell wall residue. Values are mean ± SE (n = 3). Three independent experiments were carried out for the analyses. Capital or small letters indicate a significant difference of P < 0.01 or P < 0.05 by one way ANOVA, multiple comparison.
Induction of Lesion-Mimic-Like Phenotype in Double Gene Knockdown Transgenic Switchgrass
Under normal greenhouse conditions, a lesion-mimic-like cell death (LMD) phenotype was observed on the leaf surfaces of groups II and III plants (Figure 4). The lesion-like necrosis resembled lesions caused by hypersensitive cell death and were spontaneously initiated without any stresses or chemical treatments. When transgenic plants reached E3 or E4 stage, the oldest leaves displayed a lesion phenotype that initiated from the leaf tips and continuously spread over the whole leaves until the oldest leaves became wilted and died (Figures 4C,E). Trypan blue staining revealed that these necrotic lesions were formed due to cell death (Figure 4B). To further study the development of the necrotic lesions, we selected representative transgenic plants from group I (MT/CO-70), II (MT/CO-38 and MT/CO-55) and III (MT/CO-37) displaying different densities of lesions at R1 stage (Figures 4E–H). Lesions were not observed in group I plants. The development of the necrotic lesions in groups II and III plants had similar regular patterns showing that the density of the lesions was much stronger in the older leaves (Leaf 2) compared with the younger leaves (Leaf 5) (Figures 4E–H). The areas of lesions from groups II and III plants were substantially higher compared to the wild type (Figure 4M). These results indicated the necrotic lesions were developmentally regulated in transgenic switchgrass.
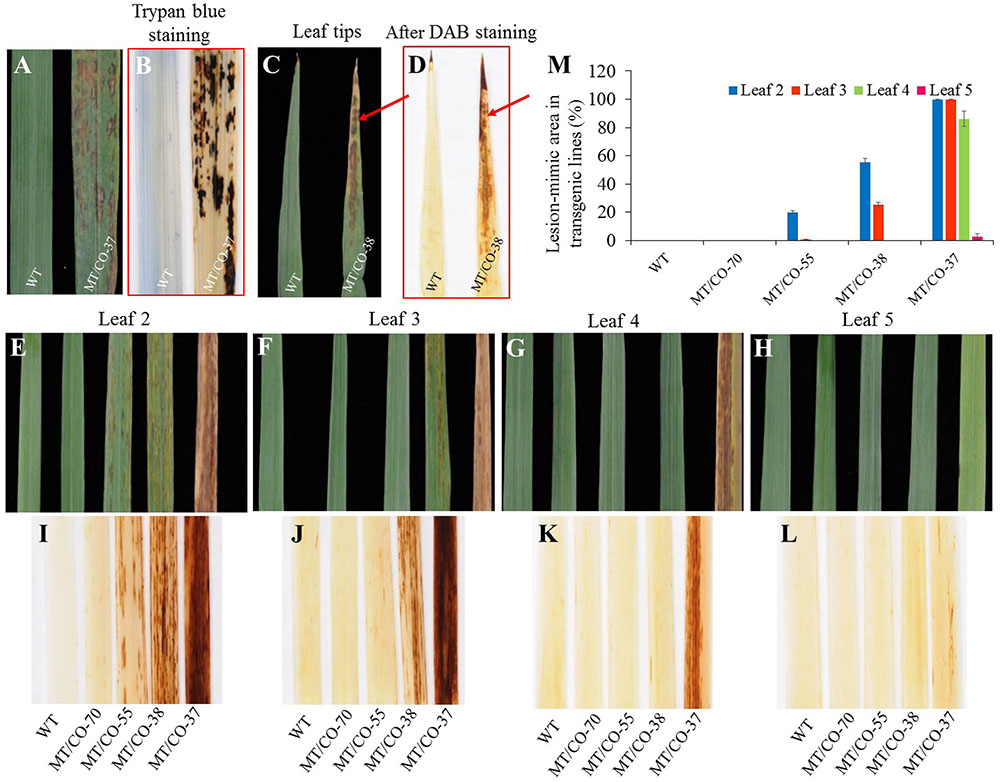
FIGURE 4. Lesion-mimic-like phenotypes identified on the leaves of double MTHFR/COMT-RNAi transgenic switchgrass. (A) Lesion-mimic-like phenotype. (B) Cell death revealed by trypan blue staining. (C) Lesion-mimic-like phenotype initiated from leaf tip. (D) Corresponding accumulation of reactive oxygen species on leaf tip as revealed by DAB staining. (E–H) Lesion-mimic-like phenotypes observed from the 2nd leaf (leaf 2, old leaf) to the 5th (leaf 5, young leaf) of wild-type and transgenic switchgrass at Rl stage. (I–L) Corresponding accumulation of reactive oxygen species on 2nd leaf to 5th leaf revealed by DAB staining. (M) Average lesion area per leaf of wild-type and transgenic switchgrass. Values are mean ± SE (n = 4). Significance as determined by one way ANOVA.
Diaminobenzidine staining showed the accumulation of reddish-brown colorations in the lesions in the groups II and III plants. These staining results were highly associated with the formation of the lesions, indicating that the necrotic lesions corresponded to the over-accumulation of H2O2 (Figures 4E–L).
Formation of the Lesion-Mimic Cell Death Phenotype Is Regulated by Both MTHFR and COMT Genes
We found that the density of the lesions in double gene knockdown transgenic switchgrass related to the levels of MTHFR and COMT expression. Plants with lowest expression of MTHFR (10–15% residue level) in the COMT-deficient (8% residue level) background (group III plants) showed a high density of lesions; plants with moderate expression of MTHFR (25–60%) and COMT (18–48%) (group II plants) exhibited a moderate density of lesions (Figure 5A). These lesions were not observed in group I and single MTHFR knockdown lines (Figure 5A). Because it was impossible to obtain the single MTHFR transgenic lines with strong downregulation level of MTHFR, and, in order to figure out which gene regulated the lesion-mimic-like cell death phenotype, we made the following comparisons (Figures 1A,B, 5A): First, in the COMT-RNAi line, even when COMT expression decreased more than 90%, there were no lesions, indicating that the downregulation of COMT per se was not the reason for lesion formation. Second, the gene expression level of group I plants (no lesions, e.g., MT/CO-70 line) was compared to that of group III plants (severe lesion phenotype, e.g., MT/CO-37 line), COMT expression was similar, but MTHFR expression level was significantly different (Figure 5B), indicating the lesions were caused by suppression of either the MTHFR gene alone or by both MTHFR and COMT genes. Third, the gene expression levels in group II plants were compared to those of single MTHFR knockdown lines (e.g., MT-15 line, Figure 1A), MTHFR expression levels were sometimes similar (e.g., MT/CO-55 line, Figure 1A), while COMT expression in group II was significantly lower (Figure 1B); this suggests that COMT also contributed to lesion formation, but only in the case of concurrence with MTHFR. Thus, the above evidences suggest that the lesion-mimic-like phenotype is regulated by both MTHFR and COMT genes. By correlation analysis, we found the area of the lesions in double gene knockdown plants was highly negatively correlated with the expression levels of MTHFR gene in the COMT-deficient background (R2 = 0.89) (Figures 5B–D), indicating a predominant effect of the MTHFR gene in regulating lesion formation.
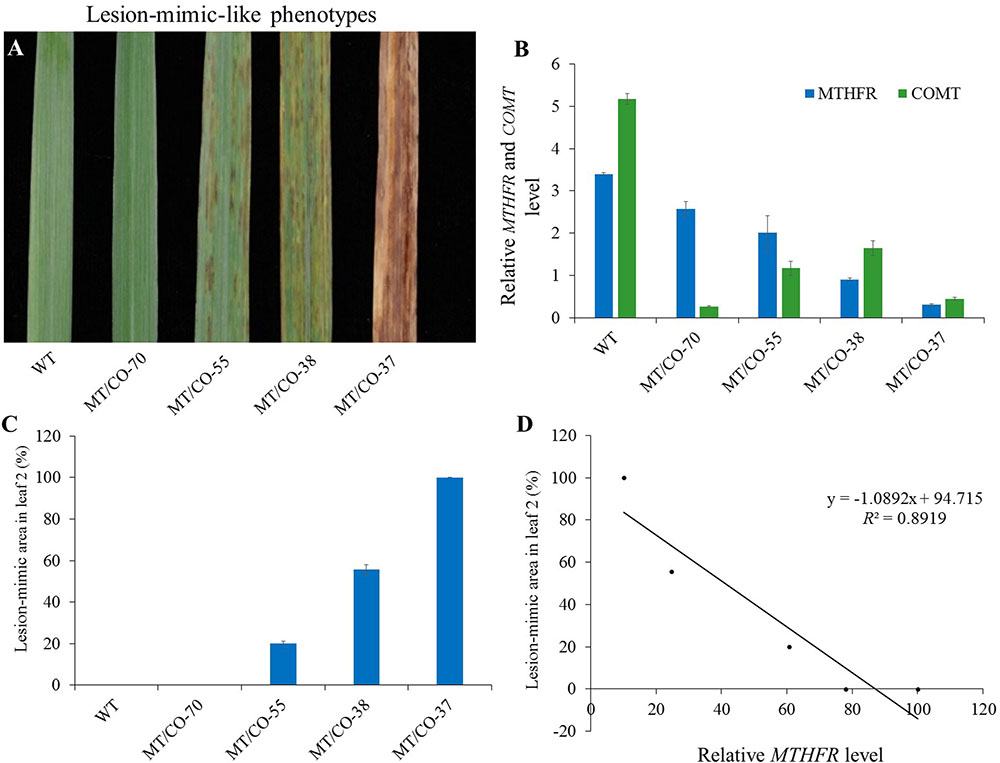
FIGURE 5. Relationship between the lesion-mimic-like phenotype and the downregulation of single MTHFR and double MTHFR/COMT in switchgrass. (A) Lesion-mimic-like phenotypes of the 2nd leaf in different groups of double gene knockdown switchgrass (group I: 70; group II: 38 and 55; group III: 37). (B) Relative expression of MTHFR in different groups of plants. (C) Average lesion area in the 2nd leaf. (D) Correlation analysis between lesion-mimic area and MTHFR gene expression level. Values are mean ± SE (n = 4). Significance as determined by one way ANOVA.
Microarray Analysis
To investigate the molecular mechanism of MTHFR and COMT in inducing lesion-mimic-like cell death in switchgrass, representative lines of MT/CO-37, MT/CO-47 (severe lesion phenotype, Se) and MT/CO-38, MT/CO-67 (moderate lesion phenotype, Mo) were selected for microarray analysis. The line MT/CO-60 was used as control because it showed wild-type phenotype and less than 40% reduction in the expression of both MTHFR and COMT (Supplementary Figure S5); a double gene transformant like this is an ideal control for minimizing the differences in genetic background. Differentially expressed genes were identified using four comparisons (Supplementary Table S2). In the Se/60 group (Severe vs. MT/CO-60), transcript abundance of 2940 genes was altered more than twofold, among which, 1693 genes were upregulated and 321 genes were downregulated. In the Mo/60 group (Moderate vs. MT/CO-60), out of 1361 differentially expressed genes, 409 genes were upregulated and 287 genes were downregulated. Between Se/60 and Mo/60 groups, 201 genes were simultaneously upregulated and 126 genes were simultaneously downregulated (Supplementary Tables S2–S4 and Figure 6A). Nine upregulated genes that associated with lesion-mimic-like phenotype among the 201 commonly transcripts were selected for qRT-PCR verification (Supplementary Table S3 and Figure S6). All the selected genes in qRT-PCR analysis showed similar expression patterns with those of the microarray analysis, implying high reliability of the microarray results. Furthermore, transcript levels of these genes were highly correlated with the developmental process of the lesion phenotype (Supplementary Figure S6). To narrow down differentially expressed genes, we designed two extra comparisons, Experimental/Control (mixed data of Se and Mo vs. mixed data of MT/CO-60 and wild type) group and Se/Mo (Severe vs. Moderate) group. Venn diagram analysis showed 19 differentially expressed transcripts in common based on our four comparisons (Figure 6A), among which, 13 genes with over 2.5-fold change in Se/60 and Mo/60 groups are shown (Table 1). Most of these genes are related to oxidative and defense responses, suggesting the high possibility of these genes triggering the initiation of lesion-mimic-like cell death.
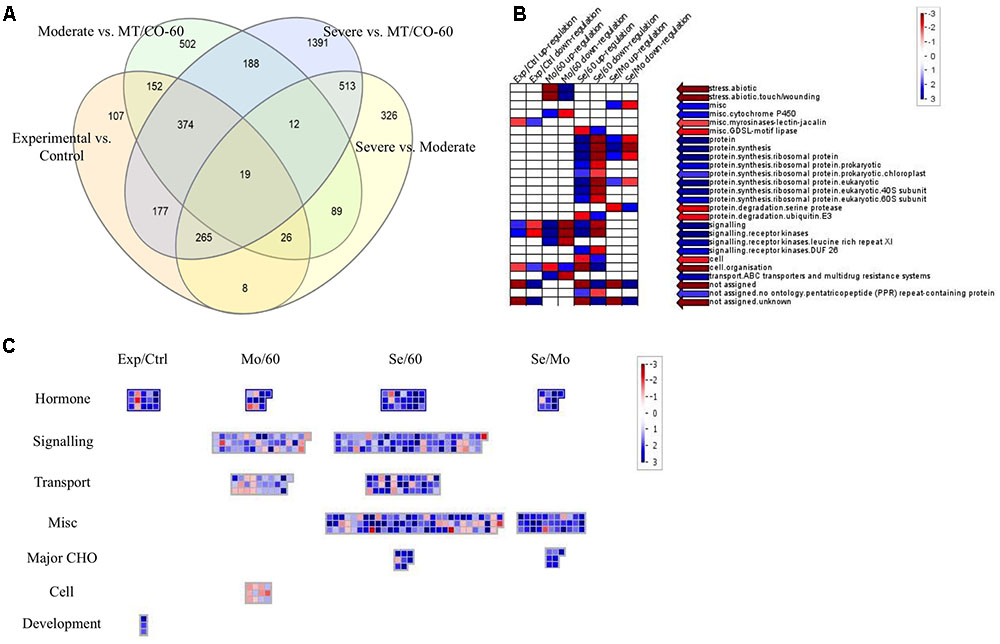
FIGURE 6. Comparison of differential expressed genes (DEGs) between various groups: severe vs. MT/CO-60, moderate vs. MT/CO-60, experimental vs. control group, and severe vs. moderate. (A) Venn diagram showing the commonly up- or down-regulated gene numbers. (B) Functional enrichment analysis of DEGs by PageMan. Red and blue color indicates under-represented and over-represented functional group, respectively. (C) Significant pathway analysis of DEGs by MapMan. Numbers indicate Log2-fold change ratios of pairwise comparison. Blue and red represents upregulated and downregulated genes, respectively.
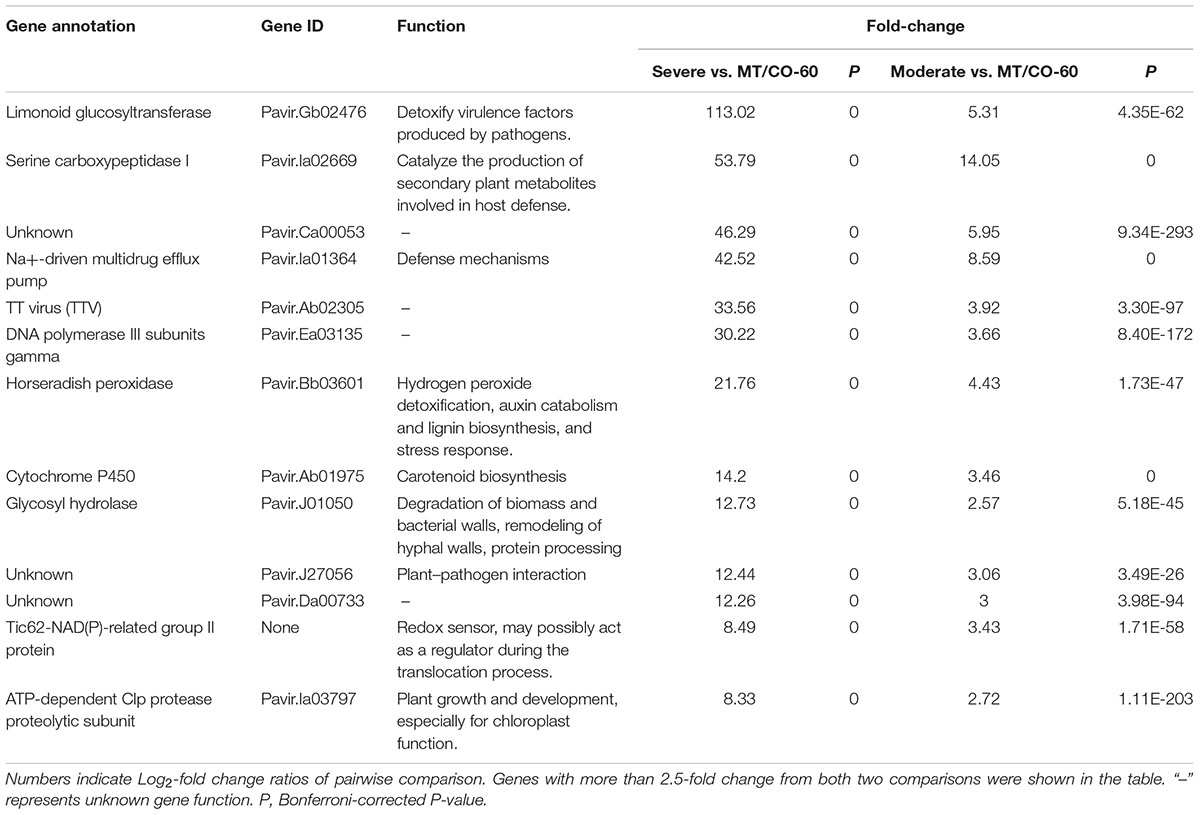
TABLE 1. Differentially expressed genes selected based on Venn diagram analysis.
To identify possible functions of the altered genes from the four comparisons, functional enrichment analysis by PageMan was performed (Figure 6B). In three of these comparisons (Experimental/Control, Mo/60 and Se/60), the up-regulated genes were over-represented in signaling, while the downregulated genes were over-represented in cell organization. The up-regulated genes in Se/60 as well as in the Se/Mo comparisons were also over-represented in protein synthesis. These results indicated that genes involved in signaling and protein synthesis processes were strongly induced in MTHFR and COMT knockdown switchgrass. To further clarify which metabolic pathway had been significantly affected, the differentially expressed genes from the comparisons were mapped onto MapMan (Figure 6C). The data showed that the expression levels of many genes were altered in hormone metabolism, signaling, transport, major carbohydrate (CHO), cell, and development processes (Figure 6C and Supplementary Table S5). Among these alterations, most of the genes involved in hormone metabolism were induced in all four comparisons. Additionally, in the biotic stress pathway, marked induction of the genes involved in signaling, JA metabolism and decreased expression of bZIP and MYB-related transcription factors were observed (Supplementary Figure S7 and Table S6), suggesting that these metabolic processes might directly participate or exhibit cross-talk effects in the activation of defense response.
Metabolic Profiling Was Altered in Transgenic Switchgrass
Gas chromatography mass spectrometry analysis revealed significant alterations of phenolic compounds in transgenic plants relative to wild type. Chlorogenic acid showed 80–90% decrease in young leaves of MT/CO-Se (group III plants with severe phenotype), MT/CO-Mo (group II plants with moderate phenotype) lines, as well as COMT and MT-20 lines (Figure 7A), indicating that perturbation of either MTHFR or COMT gene, or the two genes together, markedly affected the accumulation of chlorogenic acid in young leaves of switchgrass. In wild type, chlorogenic acid accumulated less in old leaves compared to young leaves, and the single MTHFR-RNAi (MT-20) and COMT-RNAi (COMT) lines showed a similar trend (Figure 7A). However, the trend is reversed in the double gene downregulation lines with MT/CO-Mo and MT/CO-Se, respectively, displaying 1.7- and 7-fold increased accumulation of chlorogenic acid in old leaves relative to that in young leaves (Figure 7A). Another soluble phenolic compound, caffeic acid, showed decreased accumulation of 70% only in young leaves of MT/CO-Se line compared to WT (Figure 7B). The accumulation of caffeic acid was lower in old leaves than in young leaves in most transgenic lines except MT/CO-Se, in which caffeic acid accumulated at almost the same level in young and old leaves (Figure 7B). The above data indicate that synthesis of phenolic compounds was affected by the downregulation of MTHFR and COMT in switchgrass, particularly when comparing the relative levels of young and old leaves.
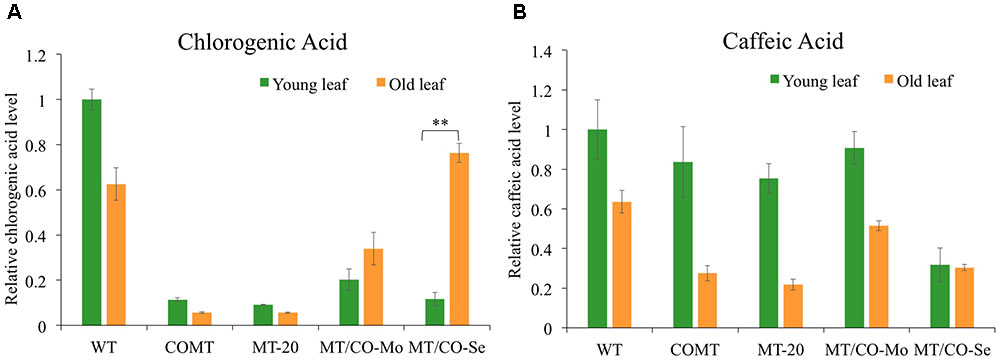
FIGURE 7. Relative chlorogenic (A) and caffeic acid (B) levels in young and old leaves of wild-type and transgenic switchgrass. Young leaves (leaf 4) and old leaves (leaf 2) were harvested at E4 stage. MT/CO-Mo or MT/CO-Se means the mixture of two lines from moderate lesion phenotype (group II) or severe lesion phenotype (group III) transgenic switchgrass, respectively. Values are mean ± SE (n = 3). Two asterisks indicate significant difference of P < 0.01 by one way ANOVA.
The overall amino acid pools were not notably altered in young leaves except for Ile, an Asp family amino acid, which showed a slightly elevated accumulation in MT/CO-Mo and MT/CO-Se lines (Supplementary Table S7). In contrast to the metabolic patterns in young leaves, marked increased accumulation of Asp, Ile, Leu, Phe, Pro, Tyr, Glu, Ser, and Thr metabolism was observed in old leaves of both MT/CO-Se and MT/CO-Mo lines (Supplementary Tables S7, S8). Specifically, compared to WT the relative abundance of Ser increased by 28 and 6-fold in MT/CO-Se and MT/CO-Mo lines, respectively, and Glu increased by 2.6 and 2.5-fold (Supplementary Table S8). Moreover, Pro, which functions as an osmoprotectant, displayed 1.5–5-fold increased accumulation (Supplementary Table S7). Notably, elevated levels of most amino acids in old leaves were correlated with the intensity of the lesions in MT/CO-Se and MT/CO-Mo lines, indicating that the alteration of amino acid metabolism is related to lesion formation.
Furthermore, the main sugars including glucose, galactose, sucrose, and fructose showed markedly increased accumulations in old leaves of MT/CO-Se lines (Supplementary Table S8). Specifically, glucose and fructose levels increased by 57 and 12-fold relative to WT plants, respectively. However, most of the sugars except galactosyl glycerol did not show significant change in leaves of the MT/CO-Mo lines (Supplementary Table S8), suggesting that the sugar metabolism was mainly affected in plants with strong lesion-mimic-like phenotypes.
Discussion
Grass lignin is composed of three hydroxycinnamyl alcohol units (coniferyl, sinapyl alcohol, and p-coumaryl alcohol), leading to the formation of three guaiacyl (G), syringyl (S), and p-hydroxyphenyl (H) types of lignin subunits (Barrière et al., 2007; Hatfield et al., 2017). Downregulation of COMT in switchgrass resulted in significant reduction of lignin content, which led to large increase in biofuel production (Fu et al., 2011; Baxter et al., 2014). Because MTHFR is directly involved in the production of the methyl donor, SAM, and lignin content is reduced in the maize bm2 mutant, it was expected that simultaneous downregulation of COMT and MTHFR would lead to further alteration of lignin biosynthesis. However, strong downregulation of both MTHFR and COMT in switchgrass did not show any additive effect on lignin modification. Lignin content of the MTHFR/COMT double transformants was similar to that of the single COMT knockdown plants, indicating that when COMT activity is low, SAM is no longer a limiting factor in the process of lignin biosynthesis. Among the three lignin units, G lignin were moderately reduced in the double transformants. In the O-methylation reactions, except COMT, the methyl units derived from the C1 pathway are also consumed by caffeoyl-CoA O-methyltransferase (CCoAOMT). Previous reports have shown that downregulation of CCoAOMT led to reduction mainly in G lignin units in different dicot species (Chen et al., 2001; Guo et al., 2001; Pinçon et al., 2001). However, in switchgrass, the CCoAOMT-suppressed transgenics with approximately 10% residue activity displayed no changes in either lignin content or composition (Shen et al., 2013). Thus the role of CCoAMT in lignin biosynthesis is not clear in monocot species. Our results showed that the transcript levels of CCoAOMT1 were significantly reduced in MTHFR and MTHFR/COMT double transformants, although there was a large variation in the levels of reduction in the double transformants (Supplementary Figure S10). To further confirm the impact of MTHFR downregulation, it would be interesting to analyze AdoMet level in the transgenic switchgrass in the future.
Both COMT knockdown switchgrass and a bm2 maize mutant showed normal agronomic performance (Fu et al., 2011; Baxter et al., 2014; Tang et al., 2014). Phenotypically, it was observed that lower internodes of COMT knockdown switchgrass showed brownish color (Fu et al., 2011) while the maize bm2 mutant had brownish color in the midribs of leaves (Tang et al., 2014). In the MTHFR/COMT double knockdown plants, no color change was observed in leaf midribs, however, dark brown coloration was found in nodes and internodes (Figure 2C). The coloration is much stronger than that of COMT knockdown switchgrass plants. The results show that COMT and MTHFR do have an additive impact on the accumulation of coloration compounds. Identification of the compounds remains to be an interesting topic for future research.
Unexpectedly, leaves of the MTHFR/COMT double knockdown plants developed necrotic lesions. After cutting the plants back, newly developed tillers still displayed such lesions, excluding the possibility that the lesions were associated with disease. No such phenotype was reported in the maize bm2-bm3 (MTHFR-COMT) double mutant or other combinations of bm mutants. Because the lesions are spontaneous in the absence of pathogen infection, they are called lesion mimics. The spread of necrotic lesions in switchgrass is associated with plant development, indicating lesion formation may result from the activation of a programmed cell death (PCD) pathway. Consistent with the developmental pattern of the lesions, H2O2 is accumulated closely around the lesions on the leaves, suggesting that lesion formation is triggered by the alteration of levels of endogenous reactive oxygen species (ROS).
To clarify whether the lesion-mimic cell death phenotype was induced by single MTHFR silencing or double gene co-silencing, we classified transgenic switchgrass into three groups based on gene expression level and density of lesions. Comparisons between different groups showed that MTHFR and COMT synergistically induced lesions in switchgrass, suggesting an interactive effect of MTHFR and COMT in the cell death pathway. Although lacking any direct connections between lesion-mimic cell death phenotype and either of the two genes, previous studies did show that they had similar expression patterns at either transcriptional or protein level in response to defense. A proteome analysis of the cell death and resistance (cdr2) mutant in rice characterized differentially regulated proteins. Among these proteins, defense-related enzyme COMT and metabolic enzymes MTHFR and SAM2 showed similar up-regulated expression patterns, indicating that the PCD is associated with defense and active metabolic changes (Tsunezuka et al., 2005). Bhuiyan et al. (2007) reported that with the infection of Blumeria graminis f. sp. tritici (Bgt), the wheat COMT gene displayed a concomitant expression pattern with the genes involved in C1 pathway. In our study, MTHFR affects the lesion formation in a dose-dependent manner, thus we conclude that MTHFR plays a predominant role in inducing the lesion-mimic cell death phenotype. SAM, located downstream of MTHFR, functions as a precursor of ethylene (Moffatt and Weretilnyk, 2001), which has been reported to play a key role in controlling cell death and defense response in an Arabidopsis lesion mimic mutant vad1 (Bouchez et al., 2007). A photorespiration-related gene serine hydroxymethyltransferase (SHMT1), catalyzing the conversion between serine and 5,10-methylene-THF, which serve as the substrate for MTHFR (Supplementary Figure S8), plays a crucial role in restricting pathogen-induced cell death (Moreno et al., 2005). Therefore, the expression levels of switchgrass SAMS, 1-aminocyclopropane-1-carboxylate oxidase (ACO) (the hallmark gene in ethylene biosynthesis) and SHMT1 were examined. However, none of these gene expressions were correlated with lesion formation (Supplementary Figure S9). Thus, MTHFR and COMT mediated lesion-mimic cell death may go through a new pathway that has not been reported.
Transcriptomics and metabolomics analyses provide clues to decipher the relationships between lesion formation and gene functions. Microarray analysis identified some oxidative and defense related genes that are highly associated with the lesion-mimic cell death phenotype. Our results showed the lesion formation is the consequence of over-accumulation of H2O2. Given the crucial role of ROS in the initiation phase of different plants’ PCD (Mittler and Rizhsky, 2000; Van Breusegem and Dat, 2006), MTHFR and COMT may be involved in ROS-dependent cell death. It is well known that ROS are produced from enhanced enzymatic activity of plasma membrane-bound NADPH oxidases, cell-wall-bound peroxidases, and apoplastic amine oxidases during oxidative burst (Lamb and Dixon, 1997; Bolton, 2009). It has also been shown that peroxidase genes are involved ROS generation and cell death activation (Choi et al., 2007). Our microarray and qRT-PCR data demonstrated that the horseradish peroxidase gene was significantly induced. Horseradish peroxidase belongs to the class III plant peroxidases (Prxs) (EC 1.11.1.7), which are involved in a broad range of physiological processes (Almagro et al., 2009). Prxs mediates the oxidative coupling of three lignin subunits using H2O2 as the oxidant (Barceló,, 1997). Significantly altered lignin in MTHFR/COMT modified transgenic plants may result in surplus accumulation of Prxs and further induced H2O2. On the other hand, it has been reported that ROS has a strong interplay with other signaling molecules (phytohormones) during plant PCD (Overmyer et al., 2005; Van Breusegem and Dat, 2006). Hence, the striking up-regulation of genes involved in receptor kinases signaling and protein synthesis revealed by functional enrichment analysis suggests that the active defense response may be linked with ROS accumulation. Similarly, strong induction of hormone metabolism observed by pathway analysis is possibly the result of cross talk between phytohormones and ROS signal (Van Breusegem and Dat, 2006).
Phenolic acid metabolism in plants provides the precursors for lignin biosynthesis (Tamagnone et al., 1998), meanwhile, it also protects plants against oxidative damage (Schnablová, 2006). Disruption of monolignol production affects phenolic acid accumulation and further decreases plant defense ability (Tamagnone et al., 1998; Shen et al., 2012). In tobacco, inhibition of phenolic acid derivatives, especially chlorogenic acid, which is the most abundant phenolic ester, accounts for the induction of premature lesion-mimic cell death (Tamagnone et al., 1998). The underlying mechanism could be that the deficiency of antioxidants leads to an increase in the concentration of ROS above the threshold necessary to trigger cell death (Tamagnone et al., 1998). This also explains why lesions were more prevalent in mature and senescing leaves, where ROS were increasingly accumulated (Thompson et al., 1987; Prochazkova and Wilhelmova, 2007). However, the mechanism of inducing lesion-mimic cell death may be different in switchgrass. Although significantly decreased accumulation of chlorogenic acid was observed in young leaves of MTHFR/COMT modified plants, it was also reduced in single gene knockdown lines (Figure 7), where lesions were not observed. This suggests that in switchgrass, lesion-mimic-like phenotype is not caused by phenolics depletion. The total amino acids pool was not disturbed by modification of MTHFR and COMT genes in switchgrass. However, significant increase of amino acids was observed in old leaves of transgenics, especially in the MT/CO-Se line with strong lesion-mimic-like phenotype. This result indicates that the alterations of amino acids may be the consequence of active defense response. The strongly increased sugar metabolism in transgenic switchgrass probably functions as the supplier to replenish the depleted energy and carbon required for response to oxidative stress (Dauwe et al., 2007; Bolton, 2009). It has been suggested that allocating resources toward defense response occurs at the expense of plant fitness (Bolton, 2009). Substantial alterations in primary metabolism and gene expression in response to defense may compromise plant growth and development. Double transformants with severe lesion-mimic-like phenotype displayed reduced plant height, decreased dry matter biomass and delayed flowering (Figures 2A,B and Supplementary Table S1), suggesting strong co-silencing of MTHFR and COMT induced secondary effects in switchgrass.
In summary, unexpected results were obtained when co-silencing MTHFR and COMT in switchgrass. No significant additive effect between MTHFR and COMT was observed regarding lignification. However, MTHFR and COMT synergistically caused lesion-mimic-like cell death, and MTHFR played a predominant role in the process, suggesting a cross talk between the MTHFR-mediated C1 pathway and secondary metabolism (Supplementary Figure S8). In addition, simultaneous downregulation of MTHFR and COMT negatively affects plant growth and development.
Author Contributions
SL, Z-YW, and YZ designed research. SL, CF, JG, and DH performed research. SL, JG, LS, Z-YW, and YZ analyzed data. SL, Z-YW, and YZ wrote the paper.
Funding
This research was supported by China Scholarship Council, BioEnergy Science Center, The Samuel Roberts Noble Foundation and the Ministry of Science and Technology, PR China (2014BAD23B03-02, 2012AA101801).
Conflict of Interest Statement
The authors declare that the research was conducted in the absence of any commercial or financial relationships that could be construed as a potential conflict of interest.
Acknowledgments
We thank Amy Flanagan for critical reading of the manuscript, Stacy Allen for assistance with quantitative RT-PCR, Bonnie Watson with metabolic analysis.
Supplementary Material
The Supplementary Material for this article can be found online at: http://journal.frontiersin.org/article/10.3389/fpls.2017.00982/full#supplementary-material
Footnotes
- ^http://switchgrassgenomics.noble.org
- ^http://bioinfogp.cnb.csic.es/tools/venny/
- ^http://www.amdis.net/
- ^https://www.r-project.org/
References
Almagro, L., Ros, L. G., Belchi-Navarro, S., Bru, R., Barceló, A. R., and Pedreno, M. A. (2009). Class III peroxidases in plant defence reactions. J. Exp. Bot. 60, 377–390. doi: 10.1093/jxb/ern277
Barceló, A. R. (1997). Lignification in plant cell walls. Int. Rev. Cytol. 176, 87–132. doi: 10.1016/S0074-7696(08)61609-5
Barrière, Y., Riboulet, C., Méchin, V., Maltese, S., Pichon, M., Cardinal, A., et al. (2007). Genetics and genomics of lignification in grass cell walls based on maize as model species. Genes Genomes Genomics 1, 133–156.
Baxter, H. L., Alexander, L. W., Mazarei, M., Haynes, E., Turner, G. B., Sykes, R. W., et al. (2015). Hybridization of downregulated-COMT transgenic switchgrass lines with field selected switchgrass for improved biomass traits. Euphytica 209, 341–355. doi: 10.1007/s10681-016-1632-3
Baxter, H. L., Mazarei, M., Fu, C., Cheng, Q., Turner, G. B., Sykes, R. W., et al. (2016). Time course field analysis of COMT-downregulated switchgrass: lignification, recalcitrance, and rust susceptibility. BioEnergy Res. 9, 1087–1100. doi: 10.1007/s12155-016-9751-1
Baxter, H. L., Mazarei, M., Labbe, N., Kline, L. M., Cheng, Q., Windham, M. T., et al. (2014). Two-year field analysis of reduced recalcitrance transgenic switchgrass. Plant Biotechnol. J. 12, 914–924. doi: 10.1111/pbi.12195
Bhuiyan, N. H., Liu, W., Liu, G., Selvaraj, G., Wei, Y., and King, J. (2007). Transcriptional regulation of genes involved in the pathways of biosynthesis and supply of methyl units in response to powdery mildew attack and abiotic stresses in wheat. Plant Mol. Biol. 64, 305–318. doi: 10.1007/s11103-007-9155-x
Bolton, M. D. (2009). Primary metabolism and plant defense-fuel for the fire. Mol. Plant Microbe Interact. 22, 487–497. doi: 10.1094/MPMI-22-5-0487
Bouchez, O., Huard, C., Lorrain, S., Roby, D., and Balagué, C. (2007). Ethylene is one of the key elements for cell death and defense response control in the Arabidopsis lesion mimic mutant vad1. Plant Physiol. 145, 465–477. doi: 10.1104/pp.107.106302
Bout, S., and Vermerris, W. (2003). A candidate-gene approach to clone the sorghum Brown midrib gene encoding caffeic acid O-methyltransferase. Mol. Genet. Genomics 269, 205–214.
Broeckling, C. D., Huhman, D. V., Farag, M. A., Smith, J. T., May, G. D., Mendes, P., et al. (2005). Metabolic profiling of Medicago truncatula cell cultures reveals the effects of biotic and abiotic elicitors on metabolism. J. Exp. Bot. 56, 323–336. doi: 10.1093/jxb/eri058
Broeckling, C. D., Reddy, I. R., Duran, A. L., Zhao, X., and Sumner, L. W. (2006). MET-IDEA: data extraction tool for mass spectrometry-based metabolomics. Anal. Chem. 78, 4334–4341. doi: 10.1021/ac0521596
Casler, M. D., Tobias, C. M., Kaeppler, S. M., Buell, C. R., Wang, Z.-Y., Cao, P., et al. (2011). The switchgrass genome: tools and strategies. Plant Genome 4, 273–282. doi: 10.3835/plantgenome2011.10.0026
Chen, F., and Dixon, R. A. (2007). Lignin modification improves fermentable sugar yields for biofuel production. Nat. Biotechnol. 25, 759–761. doi: 10.1038/nbt1316
Chen, F., Kota, P., Blount, J. W., and Dixon, R. A. (2001). Chemical syntheses of caffeoyl and 5-OH coniferyl aldehydes and alcohols and determination of lignin O-methyltransferase activities in dicot and monocot species. Phytochemistry 58, 1035–1042. doi: 10.1016/S0031-9422(01)00391-0
Choi, H. W., Kim, Y. J., Lee, S. C., Hong, J. K., and Hwang, B. K. (2007). Hydrogen peroxide generation by the pepper extracellular peroxidase CaPO2 activates local and systemic cell death and defense response to bacterial pathogens. Plant Physiol. 145, 890–904. doi: 10.1104/pp.107.103325
Daudi, A., and O’Brien, J. A. (2012). Detection of hydrogen peroxide by DAB staining in Arabidopsis leaves. Bio Protoc. 2:e263. doi: 10.21769/BioProtoc.263
Dauwe, R., Morreel, K., Goeminne, G., Gielen, B., Rohde, A., Van Beeumen, J., et al. (2007). Molecular phenotyping of lignin-modified tobacco reveals associated changes in cell-wall metabolism, primary metabolism, stress metabolism and photorespiration. Plant J. 52, 263–285. doi: 10.1111/j.1365-313X.2007.03233.x
DeBruyn, J. M., Bevard, D. A., Essington, M. E., McKnight, J. Y., Schaeffer, S. M., Baxter, H. L., et al. (2016). Field-grown transgenic switchgrass (Panicum virgatum L.) with altered lignin does not affect soil chemistry, microbiology, and carbon storage potential. GCB Bioenergy 9, 1100–1109. doi: 10.1111/gcbb.12407
Doyle, J. J. (1987). A rapid DNA isolation procedure for small quantities of fresh leaf tissue. Phytochem. Bull. 19, 11–15.
Dozmorov, I., and Centola, M. (2003). An associative analysis of gene expression array data. Bioinformatics 19, 204–211. doi: 10.1093/bioinformatics/19.2.204
Dumitrache, A., Natzke, J., Rodriguez, M., Yee, K., Thompson, O., Poovaiah, C., et al. (2016). Transgenic switchgrass (Panicum virgatum L.) targeted for reduced recalcitrance to bioconversion: a two-year comparative analysis of field-grown lines modified for target gene or genetic element expression. Plant Biotechnol. J. 15, 688–697. doi: 10.1111/pbi.12666
Fu, C., Mielenz, J. R., Xiao, X., Ge, Y., Hamilton, C. Y., Rodriguez, M., et al. (2011). Genetic manipulation of lignin reduces recalcitrance and improves ethanol production from switchgrass. Proc. Natl. Acad. Sci. U.S.A. 108, 3803–3808. doi: 10.1073/pnas.1100310108
Fu, C., Sunkar, R., Zhou, C., Shen, H., Zhang, J. Y., Matts, J., et al. (2012). Overexpression of miR156 in switchgrass (Panicum virgatum L.) results in various morphological alterations and leads to improved biomass production. Plant Biotechnol. J. 10, 443–452. doi: 10.1111/j.1467-7652.2011.00677.x
Funnell-Harris, D. L., Pedersen, J. F., and Sattler, S. E. (2010). Alteration in lignin biosynthesis restricts growth of Fusarium spp. in brown midrib sorghum. Phytopathology 100, 671–681. doi: 10.1094/PHYTO-100-7-0671
Giovanelli, J., Mudd, S. H., and Datko, A. H. (1985). Quantitative analysis of pathways of methionine metabolism and their regulation in Lemna. Plant Physiol. 78, 555–560. doi: 10.1104/pp.78.3.555
Guillaumie, S., Goffner, D., Barbier, O., Martinant, J. P., Pichon, M., and Barrière, Y. (2008). Expression of cell wall related genes in basal and ear internodes of silking brown-midrib-3, caffeic acid O-methyltransferase (COMT) down-regulated, and normal maize plants. BMC Plant Biol. 8:71. doi: 10.1186/1471-2229-8-71
Guo, D., Chen, F., Inoue, K., Blount, J. W., and Dixon, R. A. (2001). Downregulation of caffeic acid 3-O-methyltransferase and caffeoyl CoA 3-O-methyltransferase in transgenic alfalfa: impacts on lignin structure and implications for the biosynthesis of G and S lignin. Plant Cell 13, 73–88. doi: 10.1105/tpc.13.1.73
Hanson, A. D., Gage, D. A., and Shachar-Hill, Y. (2000). Plant one-carbon metabolism and its engineering. Trends Plant Sci. 5, 206–213. doi: 10.1016/S1360-1385(00)01599-5
Hardin, C. F., Fu, C., Hisano, H., Xiao, X., Shen, H., Stewart, C. N., et al. (2013). Standardization of switchgrass sample collection for cell wall and biomass trait analysis. BioEnergy Res. 6, 755–762. doi: 10.1007/s12155-012-9292-1
Hatfield, R. D., Grabber, J., Ralph, J., and Brei, K. (1999). Using the acetyl bromide assay to determine lignin concentrations in herbaceous plants: some cautionary notes. J. Agric. Food Chem. 47, 628–632. doi: 10.1021/jf9808776
Hatfield, R. D., Rancour, D. M., and Marita, J. M. (2017). Grass cell walls: a story of cross-linking. Front. Plant Sci. 7:2056. doi: 10.3389/fpls.2016.02056
Hung, C. Y., Fan, L., Kittur, F. S., Sun, K., Qiu, J., Tang, S., et al. (2013). Alteration of the alkaloid profile in genetically modified tobacco reveals a role of methylenetetrahydrofolate reductase in nicotine N-demethylation. Plant Physiol. 161, 1049–1060. doi: 10.1104/pp.112.209247
Irizarry, R. A., Hobbs, B., Collin, F., Beazerbarclay, Y. D., Antonellis, K. J., Scherf, U., et al. (2003). Exploration, normalization, and summaries of high density oligonucleotide array probe level data. Biostatistics 4, 249–264. doi: 10.1093/biostatistics/4.2.249
Kuc, J., Nelson, O. E., and Flanagan, P. (1968). Degradation of abnormal lignins in the brown-midrib mutants and double mutants of maize. Phytochemistry 7, 1435–1436. doi: 10.1016/S0031-9422(00)85656-3
Lamb, C., and Dixon, R. A. (1997). The oxidative burst in plant disease resistance. Annu. Rev. Plant Biol. 48, 251–275. doi: 10.1146/annurev.arplant.48.1.251
Lapierre, C., Pollet, B., and Rolando, C. (1995). New insights into the molecular architecture of hardwood lignins by chemical degradative methods. Res. Chem. Intermed. 21, 397–412. doi: 10.1007/BF03052266
Li, D., Zhou, M., Li, Z., and Luo, H. (2014). “MicroRNAs and their potential applications in switchgrass improvements,” in Compendium of Bioenergy Plants: Switchgrass, eds H. Luo and Y. Wu (Boca Raton, FL: CRC Press), 228–252.
Li, L., Hill-Skinner, S., Liu, S., Beuchle, D., Tang, H. M., Yeh, C. T., et al. (2015). The maize brown midrib4 (bm4) gene encodes a functional folylpolyglutamate synthase. Plant J. 81, 493–504. doi: 10.1111/tpj.12745
Li, M., Pu, Y., Yoo, C., Gjersing, E., Decker, S. R., Doeppke, C., et al. (2016). Study of traits and recalcitrance reduction of field-grown COMT down-regulated switchgrass. Biotechnol. Biofuels 10, 12. doi: 10.1186/s13068-016-0695-7
Mittler, R., and Rizhsky, L. (2000). Transgene-induced lesion mimic. Plant Mol. Biol. 44, 335–344. doi: 10.1023/A:1026544625898
Moffatt, B. A., and Weretilnyk, E. A. (2001). Sustaining S-adenosyl-L-methionine-dependent methyltransferase activity in plant cells. Physiol. Plant. 113, 435–442. doi: 10.1034/j.1399-3054.2001.1130401.x
Moreno, J. I., Martín, R., and Castresana, C. (2005). Arabidopsis SHMT1, a serine hydroxymethyltransferase that functions in the photorespiratory pathway influences resistance to biotic and abiotic stress. Plant J. 41, 451–463. doi: 10.1111/j.1365-313X.2004.02311.x
Muller, L. D., Lechtenberg, V. L., Bauman, L. F., Barnes, R. F., and Rhykerd, C. L. (1972). In vivo evaluation of a brown midrib mutant of Zea mays L. J. Anim. Sci. 35, 883–889. doi: 10.2527/jas1972.354883x
Nageswara-Rao, M., Soneji, J. R., Kwit, C., and Stewart, C. N. (2013). Advances in biotechnology and genomics of switchgrass. Biotechnol. Biofuels 6:77. doi: 10.1186/1754-6834-6-77
Overmyer, K., Brosché, M., Pellinen, R., Kuittinen, T., Tuominen, H., Ahlfors, R., et al. (2005). Ozone-induced programmed cell death in the Arabidopsis radical-induced cell death1 mutant. Plant Physiol. 137, 1092–1104. doi: 10.1104/pp.104.055681
Palmer, N. A., Sattler, S. E., Saathoff, A. J., Funnell, D., Pedersen, J. F., and Sarath, G. (2008). Genetic background impacts soluble and cell wall-bound aromatics in brown midrib mutants of sorghum. Planta 229, 115–127. doi: 10.1007/s00425-008-0814-1
Pinçon, G., Maury, S., Hoffmann, L., Geoffroy, P., Lapierre, C., Pollet, B., et al. (2001). Repression of O-methyltransferase genes in transgenic tobacco affects lignin synthesis and plant growth. Phytochemistry 57, 1167–1176. doi: 10.1016/S0031-9422(01)00098-X
Prochazkova, D., and Wilhelmova, N. (2007). Leaf senescence and activities of the antioxidant enzymes. Biol. Plant. 51, 401–406. doi: 10.1007/s10535-007-0088-7
Quentin, M., Allasia, V., Pegard, A., Allais, F., Ducrot, P. H., Favery, B., et al. (2009). Imbalanced lignin biosynthesis promotes the sexual reproduction of homothallic oomycete pathogens. PLoS Pathog. 5:e1000264. doi: 10.1371/journal.ppat.1000264
Roje, S., Wang, H., McNeil, S. D., Raymond, R. K., Appling, D. R., Shachar-Hill, Y., et al. (1999). Isolation, characterization, and functional expression of cDNAs encoding NADH-dependent methylenetetrahydrofolate reductase from higher plants. J. Biol. Chem. 274, 36089–36096. doi: 10.1074/jbc.274.51.36089
Schmer, M. R., Vogel, K. P., Mitchell, R. B., and Perrin, R. K. (2008). Net energy of cellulosic ethanol from switchgrass. Proc. Natl. Acad. Sci. U.S.A. 105, 464–469. doi: 10.1073/pnas.0704767105
Schnablová, R., Synková, H., Vièánková, A., Burketová, L., Eder, J., and Cvikrová, M. (2006). Transgenic ipt tobacco overproducing cytokinins overaccumulates phenolic compounds during in vitro growth. Plant Physiol. Biochem. 44, 526–534. doi: 10.1016/j.plaphy.2006.09.004
Shen, H., He, X., Poovaiah, C. R., Wuddineh, W. A., Ma, J., Mann, D. G., et al. (2012). Functional characterization of the switchgrass (Panicum virgatum) R2R3-MYB transcription factor PvMYB4 for improvement of lignocellulosic feedstocks. New Phytol. 193, 121–136. doi: 10.1111/j.1469-8137.2011.03922.x
Shen, H., Mazarei, M., Hisano, H., Escamilla-Trevino, L., Fu, C., Pu, Y., et al. (2013). A genomics approach to deciphering lignin biosynthesis in switchgrass. Plant Cell 25, 4342–4361. doi: 10.1105/tpc.113.118828
Srivastava, A. C., Chen, F., Ray, T., Pattathil, S., Peña, M. J., Avci, U., et al. (2015). Loss of function of folylpolyglutamate synthetase 1 reduces lignin content and improves cell wall digestibility in Arabidopsis. Biotechnol. Biofuels 8, 224. doi: 10.1186/s13068-015-0403-z
Tamagnone, L., Merida, A., Stacey, N., Plaskitt, K., Parr, A., Chang, C. F., et al. (1998). Inhibition of phenolic acid metabolism results in precocious cell death and altered cell morphology in leaves of transgenic tobacco plants. Plant Cell 10, 1801–1816. doi: 10.1105/tpc.10.11.1801
Tang, H. M., Liu, S., Hill-Skinner, S., Wu, W., Reed, D., Yeh, C. T., et al. (2014). The maize brown midrib2 (bm2) gene encodes a methylenetetrahydrofolate reductase that contributes to lignin accumulation. Plant J. 77, 380–392. doi: 10.1111/tpj.12394
Thimm, O., Bläsing, O., Gibon, Y., Nagel, A., Meyer, S., Krüger, P., et al. (2004). MAPMAN: a user-driven tool to display genomics data sets onto diagrams of metabolic pathways and other biological processes. Plant J. 37, 914–939. doi: 10.1111/j.1365-313X.2004.02016.x
Thompson, J. E., Legge, R. L., and Barber, R. F. (1987). The role of free radicals in senescence and wounding. New Phytol. 105, 317–344. doi: 10.1111/j.1469-8137.1987.tb00871.x
Tsunezuka, H., Fujiwara, M., Kawasaki, T., and Shimamoto, K. (2005). Proteome analysis of programmed cell death and defense signaling using the rice lesion mimic mutant cdr2. Mol. Plant Microbe Interact. 18, 52–59. doi: 10.1094/MPMI-18-0052
Usadel, B., Nagel, A., Steinhauser, D., Gibon, Y., Bläsing, O. E., Redestig, H., et al. (2006). PageMan: an interactive ontology tool to generate, display, and annotate overview graphs for profiling experiments. BMC Bioinformatics 7:535. doi: 10.1186/1471-2105-7-535
Van Breusegem, F., and Dat, J. F. (2006). Reactive oxygen species in plant cell death. Plant Physiol. 141, 384–390. doi: 10.1104/pp.106.078295
Vermerris, W., Sherman, D. M., and McIntyre, L. M. (2010). Phenotypic plasticity in cell walls of maize brown midrib mutants is limited by lignin composition. J. Exp. Bot. 61, 2479–2490. doi: 10.1093/jxb/erq093
Vignols, F., Rigau, J., Torres, M. A., Capellades, M., and Puigdomènech, P. (1995). The brown midrib3 (bm3) mutation in maize occurs in the gene encoding caffeic acid O-methyltransferase. Plant Cell 7, 407–416. doi: 10.1105/tpc.7.4.407
Wang, Z.-Y., and Brummer, E. C. (2012). Is genetic engineering ever going to take off in forage, turf and bioenergy crop breeding? Ann. Bot. 110, 1317–1325. doi: 10.1093/aob/mcs027
Keywords: bioenergy crop, caffeic acid O-methyltransferase (COMT), lesion-mimic cell death, lignin, methylenetetrahydrofolate reductase (MTHFR), Panicum virgatum, switchgrass, transgenic plants
Citation: Liu S, Fu C, Gou J, Sun L, Huhman D, Zhang Y and Wang Z -Y (2017) Simultaneous Downregulation of MTHFR and COMT in Switchgrass Affects Plant Performance and Induces Lesion-Mimic Cell Death. Front. Plant Sci. 8:982. doi: 10.3389/fpls.2017.00982
Received: 11 April 2017; Accepted: 24 May 2017;
Published: 20 June 2017.
Edited by:
Maurice Bosch, Aberystwyth University, United KingdomReviewed by:
Aymerick Eudes, Lawrence Berkeley National Laboratory, United StatesMan Zhou, University of Minnesota, United States
Curtis G. Wilkerson, Michigan State University, United States
Copyright © 2017 Liu, Fu, Gou, Sun, Huhman, Zhang and Wang. This is an open-access article distributed under the terms of the Creative Commons Attribution License (CC BY). The use, distribution or reproduction in other forums is permitted, provided the original author(s) or licensor are credited and that the original publication in this journal is cited, in accordance with accepted academic practice. No use, distribution or reproduction is permitted which does not comply with these terms.
*Correspondence: Yunwei Zhang, zywei@126.com Zeng-Yu Wang, zywang@noble.org