 Yun Bai
 Dan Wu1
 Peng Chen
 Mengzhu Lu
 Bo Zheng
- 1Key Laboratory of Horticultural Plant Biology of Ministry of Education, College of Horticulture and Forestry Sciences, Huazhong Agricultural University, Wuhan, China
- 2National Key Laboratory of Crop Genetic Improvement and National Centre of Plant Gene Research, College of Plant Science and Technology, Huazhong Agricultural University, Wuhan, China
- 3State Key Laboratory of Tree Genetics and Breeding, Research Institute of Forestry, Chinese Academy of Forestry, Beijing, China
Pectin is a major component of plant cell walls, and the structure of pectin impacts on the properties of wood. Although we know that pectate lyase (PL, EC 4.2.2.2) has a major influence on the structure of pectin, our knowledge of Pectate lyase-like genes (PLL) in tree species remains limited. To better understand the characteristics of PLL genes in trees and to identify novel PLL genes that are potentially involved in the development of wood, we performed comprehensive analyses of gene structures, phylogenetic relationships, chromosomal locations, gene duplication events, conserved protein motifs, and gene expression patterns of 30 PLLs in Populus trichocarpa (PtPL1s). We performed an in silico gene expression profiling and quantitative real-time PCR analysis and found that most of the PtPL1 genes from subgroups Ia and Ib were highly expressed in xylem. PtPL1-18 from subgroup Ia was preferentially expressed in developing primary xylem and in xylem cells that were developing secondary walls. Overexpression of PtPL1-18 in poplar reduced plant growth and xylem development. Reduced secondary cell wall thickening and irregular xylem cells were observed in the transgenic trees, probably due to their lower pectin content. Although pectin is not a major component of plant secondary cell walls, our results are consistent with the PtPL1 genes performing important functions during wood formation.
Introduction
Populus is a genus of trees among the most important boreal broadleaf trees, for its plentiful and renewable supplies of wood in pulping, construction, and energy industries. In addition, it has been proposed to be a sustainable energy source for biofuel production (Carroll and Somerville, 2009). Formation of wood is a sequential developmental process, including vascular cambial division, differentiation of secondary xylem mother cells, cell expansion, massive deposition of secondary walls, programmed cell death, and formation of heartwood (Plomion et al., 2001). Formation of secondary cell wall is essential for wood development and has been comprehensively studied, with focus on cellulose, hemicellulose, and lignin, the three main compositions of wood (Ye and Zhong, 2015). However, the study of relation between pectin and secondary wall was limited. It is known that pectin mainly exists in the primary cell wall and the middle lamella of plants.
Pectin consists of homogalacturonan (HG), rhamnogalacturonan I (RG-I), the substituted galacturonans rhamnogalacturonan II (RG-II), and xylogalacturonan (XGA), which are polysaccharides rich in galacturonic acid (Mohnen, 2008). Pectin is degraded by different pectinases: the acetyl and methoxyl residues of polygalacturonic acids are detached by pectin esterases: pectin acetylesterases (PAEs) and pectin methylesterases (PMEs), respectively; polygalacturonases (PGs) hydrolyze glycosidic bonds between galacturonic acid residues to degrade polygalacturonan; and pectate lyase (PLs) depolymerize pectin polymer by β elimination, bring unsaturated oligosaccharides as a result (Yadav et al., 2009). Plant pectate lyases (PELs, EC 4.2.2.2) belong to polysaccharide lyase family 1 (PL1)1. The classification of PELs is based on their activity in cleavage of the α-(1,4)-glycosidic bond between the galacturonic acid units of HG (Marin-Rodriguez et al., 2002; Yadav et al., 2009).
Polysaccharide lyase family 1 enzymes have been extensively characterized in study of plant disease caused by pathogenic microorganisms, such as Erwinia chrysanthemi, an extracellular causal agent of soft rot disease in many plant species (Barras et al., 1994). PL1 genes are expressed in a variety of plant tissues, including pistils (Wu et al., 1996; Kulikauskas and McCormick, 1997), tracheary elements (Domingo et al., 1998; Milioni et al., 2001), latex (Pilatzke-Wunderlich and Nessler, 2001), fibers (Wang H. et al., 2010) and ripening fruits (Marin-Rodriguez et al., 2003).
Genome-wide expression analysis in Arabidopsis have suggested PL1s’ functions in growth programmed for cell separation. All AtPL1 genes are expressed in flowers, several of them are highly expressed in pollen (Palusa et al., 2007; Sun and van Nocker, 2010). In Populus, the vascular cambium (VC) and adjacentradial expansion (RE) zone are the sites of highest expression of genes encoding wall-modifying enzymes, including expansins, XETs, cellulases, PMEs, PGs, and pectate lyases (PL1s) (Mellerowicz and Sundberg, 2008). PtxtPL1-27 is specifically expressed in differentiating xylem at the onset of secondary wall formation. Overexpression of this gene in poplar can substantially modify the extractability of cell wall polymers from xylem tissues and enhance saccharification (Biswal et al., 2014).
However, our knowledge of PL1 genes in Populus and their functions during wood formation is still very limited. In this study, we performed a genome-wide characterization of PL1 gene family in P. trichocarpa, and presented here comprehensive analysis of their phylogeny, gene structure, chromosomal location, gene duplication, conserved motifs, and expression patterns, in aim to identify novel PL1 candidate genes involved in wood formation. One Populus PL1 candidate gene, PtPL1-18, was further studied by overexpression analysis in hybrid poplar. We found that the PtPL1-18ox transgenic plants showed reduced plant height, as well as reduced pectin abundance in xylem tissues compared to control plant. The thickness of cell walls of xylem fiber cells was also reduced, suggesting that this gene was participating in pectin biogenesis for maintaining proper cell wall structure and xylem function in Populus.
Materials and Methods
Plant Material and Growth Condition
Populus trichocarpa Nisqually-1 and 717 hybrid poplar (P. tremula × P. alba, clone717-1B4) (Leplé et al., 1992) were used for gene cloning and transformation, respectively. Poplar plants were multiplied by tissue culture and subsequently grown in a controlled environmental growth room at a constant 25°C day/night temperature, 16 h photoperiod, light intensity of 100 μmol s-1 m-2, and relative humidity level of 60%.
Pectate Lyase Gene Family in P. trichocarpa
Protein sequences of the 26 known AtPLL (Pectate Lyase-Like) genes were downloaded from the Arabidopsis database (TAIR2). A BLASTP search was performed using the protein sequences from Pec_Lyase_C domain of the AtPLL proteins as the query to identify their homologs in poplar from JGI3 and Phytozome4 (Goodstein et al., 2012). These two websites contain all three versions—v1.1, v2.2 and v3.0—of P. trichocarpa genome. Genomic sequences and open reading frames (ORFs) of PtPL1s were obtained from Phytozome V11.0 and checked by softberry-FGENESH on line5 (Solovyev et al., 2006). The candidate PtPL1 genes were verified for the presence of a Pec_Lyase_C domain by online analysis program of SMART (Simple Modular Architecture Research Tool6) (Letunic et al., 2015). SMART and SignalP 4.0 server7 (Petersen et al., 2011) were used to identify the potential signal peptides in PtPL1s. TargetP 1.1 server8 (Emanuelsson et al., 2000) was used to predict subcellular localization. The theoretical isoelectric point (pI) and molecular weight (MW) of PtPL1s were calculated using the Compute pI/Mw tool on the ExPASy server9 (Gasteiger et al., 2005). Gene structures were displayed with R program. A neighbor joining (NJ) (Saitou and Nei, 1987) tree of PtPL1s was generated by MEGA5.1 software (Tamura et al., 2011). Bootstrap analysis was performed with 1000 iterations.
Multiple Sequence Alignment of PtPL1 Protein Sequences and Motif Analysis
Protein sequences of PtPL1s were imported into BioEdit v7.2.5 (Hall, 1999) and aligned with Clustalx program (Thompson et al., 1997). GENEDOC program (Nicholas et al., 1997) was used to generate the output file. MEME online tool10 (Bailey et al., 2006) was used for the conserved motif analysis, with the following parameters: number of repetitions, any; maximum number of motifs, 10; optimum motif width, between 6 and 50; and e-value cut off at 1.0 e-10.
Gene Duplication Analysis and Estimation of Ka/Ks Ratios
The chromosomal position of all PtPL1 genes was retrieved from the Phytozome website. The gene ID information of PtPL1 genes was imported into PopGenIE (The Populus Genome Integrative Explorer11) (Sjodin et al., 2009) to illustrate their relative position in the chromosomal diagram. Paralogous gene pairs based on phylogenic analysis and chromosomal positional information were selected for the analysis of gene duplication type. The segmental duplicated PtPL1 genes were identified based on previous annotation (Tuskan et al., 2006). Tandem gene duplications were identified according to the criteria that duplication of five or fewer gene loci occurred within 100 kb distance (Finn et al., 2006; Hu et al., 2010). While the two genes in every pair located on different duplication blocks, they should be the products of retrotransposition (Cao and Li, 2015). To estimate the evolutionary time of duplicated genes, Ka/Ks_Calculator software was used to get the Ka and Ks values of paralogous gene pairs (Wang D. et al., 2010). Ks values were converted into duplication time in millions of years (MYA) based on a rate of one substitution per synonymous site per year. The time of duplication events (T) was calculated as T = Ks/2λ × 10-6 MYA. λ, the clock-like rate, was set as 9.0 × 10⁻⁹ for Populus (Lynch and Conery, 2000).
In Silico Gene Expression Analysis
The expression data of various PtPL1 genes from different tissues (mature leaves; young leaves; roots; dark-grown seedlings; dark-grown seedlings, etiolated, exposed to light for 3 h; continuous light grown seedlings; female catkins; male catkins and xylem) were obtained from the Poplar eFP browser12 (Wilkins et al., 2009). The probe sets of the PtPL1 genes were obtained by the probe match tool from NetAffxTM Analysis center13. A heat map was generated based on the gene expression data, using the MultiExperiment Viewer Program (MeV 4.7.3) (Howe et al., 2010).
RNA Extraction and qRT-PCR Analysis
Tissue samples were collected in August of 2014 from a 3-year-old 717 poplar plant in the campus of Huazhong Agricultural University, Wuhan, China. Fifteen tissues were analyzed: apex (A), dormant apex (DA), dormant lateral bud (DLB), the 2nd, 3rd, 4th, 5th, and 9th internode of the main stem (IN2, IN3, IN4, IN5, and IN9, respectively), young leaves (YL), mature leaves (ML), petiole (P), primary root (PR), secondary root (SR), xylem and cambium (XC), phloem and cambium (PC). All samples were collected in triplicates and immediately frozen in liquid nitrogen. Total RNA was extracted using CTAB method (Li et al., 2008). The quality and concentration of each RNA sample was determined using a NanoDrop 2000 spectrophotometer (Thermo Scientific). RNA samples that met the criterion (A260/A280 ratio of 1.8–2.1, A260/A230 ratio ≥ 2.0) were stored at -80°C for further use. The cDNA was synthesized from 0.5 μg RNA using the PrimeScriptTM RT Kit (TaKaRa, Dalian). qRT-PCR was performed in duplicates using 2×SYBR qPCR Mix without ROX (ZOMANBIO, Beijing) on a 7500 Fast Real-Time PCR System (Applied Biosystems). PtACTIN (Potri.019G010400) was used as reference gene. The sequences of qRT primers for PtPL1 genes were listed in Supplementary Table S1. ΔΔCt method was used to calculate gene relative expression (Pfaffl, 2001). All reactions were repeated with three biological replicates.
Plasmid Construction and Generation of Transgenic Plants
For the construction of overexpression lines, the CDS region of PtPL1-18 was amplified by PCR and cloned into GatewayTM entry vector pDONR201. The vector with the correct sequences was subsequently recombined into destination vector pK2GW7 with promoter CaMV35S, to generate destination vector ready for Agrobacterium and Populus transformation. For promoter activity analysis, the 2.0 kb upstream promoter region of PtPL1-18 was amplified by PCR and cloned into pDONR201. The verified entry vector was recombined into destination vector pKGWFS7 (Karimi et al., 2002). Agrobacterium tumefaciens strain C58 was used for poplar transformation (Leplé et al., 1992). Positive transgenic lines were selected by Kanamycin resistance, then verified by PCR with specific primers (Supplementary Table S1) for each fragments. Overexpression lines were further characterized by semi-quantitative RT-PCR with 30 cycles used specific primers in Supplementary Table S1 to test the transcript level of PtPL1-18. To estimate the increase of transcript accumulation level in three selected over-expressing plants, the 12th internodes of 4-month-old PtPL1-18 overexpression plants and 717 plants were collected to conduct qRT-PCR analysis with above methods. PtACTIN (Potri.019G010400) was used as reference gene. The sequences of qRT-PCR primers were listed in Supplementary Table S1.
Anatomical and Histochemical Analysis of Transgenic Plants
Hybrid poplar 717 and three independent PtPL1-18 overexpression lines were propagated by tissue culture and transferred to soil. Plant height and stem diameter were measured after 4 months of growth, from six randomly selected individual plants per line. Cross sections were made from the 12th internodes and the corresponding petioles using vibratome (Leica VT 1200S, Germany). The sections were stained with 5% (w/v) phloroglucinol in 12% (v/v) HCl for indication of lignification, and observed under bright field microscope (Olympus BX63, Japan) for digital imaging.
For GUS assay, internode 4, 7, and 12 of the main stem and their corresponding petioles were collected from transgenic plants carrying PtPL1-18pro:GUS, washed twice with 50 mM sodium phosphate buffer (pH 7.0), and incubated in X-gluc reaction solution (1 mM X-gluc, 50 mM sodium phosphate, pH 7.0, 0.1% Triton X-100, 1 mM potassium ferricyanide and 1 mM potassium ferrocyanide) at 37°C overnight. Then 40 μm thick cross sections were prepared using vibratome (Leica VT 1200S, Germany), cleared with 75% ethanol and observed under bright-field microscope (Olympus BX63, Japan).
Cell Wall Composition Analysis of PtPL1-18 Overexpression Lines
The 12th internodes of 4-month-old PtPL1-18 overexpression plants and 717 plants were collected. The material for cell wall composition analysis was inactivated at 105°C for 30 min, dried to constant weight at 50°C, grounded into powder and filtered through a 40 mesh screen. A cell wall polymer fractionation procedure described previously (Wu et al., 2013) was used. The soluble sugar, lipids and starch of the biomass samples were consecutively removed by potassium phosphate buffer (pH 7.0), chloroform-methanol (1:1, v/v) and DMSO-water (9:1, v/v). The crude cell wall material was suspended in 0.5% (w/v) ammonium oxalate and heated for 1 h in a boiling water bath, and the supernatants were combined as total pectin. The remaining pellet was suspended in 4M KOH containing 1.0 mg mL-1 sodium borohydride for 1 h at 25°C, and the combined supernatant was neutralized, dialyzed and lyophilized as hemicelluloses. The remaining pellet was extracted with H2SO4 (67%, v/v) for 1 h at 25°C and the supernatants were collected for determination of free hexoses and pentoses as total cellulose and non-KOH-extractable hemicelluloses. The total hemicelluloses is the sum of KOH- and non-KOH-extractable hemicelluloses. UV–VIS Spectrometer (V-1100D, Shanghai MAPADA Instruments Co., Ltd., Shanghai, China) was used for the absorbance reading according to Xu et al. (2012). The total lignin is the sum of acid-insoluble and acid -soluble lignin. The acid-insoluble lignin was calculated gravimetrically as acid-insoluble residue after correction for ash, and the acid-soluble lignin was measured by UV spectroscopy. All experiments were carried out in triplicate.
Immunolocalization of Pectin Epitopes in Stem of PtPL1-18 Overexpression Lines
The 7th internodes from 2-month-old poplar propagated by tissue culture were fixed for 2.5 h in 4% (w/v) paraformaldehyde. Tissues were dehydrated through an ethanol series (30, 40, 50, 60, 75, 80, 95, and 100% [v/v]) for 40 min and embedded in paraffin. Samples were sectioned with 8 μm thickness using a Leica RM2265 rotary microtome. After the removal of paraffin, sections were blocked with 3% (w/v) non-fat milk in 10–15 μL 10 mM potassium phosphate buffered saline (KPBS, pH = 7.1) for 1 h. The slides were pretreated with poly-lysine. All of the following steps were conducted in a petri dish chamber with soaked tissue paper to keep certain humidity level. Sections were incubated with primary antibodies (10–15 mL of each sample) for 2 h at room temperature. CCRC-M35 (Pattathil et al., 2010) and JIM5 (Clausen et al., 2003) monoclonal antibodies were used in this analysis, with a dilution factor of 5- and 10-fold, respectively. Sections were subsequently washed three times with 10 mM KPBS, each step for at least 5 min. The sections were incubated with anti-mouse Alexa fluor 488 [IgG (H + L), Invitrogen, A11001] for CCRC-M35 and anti-rat Alexa fluor 488 [IgG (H + L), Invitrogen, A-11006] for JIM5, respectively. The two secondary antibodies were linked to Fluorescein-isothiocyanate (FITC), and a 100-fold dilution in 10 mM KPBS was used. Sections were washed at least three times again with 10 mM KPBS and finally with water before visualized under Olympus BX-61 fluorescent microscope (Avci et al., 2012). All experiments were carried out in triplicate.
Statistical Analysis
The experimental data was subjected to Analysis of Variance (ANOVA) using SAS version 8.0 (SAS Institute Inc., Cary, NC, United States). ∗∗ or ∗ indicated significant difference between means at p < 0.01 or p < 0.05, respectively, by Student’s t-test.
Results
Characterization of PtPL1 Genes in P. trichocarpa
The Pec_Lyase_C domain of the AtPLL proteins was used as the query to identify their homologs in poplar from JGI and Phytozome database by BLASTP search tool. In total, there were 30 full-length PtPL1 genes in the P. trichocarpa genome. Twenty-eight of them have been previously identified in the first version of Populus genome, named as PtPL1-1 to PtPL1-28 (Geisler-Lee et al., 2006); and one member was identified in the Populus assembly v2.2, named as PtPL1-29 (Biswal et al., 2014). In this study, a novel PtPL1 gene (Potri.012G091300) was identified in the Populus assembly v3.0, named as PtPL1-30 (Supplementary Table S2).
The PtPL1 gene family was classified into five groups—I, II, III, IV, and V—based on phylogenetic analysis (Figure 1) (Biswal et al., 2014). Group I had the most members and could be further classified into four subgroups—Ia, Ib, Ic, and Id. The newly identified PtPL1-30 gene belonged to subgroup Ia. Gene structures of all PtPL1 genes were predicted to confirm the conservation within each group/subgroup (Figure 1). The coding regions of PtPL1 genes were interrupted by two to six introns: subgroup Ib possessed six introns, while other group/subgroup had an average of three to four introns. Each group/subgroup shared similar gene structure in terms of the number and the length of exons and introns.
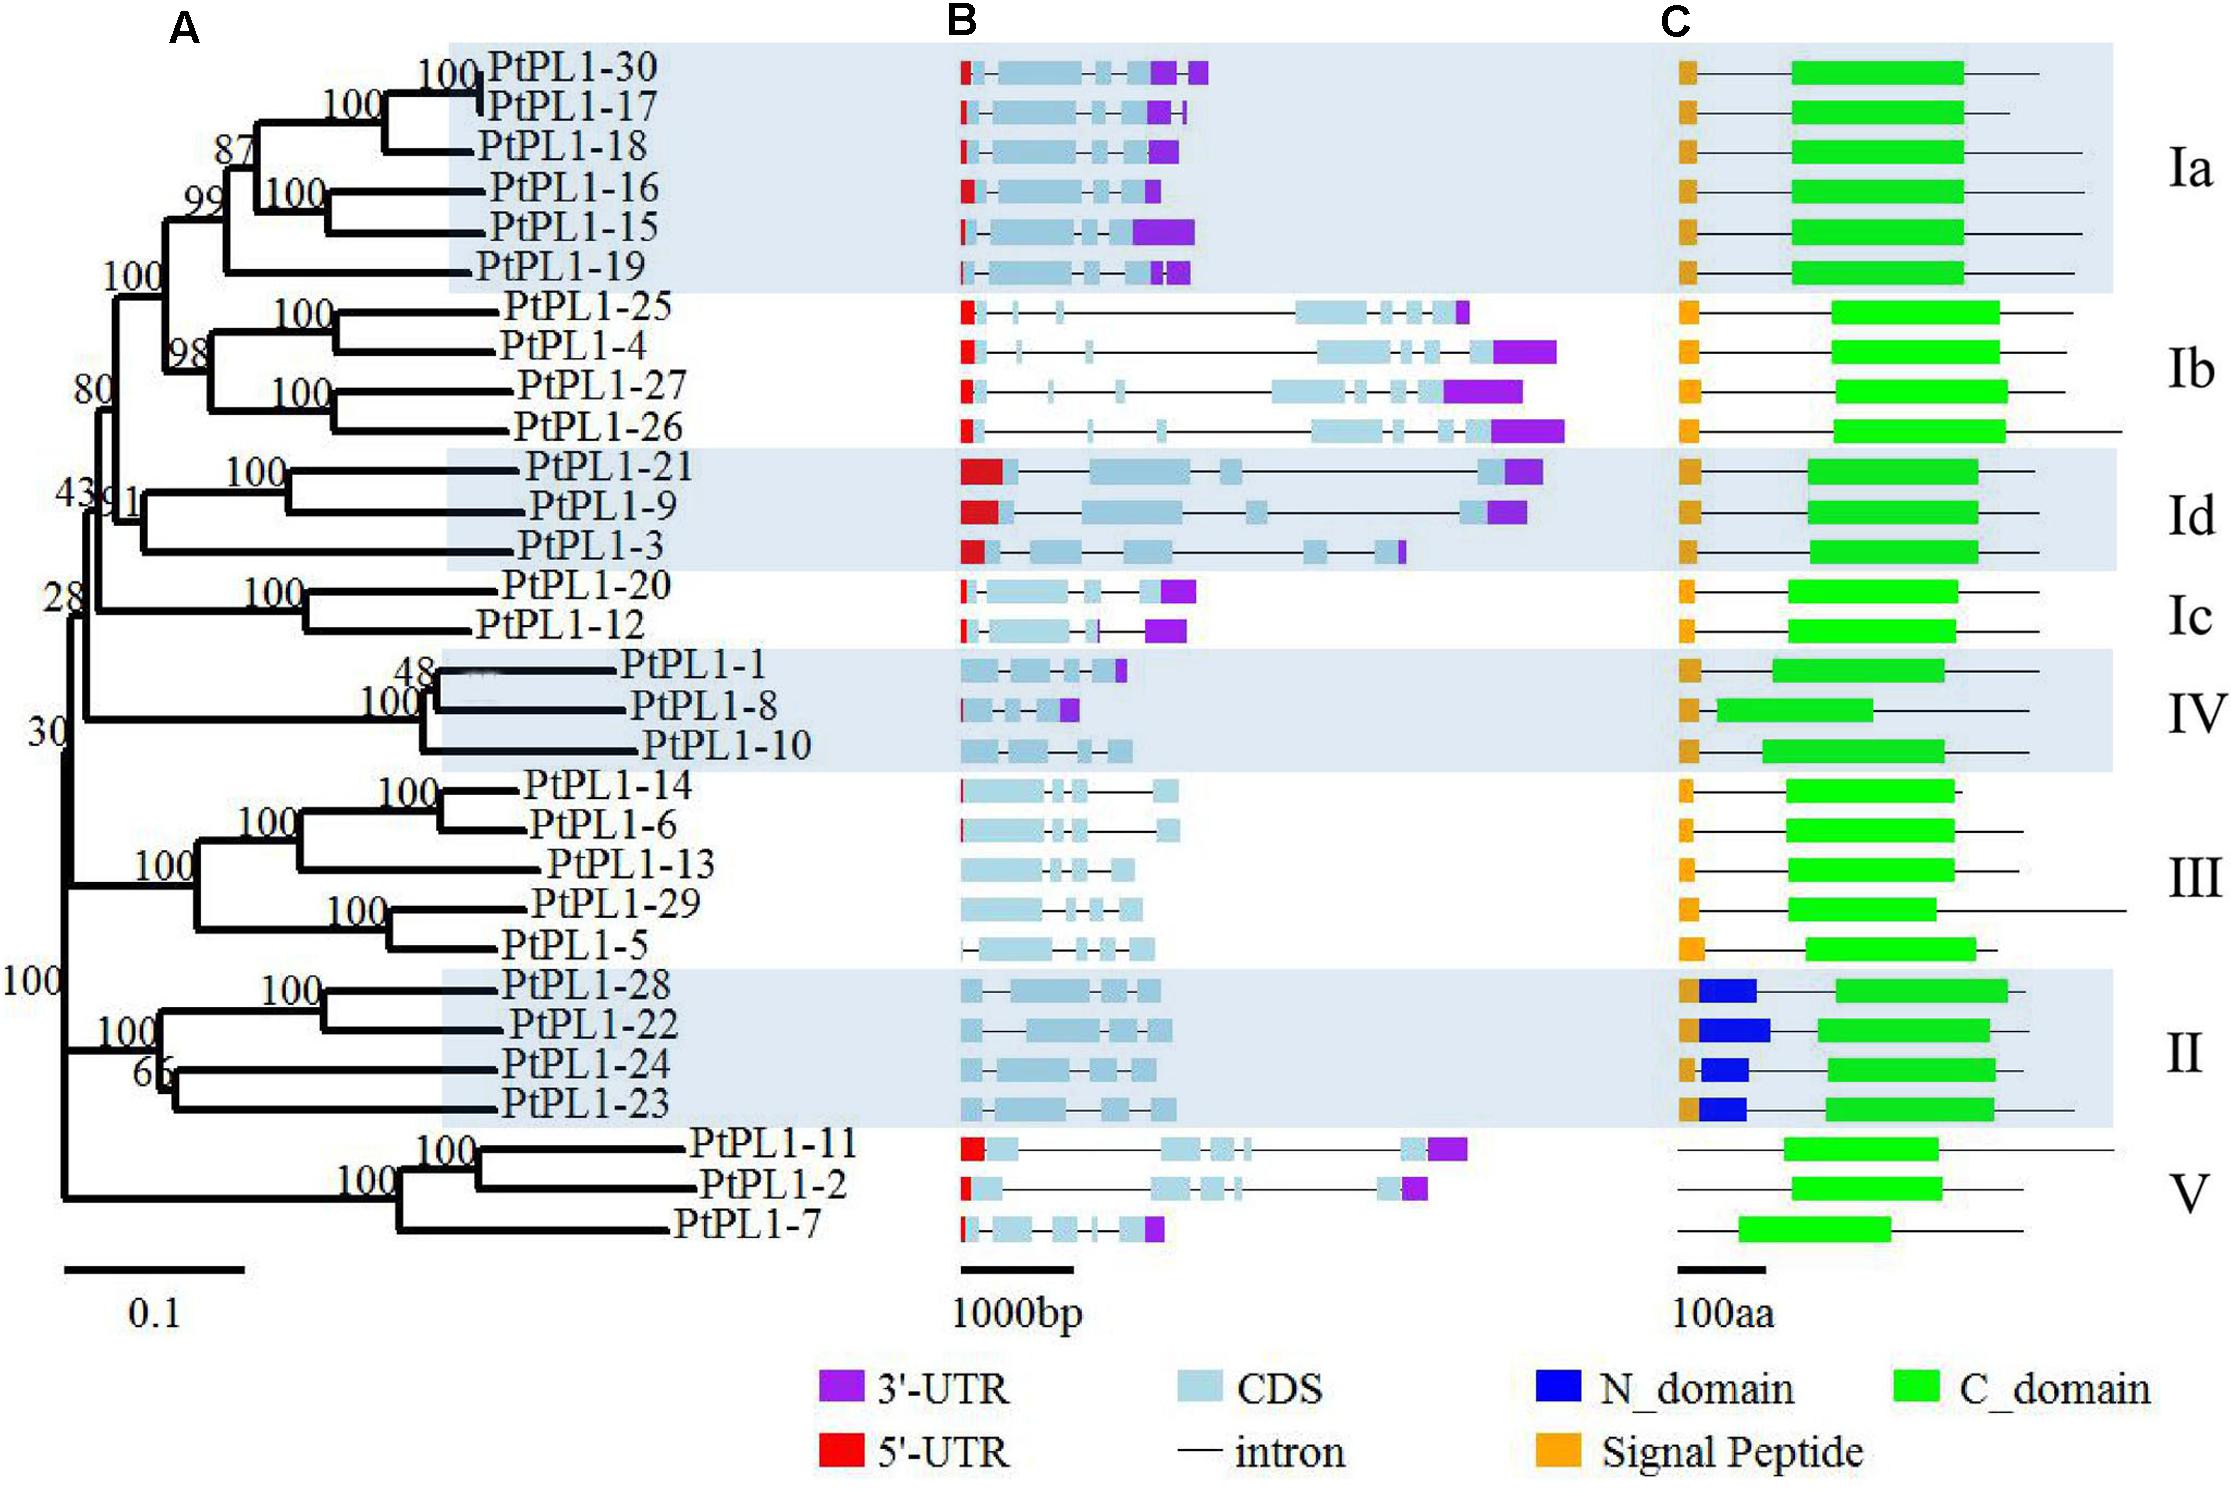
FIGURE 1. Phylogenetic relationships, gene structure and conserved domains of PtPL1 gene family. The 30 full-length PtPL1 protein sequences were aligned by ClustalX2, an un-rooted Neighbor-Joining (NJ) tree (A) was developed by the MEGA5.0.5 program. Bootstrap analysis was performed with 1000 iterations, numbers on the nodes indicated clade credibility values. PtPL1-1 to PtPL1-28 were previously identified by Geisler-Lee et al. (2006) and PtPL1-29 was identified by Biswal et al. (2014). PtPL1-30 is a novel gene in this study. The subgroups followed Biswal et al. (2014) Gene structures of PtPL1 family genes were shown in color scheme (3′-UTR in purple, 5′-UTR in red, exon in blue) (B). Conserved domains in PtPL1 proteins were predicted by SMART website (http://smart.embl-heidelberg.de/) (C). Green boxes: Pec_lyase_C domain (C-domain); Dark blue boxes: Pec_lyase_N domain (N-domain); Yellow boxes: Signal peptide.
The length of PtPL1 proteins were ranging from 266 to 496 amino acid residues. The theoretical pI and MW of PtPL1s were predicted using the Compute pI/Mw tool on the ExPASy server14, showing a range of 5.58–9.67 and 29.5–53.7 kDa, respectively (Supplementary Table S3). All the PtPL1 proteins were verified for the presence of a Pec_Lyase_C domain by online analysis program of SMART15. Another conserved domain, Pec_lyase_N, was predicted in the four members of Group II in addition to the Pec_Lyase_C domain. Most members of PtPL1 family were predicted to contain an N-terminal signal peptide (cutoff > 0.45), except for the three members from Group V (Figure 1). The prediction of subcellular localization showed that members in subgroup I, II, III, and IV were predicted as signal peptide secretion pathway. PtPL1-2 was predicted to have a chloroplast transit peptide while no particular sub-cellular localization could be predicted for PtPL1-7 and PtPL1-11, which were members in Group V (Supplementary Table S4).
Chromosomal Location and Duplication Analysis of PtPL1 Genes
Chromosomal location of the PtPL1 genes was illustrated in Figure 2 based on the gene information from P. trichocarpa (v3.0) in Phytozome16. 28 PtPL1 genes were randomly distributed on 14 out of 19 linkage groups (Figure 2); the rest two genes, PtPL1-5 (Potri.T040400) and PtPL1-14 (Potri.T040300), were assigned to individual scaffolds.
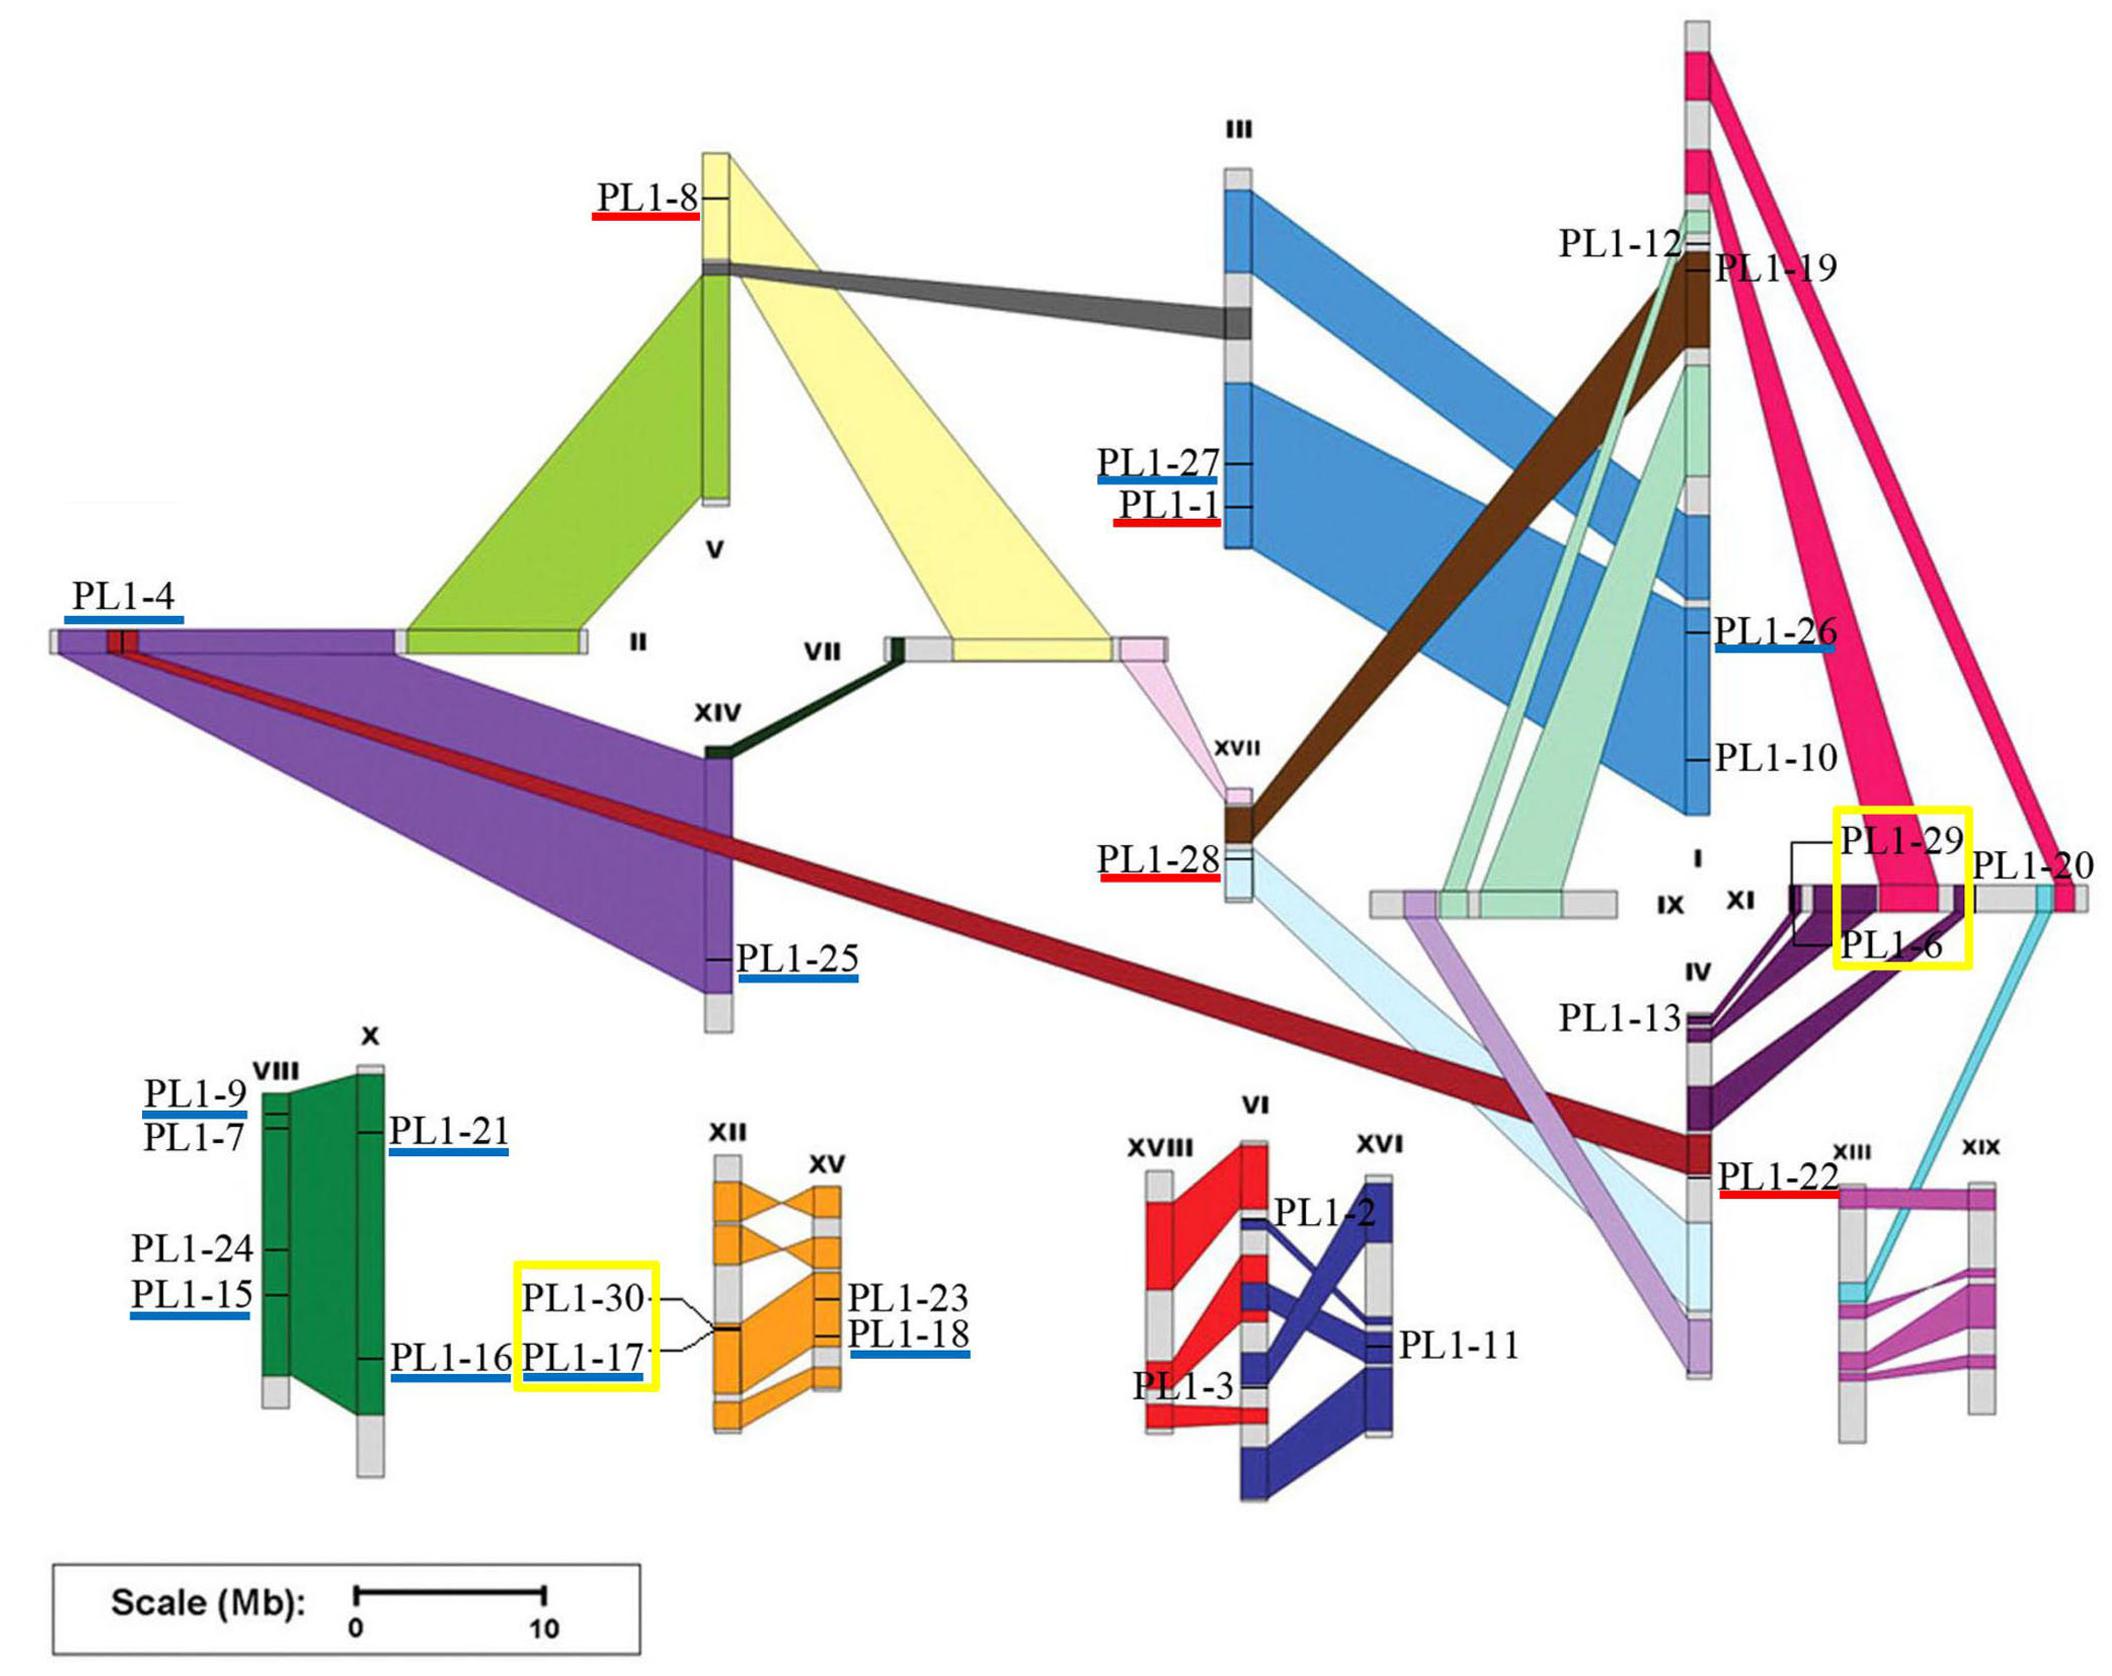
FIGURE 2. Chromosomal location of the PtPL1 genes on Populus trichocarpa genome. The annotation information of PtPL1 genes from Phytozome V11.0 was imported into PopGenIE (http://popgenie.org/). Twenty-eight PtPL1 genes are randomly distributed on 14 out of 19 linkage groups; the rest two genes are assigned to unassembled scaffold (Supplementary Table S2). The schematic representation of Populus chromosome organization with whole-genome duplication events was obtained from Tuskan et al. (2006). Segmental duplicated homologous regions were shown with the same color. Five pairs of segmental duplicated genes were underlined in dark blue. Tandemly duplicated genes were displayed with yellow boxes. Paralog genes arising from retro-transposition were underlined in red.
Based on phylogenetic analysis and chromosomal location of the PtPL1 genes, 13 potential paralogous gene pairs (Table 1) were selected for duplication analysis. It is most likely that these paralogous gene pairs were created via genome duplication events (Tuskan et al., 2006). To determine the origin of these 13 paralogous pairs, i.e., the type and the exact time of the duplication events, we calculated the Ka and Ks values for each of the paralog gene pairs (Table 1). The result showed that five paralogous pairs, PtPL1-17/PtPL1-18, PtPL1-16/PtPL1-15, PtPL1-27/PtPL1-26, PtPL1-25/PtPL1-4, and PtPL1-21/PtPL1-9 were segmental duplications. These paralog pairs were shown in the same color block on different chromosomal locations in Figure 2. Synonymous substitution values (Ks) suggested that the segmental duplication occurred ca. 13.89–19.95 million years ago (Table 1). These periods coincide with the time of P. trichocarpa genome recent duplication events (Tuskan et al., 2006). On the other hand, PtPL1-30/PtPL1-17 and PtPL1-6/PtPL1-29, which were likely to be a result of tandem gene duplication (Finn et al., 2006; Hu et al., 2010), additional that, PtPL1-6 and PtPL1-29 both had a paralogous gene in the phylogenetic tree, PtPL1-14 and PtPL1-5, respectively. Interestingly, PtPL1-14 and PtPL1-5 were located on scaffold_38 based on Populus genome assembly V3.0, but they were located on chromosome 11 according to Populus genome assembly V2.2. Despite this, we also suspect that PtPL1-6, PtPL1-29, PtPL1-14 and PtPL1-5 were tandem genes on chromosome 11. The estimated time of duplication of PtPL1-14/PtPL1-6 and PtPL1-29/PtPL1-5 was 1.43 and 1.51 mya, respectively; and the estimated age of PtPL1-30/PtPL1-17 was 0.40 mya. Of the other two pairs, PtPL1-1/PtPL1-8 and PtPL1-28/PtPL1-22, the two genes in every pair were located on different duplication blocks. They were likely the products of retro-transposition (Chen and Cao, 2014; Cao and Li, 2015), and the estimated age was 21.81 and 19.80 mya, respectively. While duplications of PtPL1-20/PtPL1-12 and PtPL1-24/PtPL1-23 occurred 109.45 and 113.34 mya, respectively, nearly within or following the time when Populus and Arabidopsis lineages diverged (Tuskan et al., 2006). It was suggested that PtPL1-20/PtPL1-12 and PtPL1-24/PtPL1-23 were from more ancient segmental duplication. At the same time, we calculated the Ka, Ks, Ka/Ks of PtPL1 genes (Table 1). The estimated Ka/Ks values of most gene pairs were less than 1.0 except that the Ka/Ks value of PL1-20/PL1-12 was 1.4.
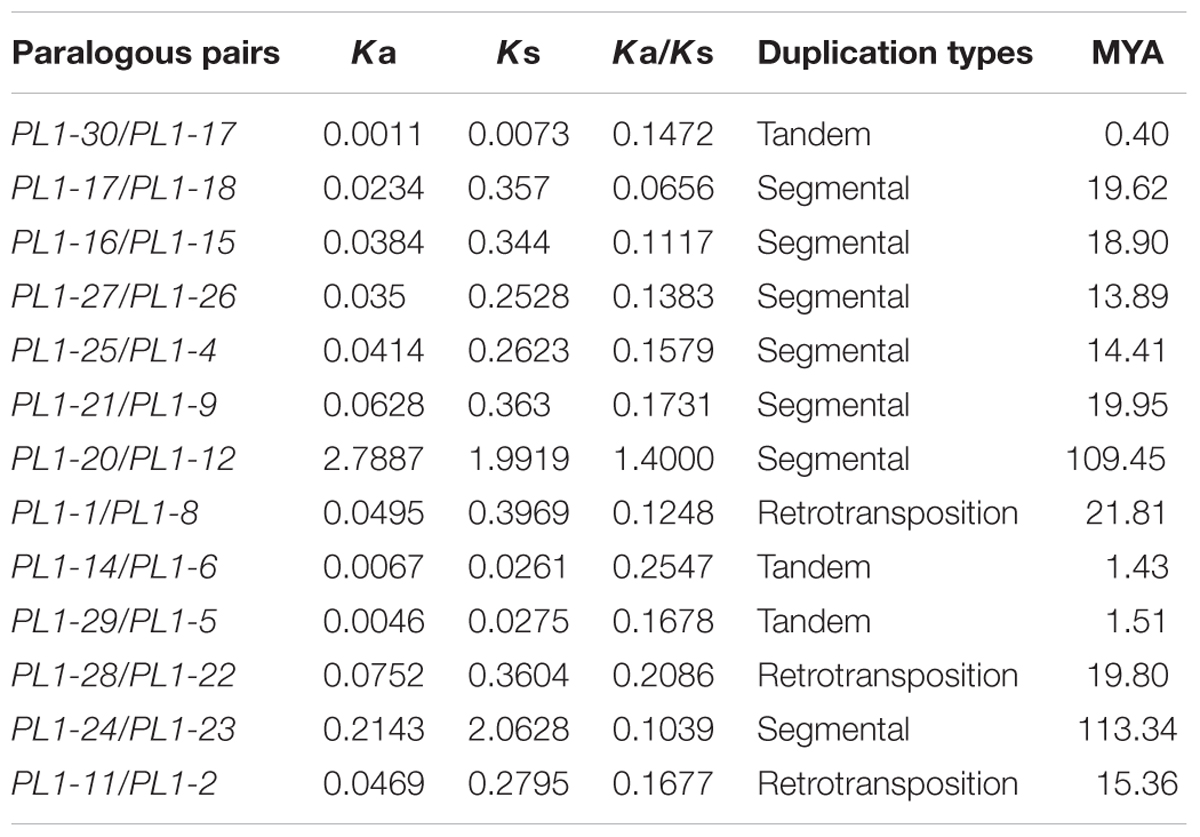
TABLE 1. Inference of duplication time of PtPL1 paralogous pairs.
Multiple Sequence Alignment and Motif Compositions of PtPL1 Proteins
Multiple sequence alignment of PtPL1 proteins with Pec_lyase_C domain was conducted using ClustalX software and output with GENEDOC program (Supplementary Figure S1). All the 30 PtPL1 proteins contained a Pec_lyase_C domain, including four residues for Ca+2 binding, five residues for substrate binding, one residue for catalysis and one residue for disulfide bond (Herron et al., 2003). The corresponding residues were shown in brown, blue, green, and pink, respectively. Most of these residues were conserved among the 30 PtPL1 proteins, except for the members from group V. Group V had an arginine (R) to replace the histidine (H) at the second residue for substrate binding; and there was no cysteine (C) at the residue for disulfide bond in this group.
To further reveal the specific regions of different PtPL1 proteins, motif analysis was performed using MEME online tool17 (Figure 3). In general, PtPL1 proteins from the same group shared similar motifs. The length of motifs ranged from 6 to 50 amino acid residues; and the number of motifs varied between 2 and 10 in each PtPL1 protein. Motif 1, 2, 4, 7 were present in most of the PtPL1 proteins. Motif 7 (blue), with the first two residues for Ca+2 binding and the first two residues for substrate binding, was absent in PtPL1-10 and the whole group V. Motif 2 (cyan), with the residue for disulfide bond, the last two residue for Ca+2 binding and the third residue for substrate binding, was absent in PtPL1-7. Motif 1 (red), with the residue for catalysis and the 4th and 5th residue for substrate binding, was present in all PtPL1 proteins.
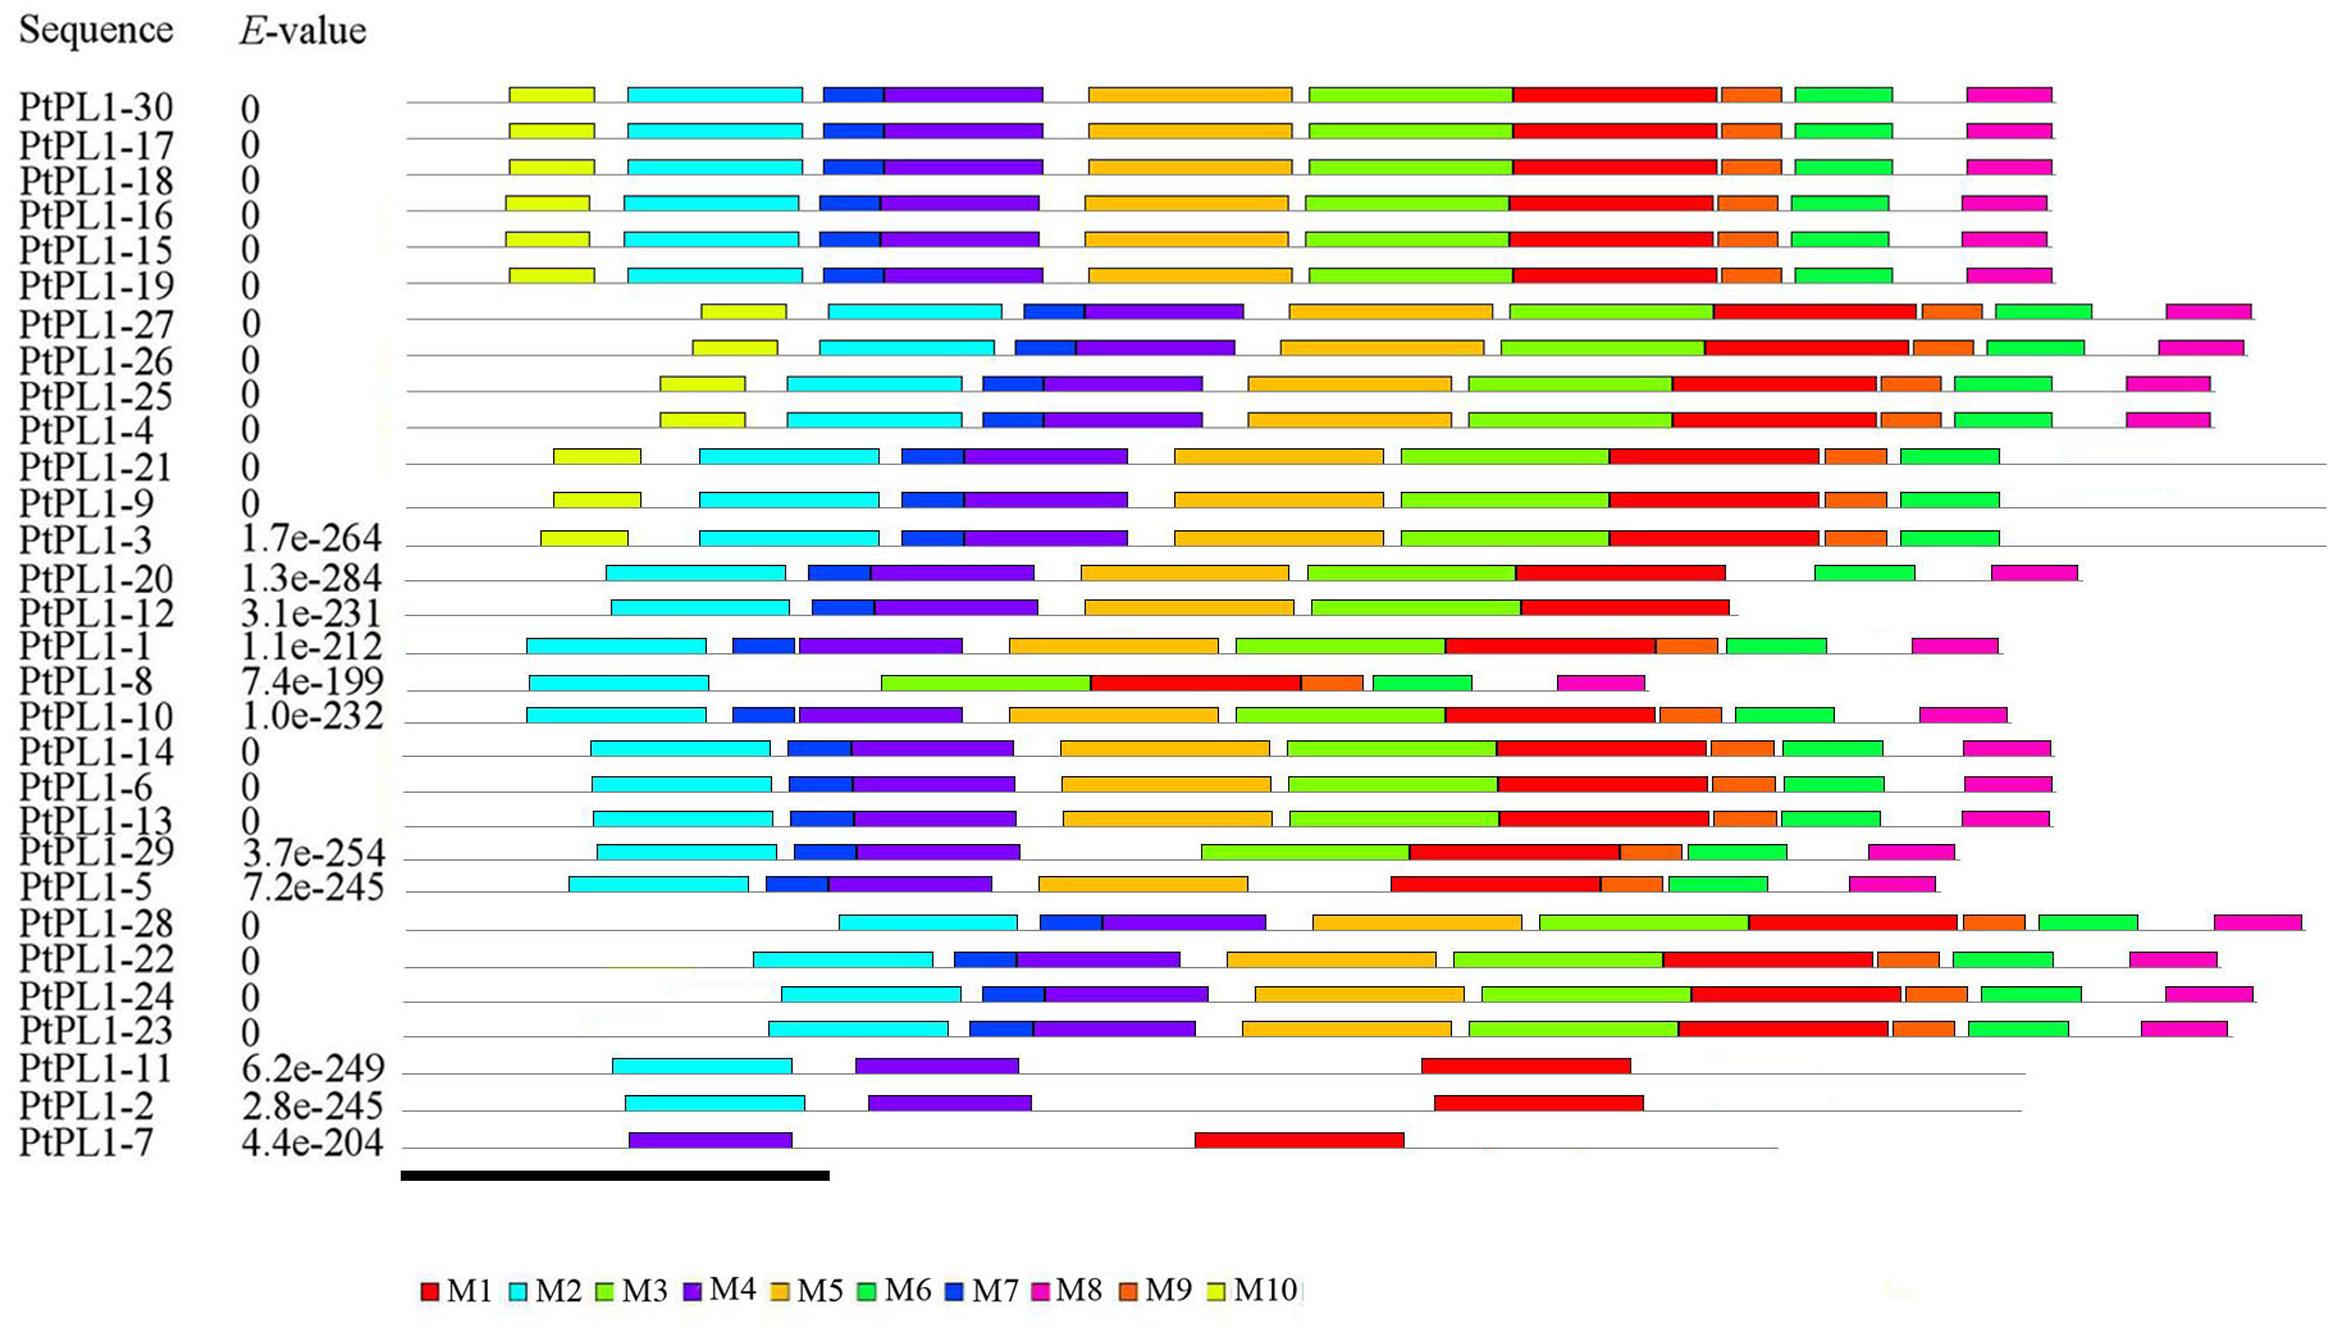
FIGURE 3. Conserved protein motif analysis of PtPL1s by MEME. Conserved motifs in the PtPL1 proteins were elucidated by MEME website (http://meme-suite.org/tools/meme). Up to 10 motifs were shown by different colors. The height of the motif “block” is proportional to p-value, truncated at the height for a motif with a p-value of 1e-10. MEME Parameters: number of repetitions, any; maximum number of motifs, 10; optimum motif width, between 6 and 50. Bar = 100 amino acids.
Expression Analysis of the PtPL1 Genes in Different Tissues of Poplar
To investigate the expression pattern of all PtPL1 genes in different tissues, a set of Affymetrix microarray data from the Poplar eFP browser (Wilkins et al., 2009) were downloaded and analyzed. The probe sets matched to each PtPL1 gene were listed in Supplementary Table S5. Expression data of 27 PtPL1 genes were obtained, except for PtPL1-3, 16, and 30. A heatmap based on the expression data was generated using MeV 4.7.3 (Figure 4). The heatmap showed that most of PtPL1 genes were highly expressed in female catkins (FC), male catkins (MC), xylem (X), root (R), or young leaf (YL). Of particular interest to us is that six PtPL1 genes—PtPL1-9, 17, 18, 19, 25, and 27—had the highest expression level in xylem and root (Figure 4). Five of them belonged to subgroup Ia and Ib, with PtPL1-9 from subgroup Ic as the only exception. In order to find candidate PtPL1 genes involved in the development of vascular tissues, expression of members from subgroup Ia and Ib were further investigated by qRT-PCR (Figure 5). A set of samples related to vascular development were tested. Expression data of eight PtPL1 genes were obtained, except for that of PtPL1-16 and PtPL1-30. Most of the selected genes were preferentially expressed in stem (Figures 5A–H). A heatmap was generated and co-expression analysis of the eight PtPL1 genes was performed using MeV 4.7.3 (Figure 5I). One PtPL1 gene from subgroup Ia, PtPL1-18, displayed a high correlation with Ptxt1-27 (Figure 5I), which is from Ib and specifically expressed in differentiating xylem (Biswal et al., 2014). Based on the above-mentioned phylogenetic analysis, expression and co-expression analysis, PtPL1-18 was chosen as the candidate gene from subgroup Ia for the following functional studies during vascular tissue development.
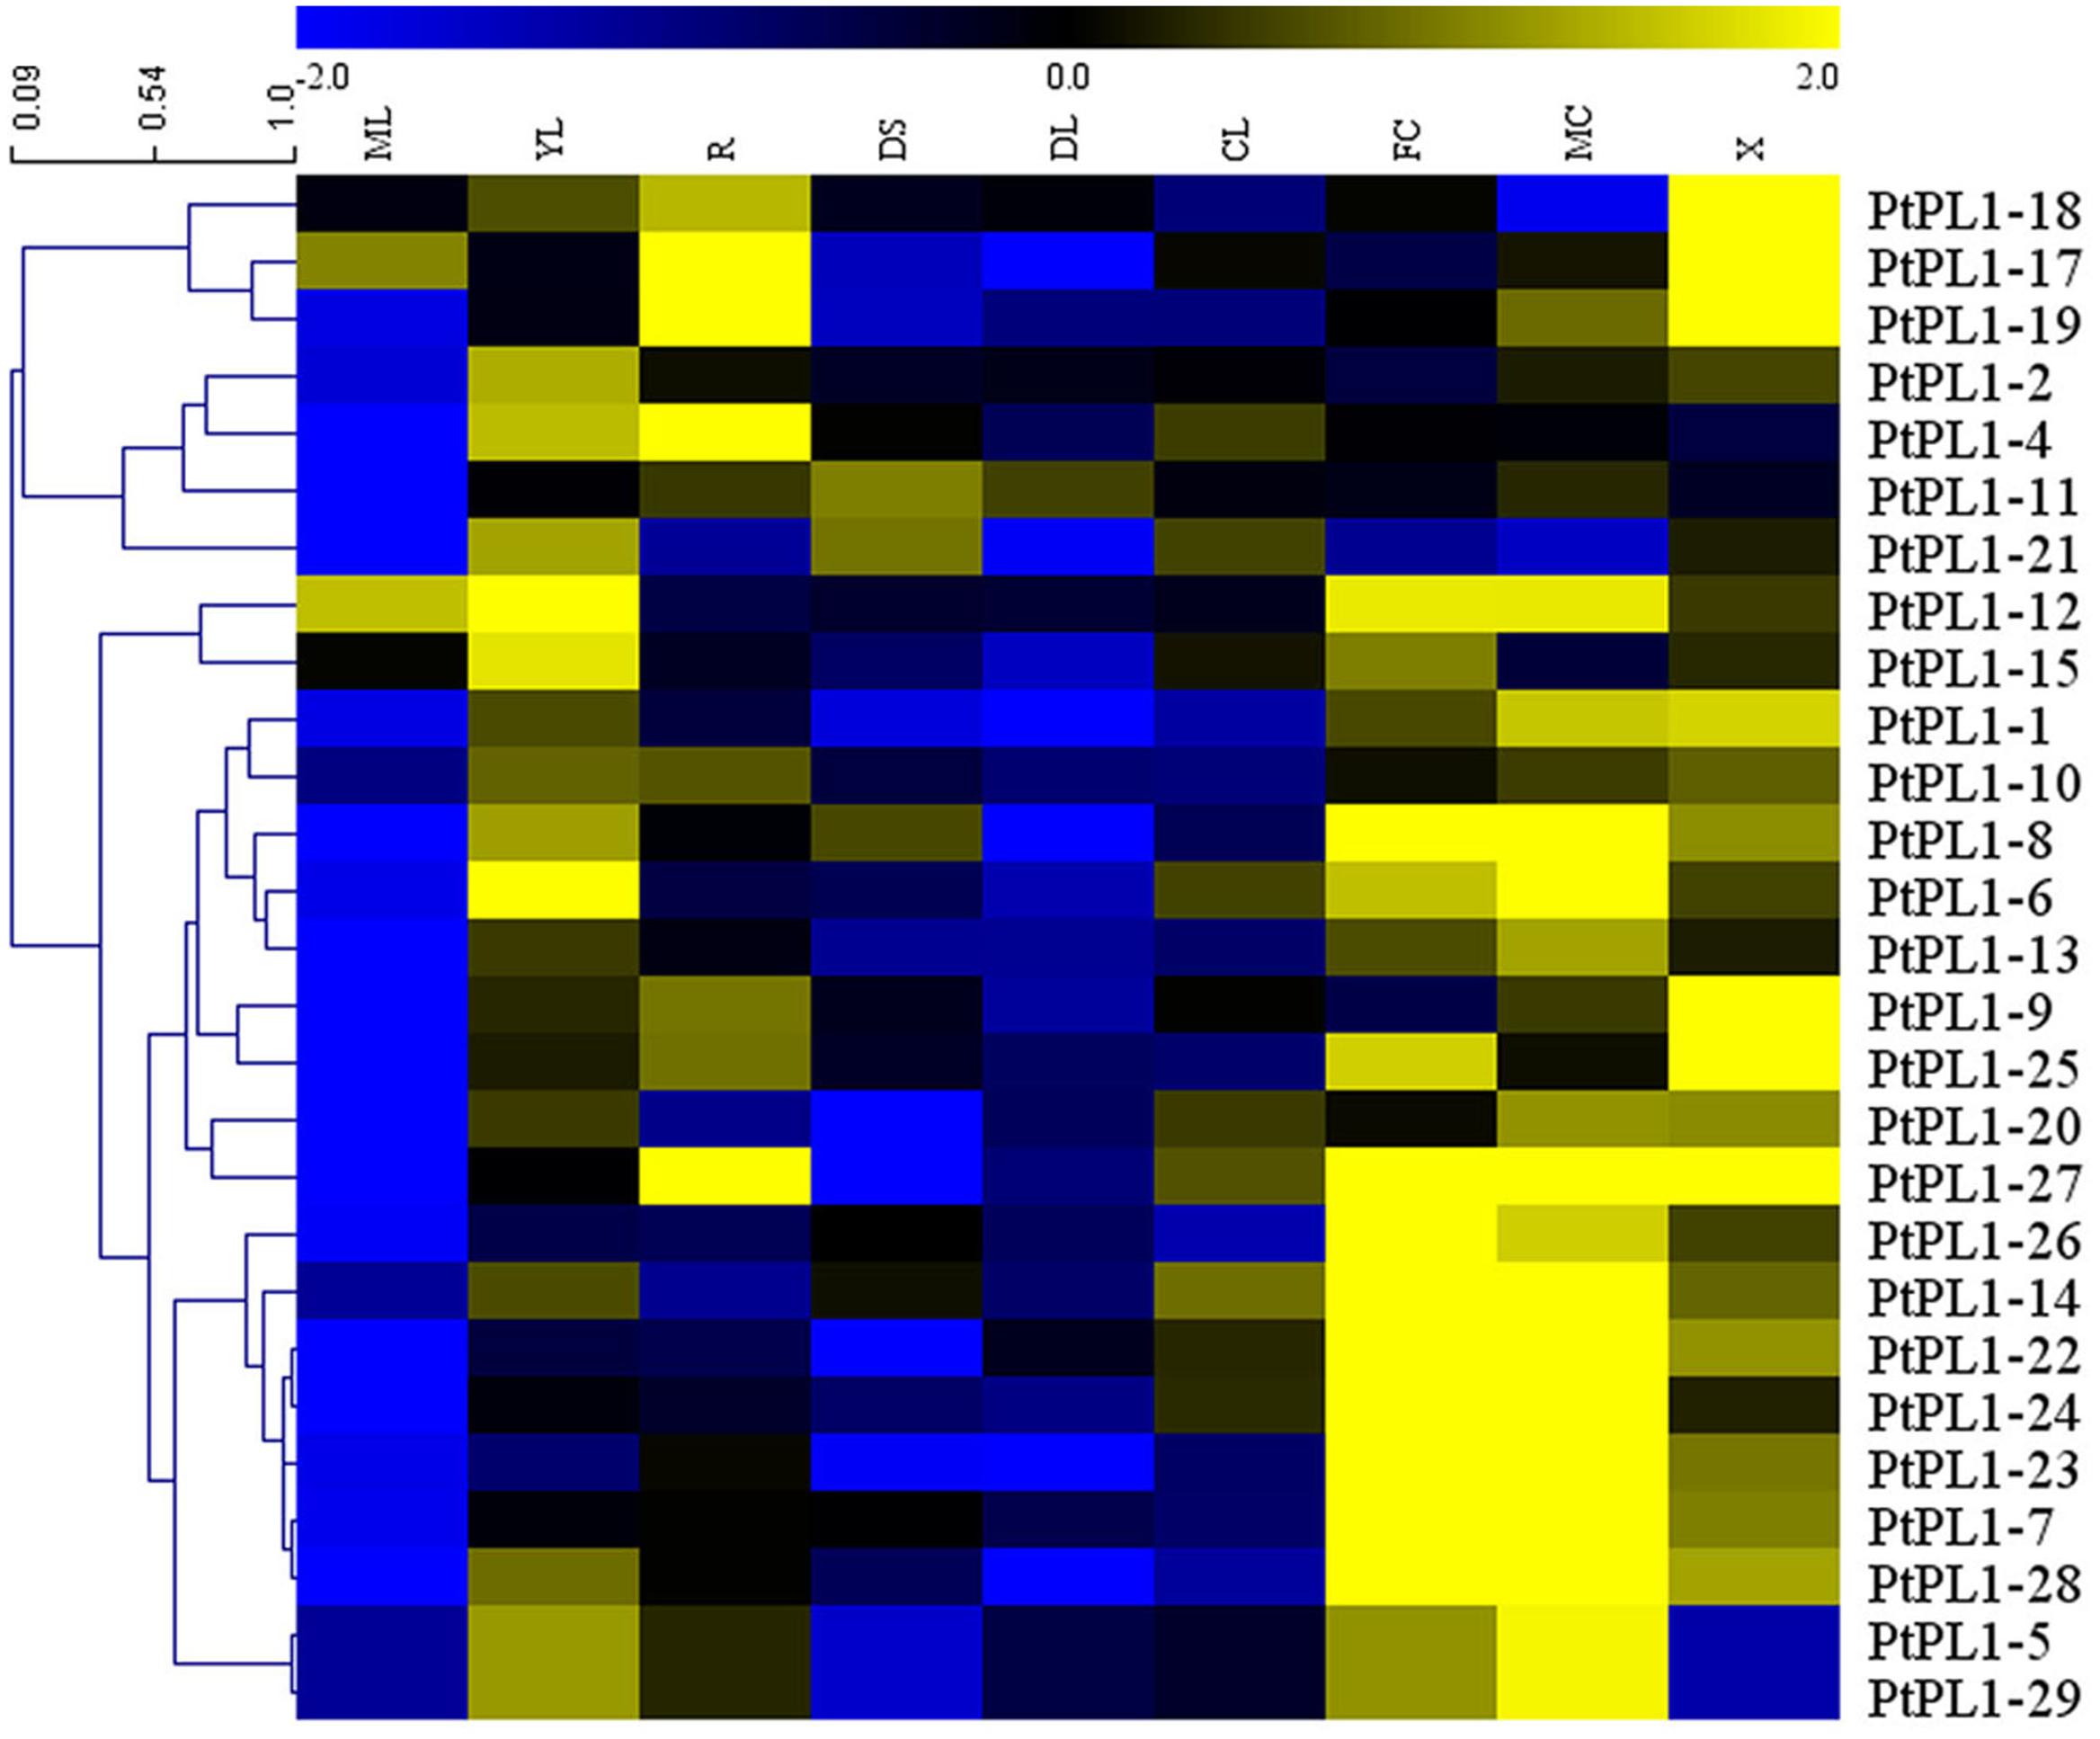
FIGURE 4. Expression profiles of the PtPL1 genes. A heat map was generated with microarray data of 27 PtPL1 genes in nine different tissues from Poplar eFP Browser (http://bbc.botany.utoronto.ca/efppop/) (Wilkins et al., 2009). The transcript levels for the PtPL1 genes were clustered using hierarchical clustering based on Pearson correlation. Color scale on top represented LN2 from –2.0 to 2.0. Blue indicated low expressed genes, while yellow indicated highly expressed genes. Abbreviation for tissues are as following: ML, mature leaf; YL, young leaf; R, root; DS, dark-grown seedlings; DL, dark-grown seedlings, etiolated, then exposed to light for 3 h; CL, continuous light grown seedling; FC, female catkins; MC, male catkins; X, xylem.
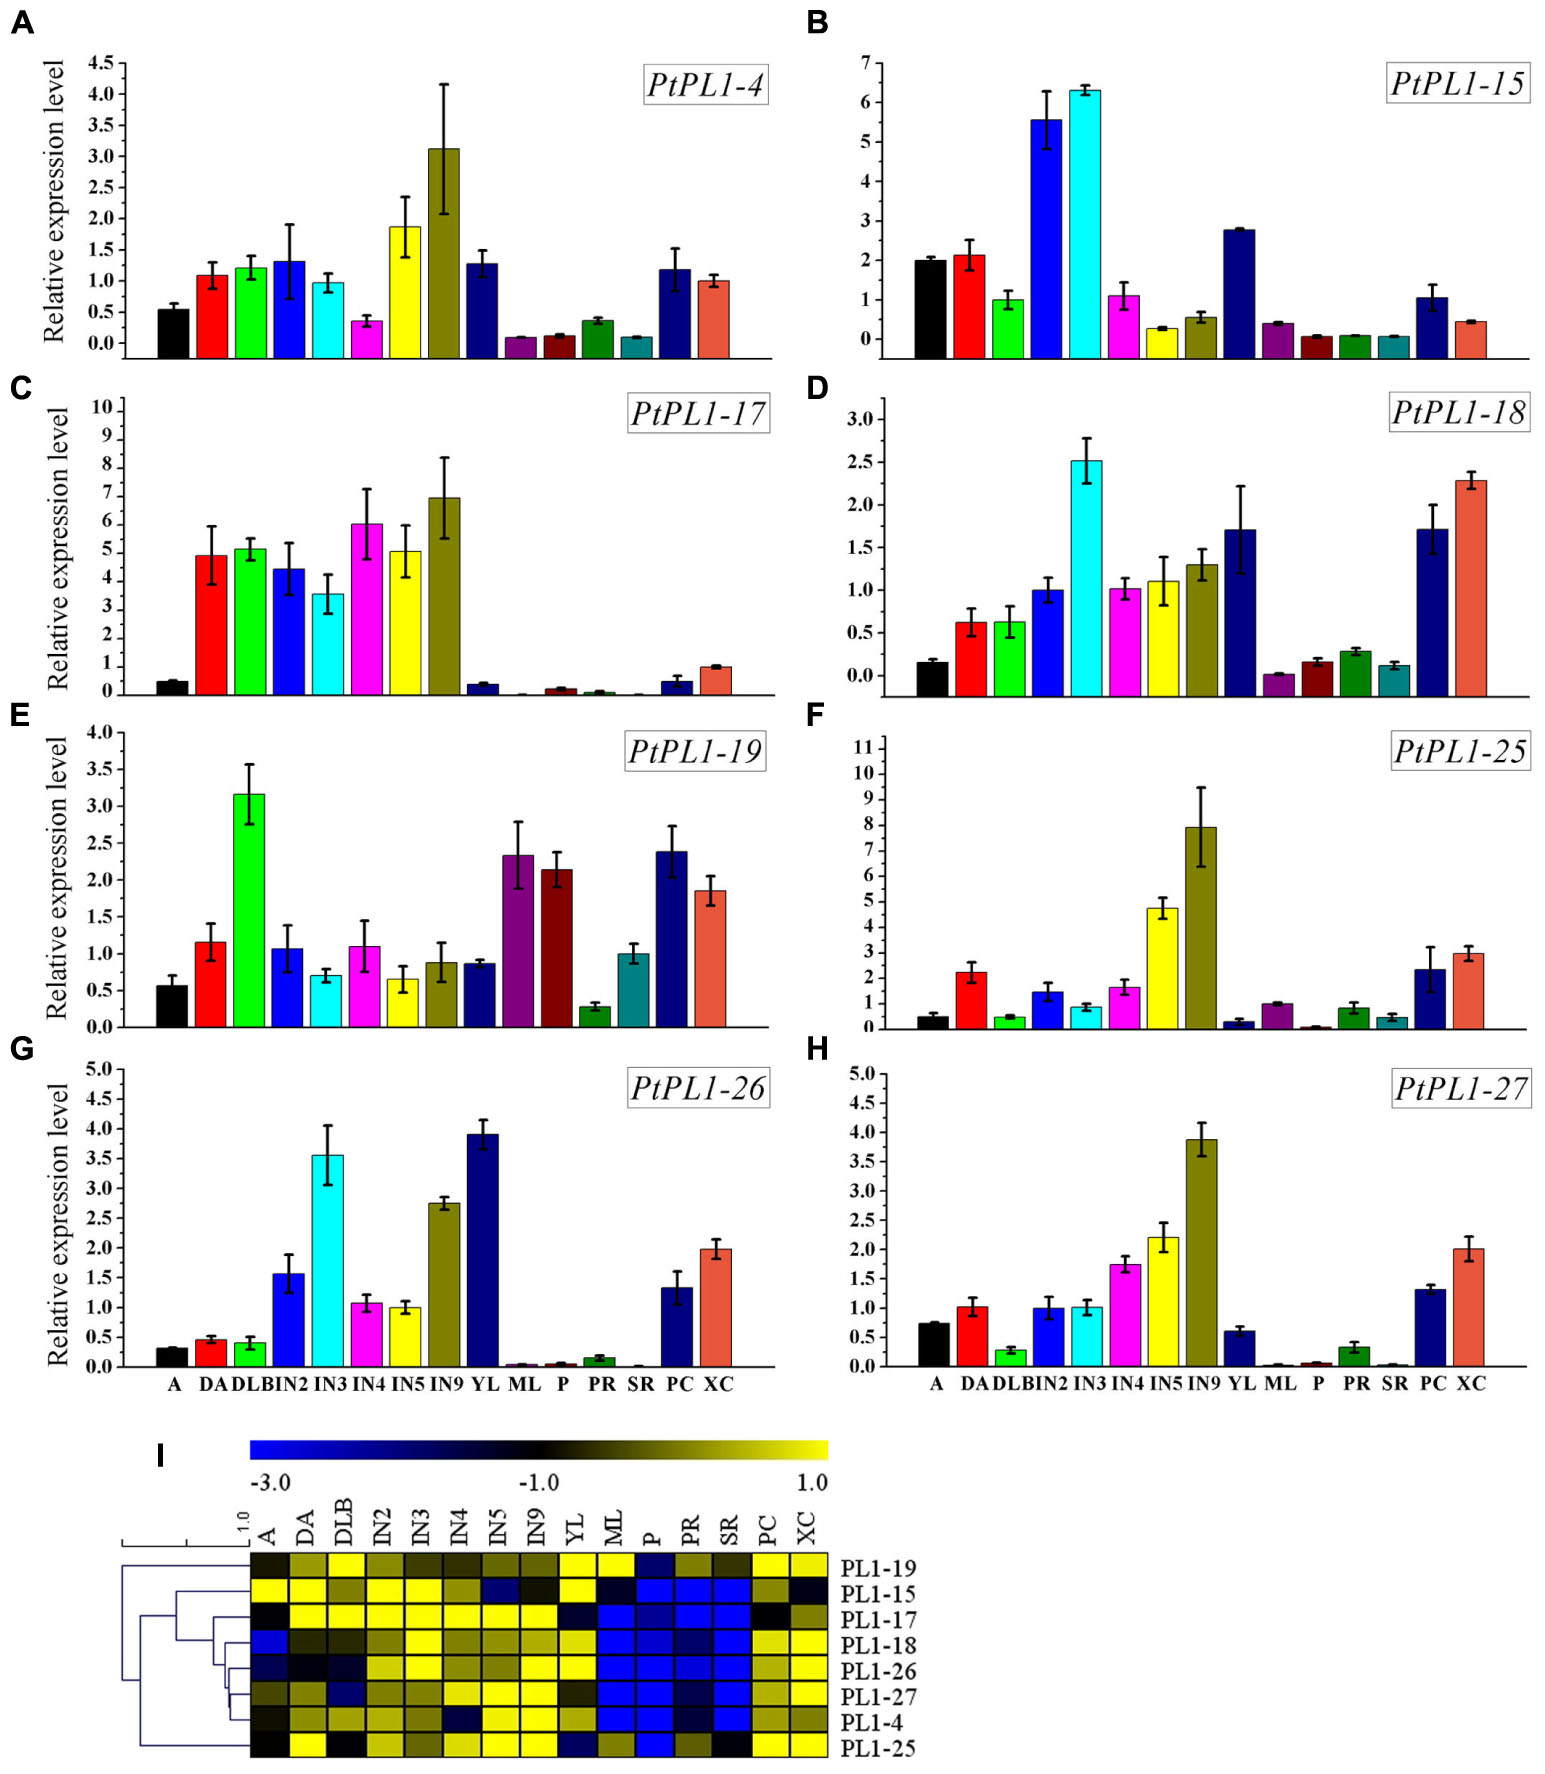
FIGURE 5. Relative transcript levels of selected PtPL1 genes. (A–H) Relative transcript levels of eight selected PtPL1 genes by real-time quantitative RT-PCR. PtACTIN (Potri.019G010400) was used as reference gene, using the ΔΔCt method. Standard deviation was calculated from three biological replicates. (I) A heat map for comparison of relative expression of eight selected PtPL1 genes in 15 tissues tested. Color scale represented LN2 from –3.0 to 1.0. Tissues tested: apex (A), dormant apex (DA), dormant lateral bud (DLB), the 2nd internode stem (IN2), the 3rd internode stem (IN3), the 4th internode stem (IN4), the 5th internode stem (IN5), the 9th internode stem (IN9), young leaves (YL), mature leaves (ML), petiole (P), primary root (PR), secondary root (SR), phloem and cambium (PC), xylem and cambium (XC).
Histochemical Analysis of Petioles and Stems in the PtPL1-18pro:GUS Lines
To have a detailed view of the expression of PtPL1-18 in vascular development, PtPL-18pro:GUS transgenic lines of poplar 717 were prepared for histochemical analysis. Transverse sectioning of both petiole and stem at different developmental stages was performed in 4-month-old plants of three representative transgenic lines. In the 4th leaf petioles, GUS staining was clearly detected in all cell types in vascular bundle (Figure 6A). The staining was getting weaker especially in xylem upon the 7th leaf petioles. In the 12th leaf petioles, GUS staining could not be detected neither in mature xylem, nor in pith, but remained in phloem, pro-cambium and developing xylem (Figures 6B,C). In parallel, the GUS expression patterns in corresponding internodes were studied. In the 4th stem, the GUS activity was preferential in primary xylem and interfascicular region (Figure 6D). The GUS staining in internode 7 was stronger and broader than the 4th internode; and it was detected in all cell types of the vascular bundle, including the central pith. The GUS staining was strongest in primary xylem. Weak staining was also detected in cortex (Figure 6E). In internode 12, the GUS staining covered the cortex, phloem and pith areas, normally in parenchyma cells, as well as in phloem fiber cells, primary xylem cells and developing xylem cells, but not in mature xylem, in which secondary cell wall has formed in xylem fiber cells and vessel cells (Figure 6F).
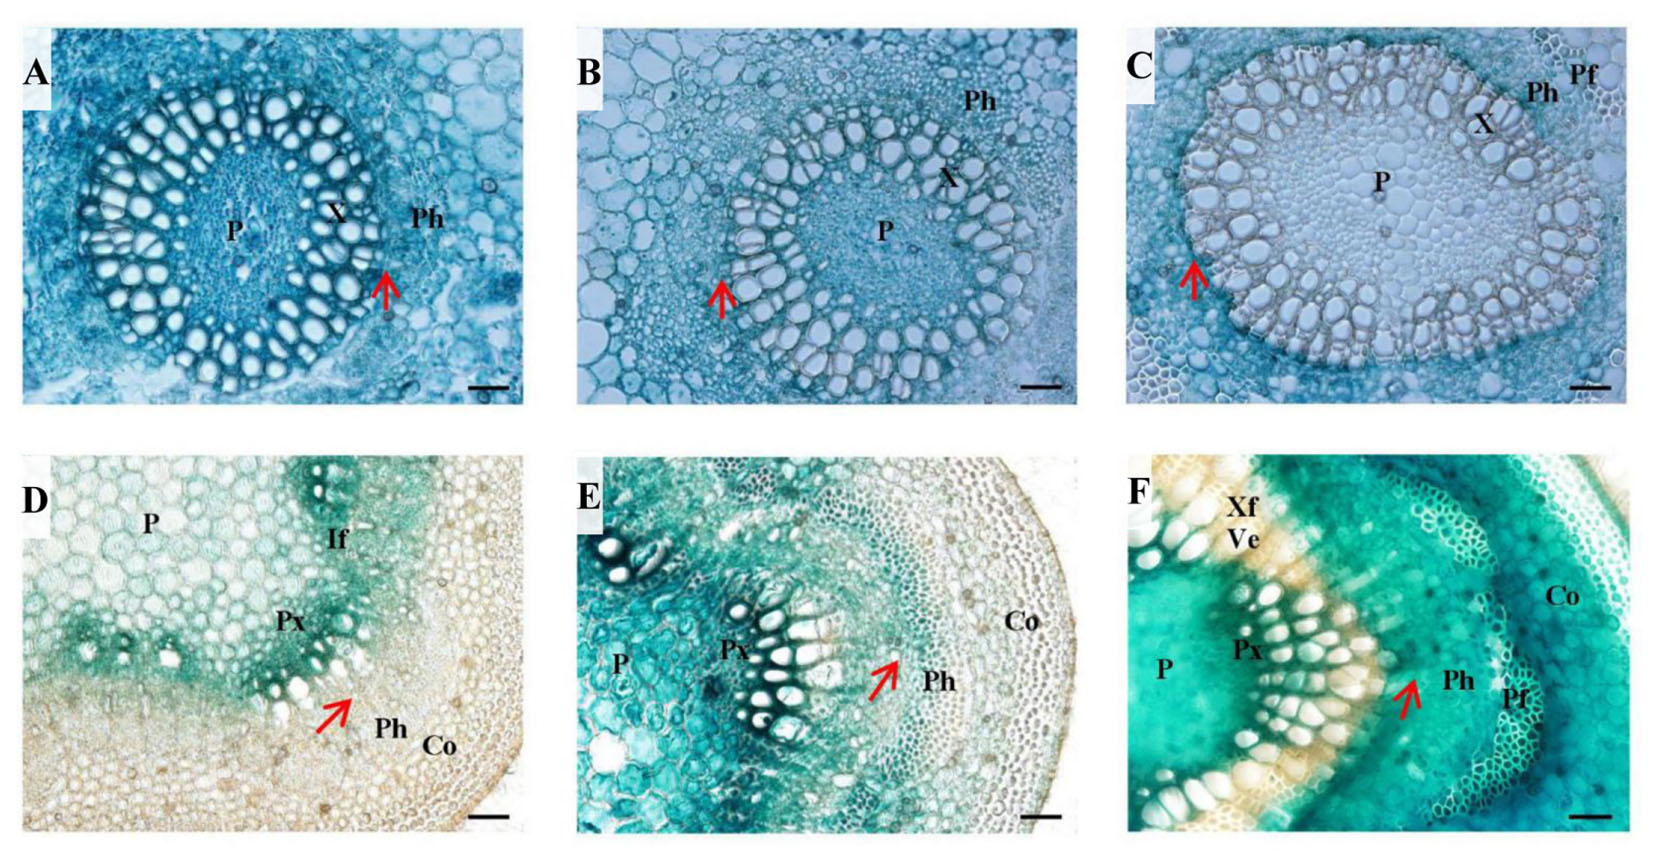
FIGURE 6. Histochemical analysis in PtPL-18pro:GUS transgenic poplar leaf petioles and stems. Four-month-old plants grown in the greenhouse were used for transverse section of leaf petioles (A–C) and stems (D–F) followed by GUS staining. (A) LPI 4 leaf petiole, (B) LPI 7 leaf petiole, (C) LPI 12 leaf petiole, (D) internodes 4, (E) internode 7, (F) internode 12. P, pith; X, xylem; Ph, phloem; Pf, phloem fiber; Px, primary xylem; If, interfascicular; Co, cortex; Ve, vessel element; Xf, xylem fiber. The red arrows represent vascular cambium. Bar = 50 μm.
Effects of PtPL1-18 Overexpression on Secondary Cell Wall Formation and Vascular Development
A full length PtPL1-18 CDS was cloned into pK2GW7 to obtain overexpression lines. The transcript levels of PtPL1-18 in 35S:PtPL1-18 overexpression lines were verified by semi-quantitative RT-PCR. Out of 15 transgenic lines, five lines (line 6–10) showed significantly elevated transcript level of PtPL1-18 (Figure 7A). Lines 6, 8, and 9 were used for the following study. Poplar 717 and the three PtPL1-18 overexpression lines were propagated by tissue culture and transferred to soil. The increase of transcript accumulation level in over-expressing plants was estimated by qRT-PCR. Compared with 717 poplar, PtPL1-18 transcript levels were 7.9, 9.8, 11.8 times higher in the stem of overexpression lines 6, 8, and 9, respectively (Figure 7B). Plant height and stem diameter were measured after 4 months in soil. PtPL1-18 overexpression lines had reduced plant height compared to poplar 717 (Figure 7C). The average reductions on plant height in lines 6, 8, and 9 were 15.43, 14.04, and 16.66%, with p-value of <0.05, <0.05, and <0.01, respectively (Figure 7D). The diameter of stem of overexpression lines was reduced slightly (Figure 7E).
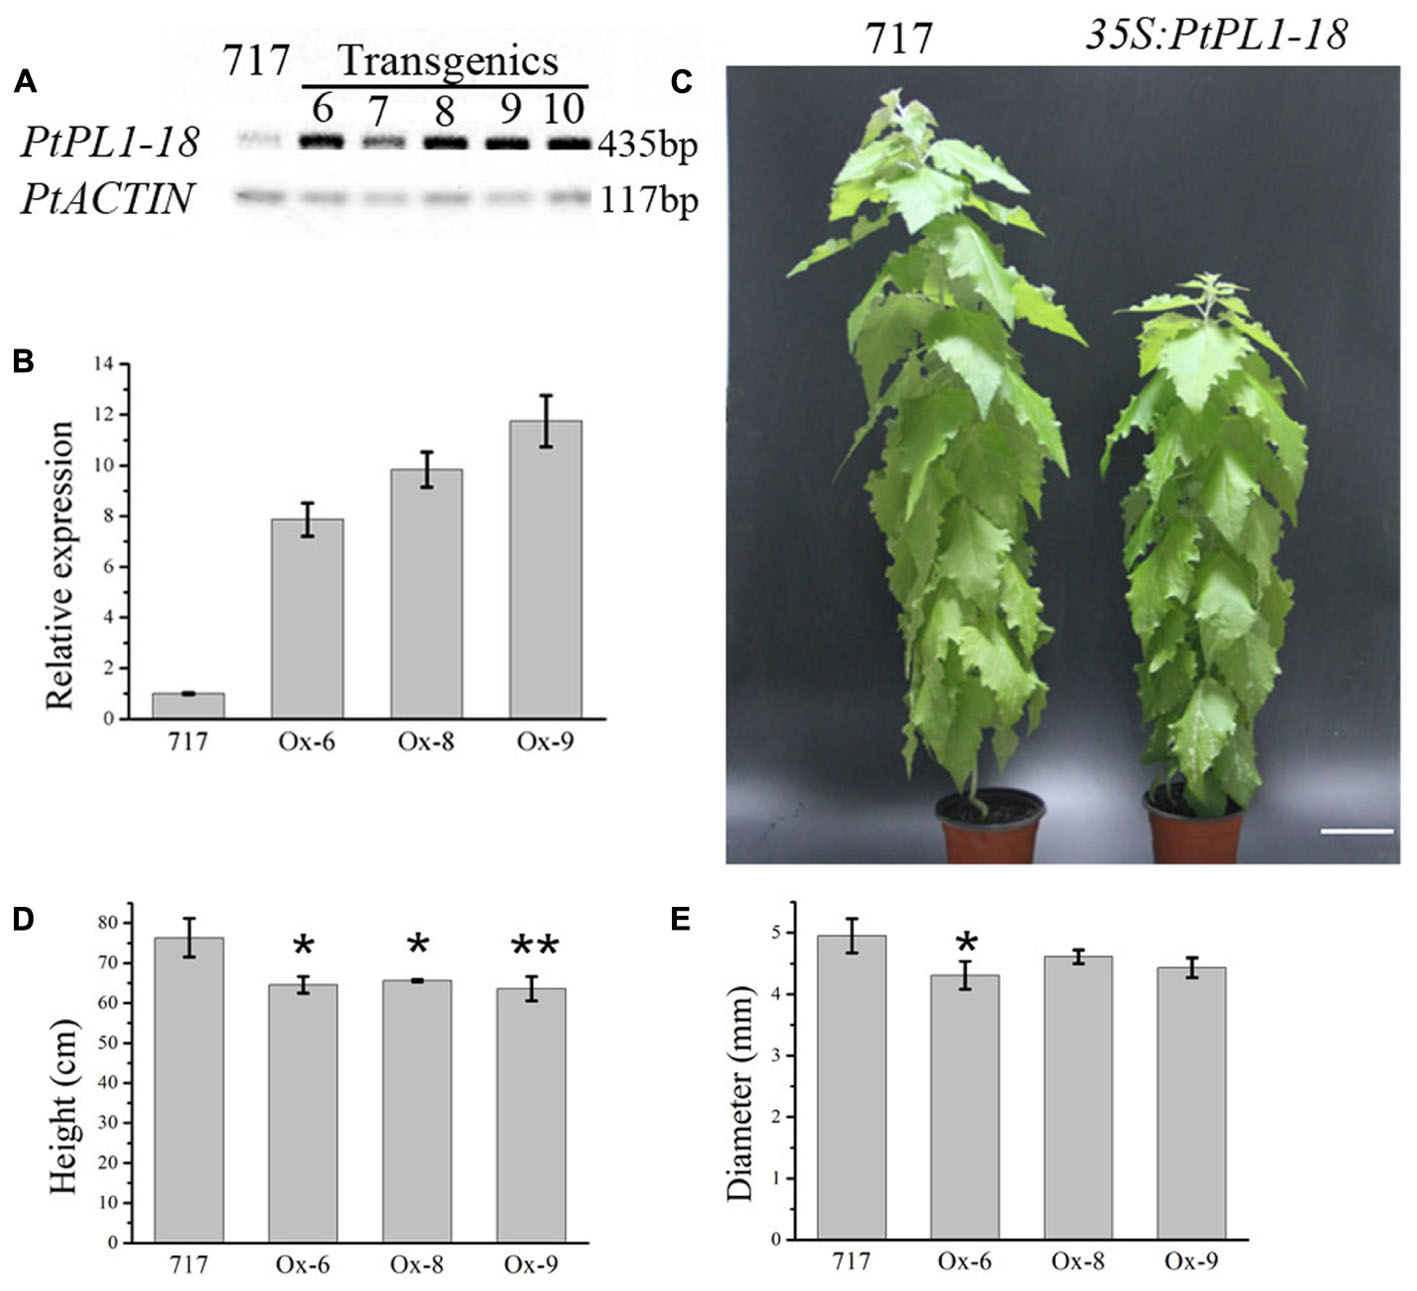
FIGURE 7. Effects of PtPL1-18 overexpression on Populus growth. (A) Characterization of PtPL1-18 expression level in 35S:PtrPL1-18 transgenic lines. Poplar 717 was served as control. PtACTIN was used as the reference gene in RT-PCR. (B) PtPL1-18 relative transcript levels of poplar 717 and 3 selected PtPL1-18 overexpression lines by real-time quantitative RT-PCR. PtACTIN (Potri.019G010400) was used as reference gene, using the ΔΔCt method. Standard deviation was calculated from three biological replicates. (C) Picture of 4-month-old PtPL1-18ox (35S:PtPL1-18) transgenic poplar (right) compared to poplar 717 (left). Bar = 10 cm. (D) Plant height and (E) basal stem diameter of 4-month-old PtPL1-18ox transgenic poplar plants. Data for poplar 717 and transgenic plants were calculated from six individual plants (n = 6). ∗ and ∗∗ indicated significant differences at P < 0.05 and P < 0.01 by Student’s test, respectively.
When we examined the stem cross-sections from internode 12, an obvious irregular-xylem phenotype (collapsed vessel elements) in 35S:PtPL1-18 transgenic plants was found (Figure 8B). Both xylary fiber and vessel cells from the 35S:PtPL1-18 transgenic plants showed much thinner secondary walls than that from control plant (Figures 8A,B). We also analyzed the cross-sections of 12th leaf petiole in 35S:PtPL1-18 transgenic plants and control (Figures 8C,D). Similarly, the xylary fiber, phloem fiber cells also showed delayed secondary wall thickening in transgenic plants compared to the control, however, there was no difference for the cell size of the vessel elements or fiber cells (Figures 8C,D).
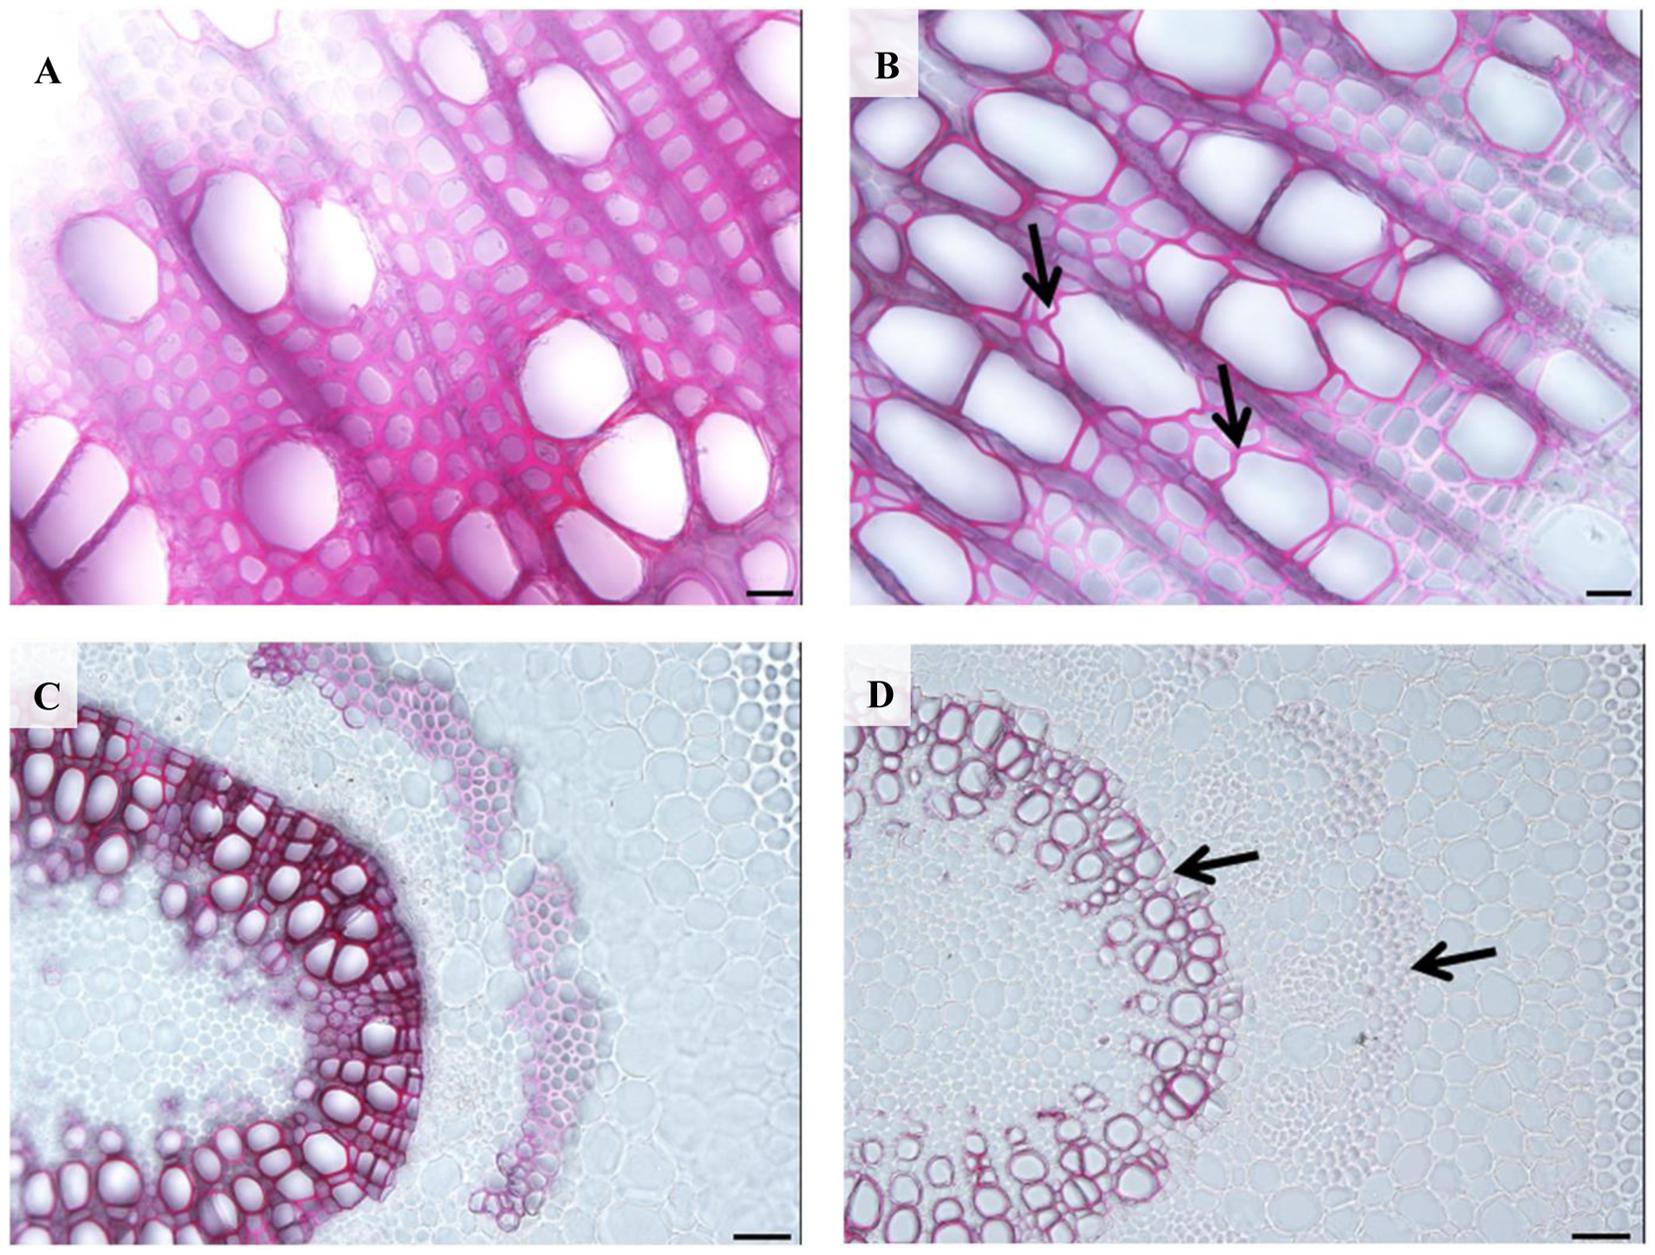
FIGURE 8. Effects of PtPL1-18 overexpression on Populus stem development. (A,B) Stem cross sections from the 12th internodes of poplar 717 (A) and PtPL1-18ox transgenic plants (B) by phloroglucinol–HCl staining. Deformed vessel in PtPL1-18ox stem were indicated by black arrows. (C,D) Transverse section of the 12th leaf petiole of poplar 717 (C) and PtPL1-18ox transgenic plants (D). Reduced wall thickness of xylary fibers and phloem fiber cells in PtPL1-18ox petioles were indicated by arrowheads. (A,B) Bars = 20 μm, (C,D) Bars = 50 μm.
Upon the observation on the reduced plant height and thinner secondary cell wall phenotype of the 35S:PtPL1-18 transgenic plants, we further characterized the cell wall composition between overexpression lines and poplar 717 (Figure 9). The results revealed that the total pectin content was significantly reduced in the 35S:PtPL1-18 overexpression lines (Figure 9A), along with an increase of soluble sugar (Figure 9B). The content of cellulose was increased in line Ox-6 and Ox-8, and the average increments were 8.26%, 18.19% compared to poplar 717, with p-value of <0.05 and <0.01, respectively; on the contrary, the content of cellulose was decreased in line Ox-9, the average reduction was 11.60%, with p-value of <0.01 (Figure 9C). The hemicellulose content was increased in all the three lines, and the average increments in line Ox-6, Ox-8, and Ox-9 were 7.30, 10.49, and 3.74% compared to poplar 717, with p-value of <0.01, <0.01, and <0.05, respectively (Figure 9D). While the lignin content did not significantly vary between three 35S:PtPL1-18 overexpression lines and poplar 717 (Figure 9E).
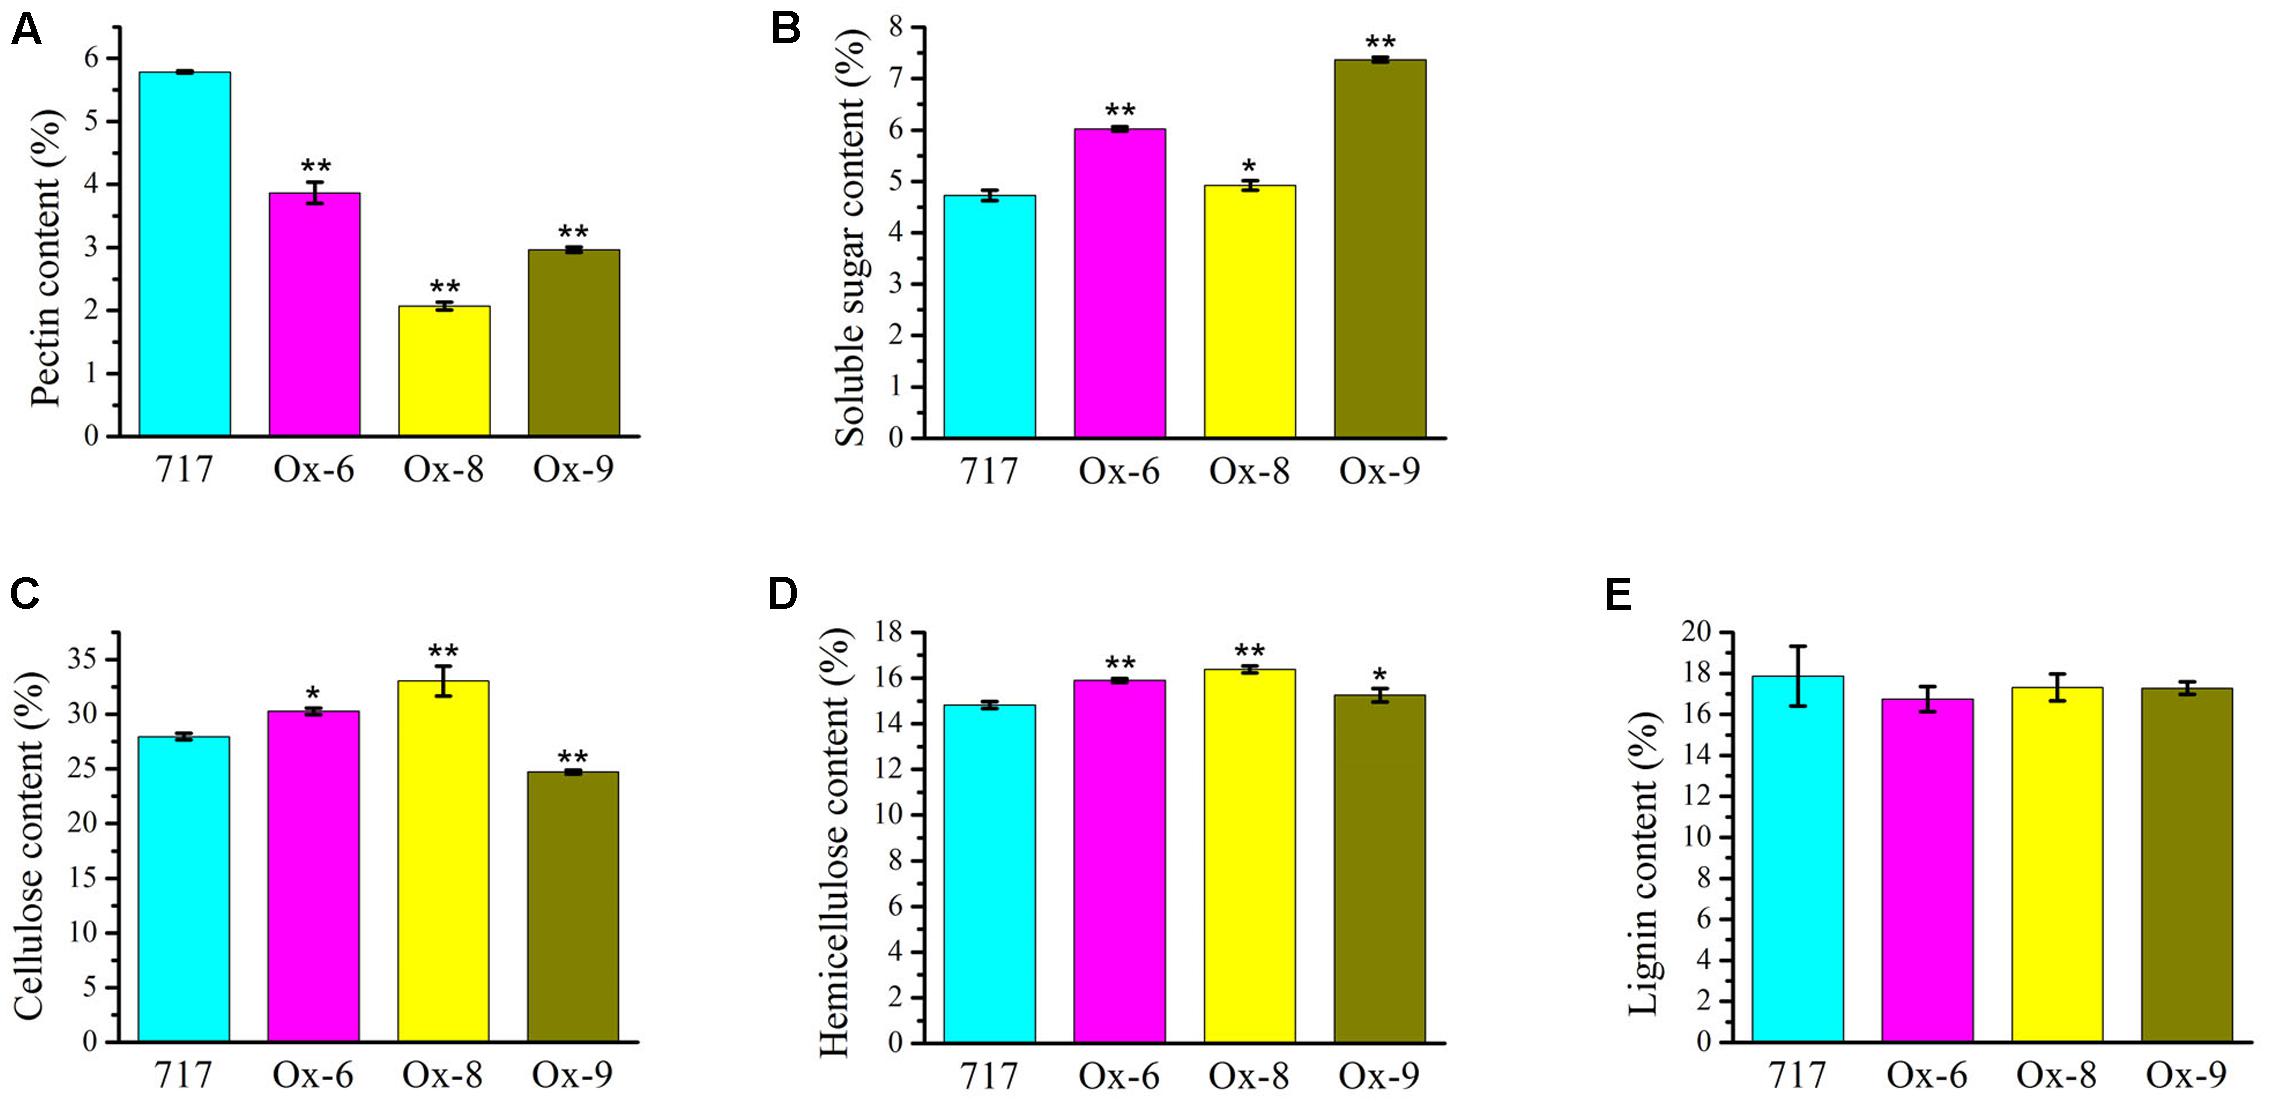
FIGURE 9. Cell wall compositions in the stems of poplar 717 and 35S:PtPL1-18 transgenic plants. Cell wall composition was determined, using the 12th internodes of 4-month-old plant of PtPL1-18ox transgenic lines (Ox-6, Ox-8, and Ox-9), with poplar 717 as control. The content of pectin (A), soluble sugar (B), cellulose (C), hemicellulose (D), and lignin (E) were presented as weight percentage of the dry mass (w/w %). Standard deviation was calculated from three biological replicates, ∗ and ∗∗ indicated significant difference at P < 0.05 or P < 0.01, respectively (Student’s t-test).
CCRC-M35 and JIM5 Binding to Cell Walls in Poplar Stems Is Decreased by Overexpression of PtPL1-18
Two antibodies, CCRC-M35 and JIM5, were used to investigate the distribution of pectic polysaccharides in stem sections (Figure 10). CCRC-M35 binds to the backbone of RG-I and requires at least two unbranched disaccharide repeats for the binding (Pattathil et al., 2010). As shown in Figure 10, the RG-I epitope was present throughout the extracellular spaces. The RG-I signal was quite prominent in cortex, phloem, and xylem tissues in the stem sections of poplar 717 (Figure 10A), while the signal was much weaker in phloem and developing xylem in PtPL1-18 Ox-6 and Ox-8 transgenic plants (Figures 10B,C), suggesting a reduced pectin contents in those tissues. The difference in HG content, detected by JIM5 antibody was more evident (Figures 10D–F). JIM5 recognizes partially methylesterified HG (Clausen et al., 2003). JIM5-HG epitope was detected throughout cell boundaries in the stem sections of poplar 717, particularly in phloem and xylem tissues (Figure 10D). The signal was much weaker in phloem and developing xylem in PtPL1-18 Ox-6 and Ox-8 plants (Figures 10E,F), as compared to poplar 717.
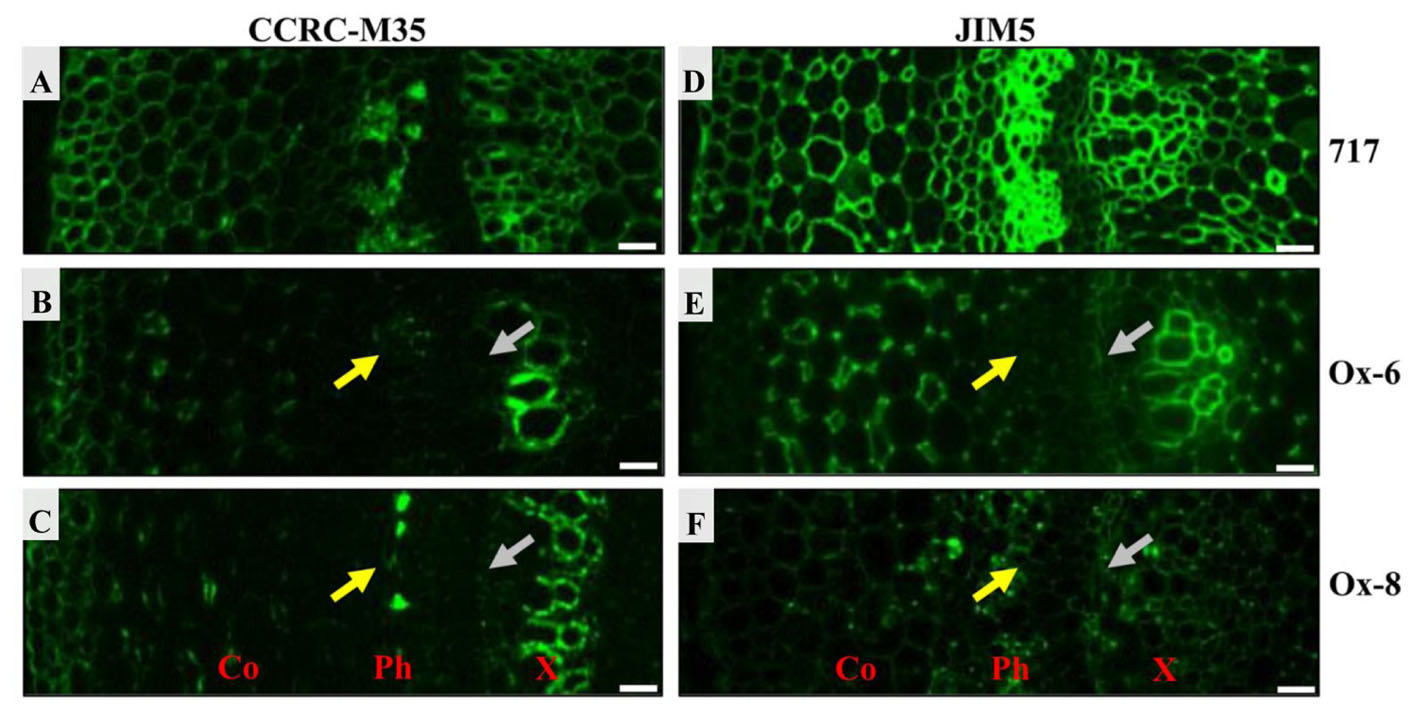
FIGURE 10. Immunofluorescence detection of pectic HG and RGI epitopes in stems of 717 poplar and two independent PtPL1-18 overexpression lines. Immunofluorescence detections of RGI in poplar 717 (A) and two independent PtPL1-18 overexpression lines Ox-6 (B), Ox-8 (C) stem transverse sections by CCRC-M35. The immunolabel with CCRC-M35 showed RGI was across cell walls and abundant at phloem, primary xylem and developing xylem (A). In Ox-6 (B) and Ox-8 (C), CCRC-M35 epitope has been weaker obviously in phloem (yellow arrows) and developing xylem (gray arrows). Immunofluorescence detections of HG in poplar 717 (D) and Ox-6 (E), Ox-8 (F) by JIM5. JIM5 bound to all cell walls in the stem of poplar 717 (D). And the signal was strong in phloem, primary xylem and developing xylem. In Ox-6 (E) and Ox-8 (F) transgenic plants, the immunolabel with JIM5 showed HG less in phloem and developing xylem compared to poplar 717. Co, cortex; Ph, phloem; X, xylem; Bars = 20 μm.
Discussion
Characterization of 30 PtPL1 Genes in Populus
In prior study, over 1,600 genes encoding carbohydrate-active enzymes (CAZymes) in the Populus trichocarpa genome were identified and grouped into families of glycosyltransferases, glycoside hydrolases, carbohydrate esterases, polysaccharide lyases, and expansins. Among them, 28 PL1 genes were identified and named as PL1-1 to 28 (Geisler-Lee et al., 2006). In another study, PL1-29 was identified (Biswal et al., 2014). In this study, PtPL1-30 (Potri.012G091300) was a newly identified member based on previous study. A large number of PLL genes have been identified in many plants, e.g., there are 26 homologous genes in Arabidopsis, 12 in rice (Oryza sativa) and 46 in the genus Brassica (Palusa et al., 2007; Sun and van Nocker, 2010; Jiang et al., 2013b). The 30 PtPL1 genes were classified into five major groups, and group I was subdivided into four subgroups (Biswal et al., 2014) (Figure 1). According to the gene locations on chromosomes, segmental duplications seemed to be the major factors responsible for the expansion of PtPL1 gene family in P. trichocarpa (Figure 2). Furthermore, tandem duplications and retro-transposition events have also happened (Table 1). On the contrary, only whole genome and chromosomal segmental duplications were found during the evolutionary process of PLL gene family in B. rapa (Jiang et al., 2013b). Our results also showed that most of the paralogous pairs were under purifying selection pressure in evolution. However, the Ka/Ks value of PL1-20/PL1-12 is 1.4, implying that this gene pairs might experience positive selection after duplication 109.45 mya when Populus and Arabidopsis lineages diverged (Cao et al., 2016). It could be to improve the adaptability of the organism to the new circumstances. Gene expression data in Figure 4 further supports this hypothesis: PL1-12 is specifically expressed in female catkins, male catkins and young leaves, while PL1-20 obtains higher expression in male catkins and xylem.
PtPL1 Genes in Populus Participate in Vegetative and Reproductive Processes
Most of PtPL1 proteins were predicted to contain an N-terminal signal peptide (Figure 1), which were classified into signal peptide secretary pathway. On the contrary, members from Group V had no predicted signal peptides. PtPL1-2 was predicted to have a chloroplast transit peptide, while no particular sub-cellular localization could be predicted for PtPL1-7 and PtPL1-11. These results were based on bioinformatic prediction. All the 30 PtPL1 members contain Pec_lyase_C domain (Pfam00544), in spite of some differences in the detailed motifs. Members from subgroup Ia and Ib contain most of the conserved motifs and may perform more comprehensive functions. Members from group II contain the unique Pec_lyase_N domain. Members from group V have the least number of motifs, i.e., absence of signal peptides, the second substrate-binding site, and the cysteine residue for the disulfide bond. The diverse protein structures of different groups may partially contribute to the different expression patterns of PtPL1s genes. As shown in the expression heatmap (Figure 4), PtPL1 genes were highly expressed in both vegetative and reproductive tissues, mostly in female catkins, male catkins, xylem and young leaf, and with quite a few in root. Most PtPL1 genes from subgroup Ia were preferentially expressed in xylem and root, and most members from subgroup Ib were preferentially expressed in xylem, root, and catkins, while the transcripts of genes from subgroup Id, groups II, III, and IV were most abundant in female and/or male catkins. In total, about two thirds of PtPL1 genes were preferentially expressed in female or male catkins, indicating their important functions in the reproductive developmental process in Populus. Previous study had shown that all PLL genes were expressed in flowers and several PLLs were highly expressed in pollen in Arabidopsis (Palusa et al., 2007). Some PLL genes in B. rapa are expressed in anthers of mature pollen stage and in pistils after pollination. The primary cell wall of the pollen mother cell was degraded by pectinases including PLL during meiosis and tetrad stages (Blackmore et al., 2007; Jiang et al., 2013a). Furthermore, Pectate Lyase-Like10 (PLL10) was identified as one of the differentially expressed genes during the late pollen developmental stages and in pistils during the fertilization process in Chinese cabbage (B. campestris ssp. chinensis) (Jiang et al., 2014). Our main interest is the functions of PtPL1 genes in wood formation. Wood formation is a sequential developmental process, including complex cell activity (Ye and Zhong, 2015). It has been previously shown that PMEs (EC 3.1.1.11), which catalyze the specific demethylesterification of HGA within plant cell walls, were involved in wood and pollen formation (Pelloux et al., 2007). Prior study showed that the lyases that degrade HG (PL1) were highly expressed in the wood-forming tissues, including tension wood but excluding the wood cell death zone. This suggests a unique role of these lyases in pectin remodeling at the early stages of secondary wall biosynthesis (Geisler-Lee et al., 2006). In this study, the expression profile revealed that PtPL1-18, 17, 19, 9, 25, and 27 have the highest expression level in xylem (Figure 4). Among them, PtPL1-18, 17, and 19 are belong to subgroup Ia; PtPL1-25 and 27 are from subgroup Ib; and PtPL1-9 is classified into subgroup Ic. It is interesting that five of the six candidate genes are from subgroup Ia and Ib, including the previously published gene Ptxt1-27.
PtPL1-18 Is Expressed in Primary Xylem and the Cells Undergoing Secondary Wall Thickening
In several previous studies, expression of pectin-related genes were detected in cells undergoing secondary cell wall thickening. A PL from Zinnia elegans is involved in elongating and differentiating in the development of tracheary elements (Domingo et al., 1998). Several genes involved in pectin biosynthesis and remodeling/degrading were highly expressed in the wood-forming tissues in poplar (Hertzberg et al., 2001; Geisler-Lee et al., 2006). In particular, a poplar PL gene, Ptxt1-27, was expressed at the onset of secondary wall formation (Biswal et al., 2014). The vascular tissue of primary growth, develops directly from procambium and is the dominant vasculature in young stem (Dharmawardhana et al., 2010). In this study, PtPL1-15 was preferentially expressed in IN2 and IN3 suggesting that it might be essential in primary growth of poplar (Figure 5B). Recently research indicates the wall plasticity and variations in cell adhesion are key features of the mechanisms involved in wood cell growth. The VC and adjacent radial expansion (RE) zone are the sites of highest expression of genes encoding wall-modifying enzymes, including PLs (Mellerowicz and Sundberg, 2008). IN5 and IN 9 have well developed secondary phloem tissue and secondary xylem vessels, as well as fibers with well lignified secondary walls (Dharmawardhana et al., 2010). PtPL1-17, 27, 4 and 25 were all highly expressed in mature stems (Figures 5C,F–H); PtPL1-27 and 25 were preferentially expressed in xylem (Figures 5F,H). Meanwhile, PtPL1-18 and 26 both had two expression peaks, one each in the primary and another was in the secondary growth phases of stem (Figures 5D,E). The PtPL1 genes preferentially expressed in the elongation zone are potential candidates for the control of pectin restructuring during stem elongation. The secondary growth-associated PtPL1 genes are likely to be involved in pectin remodeling during the early stages of secondary wall biosynthesis and the radial and intrusive growth of cambial derivatives (Dharmawardhana et al., 2010). The expression of PtPL1-18 was in accordance with the results of its promoter GUS activity assay (Figure 6). The PtPL1-18-GUS staining was detected in the whole vascular bundle cells of the 4th leaf petioles, in which stage there was no secondary cell walls. In the 7th leaf petioles, the GUS staining reduced in the xylem cell walls which were undergoing secondary cell walls development. In the 12th leaf petioles, GUS staining were absent in mature xylem, nor in the pith, but remained in phloem, pro-cambium and developing xylem. The GUS activity was predominant in the primary xylem of the 4th stems, while relatively less GUS expression was detected in pith and xylem cells undergoing secondary wall formation. The GUS staining in internode 7 was detected in all cell types of the vascular bundle, including the central pith. The GUS staining was the most abundant in the primary xylem, while very little in cortex. In more mature stems, i.e., the 12th internodes, the expression of GUS was much higher in cortex, phloem fibers, phloem, the developing xylem and the primary xylem; on the contrary, the expression was undetectable in the fully lignified cells. The results show that PtPL1-18 was predominant expressed in parenchyma cells and cells under secondary wall composition. The expression pattern of PtPL1-18 suggests its unique role in pectin remodeling at the early stages of secondary wall biosynthesis.
Overexpression of PtPL1-18 Influences the Onset of Secondary Cell Wall Formation
It is well-known that pectin is very important in primary cell wall development. Recently, some researches also provided evidence of its involvement in secondary wall development (Xiao and Anderson, 2013). Moreover, Dehydrogenated polymers (DHP = coniferyl alcohol polymers = synthetic lignin) interact with pectin to form hydrophobic clusters as monitored by pyrene fluorescence spectroscopy (Lairez et al., 2005). In maize, de-esterified HGA has been shown to form benzyl-uronate crosslinks to lignin (Grabber, 2005). PME7 in Eucalyptus pilularis was primarily associated with cellulose and had an inverse correlation with lignin content (Sexton et al., 2012). Collectively, these observations suggest that different pectin forms could influence the lignification.
In our study, overexpression of PtPL1-18 in poplar 717 caused decrease of stem height (Figure 7), which was similar to that of ectopic overexpression of pgaII (a mutated PG gene from Aspergillus niger) and overexpression of PtxtPL1-27 (Lionetti et al., 2010; Biswal et al., 2014). Moreover, collapsed xylem vessel elements with thinner secondary wall were observed in PtPL1-18 overexpression transgenic trees (Figure 8). Several xylan-related mutants named as irregular xylem (irx) due to secondary cell wall deficiencies have been identified in Arabidopsis, e.g., both irx1 and irx3 had a severe irregular-xylem phenotype (Turner and Somerville, 1997; Brown et al., 2005). Similar phenotypes have also been observed in RNAi lines of PtrKOR1 gene (KORRIGAN1 in P. trichocarpa), which encodes an endo-1,4-β-glucanase (Yu et al., 2014). The results implied that the secondary wall thickening process in vascular was influenced when PtPL1-18 was overexpressed. The content of pectin was significantly decreased in the stem tissues of 35S:PtPL1-18 transgenic lines. This should be the result of increased expression of PtPL1-18 and subsequently faster de-polymerization of pectin, and then increased the content of soluble sugar. However, no obviously consistent changes were observed in the content of cellulose. The content of hemicellulose was increased in Ox-6, Ox-8, and Ox-9 lines. While the lignin content didn’t significantly vary between poplar 717 and the three 35S:PtPL1-18 overexpression lines. Immunolocalization was used to identify the effect of PtPL1-18 overexpression on modification of pectic polymers. Epitope-specific monoclonal antibodies are important tools to identify diverse polysaccharide in cell walls (Pattathil et al., 2012), in particular pectic polysaccharides including HG, RG-I, and RG-II. In our study, two monoclonal antibodies, JIM5 and CCRC-M35, were used to show the distributions of HG and RGI in stem sections, respectively. JIM5 antibody is particularly important in this study, since PL1 cleave the α-(1,4)-glycosidic bond between the galacturonic acid units of HG and release unsaturated oligogalacturonides. Our results clearly demonstrated that signals of RG-I and HG were dramatically reduced in phloem and developing xylem in the two tested overexpression lines (PtPL1-18 Ox-6 and Ox-8). Previous studies showed partially methylesterified HGs could be recognized by JIM5, JIM7, and LM20 at the corners between cells in stem of M. lutarioriparius stem, whereas RG-I was recognized by LM16 and LM5 in parenchyma cell walls and inner region of secondary cell walls (Cao et al., 2014). JIM5 recognizes partially methylesterified HG. The status of methylation of HG polysaccharide can be affected by both modifying enzymes (e.g., PME) and degradation enzymes (e.g., PL). Arabidopsis pme35-1 mutant is defective in HG methyl esterification and exhibited a pendant stem phenotype. The signals of JIM5, JIM7, and LM20 monoclonal antibodies signals in the primary cell wall of the cortex and interfascicular fibers were suppressed in the mutant, but lignified cell walls in the interfascicular and xylary fibers were not affected (Hongo et al., 2012). PL treatment of TS tobacco stem internode resulted a decrease of HG signal by JIM5 antibody, indicating effective HG epitope removal (Marcus et al., 2008). In our study, the signal for epitopes of RGI and HG was reduced in phloem and developing xylem of PtPL1-18 overexpression lines, compared with poplar 717 plants (Figure 10). These results suggest that overexpression of PtPL1-18 contributed to degradation of pectate in phloem and developing xylem. Recent study on PttPME1 down-regulated lines indicates a high level of HG methylesterification could decrease cellular adhesion and cell wall rigidity and this might trigger mechanosensing responses(Lesniewska et al., 2017). Degradation of pectin during cell expansion by enzymes such as PLs and PGs may enable the incorporation of newly synthesized cell wall components (Marin-Rodriguez et al., 2002). Our results might not fit with expected results from previous work as little influence on the content of lignin by overexpression PtPL1-18. The role of pectin in secondary walls still has to be unraveled. On the other hand, the results suggest that indirect changes may still be relevant, such as eliciting structure or solubility changes in non-pectin cell wall components or altering lignin deposition, thus influencing the progress of secondary wall formation.
Conclusion
Despite its low abundance in the secondary cell walls, recent researches have implied that pectin influences secondary wall formation in addition to its roles in primary wall biosynthesis and modification. In this study, one type of modifying/degrading genes encoding PLs (E.C. 4.2.2.2) were studied in poplar. Geisler-Lee identified PL1-1 to PL1-28 in Populus trichocarpa and analyzed their expression profile in Populus, after that, PtPL1-29 was identified by Geisler-Lee et al. (2006) and Biswal et al. (2014). PtPL1-30 was a novel PL1 gene in this study. Through a comprehensive analysis of gene structures, phylogenetic relationships, chromosomal locations, gene duplication, conserved protein motifs, and expression patterns, 30 PtPL1 genes were characterized. The expression profiles of the PtPL1 genes provided better understanding in possible functional divergence. Most PtPL1 genes in subgroup Ia and Ib were highly expressed in vascular tissues, and genes in subgroup Ia were more specifically expressed in xylem. We further showed that PtPL1-18 from subgroup Ia of the PtPL1 gene family is preferentially expressed in the primary xylem and the xylem cells undergoing secondary wall composition. When PtPL1-18 was overexpressed in poplar, plant growth was inhibited and irregular-xylem phenotype was observed, and secondary wall thickening was delayed. Moreover, by analyzing the chemical composition of cell wall, we found that in the wood of 35S:PtPL1-18 transgenic lines, the content of pectin was significantly decreased accompanied by increase of soluble sugar while there was less influence on the major compositions of secondary wall. It was found that pectin epitopes was reduced in phloem and developing xylem cells by immunolocalization. The results provide a visual evidence for the link between pectin modification and secondary wall formation. However, additional evidence based on enzyme complex and enzyme activity analysis will be helpful to establish a clear and direct connection between PtPL1-mediated pectin modification and secondary wall formation.
Author Contributions
BZ, ML, PC, and YB conceived and designed the experiments. YB conducted bioinformatics analysis. YB, DW, FL, and YL performed the experiments. YB, BZ, and PC analyzed the data. YB drafted the manuscript. BZ, ML, and PC edited the manuscript.
Conflict of Interest Statement
The authors declare that the research was conducted in the absence of any commercial or financial relationships that could be construed as a potential conflict of interest.
Acknowledgments
This work was supported by the Fund to the State Key laboratory of Tree Genetics and Breeding to ML and BZ, the National Natural Science Foundation of China (NSFC 31170564) and the National High Technology Research and Development Program of China (863 Program 2011AA00201) to BZ.
Supplementary Material
The Supplementary Material for this article can be found online at: http://journal.frontiersin.org/article/10.3389/fpls.2017.01123/full#supplementary-material
FIGURE S1 | Multiple sequence alignment of Pec_lyase_C domain in PtPL1 genes. The brown blocks present Ca+2 binding sites; the blue blocks present catalysis sites; the pink block presents disulfide bonds; and the green block presents catalysis sites.
TABLE S1 | Gene specific primers used in this study.
TABLE S2 | PtPL1 gene names and gene model IDs in the Populus genome assembly v1.1, v2.2, and v3.0.
TABLE S3 | Properties of protein products of PtPL1 genes.
TABLE S4 | Prediction of signal peptide and subcellular localization of PtPL1 genes.
TABLE S5 | Probe sets matched to each PtPL1 gene.
Footnotes
- ^http://www.cazy.org
- ^http://www.arabidopsis.org/
- ^http://genome.jgi.doe.gov/Poptr1_1/Poptr1_1.home.html
- ^https://phytozome.jgi.doe.gov/pz/portal.html
- ^http://www.softberry.com/berry.phtml?topic=fgenesh&group=programs&subgroup=gfind
- ^http://smart.embl-heidelberg.de/
- ^http://www.cbs.dtu.dk/services/SignalP/
- ^http://www.cbs.dtu.dk/services/TargetP/
- ^http://web.expasy.org/compute_pi/
- ^http://meme-suite.org/tools/meme
- ^http://popgenie.org/
- ^http://bar.utoronto.ca/efppop/cgi-bin/efpWeb.cgi
- ^http://www.affymetrix.com/analysis/index.affx
- ^http://web.expasy.org/compute_pi/
- ^http://smart.embl-heidelberg.de/
- ^https://phytozome.jgi.doe.gov/
- ^http://meme-suite.org/tools/meme
References
Avci, U., Pattathil, S., and Hahn, M. G. (2012). Immunological approaches to plant cell wall and biomass characterization: immunolocalization of glycan epitopes. Methods Mol. Biol. 908, 73–82. doi: 10.1007/978-1-61779-956-3_7
Bailey, T. L., Williams, N., Misleh, C., and Li, W. W. (2006). MEME: discovering and analyzing DNA and protein sequence motifs. Nucleic Acids Res. 34, W369–W373. doi: 10.1093/nar/gkl198
Barras, F., van Gijsegem, F., and Chatterjee, A. K. (1994). Extracellular enzymes and pathogenesis of soft-rot erwinia. Annu. Rev. Phytopathol. 32, 201–234. doi: 10.1146/annurev.py.32.090194.001221
Biswal, A. K., Soeno, K., Gandla, M. L., Immerzeel, P., Pattathil, S., Lucenius, J., et al. (2014). Aspen pectate lyase PtxtPL1-27 mobilizes matrix polysaccharides from woody tissues and improves saccharification yield. Biotechnol. Biofuels 7:11. doi: 10.1186/1754-6834-7-11
Blackmore, S., Wortley, A. H., Skvarla, J. J., and Rowley, J. R. (2007). Pollen wall development in flowering plants. New Phytol. 174, 483–498. doi: 10.1111/j.1469-8137.2007.02060.x
Brown, D. M., Zeef, L. A., Ellis, J., Goodacre, R., and Turner, S. R. (2005). Identification of novel genes in Arabidopsis involved in secondary cell wall formation using expression profiling and reverse genetics. Plant Cell 17, 2281–2295. doi: 10.1105/tpc.105.031542
Cao, J., and Li, X. (2015). Identification and phylogenetic analysis of late embryogenesis abundant proteins family in tomato (Solanum lycopersicum). Planta 241, 757–772. doi: 10.1007/s00425-014-2215-y
Cao, Y., Han, Y., Jin, Q., Lin, Y., and Cai, Y. (2016). Comparative genomic analysis of the GRF genes in Chinese pear (Pyrus bretschneideri Rehd), poplar (Populous), grape (Vitis vinifera), Arabidopsis and rice (Oryza sativa). Front. Plant Sci. 7:1750. doi: 10.3389/fpls.2016.01750
Cao, Y., Li, J., Yu, L., Chai, G., He, G., Hu, R., et al. (2014). Cell wall polysaccharide distribution in Miscanthus lutarioriparius stem using immuno-detection. Plant Cell Rep. 33, 643–653. doi: 10.1007/s00299-014-1574-y
Carroll, A., and Somerville, C. (2009). Cellulosic biofuels. Annu. Rev. Plant Biol. 60, 165–182. doi: 10.1146/annurev.arplant.043008.092125
Chen, Y., and Cao, J. (2014). Comparative genomic analysis of the Sm gene family in rice and maize. Gene 539, 238–249. doi: 10.1016/j.gene.2014.02.006
Clausen, M. H., Willats, W. G., and Knox, J. P. (2003). Synthetic methyl hexagalacturonate hapten inhibitors of anti-homogalacturonan monoclonal antibodies LM7, JIM5 and JIM7. Carbohydr. Res. 338, 1797–1800. doi: 10.1016/S0008-6215(03)00272-6
Dharmawardhana, P., Brunner, A. M., and Strauss, S. H. (2010). Genome-wide transcriptome analysis of the transition from primary to secondary stem development in Populus trichocarpa. BMC Genomics 11:150. doi: 10.1186/1471-2164-11-150
Domingo, C., Roberts, K., Stacey, N. J., Connerton, I., Ruiz-Teran, F., and McCann, M. C. (1998). A pectate lyase from Zinnia elegans is auxin inducible. Plant J. 13, 17–28. doi: 10.1046/j.1365-313X.1998.00002.x
Emanuelsson, O., Nielsen, H., Brunak, S., and von Heijne, G. (2000). Predicting subcellular localization of proteins based on their N-terminal amino acid sequence. J. Mol. Biol. 300, 1005–1016. doi: 10.1006/jmbi.2000.3903
Finn, R. D., Mistry, J., Schuster-Bockler, B., Griffiths-Jones, S., Hollich, V., Lassmann, T., et al. (2006). Pfam: clans, web tools and services. Nucleic Acids Res. 34, D247–D251. doi: 10.1093/nar/gkj149
Gasteiger, E., Hoogland, C., Gattiker, A., Duvaud, S., Wilkins, M. R., Appel, R. D., et al. (2005). “Protein identification and analysis tools on the ExPASy Server,” in The Proteomics Protocols Handbook, ed. J. M. Walker (New York, NY: Springer), 571–607.
Geisler-Lee, J., Geisler, M., Coutinho, P. M., Segerman, B., Nishikubo, N., Takahashi, J., et al. (2006). Poplar carbohydrate-active enzymes. Gene identification and expression analyses. Plant Physiol. 140, 946–962. doi: 10.1104/pp.105.072652
Goodstein, D. M., Shu, S., Howson, R., Neupane, R., Hayes, R. D., Fazo, J., et al. (2012). Phytozome: a comparative platform for green plant genomics. Nucleic Acids Res. 40, D1178–D1186. doi: 10.1093/nar/gkr944
Grabber, J. H. (2005). How do lignin composition, structure, and cross-linking affect degradability? A review of cell wall model studies. Crop Sci. 45, 820–831. doi: 10.2135/cropsci2004.0191
Hall, T. A. (1999). BioEdit: a user-friendly biological sequence alignment editor and analysis program for Windows 95/98/NT. Nucleic Acids Symp. Ser. 41, 95–98.
Herron, S. R., Scavetta, R. D., Garrett, M., Legner, M., and Jurnak, F. (2003). Characterization and implications of Ca2+ binding to pectate lyase C. J. Biol. Chem. 278, 12271–12277. doi: 10.1074/jbc.M209306200
Hertzberg, M., Aspeborg, H., Schrader, J., Andersson, A., Erlandsson, R., Blomqvist, K., et al. (2001). A transcriptional roadmap to wood formation. Proc. Natl. Acad. Sci. U.S.A. 98, 14732–14737. doi: 10.1073/pnas.261293398
Hongo, S., Sato, K., Yokoyama, R., and Nishitani, K. (2012). Demethylesterification of the primary wall by PECTIN METHYLESTERASE35 provides mechanical support to the Arabidopsis stem. Plant Cell 24, 2624–2634. doi: 10.1105/tpc.112.099325
Howe, E., Holton, K., Nair, S., Schlauch, D., Sinha, R., and Quackenbush, J. (2010). “MeV: MultiExperiment viewer,” in Biomedical Informatics for Cancer Research, eds M. F. Ochs, J. T. Casagrande, and R. V. Davuluri (New York, NY: Springer), 267–277.
Hu, R., Qi, G., Kong, Y., Kong, D., Gao, Q., and Zhou, G. (2010). Comprehensive analysis of NAC domain transcription factor gene family in Populus trichocarpa. BMC Plant Biol. 10:145. doi: 10.1186/1471-2229-10-145
Jiang, J. J., Jiang, J., Qiu, L., Miao, Y., Yao, L., and Cao, J. (2013a). Identification of gene expression profile during fertilization in Brassica campestris subsp. chinensis. Genome 56, 39–48. doi: 10.1139/gen-2012-0088
Jiang, J. J., Yao, L. N., Miao, Y., and Cao, J. S. (2013b). Genome-wide characterization of the pectate lyase-like (PLL) genes in Brassica rapa. Mol. Genet. Genomics 288, 601–614. doi: 10.1007/s00438-013-0775-3
Jiang, J., Yao, L., Yu, Y., Lv, M., Miao, Y., and Cao, J. (2014). PECTATE LYASE-LIKE10 is associated with pollen wall development in Brassica campestris. J. Integr. Plant Biol. 56, 1095–1105. doi: 10.1111/jipb.12209
Karimi, M., Inze, D., and Depicker, A. (2002). GATEWAYTM vectors for Agrobacterium-mediated plant transformation. Trends Plant Sci. 7, 193–195. doi: 10.1016/S1360-1385(02)02251-3
Kulikauskas, R., and McCormick, S. (1997). Identification of the tobacco and Arabidopsis homologues of the pollen-expressed LAT59 gene of tomato. Plant Mol. Biol. 34, 809–814. doi: 10.1023/A:1005856531693
Lairez, D., Cathala, B., Monties, B., Bedos-Belval, F., Duran, H., and Gorrichon, L. (2005). Aggregation during coniferyl alcohol polymerization in pectin solution: a biomimetic approach of the first steps of lignification. Biomacromolecules 6, 763–774. doi: 10.1021/bm049390y
Leplé, J. C., Brasileiro, A. C., Michel, M. F., Delmotte, F., and Jouanin, L. (1992). Transgenic poplars: expression of chimeric genes using four different constructs. Plant Cell Rep. 11, 137–141. doi: 10.1007/BF00232166
Lesniewska, J., Ohman, D., Krzeslowska, M., Kushwah, S., Barciszewska-Pacak, M., Kleczkowski, L. A., et al. (2017). Defense responses in aspen with altered pectin methylesterase activity reveal the hormonal inducers of tyloses. Plant Physiol. 173, 1409–1419. doi: 10.1104/pp.16.01443
Letunic, I., Doerks, T., and Bork, P. (2015). SMART: recent updates, new developments and status in 2015. Nucleic Acids Res. 43, D257–D260. doi: 10.1093/nar/gku949
Li, Z. N., Liu, G. F., Zhang, J. Q., Zhang, J. W., and Bao, M. Z. (2008). Extraction of high-quality tissue-specific RNA from London plane trees (Platanus acerifolia), permitting the construction of a female inflorescence cDNA library. Funct. Plant Biol. 35, 159–165. doi: 10.1071/Fp07212
Lionetti, V., Francocci, F., Ferrari, S., Volpi, C., Bellincampi, D., Galletti, R., et al. (2010). Engineering the cell wall by reducing de-methyl-esterified homogalacturonan improves saccharification of plant tissues for bioconversion. Proc. Natl. Acad. Sci. U.S.A. 107, 616–621. doi: 10.1073/pnas.0907549107
Lynch, M., and Conery, J. S. (2000). The evolutionary fate and consequences of duplicate genes. Science 290, 1151–1155. doi: 10.1126/science.290.5494.1151
Marcus, S. E., Verhertbruggen, Y., Herve, C., Ordaz-Ortiz, J. J., Farkas, V., Pedersen, H. L., et al. (2008). Pectic homogalacturonan masks abundant sets of xyloglucan epitopes in plant cell walls. BMC Plant Biol. 8:60. doi: 10.1186/1471-2229-8-60
Marin-Rodriguez, M. C., Orchard, J., and Seymour, G. B. (2002). Pectate lyases, cell wall degradation and fruit softening. J. Exp. Bot. 53, 2115–2119. doi: 10.1093/jxb/erf089
Marin-Rodriguez, M. C., Smith, D. L., Manning, K., Orchard, J., and Seymour, G. B. (2003). Pectate lyase gene expression and enzyme activity in ripening banana fruit. Plant Mol. Biol. 51, 851–857. doi: 10.1023/A:1023057202847
Mellerowicz, E. J., and Sundberg, B. (2008). Wood cell walls: biosynthesis, developmental dynamics and their implications for wood properties. Curr. Opin. Plant Biol. 11, 293–300. doi: 10.1016/j.pbi.2008.03.003
Milioni, D., Sado, P. E., Stacey, N. J., Domingo, C., Roberts, K., and McCann, M. C. (2001). Differential expression of cell-wall-related genes during the formation of tracheary elements in the Zinnia mesophyll cell system. Plant Mol. Biol. 47, 221–238. doi: 10.1023/A:1010647902487
Mohnen, D. (2008). Pectin structure and biosynthesis. Curr. Opin. Plant Biol. 11, 266–277. doi: 10.1016/j.pbi.2008.03.006
Nicholas, K. B., Nicholas, H. B. Jr., and Deerfield, D. W. II (1997). GeneDoc: analysis and visualization of genetic variation. EMBNEW. NEWS 4:14.
Palusa, S. G., Golovkin, M., Shin, S. B., Richardson, D. N., and Reddy, A. S. N. (2007). Organ-specific, developmental, hormonal and stress regulation of expression of putative pectate lyase genes in Arabidopsis. New Phytol. 174, 537–550. doi: 10.1111/j.1469-8137.2007.02033.x
Pattathil, S., Avci, U., Baldwin, D., Swennes, A. G., McGill, J. A., Popper, Z., et al. (2010). A comprehensive toolkit of plant cell wall glycan-directed monoclonal antibodies. Plant Physiol. 153, 514–525. doi: 10.1104/pp.109.151985
Pattathil, S., Avci, U., Miller, J. S., and Hahn, M. G. (2012). Immunological approaches to plant cell wall and biomass characterization: glycome profiling. Methods Mol. Biol. 908, 61–72. doi: 10.1007/978-1-61779-956-3_6
Pelloux, J., Rusterucci, C., and Mellerowicz, E. J. (2007). New insights into pectin methylesterase structure and function. Trends Plant Sci. 12, 267–277. doi: 10.1016/j.tplants.2007.04.001
Petersen, T. N., Brunak, S., von Heijne, G., and Nielsen, H. (2011). SignalP 4.0: discriminating signal peptides from transmembrane regions. Nat. Methods 8, 785–786. doi: 10.1038/nmeth.1701
Pfaffl, M. W. (2001). A new mathematical model for relative quantification in real-time RT-PCR. Nucleic Acids Res. 29:e45. doi: 10.1093/nar/29.9.e45
Pilatzke-Wunderlich, I., and Nessler, C. L. (2001). Expression and activity of cell-wall-degrading enzymes in the latex of opium poppy, Papaver somniferum L. Plant Mol. Biol. 45, 567–576. doi: 10.1023/A:1010624218855
Plomion, C., Leprovost, G., and Stokes, A. (2001). Wood formation in trees. Plant Physiol. 127, 1513–1523. doi: 10.1104/pp.010816
Saitou, N., and Nei, M. (1987). The neighbor-joining method: a new method for reconstructing phylogenetic trees. Mol. Biol. Evol. 4, 406–425.
Sexton, T. R., Henry, R. J., Harwood, C. E., Thomas, D. S., McManus, L. J., Raymond, C., et al. (2012). Pectin Methylesterase genes influence solid wood properties of Eucalyptus pilularis. Plant Physiol. 158, 531–541. doi: 10.1104/pp.111.181602
Sjodin, A., Street, N. R., Sandberg, G., Gustafsson, P., and Jansson, S. (2009). The Populus Genome Integrative Explorer (PopGenIE): a new resource for exploring the Populus genome. New Phytol. 182, 1013–1025. doi: 10.1111/j.1469-8137.2009.02807.x
Solovyev, V., Kosarev, P., Seledsov, I., and Vorobyev, D. (2006). Automatic annotation of eukaryotic genes, pseudogenes and promoters. Genome Biol. 7(Suppl. 1), S10.1–S10.12. doi: 10.1186/gb-2006-7-s1-s10
Sun, L. X., and van Nocker, S. (2010). Analysis of promoter activity of members of the PECTATE LYASE-LIKE (PLL) gene family in cell separation in Arabidopsis. BMC Plant Biol. 10:152. doi: 10.1186/1471-2229-10-152
Tamura, K., Peterson, D., Peterson, N., Stecher, G., Nei, M., and Kumar, S. (2011). MEGA5: molecular evolutionary genetics analysis using maximum likelihood, evolutionary distance, and maximum parsimony methods. Mol. Biol. Evol. 28, 2731–2739. doi: 10.1093/molbev/msr121
Thompson, J. D., Gibson, T. J., Plewniak, F., Jeanmougin, F., and Higgins, D. G. (1997). The CLUSTAL_X windows interface: flexible strategies for multiple sequence alignment aided by quality analysis tools. Nucleic Acids Res. 25, 4876–4882. doi: 10.1093/nar/25.24.4876
Turner, S. R., and Somerville, C. R. (1997). Collapsed xylem phenotype of Arabidopsis identifies mutants deficient in cellulose deposition in the secondary cell wall. Plant Cell 9, 689–701. doi: 10.1105/tpc.9.5.689
Tuskan, G. A., DiFazio, S., Jansson, S., Bohlmann, J., Grigoriev, I., Hellsten, U., et al. (2006). The genome of black cottonwood, Populus trichocarpa (Torr. & Gray). Science 313, 1596–1604. doi: 10.1126/science.1128691
Wang, D., Zhang, Y., Zhang, Z., Zhu, J., and Yu, J. (2010). KaKs_Calculator 2.0: a toolkit incorporating gamma-series methods and sliding window strategies. Genomics Proteomics Bioinformatics 8, 77–80. doi: 10.1016/S1672-0229(10)60008-3
Wang, H., Guo, Y., Lv, F., Zhu, H., Wu, S., Jiang, Y., et al. (2010). The essential role of GhPEL gene, encoding a pectate lyase, in cell wall loosening by depolymerization of the de-esterified pectin during fiber elongation in cotton. Plant Mol. Biol. 72, 397–406. doi: 10.1007/s11103-009-9578-7
Wilkins, O., Nahal, H., Foong, J., Provart, N. J., and Campbell, M. M. (2009). Expansion and diversification of the Populus R2R3-MYB family of transcription factors. Plant Physiol. 149, 981–993. doi: 10.1104/pp.108.132795
Wu, Y., Qiu, X., Du, S., and Erickson, L. (1996). PO149, a new member of pollen pectate lyase-like gene family from alfalfa. Plant Mol. Biol. 32, 1037–1042. doi: 10.1007/BF00041387
Wu, Z. L., Zhang, M. L., Wang, L. Q., Tu, Y. Y., Zhang, J., Xie, G. S., et al. (2013). Biomass digestibility is predominantly affected by three factors of wall polymer features distinctive in wheat accessions and rice mutants. Biotechnol. Biofuels 6:183. doi: 10.1186/1754-6834-6-183
Xiao, C., and Anderson, C. T. (2013). Roles of pectin in biomass yield and processing for biofuels. Front. Plant Sci. 4:67. doi: 10.3389/fpls.2013.00067
Xu, N., Zhang, W., Ren, S., Liu, F., Zhao, C., Liao, H., et al. (2012). Hemicelluloses negatively affect lignocellulose crystallinity for high biomass digestibility under NaOH and H2SO4 pretreatments in Miscanthus. Biotechnol. Biofuels 5:58. doi: 10.1186/1754-6834-5-58
Yadav, S., Yadav, P. K., Yadav, D., and Yadav, K. D. S. (2009). Pectin lyase: a review. Process Biochem. 44, 1–10. doi: 10.1016/j.procbio.2008.09.012
Ye, Z. H., and Zhong, R. Q. (2015). Molecular control of wood formation in trees. J. Exp. Bot. 66, 4119–4131. doi: 10.1093/jxb/erv081
Keywords: pectin, pectate lyase, cell wall, wood formation, Populus
Citation: Bai Y, Wu D, Liu F, Li Y, Chen P, Lu M and Zheng B (2017) Characterization and Functional Analysis of the Poplar Pectate Lyase-Like Gene PtPL1-18 Reveal Its Role in the Development of Vascular Tissues. Front. Plant Sci. 8:1123. doi: 10.3389/fpls.2017.01123
Received: 28 March 2017; Accepted: 12 June 2017;
Published: 28 June 2017.
Edited by:
Michael Deyholos, University of British Columbia, CanadaReviewed by:
Elisabeth Jamet, Université Toulouse III Paul Sabatier, FranceRobert VanBuren, Michigan State University, United States
Copyright © 2017 Bai, Wu, Liu, Li, Chen, Lu and Zheng. This is an open-access article distributed under the terms of the Creative Commons Attribution License (CC BY). The use, distribution or reproduction in other forums is permitted, provided the original author(s) or licensor are credited and that the original publication in this journal is cited, in accordance with accepted academic practice. No use, distribution or reproduction is permitted which does not comply with these terms.
*Correspondence: Bo Zheng, bo.zheng@mail.hzau.edu.cn