 Adel M. Elmaghrabi
 Hilary J. Rogers2
 Sergio J. Ochatt
- 1Biotechnology Research Center, Tripoli, Libya
- 2School of Biosciences, Cardiff University, Cardiff, United Kingdom
- 3Agroécologie, AgroSup Dijon, Institut National de la Recherche Agronomique (INRA), University of Bourgogne Franche-Comté, Dijon, France
Polyethylene glycol (PEG) can be used to mimic osmotic stress in plant tissue cultures to study mechanisms of tolerance. The aim of this experiment was to investigate the effects of PEG (M.W. 6000) on embryogenic callus of Medicago truncatula. Leaf explants were cultured on MS medium with 2 mg L-1 NAA and 0.5 mg L-1 BAP for 5 months. Then, calli were transferred to the same medium further supplemented with 10% (w/v) 6000 PEG for 6 months in order to study physiological and putative molecular markers of water stress. There were no significant differences in growth rate of callus or mitotic index ± PEG although embryogenic potential of PEG treated callus was morphologically enhanced. Cells were rounder on PEG medium and cell size, nuclear size and endoreduplication increased in response to the PEG treatment. Significant increases in soluble sugar and proline accumulation occurred under PEG treatment compared with the control. Significantly, high MtWEE1 and MtCCS52 expression resulted from 6 months of PEG treatment with no significant differences in MtSERK1 or MtP5CS expression but down regulation of MtSOS expression. The results are consistent in showing elevated expression of a cell cycle checkpoint gene, WEE1. It is likely that the cell cycle checkpoint surveillance machinery, that would include WEE1 expression, is ameliorating the effects of the stress imposed by PEG.
Introduction
Water stress can result in reducing crop yield world-wide (Boyer, 1982; Smirnoff, 1993; Gonzalez et al., 1995) and a recent UN survey has underlined the importance of water deficit in our planet and its effects for the coming generations unless urgent measures are taken. This situation is exacerbated in arid and semiarid ecosystems. Here, legumes play a central agroecological role through their ability to use atmospheric nitrogen via the symbiosis with Rhizobia, and thus it reduces the need for fertilizers, improve food security, and generally favor the environment (Rubio et al., 2002; Naya et al., 2007; Kohler et al., 2008; Araújo et al., 2015; Ochatt, 2015). Studying a legume model species is thus timely and Medicago truncatula is of particular interest given its rather short life cycle and autogamy. It has a small and almost completely annotated genome (500–550 Mbp) which is publicly available (Goodstein et al., 2012), and it is more drought tolerant than other legume crops such as pea, bean, and soybean (Motan et al., 1994; Gonzalez et al., 1998; Costa França et al., 2000; Galvez et al., 2005). In spite of this, previous studies on water stress resistance in M. truncatula mostly concerned gene transfer (Alcântara et al., 2015; Araújo et al., 2015; Duque et al., 2016). The assessment of physiological responses (Nunes et al., 2008) and their genetic mechanisms (Badri et al., 2011) is more limited.
Osmotic stress or water deficit can be defined as the absence of adequate moisture necessary for a plant to grow normally and complete its life cycle (Cabuslay et al., 2002). Resistance mechanisms can be grouped into three categories: firstly escape, which enables the plant to complete its life cycle before the most intense period of water shortage, secondly avoidance, which prevents exposure to water stress, and finally tolerance, which enables the plant to withstand stress conditions (Levitt, 1972; Zhu, 2002; Golldack et al., 2014). Some resistance mechanisms are constitutive and active before exposure to water shortage. In other cases, plants exposed to water stress alter their physiology, thereby acclimating themselves to withstand drier conditions. One of the tolerance mechanisms activated under such stress is that of mitigating osmotic stress, via the production of osmolytes such as proline, and soluble sugars, that protect cells against osmotic perturbation (Choudhary et al., 2005; Valliyodan and Nguyen, 2006; Fulda et al., 2011; Elmaghrabi et al., 2013; Deinlein et al., 2014). On the other hand, φw (water potential) is also known to induce a morphological variation in tissues subjected to osmotic stress, notably at the cellular level. Such variation is potentially useful to understand biodiversity by identifying cellular responses to stress that are not necessarily picked up by taxonomic or phylogenetic indices that consider cell shape or size in vitro (Ochatt et al., 2008; Ochatt and Moessner, 2010). It is also important for assessing the competence for regeneration in vitro (Ochatt et al., 2008) following the recovery of tissues with a novel genetic makeup obtained via in vitro selection (Elmaghrabi et al., 2013) or gene transfer (Alcântara et al., 2015).
Responses to abiotic stress factors involve a reprogramming of the expression of 1000s of genes, which in turn result in the modification of a range of cellular and physiological processes (Cushman and Bohnert, 2000; Sreenivasulu et al., 2004; Araújo et al., 2015). One example of tolerance to stress at the molecular level, is the induction of P5CS that encodes Δ1-pyrroline -5-carboxylate synthetase involved in proline biosynthesis (Silva-Ortega et al., 2008). This gene is highly expressed in salt-and drought-tolerant plant species (Choudhary et al., 2005) and it is induced under salt and water stress in many plant species including legumes (Chen et al., 2009). The P5CS gene was also up-regulated in M. truncatula in response to salt stress (Elmaghrabi et al., 2013). The kinetics of expression of genes involved in the cell cycle in plants exposed to high levels of abiotic stress has been the object of a number of studies (Gill and Tuteja, 2010; Zhao et al., 2014; Roy, 2016). In Arabidopsis, a negative regulator of mitosis, WEE1, is strongly expressed in response to abiotic stress (De Schutter et al., 2007). Osmotic stress imposed using polyethylene glycol (PEG) also up-regulated oxidative DNA damage and consequently DNA repair enzymes both in imbibed seeds (Balestrazzi et al., 2011) and in plantlets (Macovei et al., 2010). Our recent work with M. truncatula also showed an increased expression of WEE1 and CCS52 (CELL CYCLE SWITCH PROTEIN 52, another gene involved in the cell cycle) in salt-acclimated tissues as well as expression of genes involved in salt tolerance (SOS1 encoding a Na+/H+ antiporter) and embryogenesis in vitro [SOMATIC EMBRYOGENESIS RECEPTOR-LIKE KINASE 1 (SERK1)] (Elmaghrabi et al., 2013).
Tissue culture has been used in the selection of water stress tolerant cell lines that have been used to regenerate plants resistant to harsh environmental conditions in a range of crops including Medicago sativa L., tomato, soybean, and wheat (Sakthivelu et al., 2008; Guóth et al., 2010; Mahmood et al., 2012). Water deficit in vitro can be imposed through treatment with PEG 6000 (Ochatt et al., 1998; Guóth et al., 2010; Rai et al., 2011; Yang et al., 2012). The adsorbant property of this inert osmolyte provokes in plant cells and tissues the same or comparable effects to those obtained by drying soil at the same φw and without any other associated detrimental effects (Michel and Kaufmann, 1973). PEG 6000 thus closely mimics soil water stress (Lu and Neumann, 1998) and induces increases in total soluble sugars which serve as an osmoticum, or can be a source of respiratory substrates (Srivastava et al., 1995; Elmaghrabi et al., 2013). Additionally, PEG was shown to stimulate somatic embryogenesis in vitro (Attree et al., 1995; Igasaki et al., 2003). PEG 6000 was also used, and at similar concentrations as here (although osmolarity was expressed in MPa rather than in mOsm/kg as in this work), in studies on PEG-induced DNA damage with M. truncatula in vitro plantlets (Macovei et al., 2010) and seeds (Balestrazzi et al., 2011).
As many legumes are grown (or have their center of origin) in regions with an arid to semi-arid climate (Smýkal et al., 2015), a number of studies have identified genes, QTLs, ESTs, and SNPs that are responsive to drought stress in several species (Jacob et al., 2016). However, the molecular basis of water stress tolerance is not fully understood in M. truncatula (Araújo et al., 2015). The aim of the current work was to examine the extent to which treatments with PEG could enhance osmotic stress tolerance potential in callus of M. truncatula. In addition, the accumulation of osmoprotectants, the effects on cell morphology (shape and size) and division competence, and the expression of WEE1, CCSS52, P5CS, and SOS1 were monitored in the PEG treatments to investigate the mechanism underlying the induced water stress responses as compared to those activated in response to salt stress (Elmaghrabi et al., 2013). The expression of SERK1 was also analyzed, given its key role on the competence for the subsequent regeneration through somatic embryogenesis of plants that may potentially carry the stress resistance trait acquired.
Materials and Methods
Plant Material
Medicago truncatula cv. Jemalong line A17 (2n = 2x = 16, 1C value = 0.48 pg) was used in this study. One hundred leaves were explanted to tissue culture from 4 week old aseptically grown plants onto a medium consisting of MS basal medium (Murashige and Skoog, 1962) with 2 mg L-1 NAA (alpha-naphthalene acetic acid; Sigma, Poole, United Kingdom) and 0.5 mg L-1 BAP (6-benzylaminopurine; Sigma, Poole, United Kingdom), hereafter called MANA medium as in Elmaghrabi et al. (2013), and dispensed in multi-well dishes as 2 mL aliquots per well. Cultures were incubated at 24/22°C (day/night), with a 16/8 h (light/dark) photoperiod of 90 μmol m-2 s-1 from warm white fluorescent tubes. After 4 weeks, explants were sub-cultured on the medium above and the frequency of callus initiation assessed.
Leaf-derived embryogenic callus was obtained after culture on MANA medium for 5 months. Calli were screened for embryogenesis (i.e., somatic embryos at different developmental stages, identified as spherical glistening nodules when globular, through to elongated greening structures at later stages) or, organogenesis (development of shoots and/or roots), as reported elsewhere (Ochatt et al., 1998, 2013; Elmaghrabi and Ochatt, 2006; Ochatt and Revilla, 2016). Only embryogenic calli were transferred onto 25 ml of MANA medium supplemented with or without 10% w/v (-0.66 MPa) PEG6000 (PEG; Sigma, Poole, United Kingdom) for 6 months in order to acclimate the cultures under conditions that mimic water (osmotic) stress (at least 12 calli per treatment). This PEG concentration was chosen based on previous studies with various species (Biswas et al., 2002; Guóth et al., 2010) and also including M. truncatula (Macovei et al., 2010; Balestrazzi et al., 2011). Growth data (g fresh weight, g FW) were recorded and results were statistically analyzed (P ≤ 0.05; Kruskal–Wallis followed by a Dunn’s test).
Proline and Water Soluble Carbohydrate Measurements
Proline content was measured as described in Elmaghrabi et al. (2013) and according to Troll and Lindsley (1955) and Boukel and Houassine (1997) from callus tissue (100 mg per sample per treatment) grown on 0 and 10% (w/v) PEG. All treatments were repeated three times. Optical density was measured using a spectrophotometer (UNICAM; Cambridge, United Kingdom) at a wavelength of 528 nm and calibrated using a standard curve of proline solutions (0.1–0.4 mg mL-1; Sigma, Poole, United Kingdom).
Determination of soluble sugars was by the anthrone method (Plummer, 1987; Elmaghrabi et al., 2013) using 100 mg callus samples from 0 and 10% (w/v) PEG treatments (three replicates). The soluble sugar content was measured spectrophotometrically (UNICAM, Cambridge, United Kingdom) at 585 nm and the data were converted to mg L-1 using the calibrations established prior to the assay.
Medium and Callus Osmolarity
For measurements of medium and callus osmolarity a Wescor (model VAPRO 5520, South Logan, UT, United States) vapor pressure micro-osmometer was used and a minimum of three 10 μL samples were measured. For medium osmolarity assessments, 10 mL of the medium were vortexed prior to collecting the 10 μL samples to be measured. For callus osmolarity measurements, 1 g fresh weight of tissue was collected in 2 mL of liquid medium and centrifuged (100 g, 10 min, 10°C). The supernatant was carefully removed, the pellet was crushed in an Eppendorf with a pestle and centrifuged (1000 g, 10 min, 4°C), and this second supernatant was finally employed for measurements of osmolarity. Results from such measurements, expressed in mMkg-1, are the mean + SE of a minimum of three individual samples per treatment, and were performed at the time of sub culturing and over at least three consecutive subcultures.
Mitotic Index, Cell Viability, and Cell Morphology
For determinations of C-value stability of calli following in vitro selection for several months they were compared to leaf tissues from the original plants. Nuclei were mechanically isolated from about 0.2 g of calli or from a single leaf of M. truncatula A17 grown in green house conditions. Tissues were chopped roughly with a sharp razor in 400 μl of nuclei extraction buffer and 1.6 mL of staining buffer (Partec®; Canterbury, United Kingdom) (Ochatt, 2008). The suspension was filtered through a 20 μm nylon mesh and 4, 6 diamidino-2-phenylindole (DAPI; Sigma, Poole, United Kingdom), an A-T binding specific fluorochrome, was added to the filtrate to a final concentration of 1 μg mL-1. The DNA contents of the isolated nuclei suspension were analyzed using a Partec PAS-II flow cytometer equipped with an HBO-100 W mercury lamp and a dichroic mirror (TK420). Ten replicated calli for each treatment were analyzed, with a minimum of 3000 to 10000 nuclei per run. The mitotic index was calculated according to the formula: MI = 4 x 4C/Σ 2C + 4C, where 2C and 4C correspond to the mean integrated value of nuclei in G1 phase and G2, respectively (Ochatt, 2008).
Cell viability was estimated by dual staining with fluorescein diacetate (FDA; Sigma, Poole, United Kingdom) and propidium iodide (PI; Sigma, Poole, United Kingdom). Cell suspensions (75 μL) from each treatment were mixed with 75 μL of dual staining solution containing FDA (200 μg mL-1; Widholm, 1972) and propidium iodide (PI at 120 μg mL-1) on ice and incubated for 20 min. The FDA molecule is cleaved by the esterases in the cytoplasm into acetate and fluorescein which, being hydrophilic accumulates in the cytoplasm of metabolically active (alive) cells that, upon excitation with the UV light fluoresce yellow–green, while dead cells appear red using a fluorescent microscope. A minimum of 300 cells are counted and results are expressed as the percentage of fluorescing cells referred to the total number of cells in the field.
For the cell morphology characterization, FDA stained slides of the control and PEG-treated cells were observed under the microscope under the UV. The surface area of cells and nuclei was determined at 2, 4, and 6 months of culture, using the image acquisition programs ArchimedPlus and Histolab (Microvision, France) as reported (Ochatt et al., 2008), and a shape coefficient (Ochatt and Moessner, 2010) was applied at 6 months of culture. Briefly, this shape coefficient (SC) is calculated based on the half length of the cell along its longest (a) and shortest (b) axes, as:
For each treatment, nucleus and cell size were measured on 10 cells at 2 and 4 months of culture and at least 20 cells at 6 months of culture, and results expressed as the mean ± SE.
The SC distinguishes round from elongated shapes, since SC values close to 1.0 correspond to elongated cells while SC values close to 0.5 correspond to rounder cell shapes.
Real Time PCR
RNA was extracted and genomic DNA removed by DNase treatment (Spadafora et al., 2012; Elmaghrabi et al., 2013), and its absence verified using 18S rRNA primers (Spadafora et al., 2011). Retrotranscription was carried out using an Ambion kit (RETROscript Reverse transcription for RT-PCR; Foster City, CA, United States) and 2 μg of RNA. An ABsoluteTM QPCR SYBR Green Mix (Thermo Scientific, Waltham, MA, United States) kit was used for real time PCR. Reactions (in a total volume of 25 μL) consisted of: 5 μL cDNA (1:20 dilution), 12.5 μL ABsoluteTM QPCR SYBR Green Mix, 1.75 μL of each primer (10 μM) and 4 μL H2O. Reactions were cycled in an MJ Research OPTICON 2 (Quebec, Canada), in triplicate under the following conditions: 95°C for 10 min, 40 cycles of: 95°C for 15 s, 60°C for 30 s and 72°C for 30 s and one cycle of 72°C for 30 s. For testing primer specificity, a melting curve analysis was performed after amplification (from 60 to 98°C with an increasing heat rate of 0.5°C s-1). A relative quantification of gene expression was calculated using the 2-DDCT method (Livak and Schmittgen, 2001). Primers for the target genes: MtSOS1, MtWEE1, MtSERK1, MtP5CS, and MtCCS52 are as described in Elmaghrabi et al. (2013). Mt18S rRNA primers were used to normalize the results as it was shown previously that 18S rRNA was a reliable reference gene for stress responses in M. truncatula (Elmaghrabi et al., 2013), and widely used across a range of different species for developmental and stress-response studies (e.g., Price et al., 2008; Wagstaff et al., 2010).
Statistical Analyses
Unless otherwise stated above, data were analyzed using R software (R version 3.3.2, Foundation for Statistical Computing). One or two way (as appropriate) ANOVA tests followed by a Tukey’s test, or non-parametric statistical tests (Kruskal–Wallis followed by a Dunn’s test) were applied to determine differences across multiple samples. Comparisons between pairs of samples were performed using a Student’s t-test, or if not normally distributed using a Wilcoxon signed rank test. Regression equation and R2 value for the growth data were calculated in Excel. Details of tests applied are provided in the legend to each Figure and all original data are provided as Supplementary Files S1–S6.
Results
PEG Enhanced Callus Phenotype and Embryogenic Competence without Reducing Its Viability
There were no significant differences between M. truncatula leaf callus cultured on MANA medium or MANA medium supplemented with 10% w/v PEG6000 over the 6 months of culture, and the linear growth rates for control and PEG treatments were 0.155 and 0.168 g month-1 respectively (Figure 1). This only represents a 1.08 fold increase in the PEG compared with the control treatment indicating very similar rates of growth in each treatment irrespectively of the presence or absence of PEG in the culture medium. However, these data also suggest that callus tissues were PEG-tolerant already within 1 month of sub-culture and retained such tolerance throughout the experiment. Qualitative observations of callus indicated that those treated with PEG were typically bright green in color and exhibited clear evidence of embryogenesis as did also the controls; however, the controls were brown in color and the somatic embryos regenerated looked blocked at an early (globular to heart) developmental stage (Figures 2A,B). The typical bright green coloration of calli in the PEG treatment would tend to indicate their robustness for both growth and embryogenesis regardless of the length of time in culture, and could also be ascribed to an increased tissue photochemistry linked to the tolerance acquired by onset of a priming process by the long-term culture on PEG. This was confirmed during the cell viability assessments with fluorescein diacetate where calli grown on 10% w/v PEG for 6 months contained 81.00 + 1.5% viable cells compared to 68.00 + 5.2 for calli grown only on the MANA medium (Figures 2C,D).
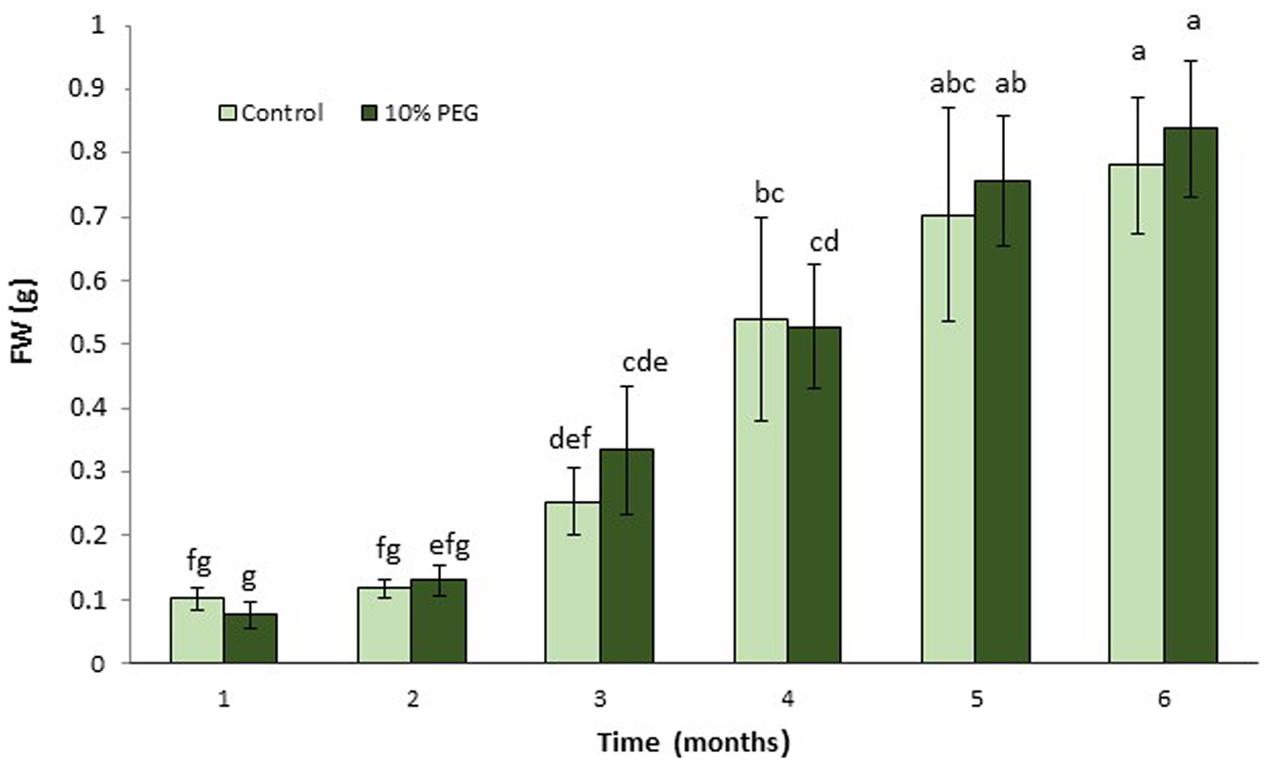
FIGURE 1. Mean (± SD) callus growth over 6 months on MANA medium with 10% w/v PEG compared with control (MANA medium). Different letter combinations indicate significant differences (P ≤ 0.05; Kruskal–Wallis followed by a Dunn’s test) (n > 8). See Supplementary File S1 for data and statistical analyses.
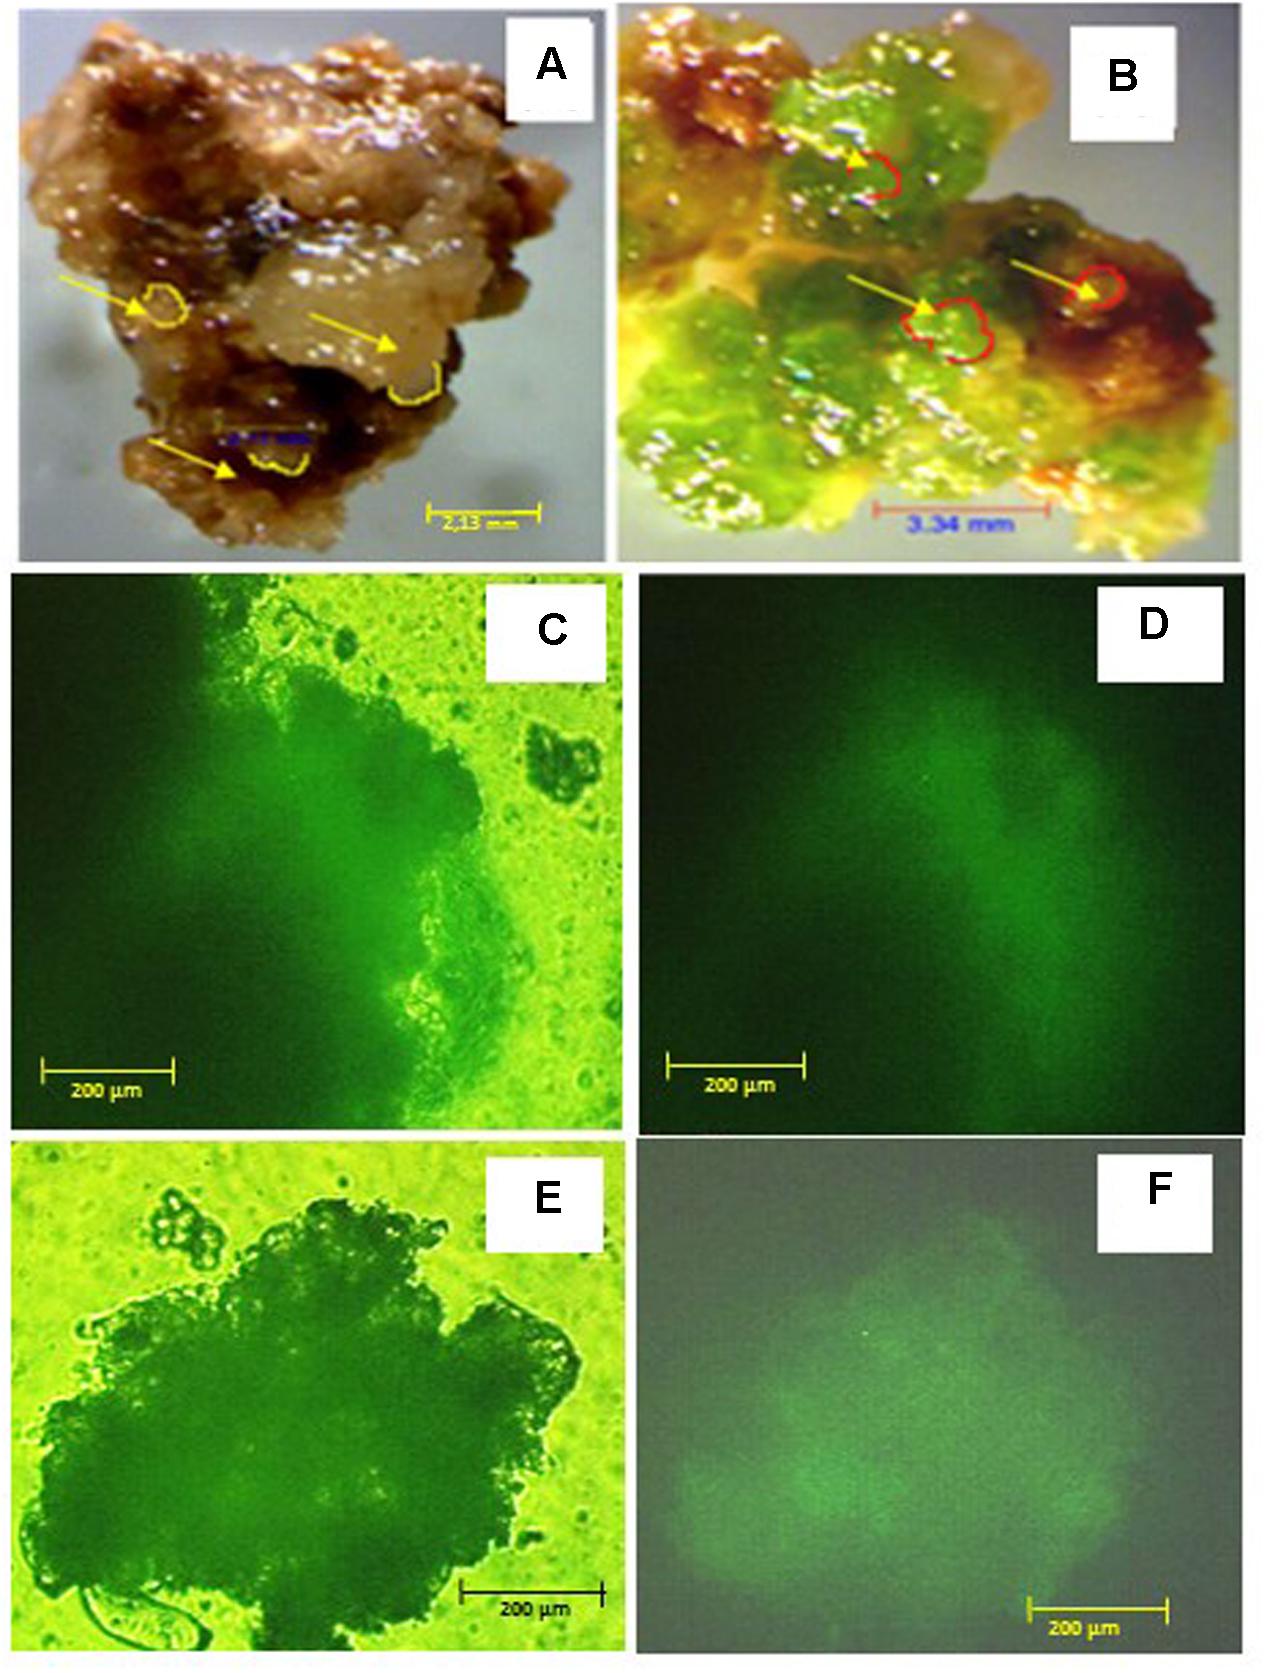
FIGURE 2. Callus phenotype and viability after 6 months on 10% w/v PEG and control media: (A) control callus; (B) PEG-selected callus, arrows indicate somatic embryos; viability of control callus after FDA staining observed under transmission (C) or UV (D) light; viability of PEG-selected callus after FDA staining observed under transmission (E) or UV (F) light. Scale bars are A = 2.13 mm, B = 3.34 mm; and C–F = 200 μm.
Mitotic Index, Cell and Nuclear Size Increase, and Cell Shape Changes in Calli Cultured on PEG-Medium
Flow cytometry (FCM) was used to compare the C value distribution of cells from greenhouse grown M. truncatula leaves and callus derived from leaf material cultured for 6 months on 10% w/v PEG6000 (Figure 3). Flow cytometry raw profiles of leaves exhibited two peaks (Figure 3A), corresponding respectively to the nuclei in G1 phase (2C DNA) and those in G2/M (4C DNA), where their analysis after fitting them to Gauss curves resulted in a distribution of nuclei into three subpopulations as follows: G1 77.39%, S 17.32% and G2/M 5.29%, and coupled with a calculated mitotic index of 1.999 (Figure 3C). A very similar profile was obtained from calli cultured on MANA medium alone (not shown) which showed no obvious deviation from the mother plant tissues from which they originated, while the flow cytometry profiles of calli cultured on PEG was very different (Figure 3B). In the 10% PEG6000 treatment, four peaks were typically detected consistent with 2, 4, 8, and 16 C populations (Figure 3B), and indicative of the occurrence of endoreduplication. The mitotic index was also significantly higher (P < 0.05) for the calli grown on PEG6000 containing medium (Figure 3C), which is also indicative of the onset of an endoreduplication phenomenon.
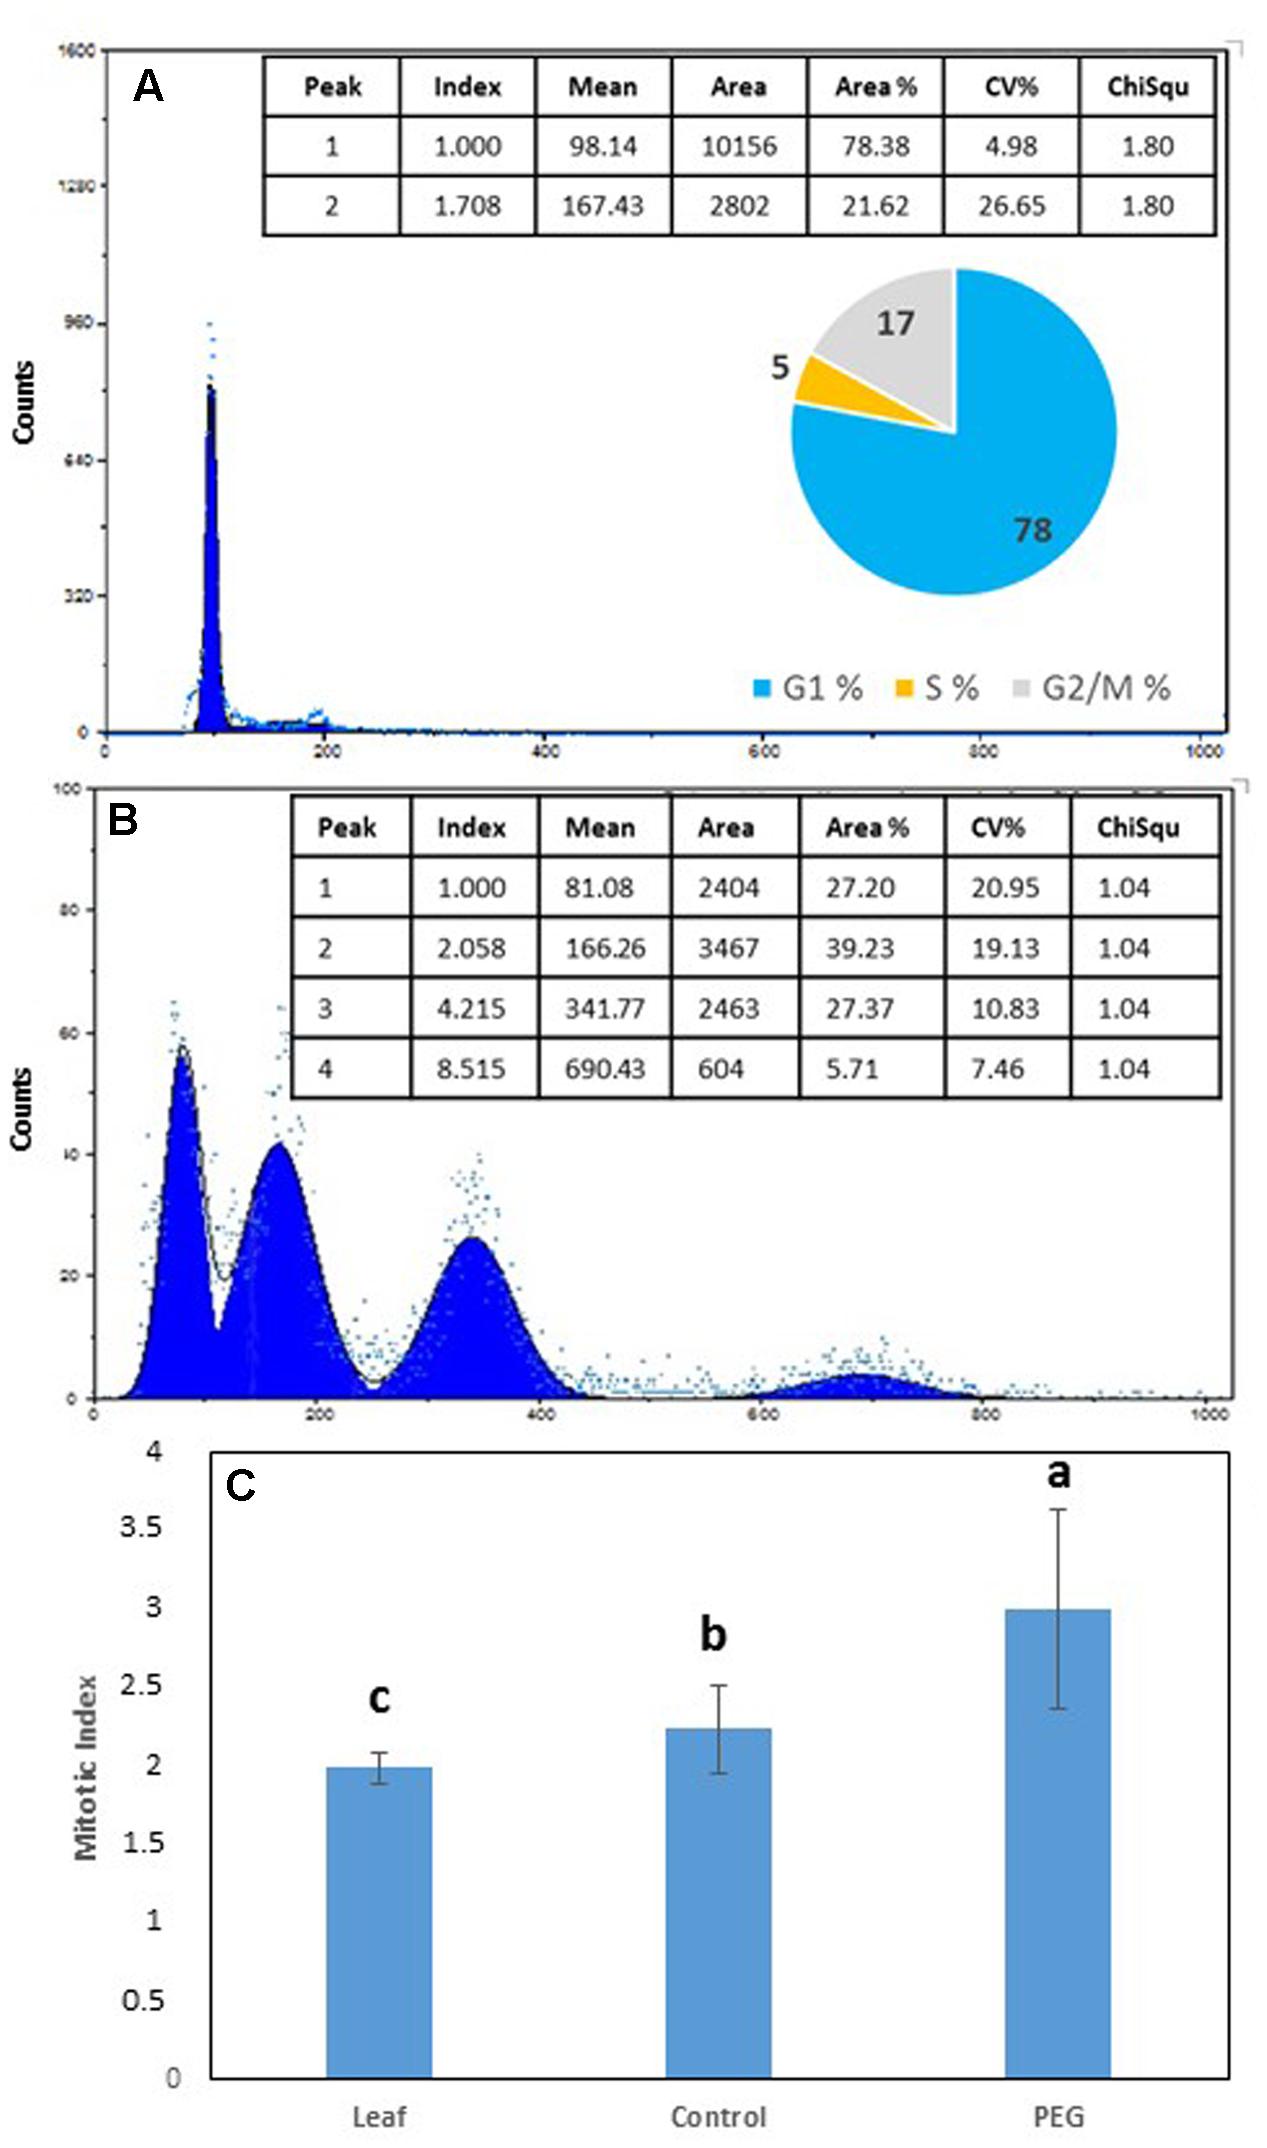
FIGURE 3. Flow cytometry (FCM) profile and % distribution of nuclei in G1 (1st peak), G2 (2nd peak), S phase (trough between 1st and 2nd peaks) and polyploid nuclei [3rd (8C) and 4th (16C) peaks] from (A) leaves of Medicago truncatula, (B) M. truncatula callus cultured on 10% w/v PEG6000 for 6 months; (C) Mean (± SD) mitotic index in leaves compared to callus tissues after 9 continuous months growth on 10% w/v PEG. Different letters indicate significant differences (P ≤ 0.05); n = 10. See Supplementary File S2 for data and statistical analyses.
Interestingly, cell size also showed a significantly higher value for cells from calli grown on PEG6000 after just 2 months of culture (Figure 4A) and nuclear area was greater on PEG after 4 months (Figure 4B). This is consistent with the occurrence of endoreduplication, and this was coupled with a modified cell shape (Figure 4C), with cells grown on PEG6000 exhibiting a significantly lower SC than control cells. Thus, PEG-grown cells were consistently and significantly (P < 0.05) rounder (SC = 0.608 ± 0.117) than control cells which were more elongated (SC = 0.833 ± 0.090) (Figure 4D).
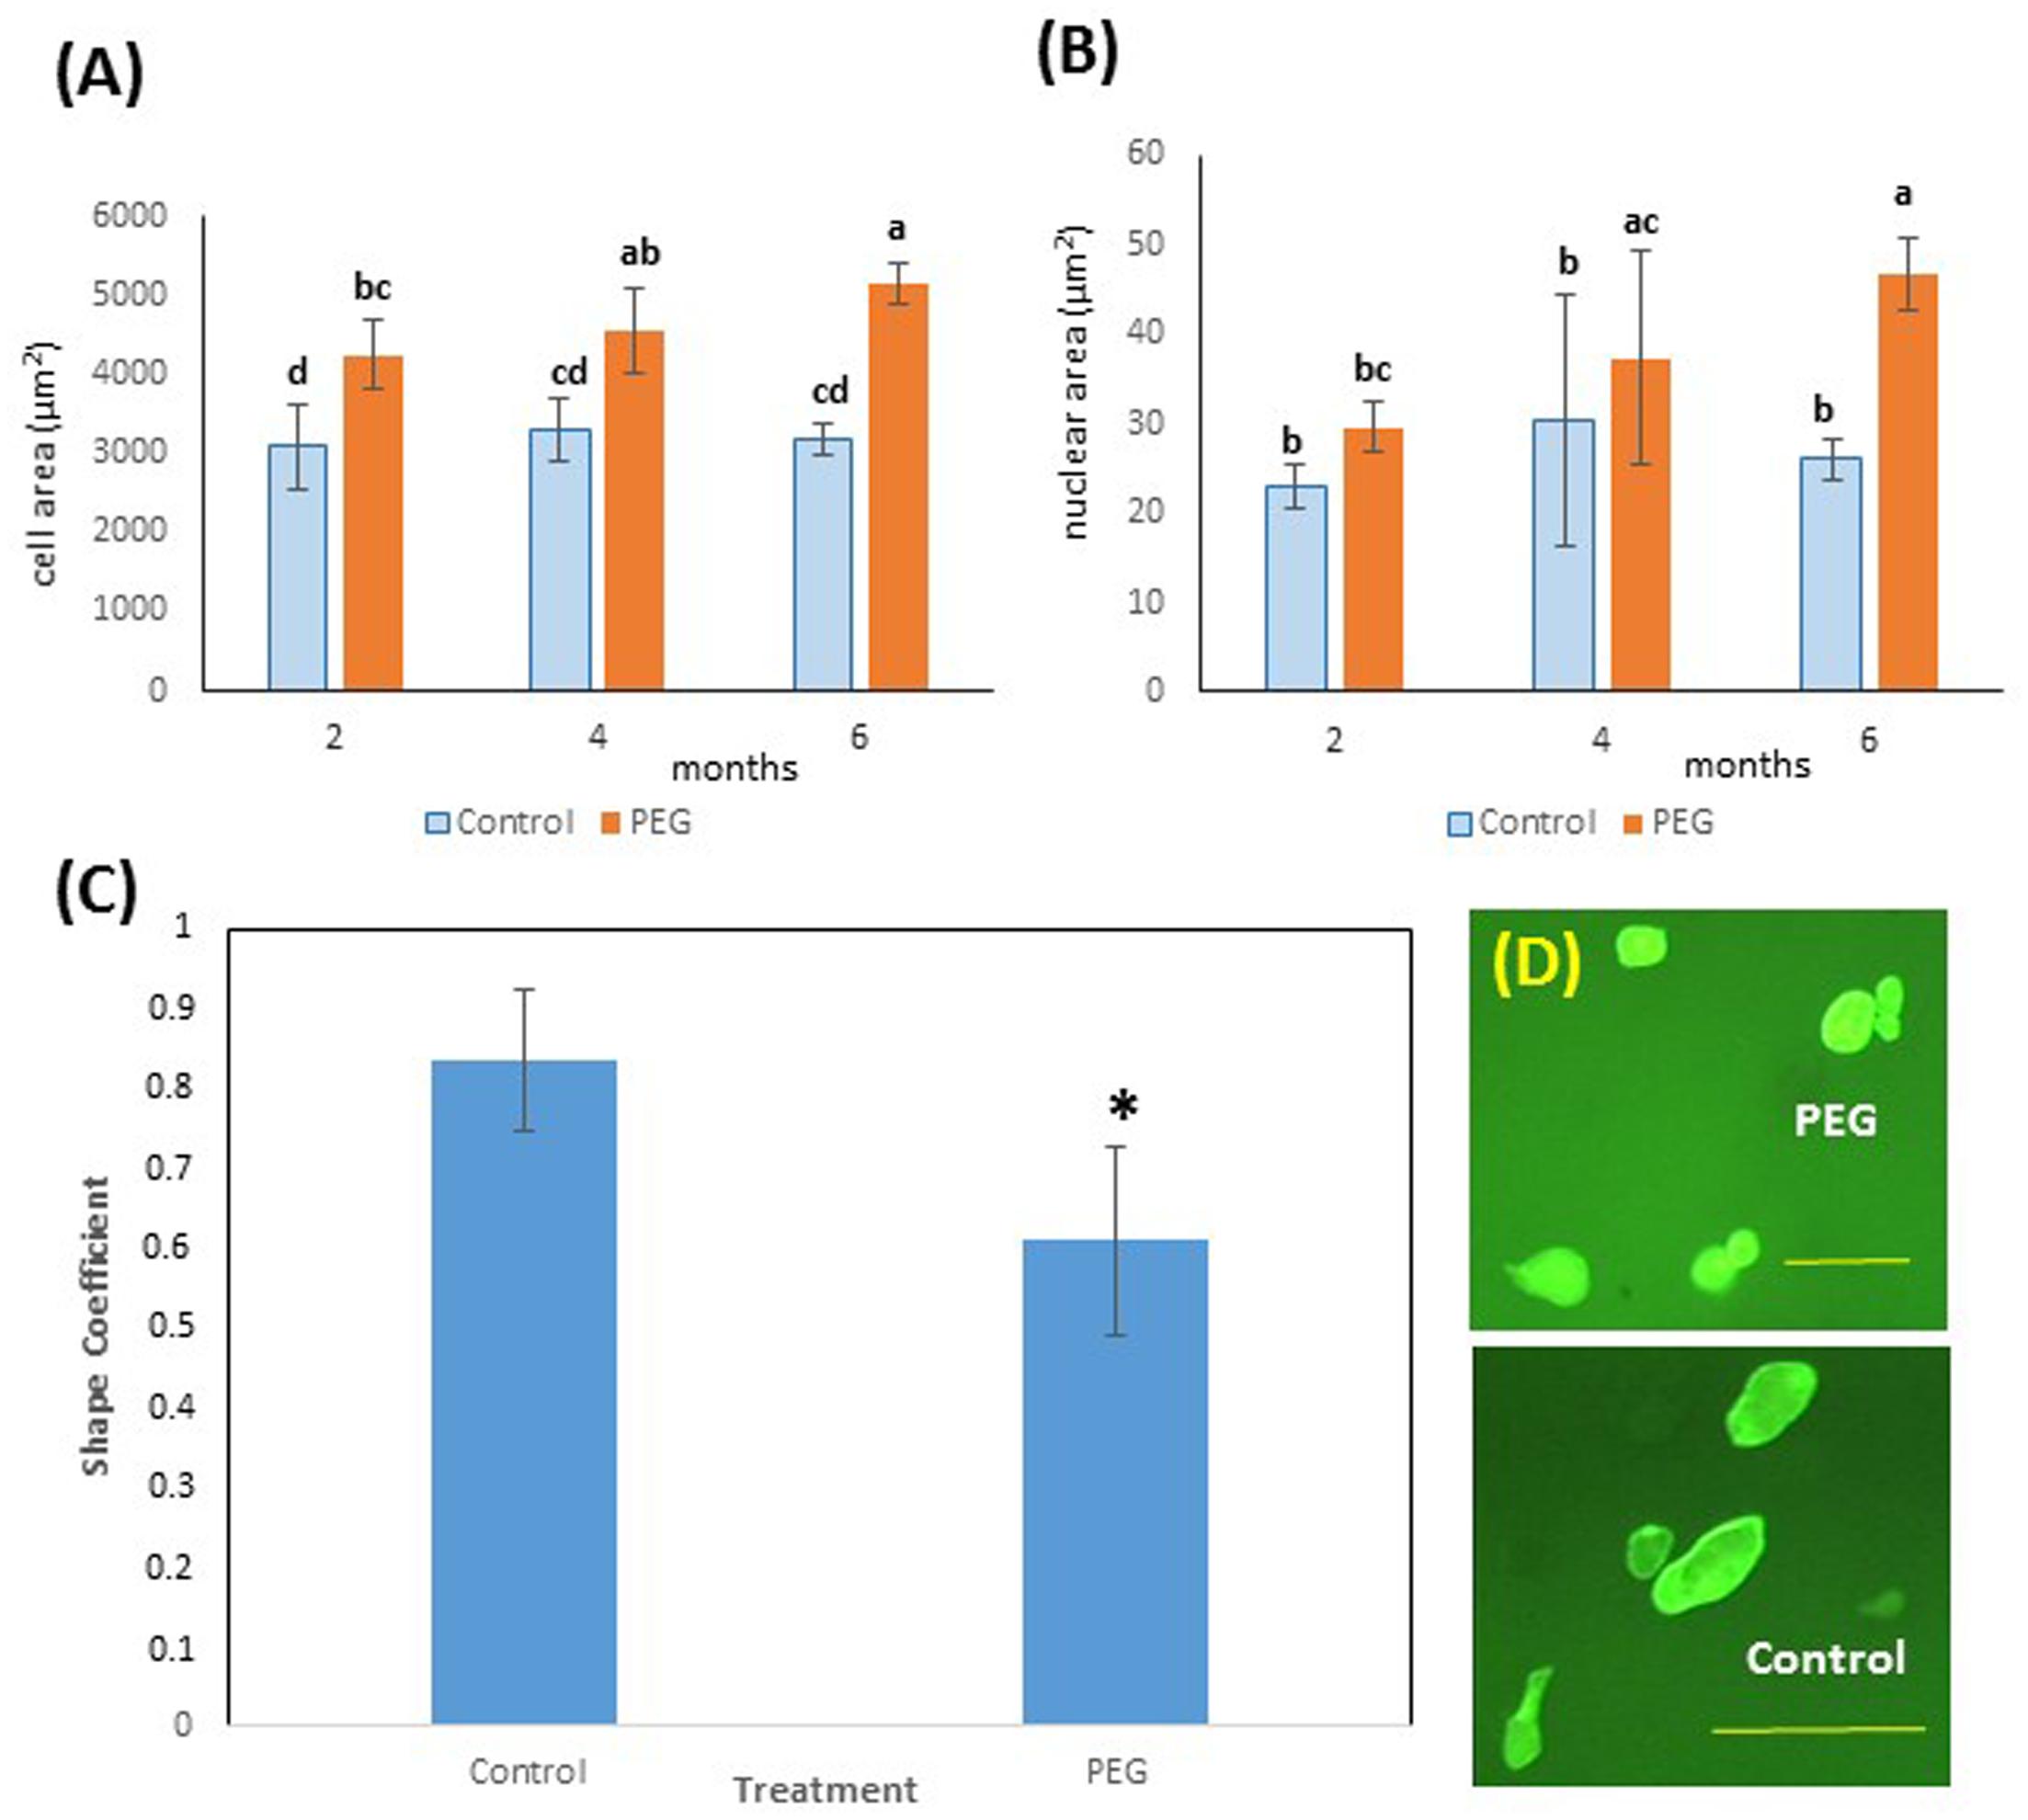
FIGURE 4. Effects of PEG6000 on cell morphology. (A) Cell and (B) nuclear size (μm2) at different time points during in vitro selection for PEG6000 (10%) resistance. Data are the means ± SD from n = 9 replicates at 2 and 4 months of culture and n = 22 measurements at 6 months of culture. Bars with different letters were significantly different (Kruskal–Wallis followed by Dunn’s test) at different time points across treatments (P < 0.05). See Supplementary File S3 for data and statistical analyses. (C) Shape coefficient (SC) of cells from control (blue) and PEG-grown (orange) calli (n = 22) at 6 months of mean ± SD (∗P < 0.05, Welch Two Sample t-test). See Supplementary File S4 for data and statistical analyses. (D) Images of cells from PEG and control cultures at 6 months of culture (scale bars PEG = 100 μm, Control 200 μm).
Osmolarity, Proline and Sugar Levels Rise following PEG Treatment
After 6 months of 10% PEG 6000 treatment, there was a significant increase in osmolarity of callus in the PEG treatment compared with the control (Figure 5A) while osmolarity of the medium remained more constant. Proline and soluble sugar levels also increased significantly compared with the control (MANA without PEG) (Figures 5B,C). However there were no significant differences in water content between the PEG and control treatments (Figure 5D).
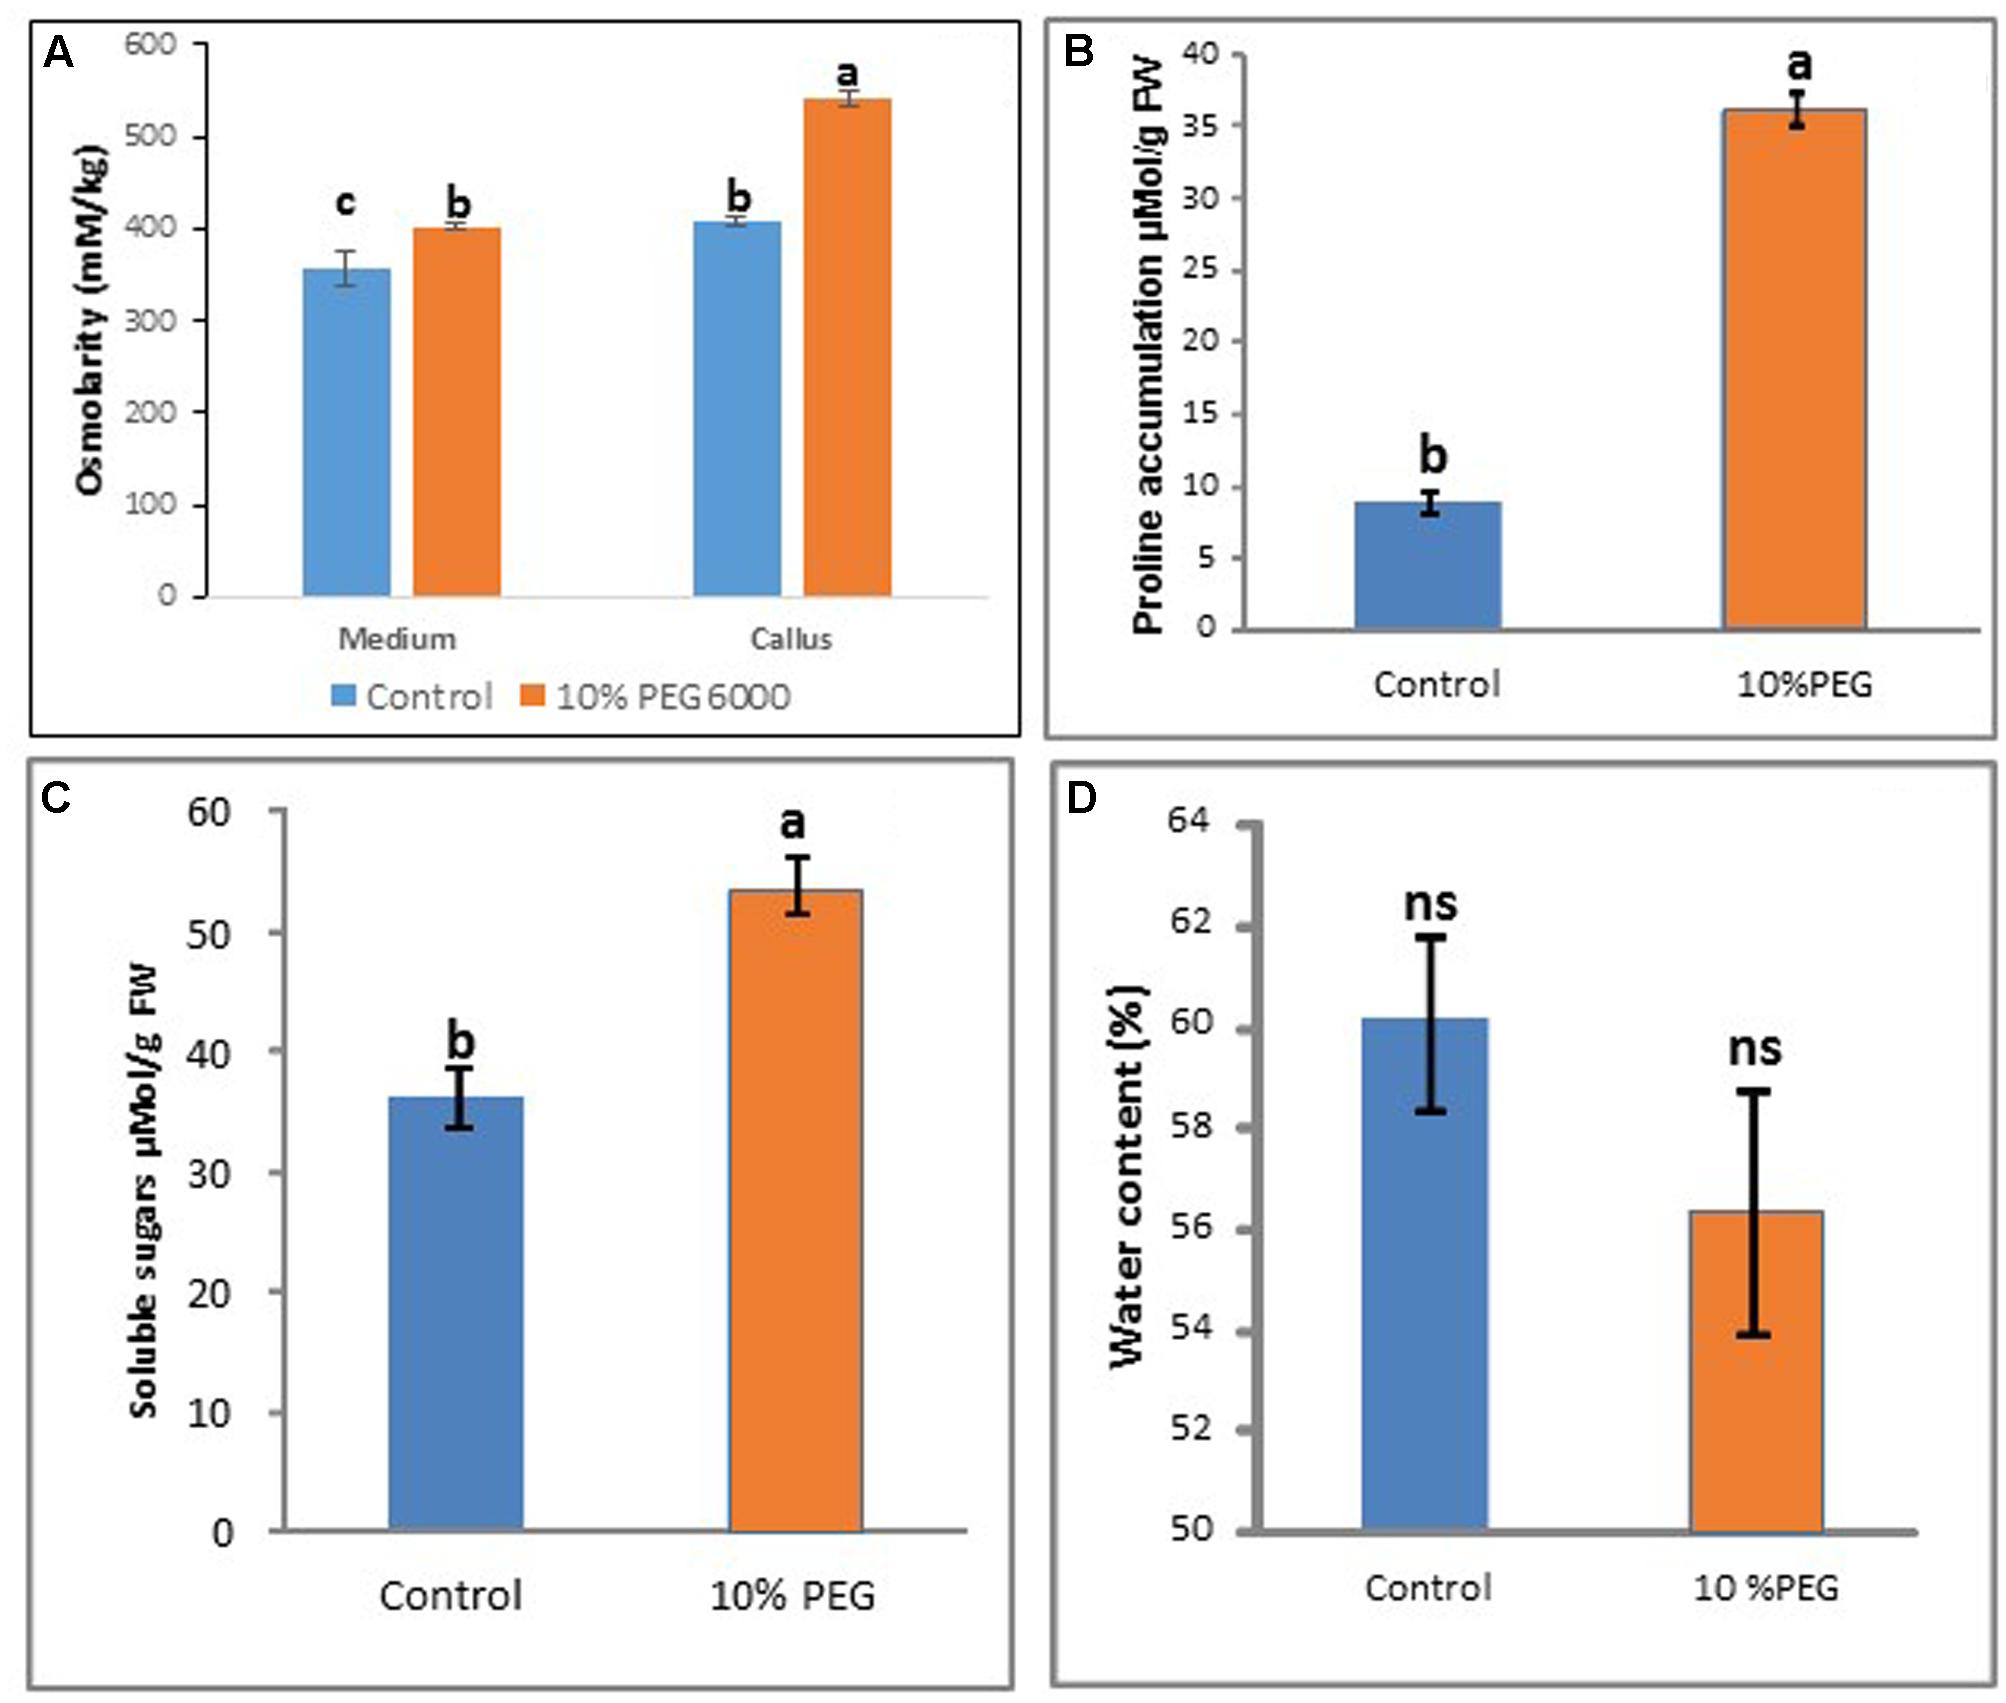
FIGURE 5. Comparisons between control and 10% PEG treatments after 6 months in vitro culture in terms of: (A) medium and callus osmolarity, (B) proline content, (C) soluble sugars, and (D) water content. Note different letters indicate significant differences (P ≤ 0.05) between treatments (n = 3 ± SD); ns, non-significant. [Kruskall–Wallis followed by Dunn’s test (A); Wilcoxon signed rank test (B); and Welch Two Sample t-test (C,D)]. See Supplementary File S5 for data and statistical analyses.
MtWEE1 Expression Is Highly Up-regulated Following PEG Treatment While MtSOS1 Is Down-Regulated
We chose to examine the expression of five genes as markers of processes related to osmotic (water) stress. These comprised MtSOS1 (salt stress response), MtWEE1 (cell cycle checkpoint), MtSERK1 (embryogenesis) MtP5CS (proline metabolism), and MtCC52 (ploidy marker) in the embryogenic calli treated with PEG. Expression of these genes was measured using quantitative real time PCR after 6 months of callus culture in PEG6000 (10%) and compared with the control treatment (0% PEG) and greenhouse grown leaves.
A highly significant reduction in the expression of MtSOS1 occurred in the 10% PEG compared with the control treatment such that MtSOS1 transcripts were virtually undetectable, comparable to expression in leaf (Figure 6A). Conversely, MtWEE1 and MtCCS52 expression was significantly higher in the PEG treated calli compared with the control treatment which in turn was higher than expression in leaf (Figures 6B,E). MtSERK, and MtP5CS were expressed significantly more in the control callus and 10% PEG treated callus but there was no significant difference in expression between the treated and untreated calli (Figures 6C,D).
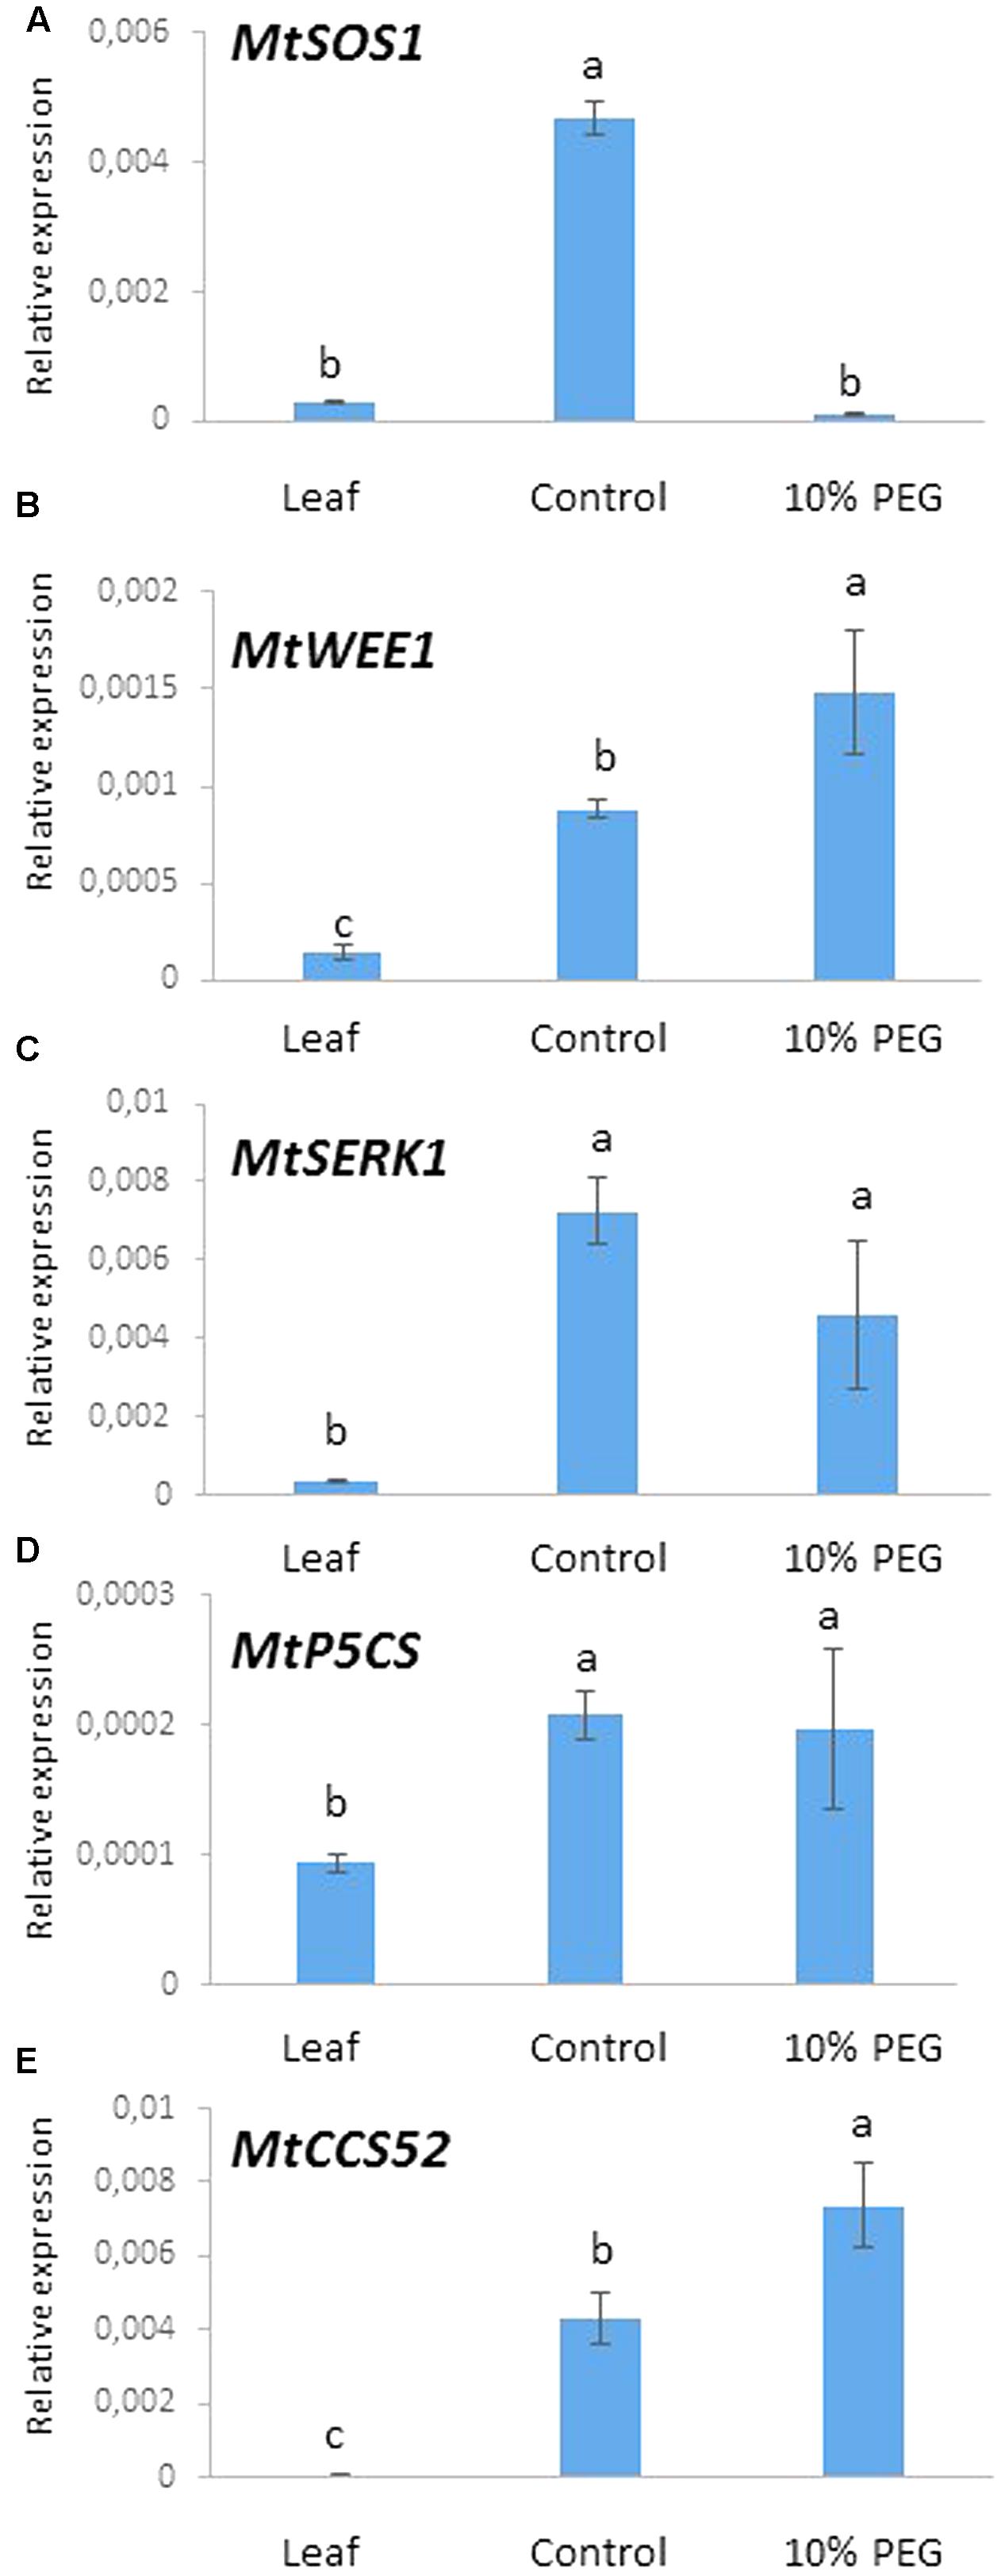
FIGURE 6. Gene expression after 6 months culture on 10% PEG medium and control (MANA medium) with leaf as reference: (A) MtSOS1, (B) MtWEE1, (C) MtSERK, (D) MtP5CS, and (E) MtCCS52. Different letters indicate significant differences amongst treatments/tissues (P ≤ 0.05; one-way ANOVA; n = 3 ± SD).
Discussion
Osmotic stress, provoked by insufficient ground and/or rain water, is a paramount constraint for plant growth and development. Cultures of callus on media that impose water deficit is a method for generating new, more tolerant, plants. Here, we have shown that long term culture of M. truncatula calli on medium containing 10% PEG6000 to impose an osmotic stress results in the production of morphologically enhanced calli. An analysis of protective metabolite levels, cellular morphology, cell division and gene expression was undertaken to understand the effects of the imposed stress.
In this work, callus growth was not significantly different plus or minus 10% PEG over a period of 6 months, suggesting that calli on PEG acquired tolerance to osmotic (water) stress (Figure 1) probably mediated by an early osmotic adjustment which was likely associated to various modifications at the cellular level (Singh et al., 2015). In fact, both cell viability and mitotic index were higher in the PEG treated cells compared to the control indicating a healthy and proliferating culture. It is likely that this sustained viability in the PEG treated cells is due to the activation of defense mechanisms that may include an activation of DNA repair as shown previously (Balestrazzi et al., 2011). The similarity in growth rates following 1 month ± PEG further stresses that tolerance was obtained relatively rapidly. This result differs from those of Biswas et al. (2002) who found that in rice, callus proliferation in the presence of PEG was greater than the controls in some genotypes, although this was at a much lower PEG concentration (5–15 g L-1). However in two genotypes of wheat, one drought tolerant, the other drought sensitive, water deficit decreased only slightly in the sensitive compared with the tolerant genotype under water conditions and, it did not change significantly in either the sensitive or tolerant genotype ± 400 mM PEG 6000 (100–400 mOsm; -0.976 MPa; Guóth et al., 2010). Likewise in chili pepper cultures, where there was very good growth after 12 months in 5–10% PEG8000 (0.57 MPa; Santos-Díaz and Ochoa-Alejo, 1994). Note that after 6 months of treatment, although osmolarity of the callus increased, osmolarity of the medium did not change since PEG is not metabolized. We decided to analyze both the medium and callus osmolarity as an indirect way of assessing the nutrient consumption from the medium by cells, which impacts their internal salt concentrations, as shown before with various species among which M. truncatula (Ochatt et al., 2008). An increased cell osmolarity appeared also to be a reliable early marker of embryogenic competence (Ochatt et al., 2008; Elmaghrabi et al., 2013). Thus the increased callus osmolarity and embryogenic capacity seen here are in line with previous observations.
In this work (Figure 4) PEG-induced stress resulted in a highly significant increase of the size of both nuclei and cells after 6 months of culture on selection medium. Remarkably, this was also coupled with a consistent and significant modification of the cell shape, reflected by the SC values observed, indicative of an increased elasticity of cell walls under PEG-induced osmotic stress. A similar modification of cell wall elasticity was observed in M. truncatula plants subjected to a severe drought stress (Nunes et al., 2008) and in transgenic M. truncatula lines expressing the trehalose-6-Phosphate Synthase 1 (AtTPS1) from Arabidopsis thaliana with altered response to water deficit and recovery (Alcântara et al., 2015). Taken together, these observations suggest a profound elastic modification of the cell walls of water stress tolerant cells, perhaps deriving form a modified ratio among cell wall fractions, and should be the object of future studies.
Similar levels of somatic embryogenesis were observed in the PEG and control calli, however, calli in the PEG treatment were distinctly green in color compared with the control. This might be consistent with more robust embryogenic callus in the PEG compared to the control treatments (Figures 1, 2), which is not surprising since MANA medium is not conductive to full maturation of the somatic embryos formed in M. truncatula (Ochatt et al., 2013; Ochatt and Revilla, 2016). It may also reflect the fact that M. truncatula is adapted to semiarid conditions and even under severe drought stress, pigment content is not affected (Biswal, 1997; Nunes et al., 2008). PEG also improved somatic embryogenesis in other species (Attree et al., 1995; Igasaki et al., 2003). Both control and PEG treatments resulted in similar levels of somatic embryogenesis, which was consistent with the similar expression levels of MtSERK in the two treatments. Note that SERK1 is highly expressed during embryo induction and early somatic embryo development in M. truncatula (Nolan et al., 2009) and in Araucaria angustifolia (Steiner et al., 2012). The possible stimulation of somatic embryogenesis in response to PEG treatment is consistent with other reports showing stress-induction of this process (Karami and Saidi, 2010), which in M. truncatula may be linked to increases in ABA (Nolan and Rose, 1998).
The physiological, metabolic and gene expression responses of calli to PEG-induced osmotic stress mirrored those found under salt stress treatments (Elmaghrabi et al., 2013) in some respects but not in others, as summarized in Figure 7. In contrast to NaCl treatment, PEG treatment did not result in any increase in water content of the calli compared with the control although osmolarity did increase. This could be explained by the differential modes of action between NaCl and PEG, as the high MW of PEG exerts a constant osmotic pressure but does not allow its entry across the wall and hence avoids cell plasmolysis which results in different energy costs and different effects on growth (Munns, 2002). However, soluble sugars did increase suggesting they are a useful marker of both salt and water (osmotic) stress (Figure 5). PEG also induced a high level of proline accumulation, which was far higher than the largest proline accumulation under stress induced by NaCl (Elmaghrabi et al., 2013), indicating that this might also be a component of osmotic stress tolerance in M. truncatula (Figure 5B), as has been found in other species (Deinlein et al., 2014). Validating this hypothesis would require field trials with regenerants from these cultures and goes beyond the scope of this study. However, the expression of MtP5CS in callus grown on PEG was similar to the control (Figure 6D) and hence does not correlate with increased levels of proline in the PEG treatment. This was surprising given that this gene encodes an enzyme that is central to proline synthesis and that its expression in M. truncatula cultures exposed to salt stress was elevated (Elmaghrabi et al., 2013; Figure 7). It may suggest that this enzyme is not a key regulatory step in proline biosynthesis under these conditions, or that an initial rise in MtP5CS expression early in the culture period was sufficient to elevate proline concentrations and that after 6 months culture, increased gene expression was no longer necessary. In other words, whether modifying proline metabolism and the expression of genes involved in it, such as P5CS, may or not be used for engineering drought tolerance, and which approach should be adopted for such modification to be done remains uncertain (Bhaskara et al., 2015).
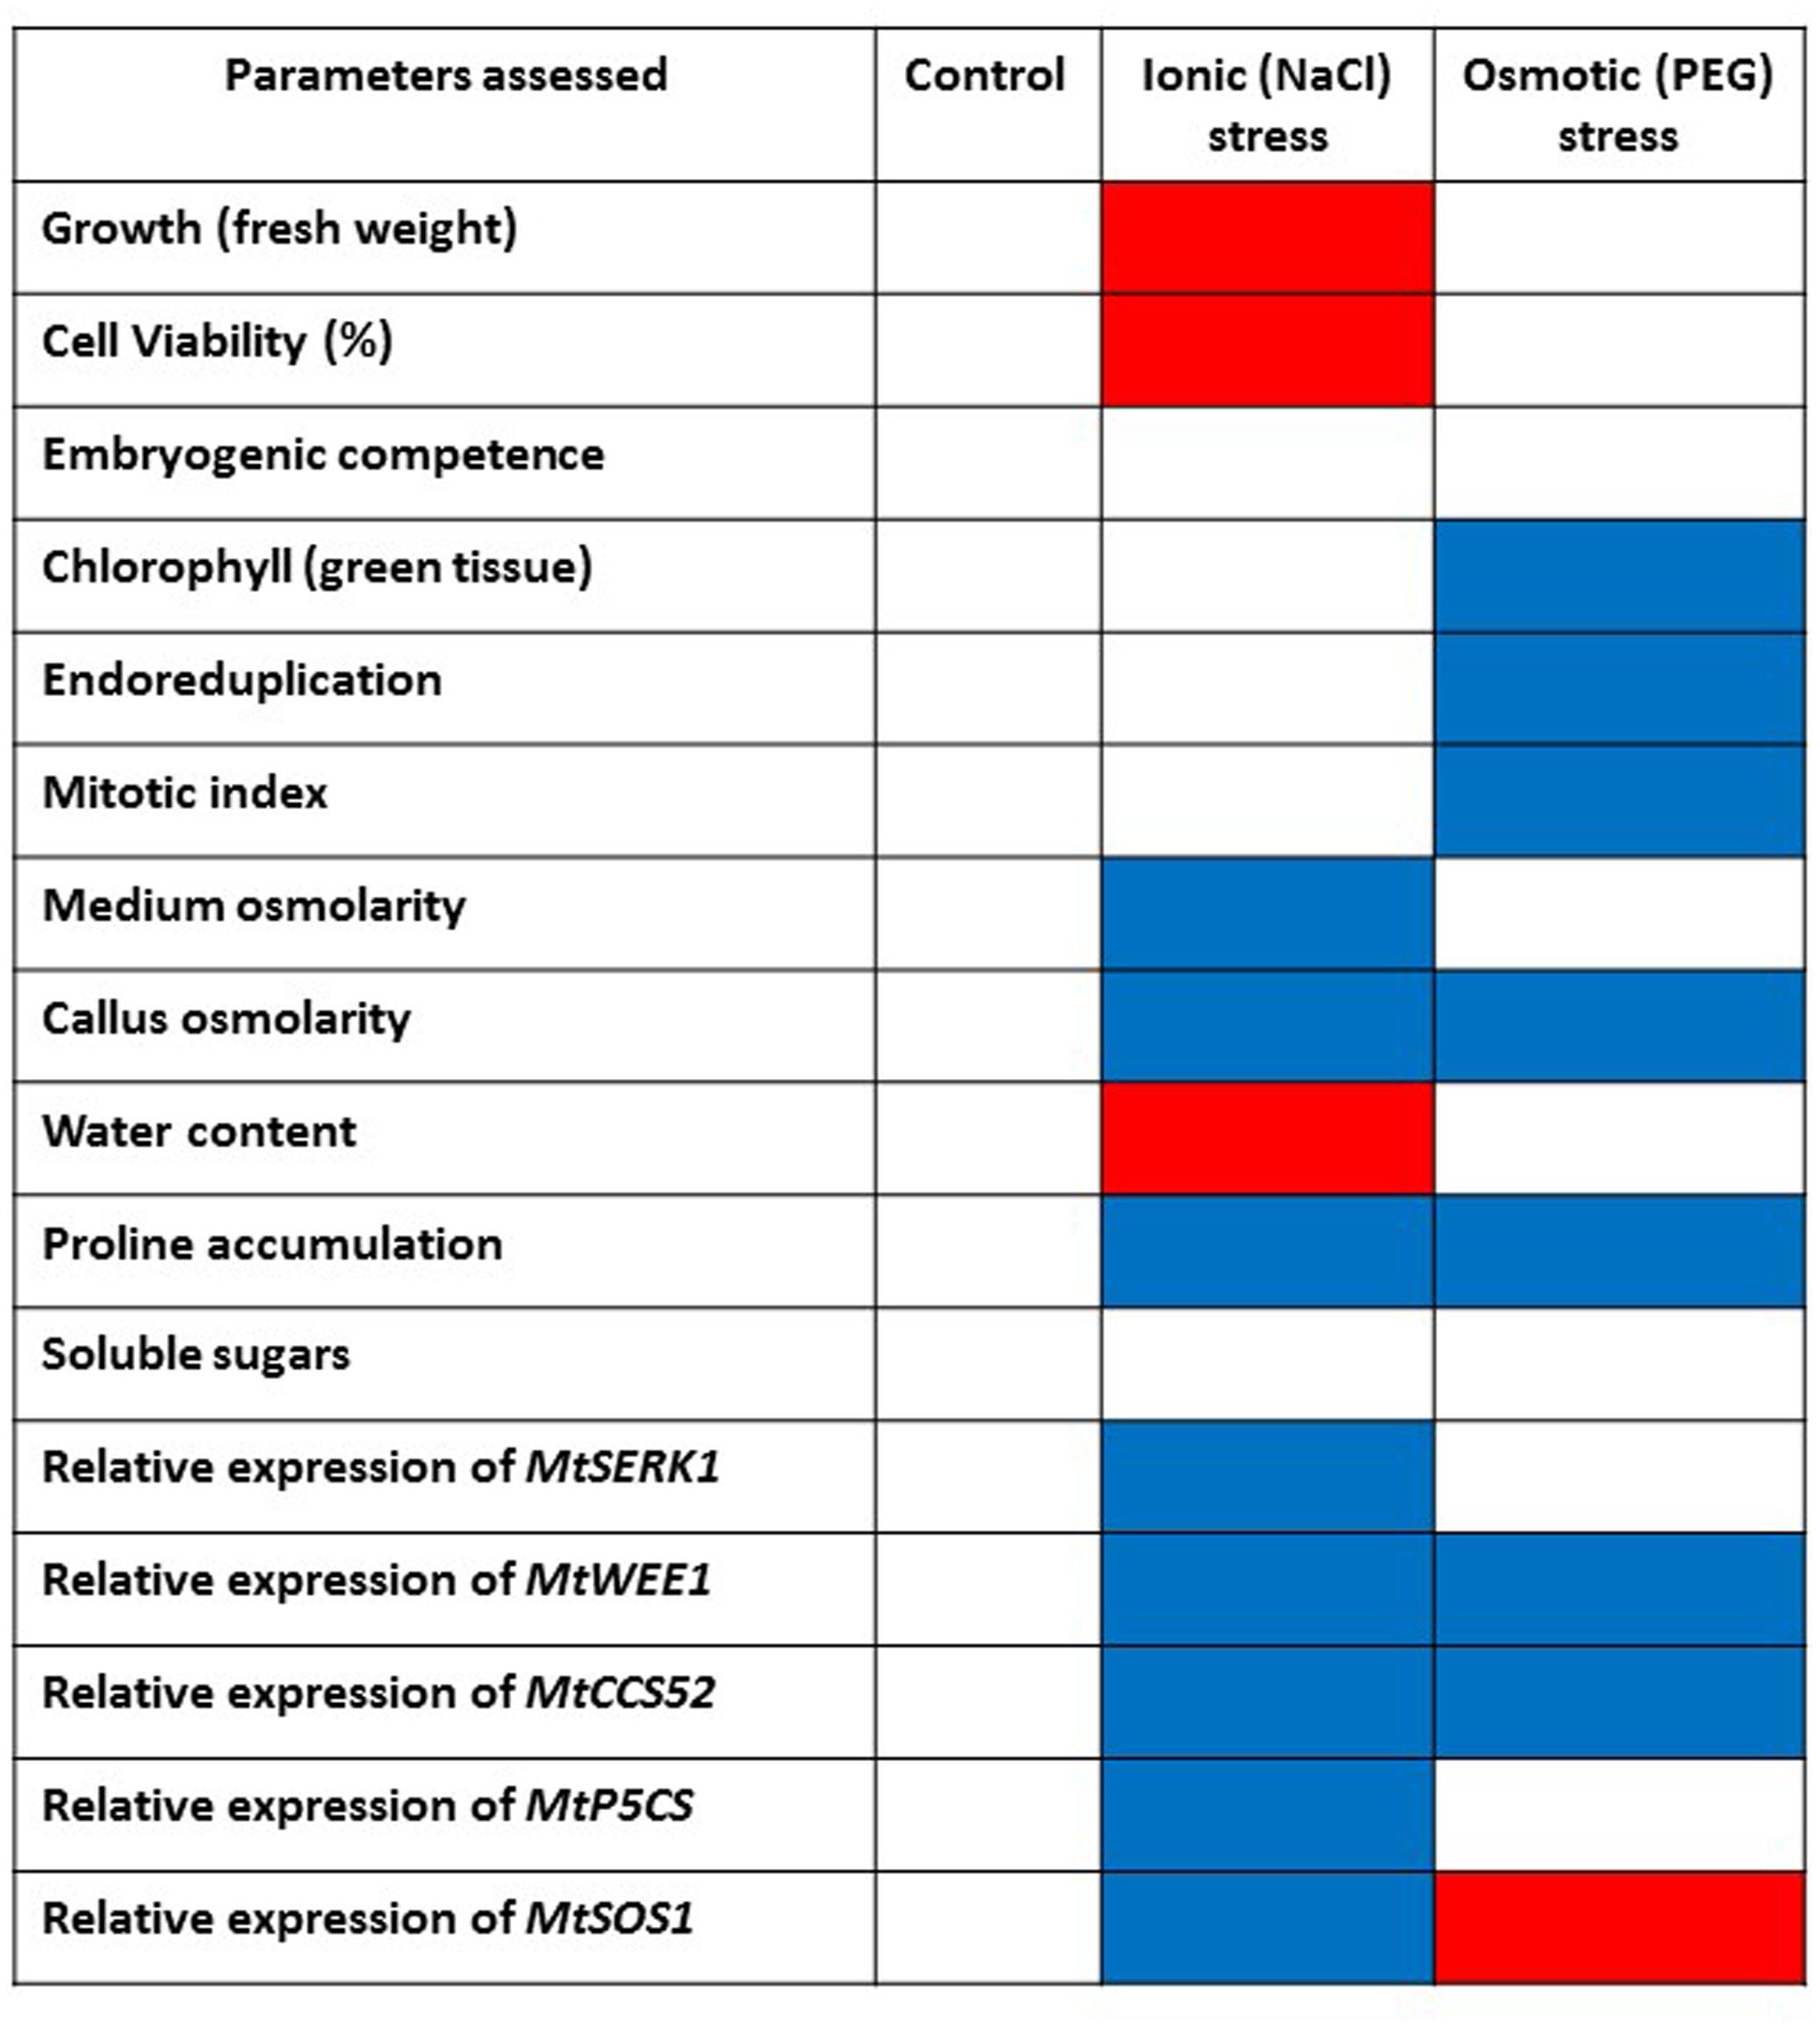
FIGURE 7. Summarized effects on various parameters of imposing abiotic stress on embryogenic callus of M. truncatula following in vitro selection. Control callus tissues are compared with NaCl-tolerant callus (Elmaghrabi et al., 2013) and PEG-induced osmotic stress tolerant callus tissues in this study. Blue color indicates increase/upregulation. Red color indicates decrease/downregulation. When non-significant compared to controls white is used.
More predictably, PEG did not induce MtSOS1 expression which was down-regulated compared with the control. This gene is highly expressed in salt stress conditions as it encodes a protein that functions as a membrane-bound Na+ antiporter and contributes to Na+ depletion in the cytoplasm (Smith et al., 2010; Feki et al., 2011). Therefore the PEG data indicate a different (non-ionic) pathway leading to osmotic stress tolerance compared with NaCl (ionic) tolerance (Figure 7) as reported by Elmaghrabi et al. (2013).
The expression of MtCCS52 was upregulated by the PEG treatment (Figure 6E). In Arabidopsis this gene is a regulator of ploidy level and its expression is positively correlated to endoreduplication. In M. truncatula cultures exposed to long-term NaCl treatments this gene was up-regulated (Figure 7), alongside an increase in endoreduplication (Elmaghrabi et al., 2013). Given the clear evidence for endoreduplication in the osmotic stress-resistant cultures here (Figure 3), the upregulation of MtCCS52is consistent with its role in Arabidopsis (Vanstraelen et al., 2009).
That MtWEE1 expression was more highly expressed in the PEG treatment suggests that this gene may have a role in maintaining normal growth in a treatment that mimics osmotic stress conditions. WEE1 kinase might be necessary to regulate normal cell size in the face of ion toxicity and osmotic (non-ionic) water stress although this could only be resolved by exposing calli from M. truncatula wee1 knockouts to these treatments. Alternatively, as a gene that is expressed in the DNA damage and DNA replication checkpoints, it may be induced in response to either single strand or double strand DNA breaks as it is in Arabidopsis (De Schutter et al., 2007). However, Gonzalez et al. (2004) observed high expression of LeWEE1 in tomato (Lycopersicon esculentum Mill.) which was correlated with endoreduplication during fruit development. Our results do not seem to indicate that there has been irreversible DNA damage due to the osmotic stress imposed on callus, and it would therefore be legitimate to link this to WEE1 expression and its role in replication checkpoint and DNA damage and the possibility that the PEG concentration used and the long-term culture on it resulted in priming (Singh et al., 2015). Other genes could also be involved in the process though, and, in this respect, in order to protect their gene integrity from DNA damage plants are capable of activating a specific response system that regulates the cell cycle, but also DNA repair and programmed cell death where genes such as Suppressor Of Gamma response 1 (SOG1) (Yoshiyama et al., 2014) and Breast Cancer 1 (BRCA1) (Block-Schmidt et al., 2011) are known to play a central role in DNA repair, chromosome segregation and chromatin remodeling So the increase in MtWEE1 seen here may be both linked to the increase in endoreduplication and required to protect the cells from DNA damage induced by the PEG-induced osmotic stress treatment.
Conclusion
The data reported in this study of responses to 10% PEG compared with no PEG controls indicates that at this level of osmotic stress it is possible to induce a high level of embryogenesis with no penalty on growth rate. This appears to be achieved by up-regulating protective mechanisms such as the production of osmoprotectant solutes and switching on the expression of MtWEE1. The increase in MtWEE1 and MtCCS52 expression may cause an increase in endoreduplication while protecting the cells against the potentially damaging effects of the osmotic stress on DNA integrity.
Author Contributions
HR, DF, and SO designed the project and the experiments. AE performed the experiments. All authors analyzed the data, read and approved the manuscript.
Conflict of Interest Statement
The authors declare that the research was conducted in the absence of any commercial or financial relationships that could be construed as a potential conflict of interest.
Acknowledgment
AE thanks the Libyan Government for financial support, and the authors thank Mike O’Reilly for assistance with analytical work.
Supplementary Material
The Supplementary Material for this article can be found online at: http://journal.frontiersin.org/article/10.3389/fpls.2017.01479/full#supplementary-material
References
Alcântara, A., Morgado, R. S., Silvestre, S., Marques da Silva, J., Bernardes da Silva, A., Fevereiro, P., et al. (2015). A method to identify early-stage transgenic Medicago truncatula with improved physiological response to water deficit. Plant Cell Tissue Organ Cult. 122, 605–616. doi: 10.1007/s11240-015-0793-4
Araújo, S. S., Beebe, S., Crespi, M., Delbreil, B., González, E. M., Gruber, V., et al. (2015). Abiotic stress responses in legumes: strategies used to cope with environmental challenges. Crit. Rev. Plant Sci. 34, 237–280. doi: 10.1080/07352689.2014.898450
Attree, S. M., Pomeroy, M. K., and Fowke, L. C. (1995). Development of white spruce (Picea glauca (Moench.) Voss) somatic embryos during culture with abscisic acid and osmoticum, and their tolerance to drying and frozen storage. J. Exp. Bot. 46, 433–439. doi: 10.1093/jxb/46.4.433
Badri, M., Chardon, F., Huguet, T., and Aouani, M. E. (2011). Quantitative trait loci associated with drought tolerance in the model legume Medicago truncatula. Euphytica 181, 415–428. doi: 10.1007/s10681-011-0473-3
Balestrazzi, A., Confalonieri, M., Macovei, A., and Carbonera, D. (2011). Seed imbibition in Medicago truncatula Gaertn.: expression profiles of DNA repair genes in relation to PEG-mediated stress. J. Plant Physiol. 168, 706–713. doi: 10.1016/j.jplph.2010.10.008
Bhaskara, G. B., Yang, T.-H., and Verslues, P. E. (2015). Dynamic proline metabolism: importance and regulation in water limited environments. Front. Plant Sci. 6:484. doi: 10.3389/fpls.2015.00484
Biswal, B. (1997). “Chloroplast metabolism during leaf greening and degreening,” in Handbook of Photosynthesis, ed. M. Pessarakli (New York, NY: Marcel Dekker), 72–81.
Biswas, J., Chowdhury, B., Bhattacharya, A., and Mandal, A. B. (2002). In vitro screening for increased drought tolerance in rice. In Vitro Cell Dev. Biol. Plant 38, 525–530. doi: 10.1079/IVP2002342
Block-Schmidt, A. S., Dukowic-Schulze, S., Wanieck, K., Reidt, W., and Puchta, H. (2011). BRCC36A is epistatic to BRCA1 in DNA crosslink repair and homologous recombination in Arabidopsis thaliana. Nucleic Acids Res. 39, 146–154. doi: 10.1093/nar/gkq722
Boukel, M., and Houassine, D. (1997). Adaptation au Stress Hydrique de Quelques Variétés de blé dur (Triticum durum). Thèse magistere, I.N.A Alger, Algérie.
Boyer, J. S. (1982). Plant productivity and environment. Science 218, 443–448. doi: 10.1126/science.218.4571.443
Cabuslay, S. G., Ito, O., and Alejar, A. A. (2002). Physiolgical evaluation of responses of rice (Oryza sativa L.) to water deficit. Plant Sci. 163, 815–827. doi: 10.1016/S0168-9452(02)00217-0
Chen, J.-B., Wang, S.-M., Jing, R.-L., and Mao, X.-G. (2009). Cloning the PvP5CS gene from common bean (Phaseolus vulgaris) and its expression patterns under abiotic stresses. J. Plant Physiol. 166, 12–19. doi: 10.1016/j.jplph.2008.02.010
Choudhary, N. L., Sairam, R. K., and Tyagi, A. (2005). Expression of Δ1-pyrroline -5 carboxylate synthetase gene during drought in rice (Oryza sativa L.). Indian J. Biotech. Biophys. 42, 366–370.
Costa França, M. G., Thi, A. T. P., Pimentel, C., Rossiello, R. O. P., Zuily-Fodil, Y., and Laffray, D. (2000). Differences in growth and water relations among Phaseolus vulgaris cultivars in response to induced drought stress. Environ. Exp. Bot. 43, 227–237. doi: 10.1016/S0098-8472(99)00060-X
Cushman, J. C., and Bohnert, H. J. (2000). Genomic approaches to plant stress tolerance. Curr. Opin. Plant Biol. 3, 117–124. doi: 10.1016/S1369-5266(99)00052-7
De Schutter, K., Joubes, J., Cools, T., Verkest, A., Corellou, F., Babiychuk, E., et al. (2007). Arabidopsis WEE1 kinase controls cell cycle arrest in response to activation of the DNA integrity checkpoint. Plant Cell 19, 211–225. doi: 10.1105/tpc.106.045047
Deinlein, U., Stephan, A. B., Horie, T., Luo, W., Xu, G., and Schroeder, J. I. (2014). Plant salt-tolerance mechanisms. Trends Plant Sci. 19, 371–379. doi: 10.1016/j.tplants.2014.02.001
Duque, A. S., López-Gómez, M., Kráèmarová, J., Gomes, C. N., Araújo, S. S., Lluch, C., et al. (2016). Genetic engineering of polyamine metabolism changes Medicago truncatula responses to water deficit. Plant Cell Tissue Organ Cult. 127, 681–690. doi: 10.1007/s11240-016-1107-1
Elmaghrabi, A. M., and Ochatt, S. J. (2006). Isoenzymes and flow cytometry for the assessment of true-to-typeness of calluses and cell suspensions of barrel medic prior to regeneration. Plant Cell Tissue Organ Cult. 85, 31–43. doi: 10.1007/s11240-005-9046-2
Elmaghrabi, A. M., Ochatt, S. J., Rogers, H., and Francis, D. (2013). Enhanced tolerance to salinity following cellular acclimation to increasing NaCl levels in Medicago truncatula. Plant Cell Tissue Organ Cult. 114, 61–70. doi: 10.1007/s11240-013-0306-2
Feki, K., Quintero, F. J., Pardo, J. M., and Masmoudi, K. (2011). Regulation of durum wheat Na+/H+ exchanger TdSOS1by phosphorylation. Plant Mol. Biol. 76, 545–556. doi: 10.1007/s11103-011-9787-8
Fulda, S., Mikkat, S., Stegmann, H., and Horn, R. (2011). Physiology and proteomics of drought stress acclimation in sunflower (Helianthus annuus L.). Plant Biol. 13, 632–642. doi: 10.1111/j.1438-8677.2010.00426.x
Galvez, L., Gonzalez, E. M., and Arrese-Igor, C. (2005). Evidence for carbon flux shortage and strong carbon/nitrogen interaction in pea nodules at early stages of water stress. J. Exp. Bot. 56, 2551–2561. doi: 10.1093/jxb/eri249
Gill, S. S., and Tuteja, N. (2010). Reactive oxygen species and antioxidant machinery in abiotic stress tolerance in crop plants. Plant Physiol. Biochem. 48, 909–930. doi: 10.1016/j.plaphy.2010.08.016
Golldack, D., Li, C., Mohan, H., and Probst, N. (2014). Tolerance to drought and salt stress in plants: unraveling the signaling networks. Front. Plant Sci. 5:151. doi: 10.3389/fpls.2014.00151
Gonzalez, E. M., Aparicio-Tejo, P. M., Gondon, A. J., Minchin, F. R., Royuela, M., and Arrese-Igor, C. (1998). Water-deficit effects on carbon and nitrogen metabolism of pea nodules. J. Exp. Bot. 49, 1705–1714. doi: 10.1093/jxb/49.327.1705
Gonzalez, E. M., Cordon, A. J., James, C. L., and Arrese-Igor, C. (1995). The role of sucrose synthase in the response of soybean nodules to drought. J. Exp. Bot. 46, 1515–1523. doi: 10.1093/jxb/46.10.1515
Gonzalez, N., Hernould, M., Delmas, F., Gevaudant, F., Duffe, P., Causse, M., et al. (2004). Molecular characterization of WEE1 gene homologue in tomato (Lycopersicon esculentum Mill). Plant Mol. Biol. 56, 849–861. doi: 10.1007/s11103-004-5110-2
Goodstein, D. M., Shu, S., Howson, R., Neupane, R., Hayes, R. D., Fazo, J., et al. (2012). Phytozome: a comparative platform for green plant genomics. Nucleic Acids Res. 40, D1178–D1186. doi: 10.1093/nar/gkr944
Guóth, A., Benyo, D., Csiszar, J., Galle, A., Horvath, F., Cseuz, L., et al. (2010). Relationship between osmotic stress-induced abscisic acid accumulation, biomass production and plant growth in drought-tolerant and -sensitive wheat cultivars. Acta Physiol. Plant. 32, 719–727. doi: 10.1007/s11738-009-0453-6
Igasaki, T., Sato, T., Akashi, N., Mohri, T., Maruyama, E., Kinoshita, I., et al. (2003). Somatic embryogenesis and plant regeneration from immature zygotic embryos of Cryptomeria japonica D. Don. Plant Cell Rep. 22, 239–243. doi: 10.1007/s00299-003-0687-5
Jacob, C., Carrasco, B., and Schwember, A. R. (2016). Advances in breeding and biotechnology of legume crops. Plant Cell Tissue Organ Cult. 127, 561–584. doi: 10.1007/s11240-016-1106-2
Karami, O., and Saidi, A. (2010). The molecular basis for stress-induced acquisition of somatic embryogenesis. Mol. Biol. Rep. 37, 2493–2507. doi: 10.1007/s11033-009-9764-3
Kohler, J., Hernández, J. A., Carabaca, F., and Roldán, A. (2008). Plant growth promoting rhizobacteria and arbuscular mycorrhizal fungi modify alleviation biochemical mechanism in water stressed plants. Funct Plant Biol. 35, 141–151. doi: 10.1071/FP07218
Livak, K. J., and Schmittgen, T. D. (2001). Analysis of relative gene expression data using real-time quantitative PCR and the 2-DDC method. Methods 25, 402–408. doi: 10.1006/meth.2001.1262
Lu, Z., and Neumann, P. M. (1998). Water-stressed maize, barley and rice seedlings show species diversity in mechanisms of leaf growth inhibition. J. Exp. Bot. 49, 1945–1952. doi: 10.1093/jxb/49.329.1945
Macovei, A., Balestrazzi, A., Confalonieri, M., and Carbonera, D. (2010). The Tyrosyl-DNA phosphodiesterase gene family in Medicago truncatula Gaertn.: bioinformatic investigation and expression profiles in response to copper- and PEG-mediated stress. Planta 232, 393–407. doi: 10.1007/s00425-010-1179-9
Mahmood, I., Razzaq, A., Hafiz, A. I., Kaleem, S., Khan, A. A., Qayyum, A., et al. (2012). Interaction of callus selection media and stress duration for in vitro selection of drought tolerant callus of wheat. Afr. J. Biotechnol. 11, 4000–4006. doi: 10.5897/AJB11.2610
Michel, B. E., and Kaufmann, M. R. (1973). The osmotic potential of polyethylene glycol 6000. Plant Physiol. 51, 914–916. doi: 10.1104/pp.51.5.914
Motan, J. F., Becana, M., Iturbeormaetxe, I., Frechilla, S., Klucas, R. V., and Aparicio Tejo, P. (1994). Drought induces oxidative stress in pea plants. Planta 194, 346–352. doi: 10.1007/BF00197534
Munns, R. (2002). Comparative physiology of salt and water stress. Plant Cell Environ. 25, 239–250. doi: 10.1046/j.0016-8025.2001.00808.x
Murashige, T., and Skoog, F. (1962). A revised medium for rapid growth and bioassays with tobacco tissue cultures. Physiol. Plant. 15, 473–497. doi: 10.1111/j.1399-3054.1962
Naya, L., Ladrera, R., Ramos, J., Gonzalez, E. M., Arrese-Igor, C., Minchin, F. R., et al. (2007). the response of carbon metabolism and antioxidant defenses of alfalfa nodules to drought stress and to the subsequent recovery of plants. Plant Physiol. 144, 1104–1114. doi: 10.1104/pp.107.099648
Nolan, K. E., Kurdyukov, S., and Rose, R. J. (2009). Expression of the somatic embryogenesis receptor like kinase1 (SERK1) gene is associated with developmental change in the life cycle of model legume Medicago truncatula. J. Exp. Bot. 60, 1759–1771. doi: 10.1093/jxb/erp046
Nolan, K. E., and Rose, R. J. (1998). Plant regeneration from cultured Medicago truncatula with particular reference to abscisic acid and light treatments. Aust. J. Bot. 46, 151–160. doi: 10.1071/BT96138
Nunes, C. M. J., Araújo, S. S., Marques da Silva, J., Fevereiro, P., Bernandes, and da Silva, A. R. (2008). Physiological responses of the legume model Medicago truncatula cv. Jemalong to water deficit. Environ. Exp. Bot. 63, 289–296. doi: 10.1016/j.envexpbot.2007.11.004
Ochatt, S., Jacas, L., Patat-Ochatt, E. M., and Djennane, S. (2013). Flow cytometric analysis and molecular characterization of Agrobacterium tumefaciens-mediated transformants of Medicago truncatula. Plant Cell Tissue Organ Cult. 113, 237–244. doi: 10.1007/s11240-012-0263-1
Ochatt, S., Muilu, R., and Ribalta, F. (2008). Cell morphometry and osmolarity as early indicators of the onset of embryogenesis from cell suspension cultures of grain legumes and model systems. Plant Biosyst. 142, 480–486. doi: 10.1080/11263500802410827
Ochatt, S. J. (2008). Flow cytometry in plant breeding. Cytometry A 73, 581–598. doi: 10.1002/cyto.a.20562
Ochatt, S. J. (2015). Agroecological impact of an in vitro biotechnology approach of embryo development and seed filling in legumes. Agron. Sustain. Dev. 35, 535–552. doi: 10.1007/s13593-014-0276-8
Ochatt, S. J., Marconi, P. L., Radice, S., Arnozis, P. A., and Caso, O. H. (1998). In vitro recurrent selection of potato: production and characterization of salt tolerant cell lines and plants. Plant Cell Tissue Organ Cult. 55, 1. doi: 10.1023/A:1026426331722
Ochatt, S. J., and Moessner, A. (2010). Rounding up plant cells. Int. J. Plant Biol. 1:e8. doi: 10.4081/pb.2010.e8
Ochatt, S. J., and Revilla, M. A. (2016). “From stress to embryos: some of the problems for induction and maturation of somatic embryos,” in In Vitro Embryogenesis in Higher Plants. Methods in Molecular Biology, Vol. 1359, eds M. A. Germanà and M. Lambardi (New York, NY: Humana Press), 523–536. doi: 10.1007/978-1-4939-3061-6
Price, A., Orellana, D., Salleh, F., Stevens, R., Acock, R., Buchanan-Wollaston, V., et al. (2008). A comparison of leaf and petal senescence in wallflower reveals common and distinct patterns of gene expression and physiology. Plant Physiol. 147, 1898–1912. doi: 10.1104/pp.108.120402
Rai, M. K., Kaliaa, R. K., Singh, R., Gangola, M. P., and Dhawan, A. K. (2011). Developing stress tolerant plants through in vitro selection—an overview of the recent progress. Environ. Exp. Bot. 71, 89–98. doi: 10.1016/j.envexpbot.2010.10.021
Roy, S. (2016). Function of MYB domain transcription factors in abiotic stress and epigenetic control of stress response in plant genome. Plant Signal. Behav. 11:e1117723. doi: 10.1080/15592324.2015.1117723
Rubio, M. C., González, E. M., Minchin, F. R., Webb, K. J., Arrese-lgor, C., Ramos, J., et al. (2002). Effects of water stress on antioxidant enzymes of leaves and nodules of transgenic alfalfa overexpressing superoxide dismutases. Physiol. Plant 115, 531–540. doi: 10.1034/j.1399-3054.2002.1150407.x
Sakthivelu, G., Akitha Devi, M. K., Giridhar, P., Rajasekaran, T., Ravishankar, G. A., Nedev, T., et al. (2008). Drought-induced alterations in growth, osmotic potential and in vitro regeneration of soybean cultivars. Gen. Appl. Plant Physiol. 34, 103–112.
Santos-Díaz, M., and Ochoa-Alejo, N. (1994). PEG-tolerant cell clones of chili pepper: growth, osmotic potentials and solute accumulation. Plant Cell Tissue Organ Cult. 37, 1–8. doi: 10.1007/BF00048110
Silva-Ortega, C. O., Ochoa-Alfaro, A. E., Reyes-Agüero, J. A., Aguado-Santacruz, G. A., and Jiménez-Bremont, J. F. (2008). Salt stress increases the expression of p5cs gene and induces proline accumulation in cactus pear. Plant Physiol. Biochem. 46, 82–92. doi: 10.1016/j.plaphy.2007.10.011
Singh, N. B., Singh, D., and Singh, A. (2015). Biological seed priming mitigates the effects of water stress in sunflower seedlings. Physiol. Mol. Biol. Plants 21, 207–214. doi: 10.1007/s12298-015-0291-5
Smirnoff, N. (1993). The role of active oxygen in the response of plants to water deficit, and desiccation. New Phytol. 125, 27–58. doi: 10.1111/j.1469-8137.1993.tb03863.x
Smith, M. A., Coupland, G., Dolan, L., Harberd, N., Jones, J., Martin, C., et al. (2010). Plant Biology. New York, NY: Taylor & Francis Group, 472–479.
Smýkal, P., Coyne, C. J., Ambrose, M. J., Maxted, N., Schaefer, H., Blair, M. W., et al. (2015). Legume crops phylogeny and genetic diversity for science and breeding. Crit. Rev. Plant Sci. 34, 43–104. doi: 10.1080/07352689.2014.897904
Spadafora, N. D., Doonan, J. H., Herbert, R. J., Bitonti, N. B., Wallace, E., Rogers, H. J., et al. (2011). Arabidopsis T-DNA insertional lines for CDC25 are hypersensitive to hydroxyurea but not to zeocin or salt stress. Ann. Bot. 107, 1183–1192. doi: 10.1093/aob/mcq142
Spadafora, N. D., Parfitt, D., Li, S., Bruno, L., Vaughan, R., Buchanan-Wollaston, V., et al. (2012). Perturbation of cytokinin and ethylene-signalling pathways explain the strong rooting phenotype exhibited by Arabidopsis expressing the Schizosaccharomyces pombe mitotic inducer, cdc25. BMC Plant Biol. 12:45. doi: 10.1186/1471-2229-12-45
Sreenivasulu, N., Varshney, R. K., Kavi Kishor, P. B., and Weschke, W. (2004). “Functional genomics for tolerance to abiotic stress in cereals: a functional genomics approach,” in Cereal Genomic, eds P. K. Gupta and R. K. Varshney (Dordrecht: Springer), 483–514. doi: 10.1007/1-4020-2359-6_16
Srivastava, D. K., Gupta, V. K., and Sharma, D. R. (1995). In vitro selection and characterization of water stress tolerant callus cultures of tomato (Lycopersicon esculentum L.). Ind. J. Plant Physiol. 38, 99–104.
Steiner, N., Santa-Catarina, C., Guerra, M. P., Cutri, L., Dornelas, M. C., and Floh, E. I. S. (2012). A gymnosperm homolog of SOMATIC EMBRYOGENESIS RECEPTOR-LIKE KINASE-1 (SERK1) is expressed during somatic embryogenesis. Plant Cell Tissue Organ Cult. 109, 41–50. doi: 10.1007/s11240-011-0071-z
Troll, W., and Lindsley, J. (1955). A photometric method for the determination of proline. J. Biol. Chem. 215, 655–660.
Valliyodan, B., and Nguyen, H. T. (2006). Understanding regulatory networks and engineering for enhanced drought tolerance in plants. Curr. Opin. Plant Biol. 9, 189–195. doi: 10.1016/j.pbi.2006.01.019
Vanstraelen, M., Baloban, M., Da Ines, O., Cultrone, A., Lammens, T., Boudolf, V., et al. (2009). APC/CCCS52A complexes control meristem maintenance in the Arabidopsis root. Proc. Natl. Acad. Sci. U.S.A. 106, 11806–11811. doi: 10.1073/pnas.0901193106
Wagstaff, C., Bramke, I., Breeze, E., Thornber, S., Harrison, E., Thomas, B., et al. (2010). A specific group of genes respond to cold dehydration stress in cut Alstroemeria flowers whereas ambient dehydration stress accelerates developmental senescence expression patterns. J. Exp. Bot. 61, 2905–2921. doi: 10.1093/jxb/erq113
Widholm, J. M. (1972). The use of fluorescein diacetate and phenosafranine for determining viability of cultured plant cells. Stain Technol. 47, 189–194. doi: 10.3109/10520297209116483
Yang, L., Li, Y., and Shen, H. (2012). Somatic embryogenesis and plant regeneration from immature zygotic embryo cultures of mountain ash (Sorbus pohuashanensis). Plant Cell Tissue Organ Cult. 109, 547–556. doi: 10.1007/s11240-012-0121-1
Yoshiyama, K. O., Kimura, S., Maki, H., Britt, A. B., and Umeda, M. (2014). The role of SOG1, a plant-specific transcriptional regulator, in the DNA damage response. Plant Signal. Behav. 9, e28889. doi: 10.4161/psb.28889
Zhao, L., Wang, P., Hou, H., Zhang, H., Wang, Y., Yan, S., et al. (2014). Transcriptional regulation of cell cycle genes in response to abiotic stresses correlates with dynamic changes in histone modifications in maize. PLoS ONE 9:e106070. doi: 10.1371/journal.pone.0106070
Keywords: cell cycle, cell division, cell morphology, gene expression, legumes, Medicago truncatula, water stress, WEE1
Citation: Elmaghrabi AM, Rogers HJ, Francis D and Ochatt SJ (2017) PEG Induces High Expression of the Cell Cycle Checkpoint Gene WEE1 in Embryogenic Callus of Medicago truncatula: Potential Link between Cell Cycle Checkpoint Regulation and Osmotic Stress. Front. Plant Sci. 8:1479. doi: 10.3389/fpls.2017.01479
Received: 12 April 2017; Accepted: 09 August 2017;
Published: 05 September 2017.
Edited by:
Jorge Almiro P. Paiva, Institute of Plant Genetics (PAN), PolandReviewed by:
Anca Macovei, University of Pavia, ItalyPaweł Sulima, University of Warmia and Mazury in Olsztyn, Poland
Copyright © 2017 Elmaghrabi, Rogers, Francis and Ochatt. This is an open-access article distributed under the terms of the Creative Commons Attribution License (CC BY). The use, distribution or reproduction in other forums is permitted, provided the original author(s) or licensor are credited and that the original publication in this journal is cited, in accordance with accepted academic practice. No use, distribution or reproduction is permitted which does not comply with these terms.
*Correspondence: Sergio J. Ochatt, sergio.ochatt@inra.fr