 Lei Pan
 Nian Wang
 Zhihua Wu3
 Yu Zheng
 Songtao Gui
- 1Hubei Province Engineering Research Centre of Legume Plants, College of Life Sciences, Jianghan University, Wuhan, China
- 2Department of Forestry, College of Horticulture and Forest, Huazhong Agriculture University, Wuhan, China
- 3National Key Laboratory of Crop Genetic Improvement, Center of Integrative Biology, College of Life Science and Technology, Huazhong Agricultural University, Wuhan, China
- 4Institute for Interdisciplinary Research, Jianghan University, Wuhan, China
- 5BGI-Agro, Shenzhen, China
- 6Department of Genetics, State Key Laboratory of Hybrid Rice, College of Life Sciences, Wuhan University, Wuhan, China
Cowpea [Vigna unguiculata (L.) Walp.] is an annual legume of economic importance and widely grown in the semi-arid tropics. However, high-density genetic maps of cowpea are still lacking. Here, we identified 34,868 SNPs (single nucleotide polymorphisms) that were distributed in the cowpea genome based on the RAD sequencing (restriction-site associated DNA sequencing) technique using a population of 170 individuals (two cowpea parents and 168 F2:3 progenies). Of these, 17,996 reliable SNPs were allotted to 11 consensus linkage groups (LGs). The length of the genetic map was 1,194.25 cM in total with a mean distance of 0.066 cM/SNP marker locus. Using this map and the F2:3 population, combined with the CIM (composite interval mapping) method, eleven quantitative trait loci (QTL) of yield-related trait were detected on seven LGs (LG4, 5, 6, 7, 9, 10, and 11) in cowpea. These QTL explained 0.05–17.32% of the total phenotypic variation. Among these, four QTL were for pod length, four QTL for thousand-grain weight (TGW), two QTL for grain number per pod, and one QTL for carpopodium length. Our results will provide a foundation for understanding genes related to grain yield in the cowpea and genus Vigna.
Introduction
Cowpea [Vigna unguiculata (L.) Walp. 2X = 2N = 22], ~587 Mb in genome size, is an important drought-tolerant legume crop (Iwata et al., 2013). It is one of the top five food legumes or pulses grown worldwide (Smýkal et al., 2015). Cowpea is cultivated mainly for fresh and dry grains, leaves, and fodder (Lucas et al., 2011). Due to its symbiotic nitrogen fixation, the crop is a valuable component of rotations and intercrops with sorghum and millets. The nitrogen fixation level of cowpea is less than soybean, but more than common bean (Quaye et al., 2009; Iwata et al., 2013). Cowpea is widely grown throughout tropical and subtropical regions, including Africa and some Asian, South European, Central and South American countries (Tosti and Negri, 2005). In many regions, especially in Africa and Asia, cowpea plays an important role in providing protein-rich components against protein-poor diet (Ehlers and Hall, 1997). The West African sub-region contributes to predominantly global cowpea yield (~95%), and Nigeria has the maximum mass of cowpea product around the world (FAOSTAT, 2012). Two cowpea subspecies are generally cultivated around the world. One is a grain-type cowpea that is harvested for matured seeds and is commonly known as the African cowpea or the common cowpea (V. unguiculata L. Walp. ssp. unguiculata) (Singh, 2002). The other is a vegetable-type cowpea known as the asparagus bean or “yardlong” bean (V. unguiculata L. Walp. ssp. sesquipedalis), which is planted for its long tender immature pods (Xu et al., 2016).
Currently, one of the major goals in cowpea breeding is to improve cowpea yield by using modern genetic strategies, such as marker-assisted selection and genomic-assisted selection. Selection of genomic loci or genes related to the traits of interest for economic importance requires using genetic maps constructed with molecular markers (Chapman et al., 2008). Therefore, genetic maps play a basic role in the progress of crop molecular breeding (Andriantahina et al., 2013).
In the past two decades, with progress in marker technology, genetic mapping in cowpea has resulted in increasingly dense linkage maps (Lucas et al., 2011). It is noteworthy that several different types of DNA molecular markers have been applied for different mapping populations (F2 population, BC1F1 population, and recombination inbred line) in cowpea (Ouédraogo et al., 2002; Muchero et al., 2009a; Xu et al., 2011; Kongjaimun et al., 2012a).
The quantitative trait loci (QTL) related to growth and abiotic/biotic stress tolerance have been identified in cowpea. Twelve QTL controlling resistance to drought have been identified (Muchero et al., 2009b), whereas only five QTL (Cht–1~Cht–5) for resistance to high temperature were detected (Lucas et al., 2013a). Nine QTL (Mac-1~Mac-9) for Macrophomina phaseolina resistance (Muchero et al., 2011) and three QTL (Fot 3-1, Fot 4-1, and Fot 4-2) for Fusarium oxysporum resistance (Pottorff et al., 2012a, 2014a) were discovered. QTL for development-related traits have been focused on cowpea in recent years, including pod length (Kongjaimun et al., 2012a), leaf morphology (Pottorff et al., 2012b), seed size (Kongjaimun et al., 2012b), horticultural traits (Xu et al., 2013), pod tenderness, total soluble solid (Kongjaimun et al., 2013), flowering time (Andargie et al., 2013), and seed coats (Pottorff et al., 2014b). Although previous genetic maps have been successfully applied to identify QTL for abiotic/biotic resistance and growth traits in cowpea, the available markers of these maps, restricted from hundreds to a few thousand, make it difficult to locate the genomic regions tightly linked to crucial traits. Thus, the development of high resolution genetic maps is of utmost importance for cowpea breeding programs.
The advancement of next-generation sequencing (NGS) technologies has accelerated the identification of SNPs and genotyping process (Peterson et al., 2012). The combination of high-throughput NGS technologies and restriction enzyme digestion is able to reduce the complexity of the target genomes, and to develop a large number of SNP markers in any species of interest (Hyten et al., 2010; Davey et al., 2011; Chen et al., 2013; Raman et al., 2014). Restriction-site associated DNA sequencing (RAD-seq) is one of the preferred NGS technologies for high-throughput genotyping. The RAD-seq method, first described by Baird et al. (2008), has been used in many species without a reference genome, including rygrass (Pfender et al., 2011), barley (Chutimanitsakun et al., 2011), eggplant (Barchi et al., 2012), grape (Wang N. et al., 2012), and sesame (Wu et al., 2014). It has been a useful tool for linkage map construction, QTL mapping and comparative genomics (Gonen et al., 2014).
To date, despite the available genetic map based on SNPs in cowpea (Muchero et al., 2009a; Lucas et al., 2011), the large-scale discovery, and utilization of SNP markers have not been carried out to build a fine linkage map of cowpea. Consequently, in the present study, we aimed to construct a high-density SNP linkage map of the cowpea genome using RAD-seq analysis with two parents a population of 168 F2:3 lines. Then, in a further analysis, we identified yield-related QTLs based on the genomic resources of cowpea.
Materials and Methods
Plant Samples and Field Trials
The mapping population consisted of 168 F2:3 progenies from a cross between two cowpea subspecies accessions: (V. unguiculata ssp. unguiculata) cultivar “Green pod cowpea” (female) and yardlong bean (V. unguiculata ssp. sesquipedalis) cultivar “Xiabao II” (male) (Figure 1, Supplementary Figure 1). The two parents showed distinct morphological traits, including seed coat color, pod length, carpopodium length, grain number per pod and grain size.
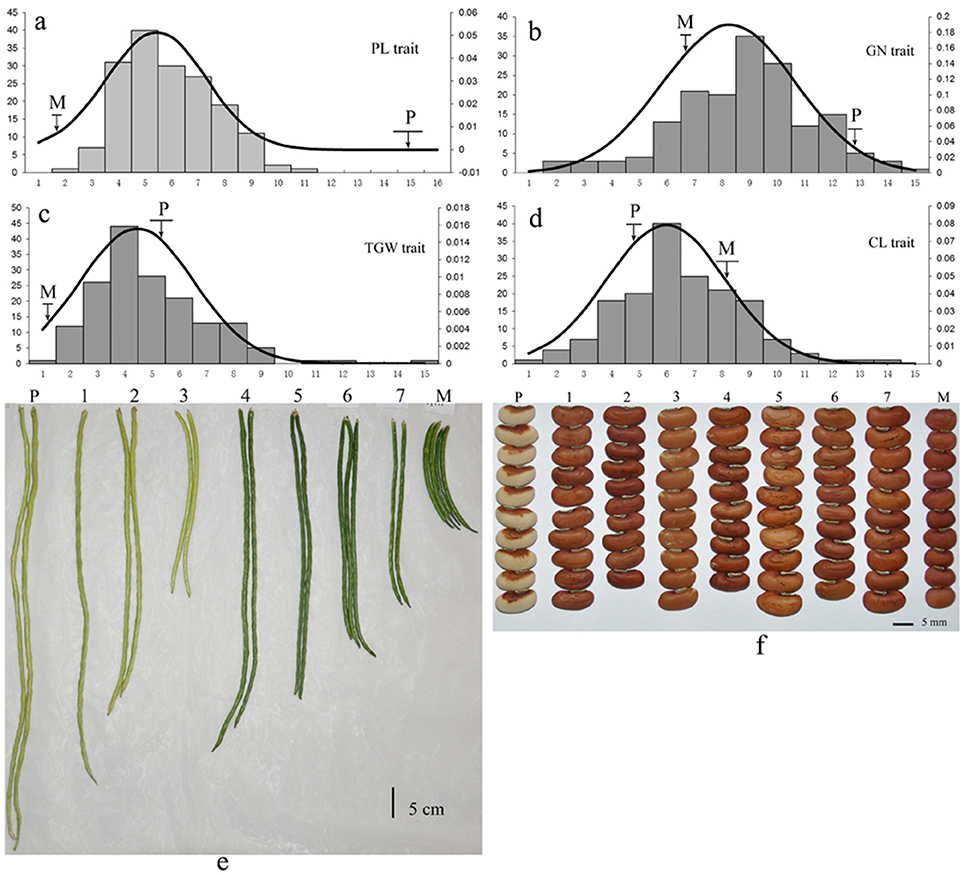
Figure 1. Phenotypic variation of yield-related traits in cowpea. The lower-case letters “a–f” represent the phenotypic variation of the four traits (PL, GN, TGW, and CL) among the 168 F2:3 offspring. P: Yardlong bean (V. unguiculata ssp. sesquipedalis) cultivar “Xiabao II” (male). M: “Green pod cowpea” (female). The codes 1~7 represent seven F2:3 offspring derived from the cross between “Green pod cowpea” (female) and cultivar “Xiabao II” (male).
Field trials were performed in the Caidian district (114.03E, 30.58N), Wuhan city, Hubei province, P.R. China from July to October 2014. Each sample was planted 1 m apart in rows 1.5 m in length.
Ethics Statement
The authors declare that the experiments comply with the current laws of the country in which they were performed.
Trait Evaluation
For each F2:3 progeny and the two parents, trait evaluation included pod length (PL, cm), carpopodium length (CL, cm), grain number per pod (GN), and thousand-grain weight (TGW, g). PL was measured as the average length from the top to the end of ten pods. CL was measured as the average length from the upper part to the end of carpopodium of ten pods. GN was measured as the average number of seeds of 10 uniform capsules from each plant. To measure the TGW, the mean weight of three independent samples of fifty grains was calculated first, and then was converted to TGW. All samples of F2:3 population were tested for phenotyping at the harvest stage.
RAD Library Construction and Sequencing
Young leaves were collected from each sample and then frozen at −80°C. Total genomic DNA was extracted from each sample using the modified CTAB method as described by Doyle and Doyle (1987). Genomic DNA from each sample was quantified using spectrophotometry (Qubit 2.0 Fluorometer, Invitrogen) and checked for genomic integrity by 0.8% agarose gel electrophoresis.
Restriction-site associated DNA (RAD) strategy combined with Illumina DNA sequencing was used for the fast and effective identification of SNP markers. RAD libraries were constructed following a protocol from Baird et al. (2008). The general protocol was as follows: first, each sample of genomic DNA (~0.5 μg per sample) from the 168 individuals and their two parents was digested with 20 units (U) of EcoRI or Sbf I (New England Biolabs, NEB) for 15 min at 37°C in a 50-μL (microlitre) reaction and then heat denatured at 65°C. P1 Adapters, each with a unique 4–8 bp (base pair) molecular-identifying sequence (MID), were ligated to the genomic DNA of each sample. The adapter sequences were as follows: EcoRI digestion, top: 5′-AATGATACGGCGACCACCGAGATCTACACTCTTTCCCTACACGACGCTCTTCCGATCTxxxxx-3′ [x = barcode], bottom: 5′-Phos-AATTxxxxxAGATCGGAAGAGCGTCGTGTAGGGAAAGAGTGTAGATCTCGGTGGTCGCCGTATCATT-3′, for Sbf I digestion, top: 5′-AATGATACGGCGACCACCGAGATCTACACTCTTTCCCTACACGACGCTCTTCCGATCTxxxxTGCA-3′, bottom: 5′-Phos-xxxxAGATCGGAAGAGCGTCGTGTAGGGAAAGAGTGTAGATCTCGGTGGTCGCCGTATCATT-3′. The ligation reaction was incubated at room temperature (RT) for 20 min in a final volume of 10 μL containing 2.5 μL P1Adapter (100 nM), 1 μL rATP (100 mM) (Promega), 1 μL 10 × EcoRI buffer, 0.5 μL T4 DNA Ligase (1,000 U) (NEB), and 5 μL H2O. Samples were treated with heat denaturation at 65°C for 20 min again. The pooled samples of each library were randomly cut to DNA fragments of 400–700 bp. The size of sheared DNA was isolated through 1% agarose gel electrophoresis using a DNA gel extraction kit (Tiangen, China). The ends of the DNA were blunted by using the Quick Blunting Kit (NEB). After purifying the samples using a DNA purification kit (Tiangen), 15 U of Klenow exo− (NEB) was added for adenine (Fermentas) overhangs on the 3′end of the DNA at 37°C. Then, 1 μL P2 Adapter (10 nM) was ligated to the DNA fragments at RT. Samples were again purified and eluted in 50 μL. Five microlitres of this product was used in a PCR amplification along with 50 μL Phusion Master Mix (NEB), 40 μL H2O and 5 μL primer mix (10 μM) (P1-forward primer: 5′-AATGATACGGCGACCACCGA-3′; P2-reverse primer: 5′-CAAGCAGAAGACGGCATACGA-3′). The PCR enrichment was carried out following instructions (NEB) for 11 cycles in total. Samples were gel purified, excising DNA 400–700 bp, and diluted to 10 nM.
Each library of the RAD products from the 170 individuals was sequenced on an individual lane of the Illumina HiSeq2000 next-generation sequencing platform (BGI-Shenzhen, Shenzhen, P.R. China). Sequencing data for each individual were then obtained in terms of the specific MID. Raw sequences are available in the National Centre for Biotechnology Information (NCBI) Sequence Read Archive (SRA) database under the accession number SRR5097134.
SNP Discovery and Genotyping
Illumina raw sequence reads were filtered out at first if lacking expected restriction enzyme or ambiguous barcodes. Thus, the raw reads were ensured to more than 90% of the nucleotides having a quality value above Q30 (equals 0.1% sequencing error) and more than 95% above Q20 (equals 1% sequencing error). SNPs were discovered using a two-step process. In step 1, four individuals having the maximum sequencing reads were used to generate “reference tags” using Ustacks and Cstacks (Catchen et al., 2011). Then, the SNPs of the two parents and their offspring were identified by aligning the clean reads of the offspring to the reference tags. SNPs were regarded as true polymorphisms when each allele was represented by a minimum coverage of three reads or alleles were observed in at least five reads with a score >20 (p > 0.05). Genotypes of offspring individuals were determined by comparing to the parental genotypes. SNP markers with <10% missing data among the 170 individuals and meeting the above criteria were used in the following linkage mapping.
Linkage Mapping
The construction of genetic linkage map was performed by using JoinMap4 (Van Ooijen, 2006) and MSTmap (Wu et al., 2008). Linkage groups (LGs) were first defined using a minimum LOD threshold of 15 and a maximum recombination of 45% with the software JoinMap4. The Kosambi mapping function in the software MSTmap was used to convert recombination frequencies into map distance for each linkage group. The final marker order of each linkage group was verified by the software program RECORD (Van et al., 2005). The final marker order was verified in each linkage group by using RECORD (Van et al., 2005). The linkage map was graphically visualized with MapChart2.2 (Voorrips, 2002). The corrected length of the linkage map was assessed by multiplying the length of each linkage group by (m + 1)/(m−1), where m is the number of markers in the linkage group (Chakravarti et al., 1991). The coverage of the genome by the linkage map was then estimated by calculating c = 1 −e−2dn/L, where d is the average interval of markers, n is the number of markers, and L is the length of the linkage map (McDaniel et al., 2007).
To verify the map quality, we compared the new SNP map and recently reported cowpea maps (Muñoz-Amatriaín et al., 2017). We identified identical and proximal markers between the linkage maps using a reference genome of a related species as an intermediary (e.g., common bean) because the cowpea genome shares a high degree of collinearity with the common bean (Vasconcelos et al., 2015).
To assess the quality and universality of genetic maps, comparison of marker names, sequences, LGs and cM positions were carried out between our RAD-based SNP map and a recent published genetic map of cowpea (Muñoz-Amatriaín et al., 2017). Comparisons of linkage group composition and order were investigated for P. vulgaris. The basic workflow was as follows. First, all marker sequences were combined into a single FASTA file and mapped to a reference genome (e.g., common bean genome, NCBI accession number: ANNZ00000000.1) and published scaffolds (https://www.ncbi.nlm.nih.gov/genome/genomes/380). When two markers mapped to the same reference genome scaffold or contig, the two closest markers were considered as a marker pair. Each marker can only be paired once, and any other marker that was seconds closest (or further) to the now-paired marker is discarded. The paired markers were visualized by MapChart (Voorrips, 2002).
QTL Analysis
The mean phenotypic data from all the 170 individuals (two parents and 168 F2:3 progenies) were calculated for frequency distributions using function formula “NORMDIST” in Excel 2010.
Quantitative trait loci (QTL) were detected for each of the traits using the CIM (composite interval mapping) method implemented in Windows QTL Cartographer 2.5 (Wang S. et al., 2012). The LOD significance thresholds (P < 0.05) were analyzed by running 1,000 permutation tests. QTL regions were visualized by the program Matplotlib (version 1.4.3) in software Python version 2.7.10 (Sanner, 1999).
Comparative Analysis
To compare the genome structures of cowpea and a closely related species, a comparative analysis was carried out between the cowpea linkage map and the whole genome sequences of adzuki bean V. angularis. BLASTN was used to perform similarity searches (using the nucleotide sequences from which the SNP markers were mapped in the current linkage map of cowpea) against each pseudomolecule of the genome sequences of V. angularis, with a threshold e-value of 1e-20. The graphical comparative maps were drawn using the Circos program (Ubi et al., 2000).
In addition, sequences of cowpea RAD tags located in QTL regions were chosen to reveal potential genetic information by using BLASTN. These sequences of the mapped markers of cowpea RAD-tags were searched against genomes of legumes deposited in the NCBI database using BLASTN with an e-value cut-off of 1e-10 (www.ncbi.nlm.nih.gov/blast/).
Results
RAD Sequencing and Genotyping
A total of 170 RAD-seq libraries from two parents and 168 offspring were constructed and sequenced on an Illumina HiSeq2000 platform. After data filtering, 768,592,488 raw reads, consisting of ~69.315 Gb of sequencing data, were individually assigned to RAD tags.
A total of 383,077 RAD-tags were obtained. Using all the tags as reference sequences, SNP loci derived from paired end reads of 170 individuals were identified. Overall, 34, 868 polymorphic SNPs between the offspring genotypes and the two parent genotypes were identified on basis of strict SNP selection and criteria.
Linkage Map Construction and SNP Analysis
The set of 34,868 SNPs were used for genetic map construction. A total of 17,996 SNPs were successfully mapped onto 11 different LGs, covering 1,194.25 cM of the cowpea genome with an average distance of 0.066 cM between adjacent markers (Table 1 and Supplementary Figure 2). The length of the individual LGs ranged between 76.19 cM (LG11) and 198.85 cM (LG1), with an average inter-locus distance of 0.03 (LG2) to 0.13 cM (LG10 and LG11). LG1 was the densest, having 3,343 SNP loci, with an average density of 0.42 cM, whereas LG11 had the least number of SNP loci (591). On average, each LG consisted of 1,636 SNP loci spanning 108.57 cM. The corrected length of the linkage map was estimated at 1,195.97 cM, which was converted to genome coverage of 86.3%. Loci names and genetic distance of SNP positions on the 11 LGs of the genetic map are listed in Supplementary File 1.
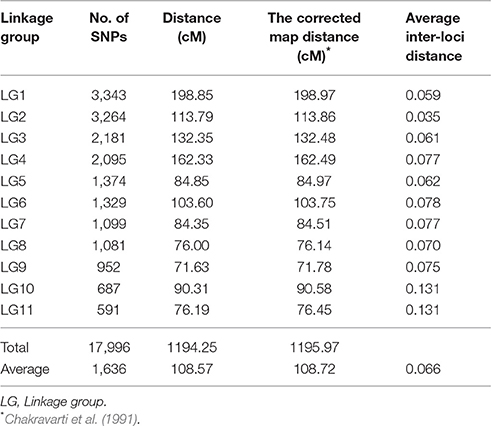
Table 1. Distribution of mapped SNP markers on the 11 linkage group of cowpea.
To reveal the characterization of SNPs in cowpea, we investigated distribution and percentages of different SNP types. We found that the 17,996 SNP markers were genome-wide distributed across the 11 LGs, implying 1,636 SNPs per linkage group (Table 1). The maximum number of SNPs (3,343) was found in LG1, while the minimum number of SNPs (591) was found in LG11. Among the SNPs, the dominant type was transition, and the C/T and G/A types contributed to 34.8 and 35.8% of the SNPs, respectively. The other four SNP types were transversion including C/G, G/T, C/A, and A/T. Their proportion varied from 6.2 to 7.8% accounting for 29.4% of all SNPs (Supplementary Table 1). The SNP-flanking sequences and the polymorphic sites are summarized in Supplementary File 2.
Consensus Genetic Linkage Map
To compare the maker position of our linkage map and the newly published consensus cowpea linkage maps (Muñoz-Amatriaín et al., 2017), we employed the partial reference genome available of Phaseolus vulgaris (Schmutz et al., 2014). To assign LGs to chromosomes, both our linkage map and the newly published consensus cowpea linkage maps (Muñoz-Amatriaín et al., 2017) were compared by mapping marker sequences against the common bean genome. Markers from both cowpea linkage maps were identified and aligned if they hit against the same contig/scaffold. Descriptive statistics for the identified markers on the LGs are in Table 2. Then, based on these markers, extensive synteny was observed using Circos (Krzywinski et al., 2009). A full comparison was completed across the two existing maps and the common bean genome. A set of 3,695 SNPs from our linkage map was identified, while 24,643 SNPs from the consensus cowpea linkage map were detected (Muñoz-Amatriaín et al., 2017). Thus, a total number of 28,338 SNPs were assigned to the 11 chromosomes of the common bean genome (Figure 2, Table 2, Supplementary File 3).
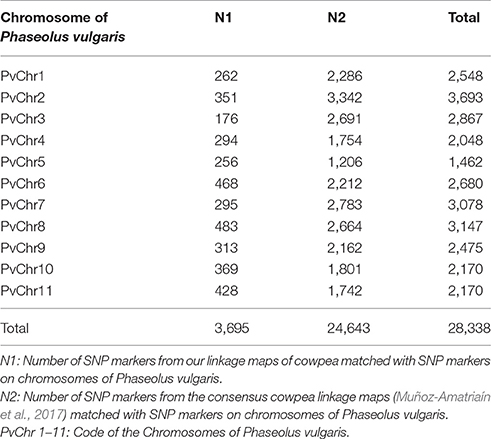
Table 2. Comparison of the current cowpea linkage map and the Muñoz-Amatriaín et al. (2017) map.
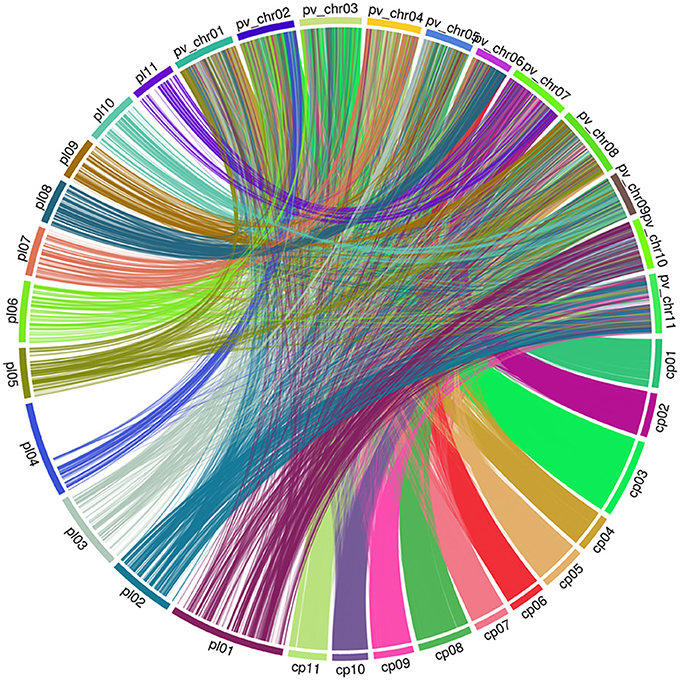
Figure 2. Genome view of synteny between two cowpea linkage groups and the common bean genome pl: Code of our linkage maps of cowpea. cp: Code of the consensus cowpea linkage maps (Muñoz-Amatriaín et al., 2017). pv_chr: Code of the Chromosomes of Phaseolus vulgaris.
To capture identical markers between the two cowpea linkage maps, markers from each cowpea linkage map were paired if they hit against the same contig/scaffold of the common bean genome by taking the closest two markers together as each pair. We obtained 171 paired SNP marker loci. These paired markers were distributed unevenly across the common bean genome (Supplementary Figure 3, Supplementary File 4). This demonstrates that the current cowpea map accounts for 185 of the 37,372 SNPs mapped by Muñoz-Amatriaín et al. (2017) in cowpea, and the two maps are syntenic across all LGs to a degree.
Identification of Pod Yield-Related QTL Using High-Density Genetic Map in Cowpea
All traits showed a continuous distribution and transgressive segregation in the F2:3 population (Figure 1) in this study, indicating that the traits were controlled by multiple genes. The near-normal curve distribution of PL, CL, GN, and TGW suggested a polygene mode for genetic control in these traits.
Overall, 11 significant QTL for cowpea pod yield were detected on seven LGs (LG4, 5, 6, 7, 9, 10, and 11) using the CIM method (Figure 3, Table 3, and Supplementary Figure 4). Most of these QTL were assigned on their respective LGs. On LG11, three QTL (Qcpl-4, Qcgn-2, and Qctgw-4) were located between the regions of 48.5–75.6 cM. On LG4, two QTL (Qcpl-1 and Qctgw-1) were found between the regions of 56.1–128.9 cM. On LG9, one QTL (Qcpl-3) was detected on LG9 at the position of 57.9 cM. Noticeably, Qcpl-3 located at 57.9 cM had the highest LOD value of 18.36 and correspondingly had the highest contribution to phenotypic variation at 17.32%. On LG10, two QTL (Qccl-1 and Qctgw-3) were detected at positions 4.4–68.2 cM. The other three LGs, (LG 5, 6, and 7,) contained one QTL locus, including Qcgn-1 on LG5 at 59.8 cM, Qcpl-2 on LG6 at 96.3 cM, and Qctgw-2 on LG7 at 77.4 cM. Most of the 11 QTL showed negative additive effects except Qcpl-2 (1.70) and Qccl-1 (0.08).
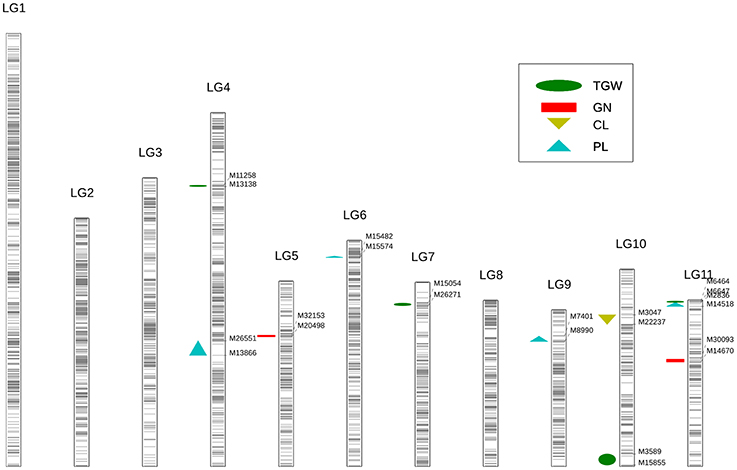
Figure 3. Identification of yield-related QTL using high-density genetic map in cowpea. Each black line represents a SNP locus. The green ellipse represents the trait of thousand-grain weight (TGW); the red rectangle represents the trait of grain number per pod (GN); the yellow triangle represents the trait of carpopodium length (CL); the blue triangle represents the trait of pod length (PL).
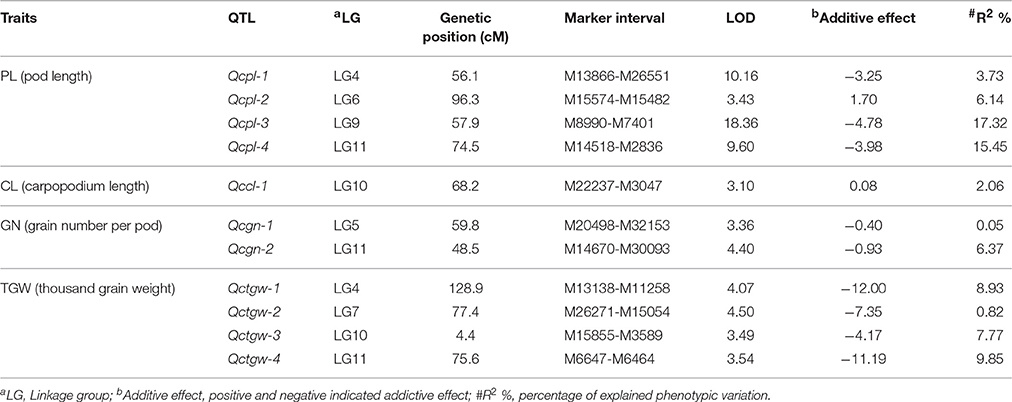
Table 3. QTL of pod yield-related traits detected by CIM form the analysis of the F2:3 population in cowpea (LOD > 3).
From these 11 QTL, four QTL for cowpea pod length (Qcpl-1≈Qcpl-4) explaining 42.64% of the total phenotypic variation and two major loci (explaining > 15% of the total variation) were detected. Moreover, we detected two major-effect QTL from the above mentioned four QTL that had a phenotypic effect (R2) of more than 15%, including Qcpl-3 (17.32%), and Qcpl-4 (15.45%).
Comparative Analysis between the Sequences of the Mapped SNPs in Cowpea and Related Species
The mapped SNP flanking sequences of V. unguiculata showed significant alignment with similar sequences in the adzuki bean (Vigna angularis) (Figure 4). Between V. unguiculata and V. angularis, 5,616 of 17,996 (31.2%) mapped SNP tags (94 bp per tag) were found, which had a total length of 527.9 Kb (Supplementary Table 2).
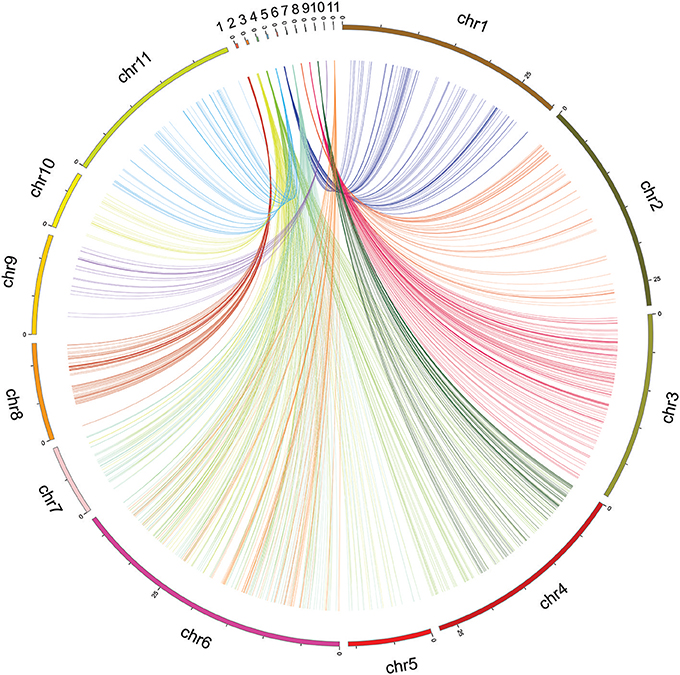
Figure 4. Circos mapping of eleven linkage groups of cowpea (top) to the adzuki bean genome.
To uncover the synteny information between cowpea and the closely related species adzuki bean, all tags of the mapped SNPs of V. unguiculata were compared with the V. angularis genome. Based on the maximum number tags between the two species, all chromosomes of V. angularis were assigned to at least one linkage group of V. unguiculata, except chromosome 6 of V. angularis, which had two assigned LGs of cowpea (Supplementary Table 2), possibly due to translocation on the chromosome. Eleven LGs of V. unguiculata aligned to eleven chromosomes of V. angularis (Supplementary File 5), caused by two LGs (LG 2 and 6) sharing one single chromosome of V. angularis (chromosome 6). These conserved regions should represent homologous regions between the two genomes. Our result implies that, although both V. unguiculata and V. angularis contain the same number of chromosomes (2X = 2N = 22), the chromosomes of cowpea evolved independently and exhibit different rearrangements from the chromosomes of V. angularis.
In addition, 93 RAD-tags located in QTL regions of the four traits (PL, TGW, GN, and CL) were analyzed by BLASTN in the NCBI databases. Of these, eight RAD tags were found to have homology domains in two species (V. radiata and V. angularis) in genus Vigna (Supplementary File 6). These tags were mainly related to two traits (pod length and TGW). Noticeably, two RAD-tag (M26270 and M26271) sequences were revealed to show similarity with the sequences of E3 ubiquitin protein ligase DRIP2-like (LOC106770573), which targets transcription factors for degradation and thus regulates gene expression in response to environmental or hormonal signals (Qin et al., 2008).
Discussion
High-Density SNP Linkage Map Construction in Cowpea Based on RAD-Seq
Molecular markers and genetic maps play a significant role in the genetic mapping of important traits in crops (Zhou et al., 2014). With recent significant advancements, RAD-seq technology as well as other technologies, such as GBS based DArTseq markers has been employed as a useful tool for high-density genetic mapping and 30 QTL mapping (Baird et al., 2008; Raman et al., 2014, 2016; Zou et al., 2016). This technology can discover thousands of markers in the model or other organisms regardless of genome size or reference genomes (Davey and Blaxter, 2010). Currently, the RAD-seq technique has been gradually applied to several legume species, such as chickpea (Gaur et al., 2012) and peanut (Gupta et al., 2015). However, to the best of our knowledge, no study has ever been reported on RAD-seq-based SNP discovery technique in cowpea. In the present study, we constructed and characterized a high-density SNP linkage map in cowpea using the RAD-seq method. A total of 383,077 RAD tags were obtained from the two cowpea parents and 168 F2:3 offspring individuals. Then, we identified 34,868 novel SNPs distributed throughout the whole cowpea genome, providing genetic variation resources for the genome-wide association investigations in the future. Of the discovered SNPs, 17,996 SNPs were successfully assigned to 11 LGs corresponding to 11 chromosome pairs of the cowpea genome. The map spanned 1194.25 cM, showing 0.066 cM/SNP locus. Therefore, the current version of the population-specific linkage maps for V. unguiculata was a considerable improvement compared with the formerly published linkage maps of cowpea (Table 4). The analysis of synteny between our linkage map and a recent map of cowpea (Muñoz-Amatriaín et al., 2017) revealed that the two maps show relatively high-level synteny across all cowpea LGs. This study generated a high density RAD-based linkage map of cowpea to date. The inter-marker distance of 0.066 cM indicated it would be beneficial for locating sequence scaffold on the physical map of the cowpea genome sequence (Deokar et al., 2014). Moreover, this high-density linkage map would be an ideal genetic map for QTL mapping, gene locating, and comparative genomics analysis for agriculturally important traits of cowpea. However, there are limitations for the utilization of this map because it was based on the SNPs between only two cowpea varieties, with a SNP flanking sequence of only 94 bp.
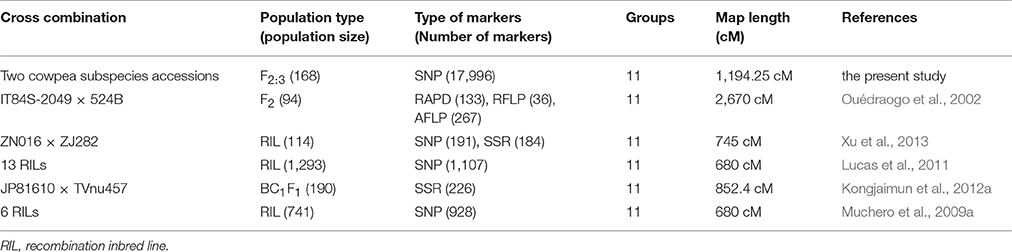
Table 4. Comparison of linkage maps for Vigna unguiculata from a single population.
Yield-Related QTL Based on High-Density SNP Genetic Map in Cowpea
The QTL related to domestication traits are non-randomness distribution across the crop genome (Gepts, 2004). This can be attributed to its association with “cultivation magnetism” and the “protracted transition paradigm” of crop domestication (Allaby, 2010). The increasing yield is one of the most significant domestication targets in crops, but it is a tedious process influenced by complex environmental components (Wu et al., 2014). Yield-related traits dominate QTL studies in wheat, maize, rice and soybeans, reflecting the agronomic and economic importance of these crops (Salvi and Tuberosa, 2015). Based on path coefficient analysis, it was revealed that single pod weight and number of pods per plant had the major positive contribution toward the pod yield in Phaseolus vulgaris (Ankit et al., 2017).
Quantitative trait loci (QTL) of yield-related traits have been detected in Brassica napus (Cai et al., 2016; Zhao et al., 2016), Oryza nivara (Ma et al., 2016), and Hordeum vulgare (Mikołajczak et al., 2016). In B. napus, 14 crucial candidate genes, which might be involved in developmental processes (such as, the regulation of flowering and vegetative phase change) and biomass accumulation (such as, response to secondsary wall biosynthesis), were revealed to be associated with the yield establishment (Lu et al., 2017). In several legume crops, agricultural traits have been investigated, including adzuki bean (Kaga et al., 2008), rice bean (Isemura et al., 2010), chickpea (Das et al., 2015), and cultivated peanut (Luo et al., 2017). In Arachis hypogaea, Luo et al. (2017) identified three co-localized major QTL for pod size and weight to a 3.7 cM interval on chromosome A05. These traits were controlled by a few large QTL or by a major QTL and several minor QTL. The QTL governing domestication traits in cowpea were reported in previous studies, which included pod length, plant height, seed size, flowering time, seed coat color, flower color and other traits (Ubi et al., 2000; Peksen, 2004; Kongjaimun et al., 2012a; Xu et al., 2013, 2016).
In this study, the excavation and identification of yield-associated QTL would pave the way for cowpea breeding, particularly for marker assisted selection (MAS) in cowpea. The current high-density genetic map is useful for QTL analysis in V. unguiculata.
Pod Length
Pod length, one of the most significant agricultural traits of the yardlong bean (V. unguiculata ssp. sesquipedalis), is a complex quantitative trait controlled by multiple genes. The “one major QTL + minor QTLs” mode of pod length determination is consistent with an earlier version of the ZZ map (Xu et al., 2011) and the Kongjaimun et al. (2012a) genetic map. The distinct pod trait of the yardlong bean might be the result of oriented domestication for the edible tender pods. Compared with its wild type, the domestication of the yardlong bean has led to an ~8-fold increase in pod length (Pottorff et al., 2014a). The domesticated V. unguiculata ssp. sesquipedalis parent used here had an average pod length of 78.99 cm, while the domesticated V. unguiculata ssp. unguiculata had an average pod length of 22.75 cm (Supplementary File 7). The former was almost four times longer than the latter. Four QTL on LGs 4, 6, 9, and 11 were probably involved in pod length variation in V. unguiculata (Table 3). Among them, the QTL (Qcpl-3) located on LG9 had the greatest effect on pod length. In comparison, regarding the pod-length related traits in V. unguiculata, nine QTL (Kongjaimun et al., 2012b) and seven QTL (Kongjaimun et al., 2012a) were revealed in different LGs. The LGs were developed from 226 SSR molecular markers and BC1F1 and F2 populations from the cross between a yardlong bean accession and a wild cowpea accession. Thus, the discrepancy between the pod-length-related QTL numbers and positions in V. unguiculata might be attributed to the varied marker types and cross-combination population between the previous investigations and this study. Recently, 72 pod-length-associated SNPs were identified by genome-wide association studies (GWAS), and the gene effects of sugar, gibberellin and nutritional signaling might be involved in the regulation of pod length based on the transcriptomic analysis (Xu et al., 2016). These studies paved the way for the feasibility of cloning pod length genes and marker assisted selection of this trait in cowpea breeding programs.
Seed Weight (Thousand-Grain Weight)
Two components of seed weight, TGW and grain number per pod (GN), exhibited no obvious difference between the two parents in this study. However, the additive effect of the QTL related to TGW and GN traits in the male parent (V. unguiculata ssp. sesquipedalis) possibly increased the total seed weight (Table 3, Supplementary File 7).
As to TGW, the average value of TGW trait in F2:3 population was 162.61 g, which was closer to the male parent (167.64 g) than the female parent (121.99 g). Four QTL were detected for the TGW trait in cowpea, and that with the largest effect (percentage of explained phenotypic variation 9.85%) was found on LG11 (Qctgw-4). This QTL was linked to the interval region of the SNP loci between M6647-M6464 in this study.
Regarding GN, the GN trait was only slightly different between the two parents, although the pod length of the male parent (V. unguiculata ssp. sesquipedalis) was much longer than that of the female parent (V. unguiculata ssp. unguiculata). The average grain number per pod of the F2:3 population (17 grains) was slightly larger than the female parent (16 grains) but lower than the male parent (20 grains). Two QTL were detected on LGs 5 and 11 for GN. The QTL on LG11 had the largest effect, explaining 6.37% of the phenotypic variation in the F2:3 population. As mentioned above, the male parent has a significantly more positive influence than the female parent on the three factors of seed weight. To date, the genomic region associated with seed weight is still unknown, but a domestication-related QTL involved in seed size (Css-1) has been observed in cowpea (Lucas et al., 2013b).
Plant Type
Plant type is a crucial trait in domestication. One aspect of plant type, carpopodium length, showed a slight difference between the two cowpea parents in the present study. The carpopodium length of the F2:3 population (mean = 29.58 cm) fluctuated between the female parent V. unguiculata ssp. unguiculata (32.44 cm) and the male parent V. unguiculata ssp. sesquipedalis (28.44 cm). Only one QTL was detected in LG10, explaining 2.06% of the phenotypic variation. Unlike the QTL related to seed weight, the allele from the female parent increased the carpopodium length. In addition, the bushy plant architecture is a typical trait of plant type in V. unguiculata ssp. unguiculata, which was found to correlate with increased pod number per plant in cultivated dry grain cowpea (Bapna et al., 1972). Pod number per plant is another plant type trait studied in cowpea. It was reported that QTL regions of pod length (Qpl.zaas-3) overlaps the major QTL for pod number per plant (Qpn.zaas-3) (Xu et al., 2013), which may explain the tight correlation between the two traits (Bapna et al., 1972; Aggarwal et al., 1982).
Comparative Analysis between V. unguiculata and Its Closely Related Legume Species
The level of synteny between cowpea and the closely related legume species V. angularis was assessed. The Circos plot of the cowpea linkage map vs. V. angularis genome domestrated that some syntenic SNP locations were uncovered between the cowpea LGs and the V. angularis genome. When comparing the sequences of these QTL regions with reported gene sequences in NCBI databases by BLASTN, we found that two tags (M26270 and M26271) in Qctgw-2 regions showed a homologous domain with sequences of E3 ubiquitin protein ligase DRIP2-like (LOC106770573) in V. radiata. In a previous study, DRIP2 was reported to be a C3HC4 RING–domain protein interacting with the key transcription factor DREB2A and control concentration of DREB2A protein by regulating DREB2A degradation (Qin et al., 2008). In further analysis, it was documented that the DREB2A protein was involved in the seed development in Arabidopsis thaliana, because the seed yield of 35S:DREB2A CA-b mutant was lowered to 40% of the wild type of Arabidopsis thaliana (Sakuma et al., 2006). Therefore, the region of Qctgw-2, which was associated with the trait of thousand grain weight, may have candidate genes that control the seed weight of cowpea.
The SNP type was detected to be different between the two parents in the two tags (M26270 and M26271). In the M26270-SNP tag, the SNP nucleotide is “G” in the female parent, while it is “C” in the male parent. In the M26271-SNP tag, the SNP nucleotide is “C” in the female parent, while it is “A” in the male parent. Considering the phenotypic difference of the seed between the two cowpea parents, the different SNP markers of the parents suggested the feasibility of utilizing marker-assisted selection in breeding programs targeting seed variation in cowpea.
Author Contributions
LP and CC designed the experiments, pipelines of bioinformatics, created the mapping population and wrote the manuscript. ZW, NW, and SG performed the bioinformatics analyses. XY and RG planted the experimental materials and collected the phenotypic data. XY, QX, and YZ performed the Restriction-site associated DNA sequencing (RAD-seq) experiments.
Funding
This study was supported by the National Natural Science Foundation of China (no. 31501369), the Natural Science Foundation of Hubei province (no. 2013CFB213), the Wuhan Planning Project of Science and Technology (no. 2013021001010478), Teaching Research Project of Wuhan Education Bureau (no. 2015071), Wuhan, Hubei province, China, and the Research Foundation for Talented Scholars of Jianghan University (no. 2012027), Hubei Province, China.
Conflict of Interest Statement
The authors declare that the research was conducted in the absence of any commercial or financial relationships that could be construed as a potential conflict of interest.
Acknowledgments
We thank Prof. Chen Zeng (The George Washington University), Prof. Chengzhi Liang (Institute of Genetics and Development, Chinese Academy of Sciences), Prof. Jun Wang (Wuhan Botanical Garden, Chinese Academy of Sciences), Prof. Yi Ding (College of Life Sciences, Wuhan University) for their helpful suggestion on data analysis and English language correction.
Supplementary Material
The Supplementary Material for this article can be found online at: http://journal.frontiersin.org/article/10.3389/fpls.2017.01544/full#supplementary-material
Supplementary Figure 1. Construction of the current mapping population P1: the female parent (“Green pod cowpea”); P2: the male parent (“Xiabao II”).
Supplementary Figure 2. The mapped 17996 SNPs on the 11 LGs of cowpea.
Supplementary Figure 3. The paired SNP marker from the current cowpea linkage map and the Muñoz-Amatriaín et al. (2017) map.
Supplementary Figure 4. LOD value of QTLs of yield-related traits in cowpea (a) PL (pod length), (b) CL (carpopodium length), (c) GN (Grain number per pod), (d) TGW (Thousand grain weight).
Supplementary File 1. SNP positions on the 11 LGs of the genetic map in cowpea.
Supplementary File 2. RAD tags of all the 17996 mapped SNPs.
Supplementary File 3. Genome view of synteny between two cowpea linkage groups and common bean genome.
Supplementary File 4. The paired SNPs between two cowpea linkage groups.
Supplementary File 5. Comparison analysis between linkage map of cowpea and adzuki bean genome.
Supplementary File 6. Summary of candidate genes for yield-related QTL in cowpea.
Supplementary File 7. Phenotypic data of all the 170 samples of cowpea.
Supplementary Table 1. Statistics for the identified SNP marker types.
Supplementary Table 2. Summary of comparison analysis between mapped SNPs tags of V. unguiculata and V. angularis gnome. Chr, chromosome of Vigna angularis; LG, linkage group of Vigna unguiculata; No. of tags, number of tags.
References
Aggarwal, V. D., Natare, R. B., and Smithson, J. B. (1982). The relationship among yield and other characters in vegetable cowpea and the effect of different trellis management on pod yield. Trop. Grain Leg. Bull. 25, 8–14.
Allaby, R. (2010). Integrating the processes in the evolutionary system of domestication. J. Exp. Bot. 61, 935–944. doi: 10.1093/jxb/erp382
Andargie, M., Pasquet, R. S., Muluvi, G. M., and Timko, M. P. (2013). Quantitative trait loci analysis of flowering time related traits identified in recombinant inbred lines of cowpea (Vigna unguiculata). Genome 56, 289–294. doi: 10.1139/gen-2013-0028
Andriantahina, F., Liu, X., and Huang, H. (2013). Genetic map construction and quantitative trait locus (QTL) detection of growth-related traits in Litopenaeus vannamei for selective breeding applications. PLoS ONE 8:e75206. doi: 10.1371/annotation/80183e4b-b1b4-48cc-b307-865af97df0ce
Ankit, P., Kumar, S., and Jain, S. K. (2017). Inter-characters association studies for morphological, yield and yield attributes in the germplasm of French bean (Phaseolus vulgaris L.) in Tarai region of Uttarakhand, India. Legume Res. 40, 196–199. doi: 10.18805/lr.v0i0.7024
Baird, N. A., Etter, P. D., Atwood, T. S., Currey, M. C., Shiver, A. L., Lewis, Z. A., et al. (2008). Rapid SNP discovery and genetic mapping using sequenced RAD markers. PLoS ONE 3:e3376. doi: 10.1371/journal.pone.0003376
Bapna, C. S., Joshi, S. N., and Kabria, M. M. (1972). Correlation studies on yield and agronomic characters in cowpea. Indian J. Agron. 17, 321–324.
Barchi, L., Lanteri, S., Portis, E., Valè, G., Volante, A., Pulcini, L., et al. (2012). A RAD tag derived marker based eggplant linkage map and the location of QTLs determining anthocyanin pigmentation. PLoS ONE 7:e43740. doi: 10.1371/journal.pone.0043740
Cai, G., Yang, Q., Chen, H., Yang, Q., Zhang, C., Fan, C., et al. (2016). Genetic dissection of plant architecture and yield-related traits in Brassica napus. Sci. Rep. 6:21625. doi: 10.1038/srep21625
Catchen, J. M., Amores, A., Hohenlohe, P., Cresko, W., and Postlethwait, J. H. (2011). Stacks: building and genotyping loci de novo from short-read sequences. G3-Genes. Genom. Genet. 1, 171–182. doi: 10.1534/g3.111.000240
Chakravarti, A., Lasher, L. K., and Reefer, J. E. (1991). A maximum likelihood method for estimating genome length using genetic linkage data. Genetics 128, 175–182.
Chapman, M. A., Pashley, C. H., Wenzler, J., Hvala, J., Tang, S., Knapp, S. J., et al. (2008). A genomic scan for sunflower (Helianthus annuus). Plant Cell 20, 2931–2945. doi: 10.1105/tpc.108.059808
Chen, S., Huang, Z., Dai, Y., Qin, S., Gao, Y., Zhang, L., et al. (2013). The development of 7E chromosome-specific molecular markers for Thinopyrum elongatum based on SLAF-seq technology. PLoS ONE 8:e65122. doi: 10.1371/journal.pone.0065122
Chutimanitsakun, Y., Nipper, R. W., Cuestamarcos, A., Cistué, L., Corey, A., Filichkina, T., et al. (2011). Construction and application for QTL analysis of a restriction site associated DNA (RAD) linkage map in barley. BMC Genomics 12:4. doi: 10.1186/1471-2164-12-4
Das, S., Upadhyaya, H. D., Bajaj, D., Kujur, A., Badoni, S., Laxmi, et al. (2015). Deploying QTL-seq for rapid delineation of a potential candidate gene underlying major trait-associated QTL in chickpea. DNA Res. 22, 193–203. doi: 10.1093/dnares/dsv004
Davey, J. W., and Blaxter, M. L. (2010). RADSeq: next-generation population genetics. Brief. Funct. Genomics 9, 416–423. doi: 10.1093/bfgp/elq031
Davey, J. W., Hohenlohe, P. A., Etter, P. D., Boone, J. Q., Catchen, J. M., and Blaxter, M. L. (2011). Genome-wide genetic marker discovery and genotyping using next-generation sequencing. Nat. Rev. Genet. 12, 499–510. doi: 10.1038/nrg3012
Deokar, A. A., Ramsay, L., Sharpe, A. G., Diapari, M., Sindhu, A., Bett, K., et al. (2014). Genome wide SNP indentification in chickpea for use in development of a high density genetic map and improvement of chickpea reference genome assembly. BMC Genomics 15:708. doi: 10.1186/1471-2164-15-708
Doyle, J. J., and Doyle, J. L. (1987). A rapid DNA isolation procedure for small quantities of fresh leaf tissue. Phytochem. Bull. 19, 11–15.
Ehlers, J. D., and Hall, A. E. (1997). Cowpea (Vigna unguiculata L. Walp). Field Crops Res. 53, 187–204. doi: 10.1016/S.0378-4290(97)00031-2
FAOSTAT (2012). Final 2011 Data and Preliminary 2012 Data for 5 Major Commodity Aggregates (2012). FAOSTAT.
Gaur, R., Azam, S., Jeena, G., Khan, A. W., Choudhary, S., Jain, M., et al. (2012). High-throughput SNP discovery and genotyping for construction a saturated linkage map of chickpea (Cicer arietinum L.). DNA Res. 19, 357–373. doi: 10.1093/dnares/dss018
Gepts, P. (2004). Plant Breeding Reviews: Long-Term Selection: Crops, Animals, and Bacteria. Vol. 24. ed P Gepts, 1–44 (Springer).
Gonen, S., Lowe, N. R., Cezard, T., Gharbi, K., Bishop, S. C., and Houston, R. D. (2014). Linkage maps of the Atlantic salmon (Salmo salar) genome derived from RAD sequencing. BMC Genomics 5:166. doi: 10.1186/1471-2164-15-166
Gupta, S. K., Baek, J., Carrasquilla-Garcia, N., and Penmetsa, R. V. (2015). Genome-wide polymorphism detection in peanut using next-generation restriction-site-associated DNA (RAD) sequencing. Mol. Breed. 35:145. doi: 10.1007/s11032-015-0343-0
Hyten, D. L., Cannon, S. B., Song, Q., Weeks, N., Fickus, E. W., Shoemaker, R. C., et al. (2010). High-throughput SNP discovery through deep resequencing of a reduced representation library to anchor and orient scaffolds in the soybean whole genome sequence. BMC Genomics 11:38. doi: 10.1186/1471-2164-11-38
Isemura, T., Kaga, A., Tomooka, N., Shimizu, T., and Vaughan, D. A. (2010). The genetics of domestication of rice bean, Vigna umbellata. Ann. Bot. 106, 927–944. doi: 10.1093/aob/mcq188
Iwata, A., Greenland, C. M., and Jackson, S. A. (2013). Cytogenetics of legumes in the Phaseoloid clade. Plant Genome 6, 1–8. doi: 10.3835/plantgenome2013.03.0004
Kaga, A., Isemura, T., Tomooka, N., and Vaughan, D. A. (2008). The genetics of domestication of the adzuki bean (Vigna angularis). Genetics 178, 1013–1036. doi: 10.1534/genetics.107.078451
Kongjaimun, A., Kaga, A., Tomooka, N., Somta, P., Shimizu, T., Shu, Y., et al. (2012a). An SSR-based linkage map of yardlong bean (Vigna unguiculata (L.) Walp. subsp. unguiculata Sesquipedalis group) and QTL analysis of pod length. Genome 55, 81–92. doi: 10.1139/G11-078
Kongjaimun, A., Kaga, A., Tomooka, N., Somta, P., Vaughan, D. A., and Srinives, P. (2012b). The genetics of domestication of yardlong bean, Vigna unguiculata (L.) Walp. ssp. unguiculata cv.-gr. sesquipedalis. Ann. Bot. 109, 1185–1200. doi: 10.1093/aob/mcs048
Kongjaimun, A., Somta, P., Tomooka, N., Kaga, A., Vaughan, D. A., and Srinives, P. (2013). QTL mapping of pod tenderness and total soluble solid in yardlong bean [Vigna unguiculata (L.) Walp. subsp. unguiculata cv.-gr. sesquipedalis]. Euphytica 189, 217–223. doi: 10.1007/s10681-012-0781-2
Krzywinski, M., Schein, J., Birol, I., Connors, J., Gascoyne, R., Horsman, D., et al. (2009). Circos: an information aesthetic for comparative genomics. Genome Res. 19, 1639–1645. doi: 10.1101/gr.092759.109
Lu, K., Peng, L., Zhang, C., Lu, J., Yang, B., Xiao, Z., et al. (2017). Genome-wide association and transcriptome analyses reveal candidate genes underlying yield-determining traits in Brassica napus. Front. Plant Sci. 8:206. doi: 10.3389/fpls.2017.00206
Lucas, M. R., Diop, N. N., Wanamaker, S., Ehlers, J. D., Roberts, P. A., and Close, T. J. (2011). Cowpea–soybean synteny clarified through an improved genetic map. Plant Genome 4, 218–225. doi: 10.3835/plantgenome2011.06.0019
Lucas, M. R., Ehlers, J. D., Huynh, B. L., Diop, N. N., Roberts, P. A., and Close, T. J. (2013a). Markers for breeding heat-tolerant cowpea. Mol. Breed. 31, 529–536. doi: 10.1007/s11032-012-9810-z
Lucas, M. R., Huynh, B. L., Vinholes, P. D. S., Cisse, N., Drabo, I., Ehlers, J. D., et al. (2013b). Association studies and legume synteny reveal haplotypes determining seed size in Vigna unguiculata. Front. Plant Sci. 4:95. doi: 10.3389/fpls.2013.00095
Luo, H., Ren, X., Li, Z., Xu, Z., Li, X., Huang, L., et al. (2017). Co-localization of major quantitative trait loci for pod size and weight to a 3.7cM interval on chromosome A05 in cultivated peanut (Arachis hypogaea L.). BMC Genomics 18:58. doi: 10.1186/s12864-016-3456-x
Ma, X., Fu, Y., Zhao, X., Jiang, L., Zhu, Z., Gu, P., et al. (2016). Genomic structure analysis of a set of Oryza nivara introgression lines and identification of yield associated QTLs using whole genome resequencing. Sci. Rep. 6:27425. doi: 10.1038/srep27425
McDaniel, S. F., Willis, J. H., and Shaw, A. J. (2007). A linkage map reveals a complex basis for segregation distortion in an interpopulation cross in the moss Ceratodon purpureus. Genetics 176, 2489–2500. doi: 10.1534/genetics.107.075424
Mikołajczak, K., Ogrodowicz, P., Gudyś, K., Krystkowiak, K., Sawikowska, A., Frohmberg, W., et al. (2016). Quantitative trait loci for yield and yield-related traits in spring barley populations derived from crosses between European and Syrian cultivars. PLoS ONE 11:e0155938. doi: 10.1371/journal.pone.0155938
Muchero, W., Diop, N. N., Bhat, P. R., Fenton, R. D., Wanamaker, S., Pottorff, M., et al. (2009a). A consensus genetic map of cowpea [Vigna unguiculata (L) Walp.] and synteny based on EST-derived SNPs. Proc. Natl. Acad. Sci. U.S.A. 106, 18159–18164. doi: 10.1073/pnas.0905886106
Muchero, W., Ehlers, J. D., Close, T. J., and Roberts, P. A. (2009b). Mapping QTL for drought stress-induced premature senescence and maturity in cowpea [Vigna unguiculata (L.) Walp.]. Theor. Appl. Genet. 118, 849–863. doi: 10.1007/s00122-008-0944-7
Muchero, W., Ehlers, J., Close, T., and Roberts, P. (2011). Genic SNP markers and legume synteny reveal candidate genes underlying QTL for Macrophomina phaseolina resistance and maturity in cowpea [Vigna unguiculata (L) Walp.]. BMC Genomics 12:8. doi: 10.1186/1471-2164-12-8
Muñoz-Amatriaín, M., Mirebrahim, H., Xu, P., Wanamaker, S. I., Luo, M., Alhakami, H., et al. (2017). Genome resources for climate-resilient cowpea, an essential crop for food security. Plant J. 89, 1042–1054. doi: 10.1111/tpj.13404
Ouédraogo, J. T., Gowda, B. S., Jean, M., Close, T. J., Ehlers, J. D., Hall, A. E., et al. (2002). An improved genetic linkage map for cowpea (Vigna unguiculata L.) combining AFLP, RFLP, RAPD, biochemical markers, and biological resistance traits. Genome 45, 175–188. doi: 10.1139/g01-102
Peksen, A. (2004). Fresh pod yield and some pod characteristics of cowpea (Vigna unguiculata L. Walp.) genotypes from Turkey. Asia J. Plant Sci. 3, 269–273. doi: 10.3923/ajps.2004.269.273
Peterson, B. K., Weber, J. N., Kay, E. H., Fisher, H. S., and Hoekstra, H. E. (2012). Double digest RADseq: an inexpensive method for de novo SNP discovery and genotyping in model and non-model species. PLoS ONE 7:e37135. doi: 10.1371/journal.pone.0037135
Pfender, W. F., Saha, M. C., Johnson, E. A., and Slabaugh, M. B. (2011). Mapping with RAD (restriction-site associated DNA) markers to rapidly identify QTL for stem rust resistance in Lolium perenne. Theor. Appl. Genet. 122, 1467–1480. doi: 10.1007/s00122-011-1546-3
Pottorff, M., Li, G., Ehlers, J. D., Timothy, J., and Roberts, P. A. (2014a). Genetic mapping, synteny, and physical location of two loci for Fusarium oxysporum f. sp. tracheiphilum race 4 resistance in cowpea [Vigna unguiculata (L.) Walp]. Mol. Breed. 33, 779–791. doi: 10.1371/journal.pone.0041600
Pottorff, M., Wanamaker, S., Ma, Y. Q., Ehlers, J. D., Roberts, P. A., and Close, T. J. (2012a). Genetic and physical mapping of candidate genes for resistance to Fusarium oxysporum f. sp. tracheiphilum race 3 in cowpea [Vigna unguiculata (L.) Walp]. PloS ONE 7:e41600. doi: 10.1371/journal.pone.0041600
Pottorff, M., Ehlers, J. D., Fatokun, C., Roberts, P. A., and Close, T. J. (2012b). Leaf morphology in cowpea [Vigna unguiculata (L.) Walp]: QTL analysis, physical mapping and identifying a candidate gene using synteny with model legume species. BMC Genomics 13:234. doi: 10.1186/1471-2164-13-234
Pottorff, M., Roberts, P. A., Close, T. J., Lonardi, S., Wanamaker, S., and Ehlers, J. D. (2014b). Identification of candidate genes and molecular markers for heat-induced brown discoloration of seed coats in cowpea [Vigna unguiculata (L.) Walp]. BMC Genomics 15:328. doi: 10.1186/1471-2164-15-328
Qin, F., Sakuma, Y., Tran, L. S. P., Maruyama, K., Kidokoro, S., Fujita, Y., et al. (2008). Arabidopsis DREB2A-interacting proteins function as RING E3 ligases and negatively regulate plant drought stress–responsive gene expression. Plant Cell 20, 1693–1707. doi: 10.1105/tpc.107.057380
Quaye, W., Adofo, K., Madode, Y. E., and Abizari, A. R. (2009). Exploratory and multidisciplinary survey of the cowpea network in Tolon-Kumbungu district of Ghana: a food sovereignty prospective. African J. Agric. Res. 4, 311–320.
Raman, H., Raman, R., Coombes, N., Song, J., Prangnell, R., Bandaranayake, C., et al. (2016). Genome-wide association analyses reveal complex genetic architecture underlying natural variation for flowering time in canola. Plant Cell Environ. 39, 1228–1239. doi: 10.1111/pce.12644
Raman, H., Raman, R., Kilian, A., Detering, F., Carling, J., Coombes, N., et al. (2014). Genome-wide delineation of natural variation for pod shatter resistance in Brassica napus. PLoS ONE 9:e101673. doi: 10.1371/journal.pone.0101673
Sakuma, Y., Maruyama, K., Osakabe, Y., Qin, F., Seki, M., Shinozaki, K., et al. (2006). Functional analysis of an Arabidopsis transcription factor, DREB2A, involved in drought responsive gene expression. Plant Cell 18, 1292–1309. doi: 10.1105/tpc.105.035881
Salvi, S., and Tuberosa, R. (2015). The crop QTLome comes of age. Curr. Opin. Biotech. 32, 179–185. doi: 10.1016/j.copbio.2015.01.001
Sanner, M. F. (1999). Python: a programming language for software integration and development. J. Mol. Graph. Model 17, 57–61.
Schmutz, J., McClean, P., Mamidi, S., Wu, G., Cannon, S., Grimwood, J., et al. (2014). A reference genome for common bean and genome-wide analysis of dual domestications. Nat. Genet. 46, 707–713. doi: 10.1038/ng.3008
Singh, B. B. (2002). “Recent genetic studies in cowpea,” in challenges and Opportunities for Enhancing Sustainable Cowpea Production, eds C. A. Fatokun, S. A. Tarawali, B. B. Singh, P. M. Kormawa, and M. Tamo (Ibadan: International Institute of Tropical Agriculture, 2002), 3–13.
Smýkal, P., Coyne, C. J., Ambrose, M. J., Maxted, N., Schaefer, H., Blair, M. W., et al. (2015). Legume crops phylogeny and genetic diversity for science and breeding. Crit. Rev. Plant Sci. 4, 43–104. doi: 10.1080/07352689.2014.897904
Tosti, N., and Negri, V. (2005). On-going on-farm microevolutionary processes in neighbouring cowpea landraces revealed by molecular markers. Theor. Appl. Genet. 110, 1275–1283. doi: 10.1007/s00122-005-1964-1
Ubi, B. E., Mignouna, H., and Thottappilly, G. (2000). Construction of a genetic linkage map and QTL analysis using a recombinant inbred population derived from an intersubspecific cross of cowpea (Vigna unguiculata (L.) Walp.). Breed. Sci. 50, 161–172. doi: 10.1270/jsbbs.50.161
Van, O. H., Stam, P., Visser, R. G., and Van, H. J. (2005). RECORD: a novel method for ordering loci on a genetic linkage map. Theor. Appl. Genet. 112, 30–40. doi: 10.1007/s00122-005-0097-x
Van Ooijen, J. W. (2006). JoinMap 4. Software for the Calculation of Genetic Linkage Maps in Experimental Populations. Wageningen: Kyazma BV. 33.
Vasconcelos, E. V., de Andrade Fonsêca, A. F., Pedrosa-Harand, A., de Andrade Bortoleti, K. C., Benko-Iseppon, A. M., Da Costa, A. F., et al. (2015). Intra- and interchromosomal rearrangements between cowpea Vigna unguiculata (L.) Walp.. and common bean (Phaseolus vulgaris L.) revealed by BAC-FISH. Chromosome Res. 23, 253–266. doi: 10.1007/s10577-014-9464-2
Voorrips, R. E. (2002). MapChart: software for the graphical presentation of linkage maps and QTLs. J. Hered. 93, 77–78. doi: 10.1093/jhered/93.1.77
Wang, N., Fang, L., Xin, H., Wang, L., and Li, S. (2012). Construction of a high-density genetic map for grape using next generation restriction-site associated DNA sequencing. BMC Plant Biol. 12:148. doi: 10.1186/1471-2229-12-148
Wang, S., Basten, J., and Zeng, Z. (2012). Windows QTL Cartographer 2.5. North Carolina State University, Department of Statistics. (Raleigh, NC).
Wu, K., Liu, H., Yang, M., Ye, T., Ma, H., Wu, W., et al. (2014). High-density genetic map construction and QTLs analysis of grain yield-related traits in sesame (Sesamum indicum L.) based on RAD-Seq techonology. BMC Plant Biol. 14:7. doi: 10.1186/s12870-014-0274-7
Wu, Y., Bhat, P. R., Close, T. J., and Lonardi, S. (2008). Efficient and accurate construction of genetic linkage maps from the minimum spanning tree of a graph. PLoS Genet. 4:e1000212. doi: 10.1371/journal.pgen.1000212
Xu, P., Wu, X., Muñoz-Amatriaín, M., Wang, B., Wu, X., Hu, Y., et al. (2016). Genomic regions, cellular components and gene regulatory basis underlying pod length variations in cowpea (V. unguiculata L. Walp). Plant Biotechnol. J. 15, 547–557. doi: 10.1111/pbi.12639
Xu, P., Wu, X., Wang, B., Hu, T., Lu, Z., Liu, Y., et al. (2013). QTL mapping and epistatic interaction analysis in asparagus bean for several characterized and novel horticulturally important traits. BMC Genet. 14:4. doi: 10.1186/1471-2156-14-4
Xu, P., Wu, X., Wang, B., Liu, Y., Ehlers, J. D., Close, T. J., et al. (2011). A SNP and SSR based genetic map of asparagus bean (Vigna unguiculata ssp. sesquipedialis) and comparison with the broader species. PLoS ONE 6:e15952. doi: 10.1371/journal.pone.0015952
Zhao, W., Wang, X., Hao, W., Tian, J., Li, B., Li, C., et al. (2016). Genome-wide identification of QTL for seed yield and yield-related traits and construction of a high-density consensus map for QTL comparison in Brassica napus. Front. Plant Sci. 7:17. doi: 10.3389/fpls.2016.00017
Zhou, X., Xia, Y., Ren, X., Chen, Y., Huang, L., Huang, S., et al. (2014). Construction of a SNP-based genetic linkage map in cultivated peanut based on large scale marker development using next-generation double-digest restriction-site-associated DNA sequencing (ddRADseq). BMC Genomics 15:351. doi: 10.1186/1471-2164-15-351
Keywords: Vigna unguiculata, RAD sequencing, single nucleotide polymorphisms, linkage mapping, pod yield-related traits, quantitative trait loci
Citation: Pan L, Wang N, Wu Z, Guo R, Yu X, Zheng Y, Xia Q, Gui S and Chen C (2017) A High Density Genetic Map Derived from RAD Sequencing and Its Application in QTL Analysis of Yield-Related Traits in Vigna unguiculata. Front. Plant Sci. 8:1544. doi: 10.3389/fpls.2017.01544
Received: 14 April 2017; Accepted: 23 August 2017;
Published: 07 September 2017.
Edited by:
Harsh Raman, NSW Department of Primary Industries, AustraliaReviewed by:
Daniela Marone, Centre of Cereal Research-CREA-CER-Foggia, ItalyJiaqin Shi, Chinese Academy of Agricultural Sciences, China
Copyright © 2017 Pan, Wang, Wu, Guo, Yu, Zheng, Xia, Gui and Chen. This is an open-access article distributed under the terms of the Creative Commons Attribution License (CC BY). The use, distribution or reproduction in other forums is permitted, provided the original author(s) or licensor are credited and that the original publication in this journal is cited, in accordance with accepted academic practice. No use, distribution or reproduction is permitted which does not comply with these terms.
*Correspondence: Lei Pan, leipan@jhun.edu.cn
Chanyou Chen, ccy@jhun.edu.cn