 María de la O González1
 Francisco Jareño
- 1Department of Economic Analysis and Finance, University of Castilla-La Mancha, Albacete, Spain
- 2Department of Economics and Finance, Brunel University, Uxbridge, UK
We examine investor behavior under interest and inflation risk in different scenarios. To that end, we analyze the relation between stock returns and unexpected changes in nominal and real interest rates and inflation for the US stock market. This relation is examined in detail by breaking the results down from the US stock market level to sector, sub-sector, and to individual industries as the ability of different industries to absorb unexpected changes in interest rates and inflation can vary by industry and by contraction and expansion sub-periods. While most significant relations are conventionally negative, some are consistently positive. This suggests some relevant implications on investor behavior. Thus, investments in industries with this positive relation can form a safe haven from unexpected changes in real and nominal interest rates. Gold has an insignificant beta during recessionary conditions hinting that Gold can be a safe haven during recessions. However, Gold also has a consistent negative relation to unexpected changes in inflation thereby damaging the claim that Gold is a hedge against inflation.
Introduction
A lot of previous financial research assumes that investors are rational agents, so they try to optimize wealth and minimize risk (Campbell, 2006). Thus, the study of two relevant sources of risk such as interest and inflation rate movements is very interesting for deepening on the analysis of investor behavior as well as for portfolio managers. Furthermore, the recent financial crisis confirms that investor behavior changes over time (Ferrando et al., 2015), so this analysis is really challenging to achieve a better understanding of investor behavior. Moreover, according to Blackburn et al. (2014), investor behavior may depend on different factors that affect the investment or trading decision. Therefore, aspects such as the sector that traded stock belongs to and the business cycle—among others—apparently impact on investment behavior.
The US stock market is a world reference market so unexpected changes in US nominal interest rates can affect stock markets worldwide. Moreover, being the most active equity market with the longest series of detailed quality data, the US stock market is a natural laboratory to study the relationships between unanticipated inflation and its co-dependents, unanticipated changes in real, and nominal interest rates, in detail by sector and by varying economic conditions. It is important to examine these relations by sector because there is no reason to expect that individual sector returns are always inversely related to unanticipated changes in inflation and real and nominal interest rates. For instance, according to the flow through model of Estep and Hanson (1980), the impact of inflation on stock prices can be neutral if the firm can pass on inflationary price increases to consumers. If so, then an investment in stocks can serve as a safe haven for investors as stock prices rise with inflation. Additionally, the impact of unanticipated real and nominal interest rate changes can vary by sector depending upon the characteristic leverage and competitive structure of the sector. Moreover, it is also important to examine these relations by time period as conventionally inverse relations can turn positive as economic conditions change. For instance, it could be that an investment in cyclical industries such as the Industrial sector can have a positive relation with unanticipated inflation during boom economics conditions that turns negative during recessions.
Figure 1 presents the evolution of the US stock market index (S&P500) and the 10-year Treasury bond yield from September 1989 to February 2014. On the one hand, the US stock market exhibits an increasing trend during most of the period, only interrupted by the dot-com bubble burst in 2000 and the global financial crisis at the end of 2007 (Bartram and Bodnar, 2009). On the other hand, the 10-year Treasury bond yield shows a decreasing tendency. So at first glance, we observe clear evidence of the inverse association between US stock market returns and changes in the nominal interest rate. However, we raise the question of whether this inverse relation is consistent by sub-period and whether this inverse association is maintained when we break down unexpected changes in the nominal interest rate into unexpected changes in the real interest and inflation rates, especially when we examine these relations by sector, industry, and by economic condition. Thus, the crucial aim of this paper is to analyze the details of the relation between returns on US stocks and unexpected changes in nominal and real interest rates and inflation, because the investor behavior may be quite different depending on the sector, industry, and the state of the economy.
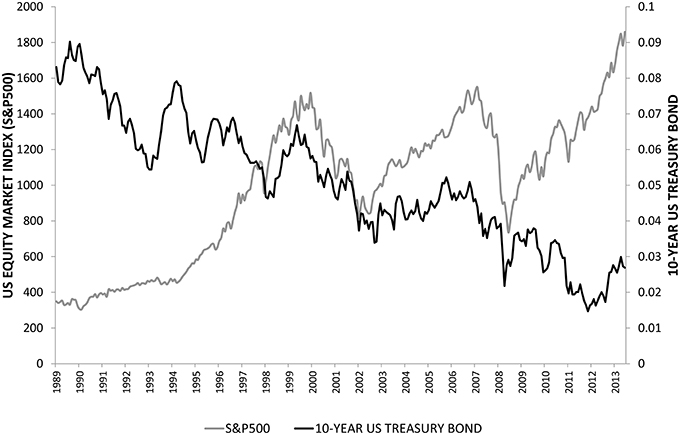
Figure 1. Evolution of the US equity market index (S&P 500) and the 10-year US Treasury Bond yield from September 1989 to February 2014.
The literature examines the sensitivity of stock returns to unexpected changes in nominal interest rates finding a negative and significant relationship between stock returns and unanticipated changes in nominal interest rates. See O'Neal (1998), Fraser et al. (2002), Hevert et al. (1998a,b), Tessaromatis (2003), Jareño (2006, 2008), Ferrer et al. (2010), Korkeamäki (2011), Ferrando et al. (2015), and Campos et al. (2016) as examples. Some have examined these relations for the overall stock market (Elyasiani and Mansur, 1998; Oertmann et al., 2000; Shamsuddin, 2014) while others have mainly studied these relations for financial companies (Flannery and James, 1984; Fraser et al., 2002; Staikouras, 2003, 2006; Au Yong and Faff, 2008; Drehmann et al., 2010; Ballester et al., 2011; Memmel, 2011; Bessler and Kurmann, 2012; Abdymomunov and Gerlach, 2014) or for Utilities (Sweeney and Warga, 1986). Others have deepened the analysis by decomposing unexpected changes in nominal interest rates into unexpected changes in real interest and unexpected inflation rates (Tessaromatis, 2003; Jareño, 2006, 2008; Jareño et al., 2016).
This paper is one of the few to estimate the stock return response to unexpected shocks in the nominal interest rate and its components, unexpected changes in the inflation rate, and the residual that we interpret as unexpected changes in the real interest rate. Moreover, this study tries to approximate investor behavior analysing sector stock response to changes in sources of risk in different scenarios. To accomplish this task, we use an extension of the Stone (1974) two-factor model proposed in Jareño (2006) and, partly, in Jareño (2008), and Jareño and Navarro (2010). Using this approach, we make two contributions. First, we analyze these relations at the sector, sub-sector and industry level. Thus, we estimate not only the relation between stock returns and unexpected nominal interest rate changes but also the relations between stock returns and unexpected changes in the real interest and inflation rates by sector, sub-sector, and individual industries. Second, we examine a long time period, from September 1989 to February 2014. This period encompasses a wide variety of economic conditions, including one of the longest expansion periods for the US economy, one of the most severe credit contractions in living memory and several recessions. This sample variation in economic conditions allows us to explore the stability of these relations overall, and by sector, sub-sector, and industry. This detailed investigation into the stability of these relations allows us to search for special industries whose response to unexpected changes in nominal and real interest rates, and unanticipated inflation, is consistent, either positive or negative, thereby providing valuable information for investors and policy makers who have to consider these important sources of systematic risk.
In general, we find that investor behavior seems to be quite different over time (according to the business cycle) and by sector. Specifically, some financial (as well as non-financial) sectors have insignificant relations and we even find some contrary results when examining the relations by sector, sub-sector, and industry. Some industries have a consistent significant positive relation between stock returns and unexpected changes in real and nominal interest rates. Interestingly, Gold, among others, has a negative relation to unanticipated inflation in the overall sample and in the contraction and expansion sub-periods suggesting that it is exposed to inflation risk.
The rest of the paper is structured as follows. Section Materials and Methods present the main methodology used in this research. Section Data describes the data and variables included in our empirical analysis. Section Empirical Results comments on the results of our research, and finally, Section Discussion makes concluding remarks.
Materials and Methods
In this section, we explain how we measure unexpected changes in the nominal rate of interest. Then we explain how we measure the expected rate of inflation that is used as an input to decompose the unexpected change in nominal interest rates into unexpected changes in inflation and unexpected changes in the real rate of interest. Finally, we describe how we classify the state of the economy into expansion and non-expansion (contraction) states.
Unexpected Changes in Nominal Interest Rates
Sweeney and Warga (1986), Kane and Unal (1988), Bartram (2002), Oertmann et al. (2000), and Olugbode et al. (2014) amongst others use changes in long-term interest rates as a proxy for unexpected changes in nominal interest rates because long term interest rates incorporate the expectations of economic agents and because long term interest rates are important as they determine the cost of corporate borrowing. Thus, long term interest rates strongly influence the investment decisions of firms and therefore affect the value of companies. Alternative proxies for unexpected changes in nominal interest rates such as forecast error of an empirical ARIMA process for long term interest rates or survey data on the US federal funds rate (Benink and Wolff, 2000) have their own advantages and disadvantages (Froot, 1989) so no one proxy dominates. Therefore, we follow common practice and use the first difference of the long-term interest rate as a proxy for unexpected changes in the nominal interest rate.
The returns on Treasury securities for different maturities are usually used as risk-free interest rate proxies because Treasury securities are commonly assumed to have no default risk. Of the long term maturities, 10 years tends to be the most liquid and accurately estimated as the Fed has continuously auctioned 10 year Treasury notes throughout our sample period so there is always a recently issued 10-year note that the Fed can use to accurately estimate 10 year treasury yields. Therefore, we use changes in the 10-year US Treasury bond yields, as reported by the Federal Reserve Bank of New York, as our approximation for unexpected changes in the nominal interest rate. We repeat our empirical results using 3-month, 1-, 3-, and 5- year US Treasury bond yield changes and find the results are very similar. These are available from the corresponding author upon request.
Expected Inflation Rates
Although, previous studies have applied a variety of methodologies to estimate expected inflation rates, a lot of related, and crucial papers (Schwert, 1981; Pearce and Roley, 1988; Fraser et al., 2002; Mestel and Gurgul, 2003; Jareño, 2008), use simple time series ARIMA models to estimate the expected inflation component. These studies assume that the current total inflation rate (πt) can be broken down into the sum of its expected () and unexpected () components. Thus, the expected component is estimated using ARIMA models thereby assuming that this component depends upon its own past series. Then the forecast errors from the ARIMA model form our estimate of unanticipated changes in inflation. We also use ARIMA models because authors, such as Joyce and Read (2002) and Browne and Doran (2005), observe similar results using ARIMA and other alternative and more sophisticated procedures. These models, in contrast to structural models, do not need additional information for doing forecasts, because they use lagged inflation values. We have repeated this procedure until the end of sample, with one-step-ahead forecast, obtaining the expected component of inflation rate.
We use the Akaike information criterion (AIC) to choose the ARMA (1, 0) process to predict the month-to-month annualized inflation rate. Therefore, we suppose short-sighted expectations as in Leiser and Drori (2005). Unit root tests confirm that inflation rate is a I(1) series, so this result is consistent with short-sightedness expectations. That is,
In other words, expectations are formed in part [ρ according to the ARMA(1, 0) process], as of time t for the expected rate of annualized inflation π over the next month t+1 based on the most recent monthly annualized inflation rate that evolved from t−1 to t.
Unexpected Changes in the Real Rate of Interest
As mentioned above, we use changes in the 10-year US Treasury bond yield as our approximation for unexpected changes in the nominal interest rate. To obtain unexpected changes in the real rate of interest we assume the Fisher approximation and subtract the expected rate of inflation Et(πt, t+1) as estimated above from the nominal rate of interest it.
Then, changes in the above relation form our approximation for unexpected changes in in the real rate of interest.
The Stone (1974) Two-Factor Model
The literature focuses mainly on the Stone (1974) two-factor model to measure the interest rate sensitivity of stock returns (Lynge and Zumwalt, 1980; Sweeney and Warga, 1986; O'Neal, 1998; Bartram, 2002; Fraser et al., 2002; Soto et al., 2005; Staikouras, 2005; Jareño, 2006, 2008; Ferrer et al., 2010). We use an extension of the Stone (1974) model that decomposes unexpected changes in the nominal interest rate into unexpected changes in real interest and inflation components in the nature of Tessaromatis (2003), Cornell (2000), Jareño (2006, 2008). However, all of these studies do not examine any sector other than the financial or the utility sector. Thus, we propose an analysis at the sector, sub-sector and industry level using an extension of the Stone (1974) model.
Typically, studies of interest rate sensitivity of stock returns start from the Capital Asset Pricing Model CAPM augmented by unexpected changes in nominal interest rates (Stone, 1974) to better explain the stochastic process that generates security returns. Therefore, adjusting Arango et al.'s (2002) model of stock returns by sector, sub-sector and industry we have,
where rjt is the stock (sector, sub-sector or industry) j return in month t, βj shows the stock sensitivity to market movements, rmt is the return on the market portfolio, represents unexpected changes in nominal interest rates, and, finally, εjt is the error term.
We extend the Stone (1974) model by applying the Fisher approximation to break down nominal interest rates it into real interest rt and expected inflation Et(πt, t+1) components. Taking the first difference in interest rates as unexpected changes in nominal interest rates at time t, we then have unexpected changes in the nominal interest rate as a linear combination of unexpected changes in the real rate Δrt and unexpected changes in the anticipated inflation rate ΔEt(πt, t+1). Thus, the second model estimated in this paper is the following:
where rjt is the stock (sector, sub-sector or industry) j return in month t, βj shows the stock sensitivity to market movements, rmt is the return on the market portfolio, Δrt represents unexpected changes in real interest rates, shows shocks in the expected inflation rate (hereafter, unexpected changes in the inflation rate that we later explain is orthogonalized), and finally, εjt is the error term.
To avoid possible high collinearity between the explanatory variables, the financial economics literature uses some orthogonalization procedure. In Table 1A we observe a high, significant correlation between unexpected changes in real interest and unexpected changes in the inflation rate (about −83%). We also find two other significant correlations that we do not need to orthogonalize as they do not simultaneously occur in our model; the first is between changes in real and nominal interest rates (about 44%) and the second is between unexpected changes in inflation and nominal interest rates (about 15%). So, as in Lynge and Zumwalt (1980), Flannery and James (1984), Sweeney (1998), and Fraser et al. (2002), we orthogonalize the relation between unexpected changes in the real interest rate and unexpected changes in the inflation rate by regressing changes in the unexpected inflation rate on a constant and changes in the unexpected real interest rate using ordinary least squares regression. The residual from this regression forms our proxy for the orthogonalized unexpected change in the inflation rate. Thus, the effect of each factor is isolated and the movement that remains is captured by the residuals.
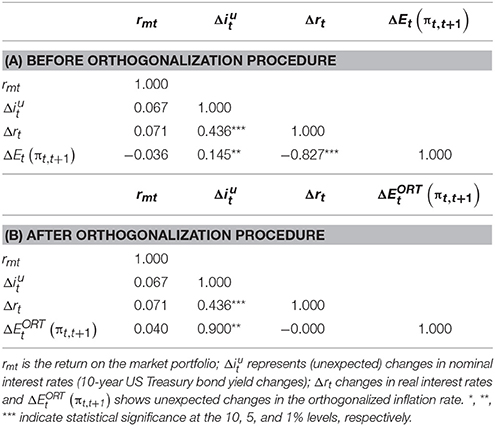
Table 1. Correlation matrix between explanatory variables included in the model.
We choose this orthogonalization method because this is in line with the aim of this research, which is to estimate the response of stock (sector, sub-sector and industry) returns to unanticipated changes in nominal interest rates and its' decomposition, unexpected changes in real, and unexpected changes in inflation rates. Therefore, we analyze direct and indirect effects of interest rate shocks and obtain clear economic intuition. We find similar results to those obtained without orthogonalizing and also very similar results when we interchange the dependent and independent variables. Thus, our results seem to be robust, since this orthogonalization process evidently only eliminates the correlation between variables.
The final correlations between explanatory variables included in our model are reported in Table 1B. Notice that the correlation between unexpected changes in the real interest rate and unexpected changes in the inflation rate is zero.
State of the Economy
Like Veronesi (1999), Knif et al. (2008), and Díaz and Jareño (2009, 2013), we assume that the stock market response to unanticipated changes in nominal and real interest and inflation rates depends on the business cycle. Therefore, we need to classify the state of the economy. We follow the National Bureau of Economic Research (NBER's) classification, but this is only available until June 2009. Therefore, we extend this classification by examining the evolution of the annual growth of the US GDP after seasonal adjustment (as in Díaz and Jareño, 2013) in order to identify expansion and non-expansion (contraction) months. Specifically, a contraction begins with a recession as defined as two or more quarters of negative seasonally adjusted growth. A contraction continues throughout the recovery period and converts to an expansion only when seasonally adjusted GDP rises above the peak of GDP just prior to the recession.
Table 2 and Figure 2 show the business cycle timing. This classification follows NBER announcements for the most part and divides the state of the economy in expansion and contraction months. During the 292 month period, from November 1989 to February 2014, the US Economy was in an expansion during 237 months and in contraction during 55 months. So, there were three contraction and four expansion periods.
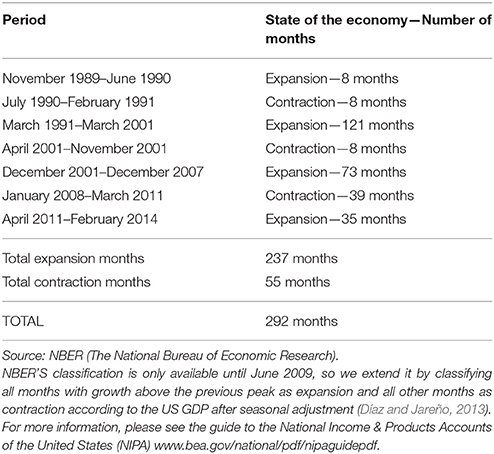
Table 2. US business cycle expansions and contractions.
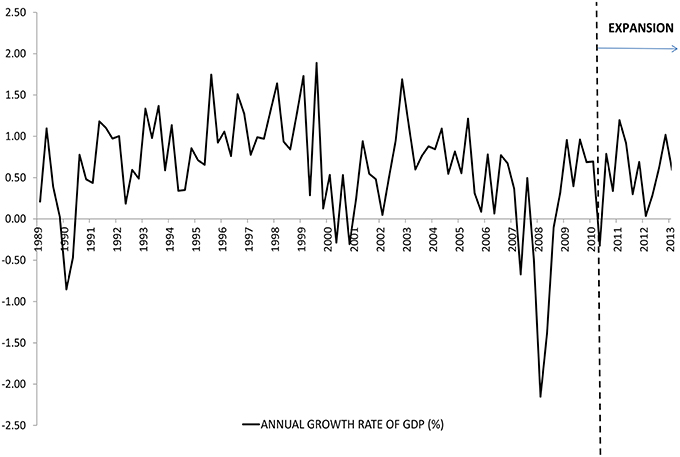
Figure 2. Evolution of the annual growth rate of GDP (%) after seasonal adjustment.
Data
Our data set includes monthly indices for the US sector, sub-sector, and industries from November 1989 to February 2014, 292 monthly observations in all. The US sector index is based on the “Global Industry Classification Standard” GICS as developed by Morgan Stanley Capital International and Standard &Poor's. This classification aims to enhance the investment research and asset management process for financial professionals worldwide. Also, GICS is the result of numerous discussions with asset owners, portfolio managers and investment analysts. Finally, this classification is designed to respond to the global financial community's need for an accurate, complete, and standard industry definition. The sub-sector and individual industry indices are refinements of the GICS compiled by and obtained from Bloomberg. We also use the monthly S&P500 market index from Bloomberg and the monthly 10-year US Treasury yields from the Federal Reserve. Finally, we use the monthly expected inflation rates as explained in Section Expected Inflation Rates.
The Supplementary Material Table A reports the sector, sub-sector, and industry classifications according to the GICS combined with the Bloomberg refinements. In this paper we analyze 10 sectors, subdivided into 33 sub-sectors, and further refined into 82 industries. The largest US industry sectors by market capitalization (as of April 29, 2010), are Information Technology (19.02%), and Financials (16.58%). There are five other noteworthy sectors with weights around 10%, Consumer Discretionary, Consumer Staples, Energy, Health Care, and Industrials.
Table 3 reports the monthly returns for the S&P500 Index and the US sector indices. The mean and median returns for all sectors and the market are positive and fairly large; the mean monthly return is 58 basis points or 7.2% on an annual basis. Changes in the 10-year US bond yield, our proxy for the unexpected changes in the nominal interest rate, are negative as are unexpected changes in real interest and inflation rates, reflecting the decreasing trend of long-term interest rates as shown earlier in Figure 1. The most volatile sector is Information Technology, followed by Financials. Also, sector and market stock return volatilities are higher than nominal and real interest and inflation rate volatilities. Except for the real rate of interest, all the variables exhibit negative skewness and all variables have excess kurtosis, especially for unexpected changes in the inflation rate. The Jarque-Bera test rejects the null hypothesis of Normal distribution in all cases at the 5% significance level except for unexpected changes in nominal interest rates.
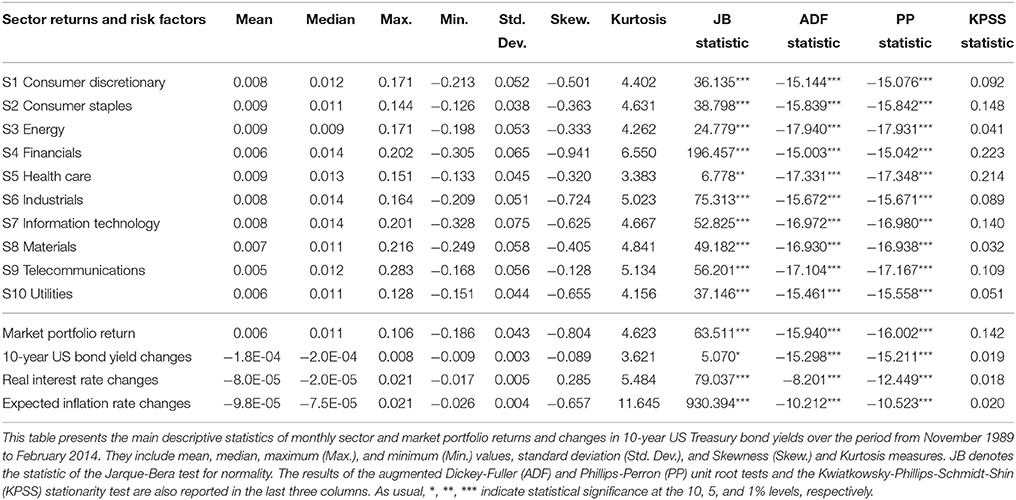
Table 3. Descriptive statistics of sector and market returns, 10-year US Treasury bond yield changes (nominal interest rates), and real interest and expected inflation rate changes.
We examine the stationary of the variables in the second part of Table 3 using the augmented Dickey-Fuller (ADF) and Phillips-Perron (PP) unit root tests and the Kwiatkowski-Phillips-Schmidt-Shin (KPSS) stationary test. Similar to Jareño (2008), Czaja et al. (2009), and Ballester et al. (2011) these tests corroborate that the series of sector and stock market portfolio returns, real interest rate, and expected inflation rates, are stationary.
In order to obtain continuously compounded returns for industry sectors, sub-sectors, and industries rjt, we compute the log relatives using the closing index of the last day of the current month Pjt relative to the closing index of last day of the previous month Pjt−1. That is,
To avoid income smoothing, we use index values net of dividends. We use the S&P500 index as a suitable representative of the US stock market and compute the log relative return in an analogous way as in (3) to obtain market log-returns.
Empirical Results
We estimate two models, (1) examines the relation between stock returns and unanticipated changes in nominal interest rates and (2) estimates the relation between stock returns and unanticipated changes in real interest and inflation rates. Both models are applied separately by sector, sub-sector, and industry and are estimated throughout the sample period and during expansion and contraction economic sub-periods from September 1989 to February 2014. We estimate models (1) and (2) separately using the “seemingly unrelated regression” SUR technique (Zellner, 1962) for each of the sector, sub-sector, and industry samples, six SUR regressions in all, thereby taking into account possible contemporaneous correlation in the error terms across sectors, sub sectors, and industries as well as heteroskedasticity.
Results at the Sector Level
We regress models (1) and (2) at the sector level and we report the results in Table 4. Table 4A reports the results for the entire sample period and Tables 4B,C report the results for the contraction and expansion sub-periods, respectively. The adjusted R squares of both models are very similar where for model 1, the adjusted R square ranges between about 65% for Information Technology, and about 24% for Utilities. All sectors exhibit a positive and significant market beta for both models overall and in the contraction and expansion sub-periods. While the betas are different in the contraction and expansion sub-periods, there is no discernible pattern to these differences. The beta coefficients are nearly the same by sector for the two models. For the overall period, the beta coefficients vary between the least risky Utilities 0.47 to the most risky Information Technology sector 1.38.
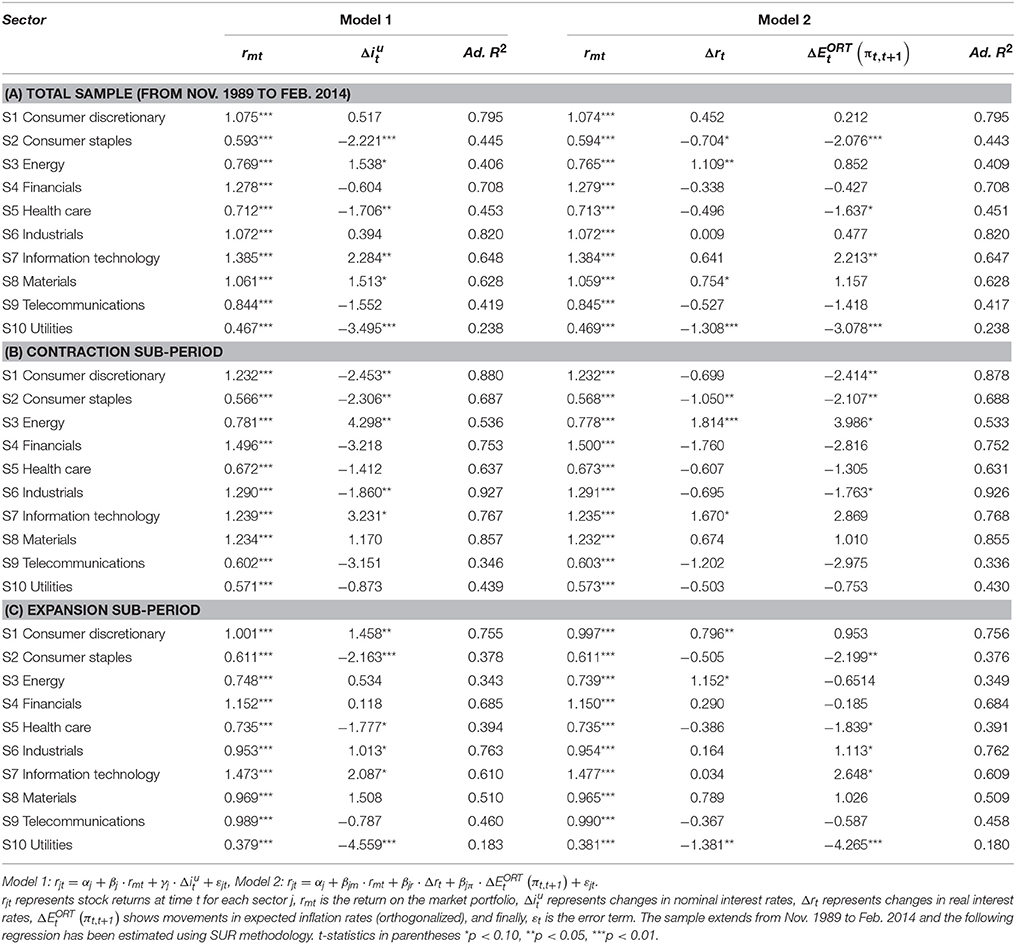
Table 4. Coefficients of sector stock returns to variations in nominal interest rates (Model 1) and real interest and expected inflation rates (Model 2).
Looking at model 1 for the overall sample period, the results confirms a noteworthy relationship between sector stock returns and unexpected changes in nominal interest rates as 6 of the 10 sectors have a statistically significant coefficient. Interestingly, the sign of this relationship is not always negative. Consumer Staples, Health Care, and Utilities are conventionally negative but Energy and Materials are marginally positive and Information Technology is significantly positive. Clearly, the positive coefficient for Information Technology is not due to mere chance. Moreover, the relation between stock returns and unexpected changes in nominal rates for the Information Technology sector remains significantly positive for the contraction and expansion sub-periods. This suggests that investors who seek protection from unanticipated interest rate changes can view an investment in a portfolio of Information Technology stocks as a natural hedge against interest rate risk.
Meanwhile, the conventionally negative relation between stock returns and unexpected changes in nominal interest rates for Consumer Staples, Health Care, and Utilities remain negative for the recession and expansion sub-periods but only the Consumer Staples coefficient remains highly significant in both sub-periods. Clearly, an investment in the Consumer Staples sector is subject to a significant amount of interest rate risk. Finally, there are two sectors without any significant relation between stock returns and unexpected changes in nominal interest rates for the entire sample but show significant coefficients, with opposite signs, for the contraction and expansion sub-periods. Specifically, Consumer Discretionary, and Industrials have the conventional inverse relation during contraction which turns positive during expansion suggesting that firms in these industries can pass on additional financing costs when economic conditions are robust.
When decomposing unexpected changes in the nominal rate of interest into unexpected changes in the real rate of interest and unexpected changes in the inflation rate (model 2), we discover comparable results for unanticipated changes in the real rate of interest but in this case, there are just four rather than six sectors that are statistically significant. Consumer Staples and Utilities have a significant inverse relation between stock returns and unexpected changes in the real rate of interest whereas Energy and Materials have a significant positive relation. However, none of these relations remains consistently significant and of the same sign for the contraction and expansion sub-periods with the exception of Energy. Even then the positive coefficient in the expansion sub-period is only marginally significant.
Similarly, the signs of the relation between stock returns and unanticipated inflation are not always negative. Specifically, we find significant negative coefficients for Consumer Staples, Health Care, and Utilities and one positive relation for Information Technology. However, only Consumer Staples has a consistent inverse relation for both economic sub-periods suggesting that unexpected changes in inflation are an important source of risk for investments in the Consumer Staples sector. Interestingly, stock returns in the Industrials sector are directly related to unanticipated inflation in expansion sub-period but are inversely related to unanticipated inflation in contraction sub-period suggesting that firms in this sector can pass on unexpected inflationary costs during robust economic conditions but are less able to do so during harder economic times.
In summary, we find that when there are significant relations between stock returns and unanticipated changes in nominal interest rates and their components, unanticipated changes in the real rate of interest and inflation, these relations are most commonly negative. The Consumer Staples industry sector shows this tendency most strongly as the relation between stock returns and unanticipated changes in the nominal interest rate as well as unanticipated changes in the inflation rate are significantly negative overall and in the contraction and expansion sub-periods. Even the relation between stock returns and unexpected changes in the real rate is negative but significantly so only for the contraction sub-period. Meanwhile we observe the contrary positive relation more rarely. The clearest example is the Information Technology sector. Specifically, while all the significant relations between stock returns in the Information Technology sector and unanticipated changes in nominal interest rate, real rate and inflation rate are always positive, they are consistently and significantly positive overall and in the in the contraction and expansion sub-periods only for unexpected changes in the nominal rate of interest. The next step is to see if we can discover more instances of these significant relationships as we further refine our analysis by examining more refined sub sector portfolios.
Results at the Sub-Sector Level
In the second step of our analysis, we estimate model 1 and 2 at the sub-sector level as defined in Supplementary Material Table A. Table 5 shows the number and percentage of sub-sectors that have a significant response of stock returns to unanticipated changes in each factor (nominal interest, real interest and inflation rate) and the average significant coefficient and the average positive and negative coefficients for each factor. Table 5A shows this information for the entire sample period while Tables 5B,C report this information for the contraction and expansion sub-periods, respectively.
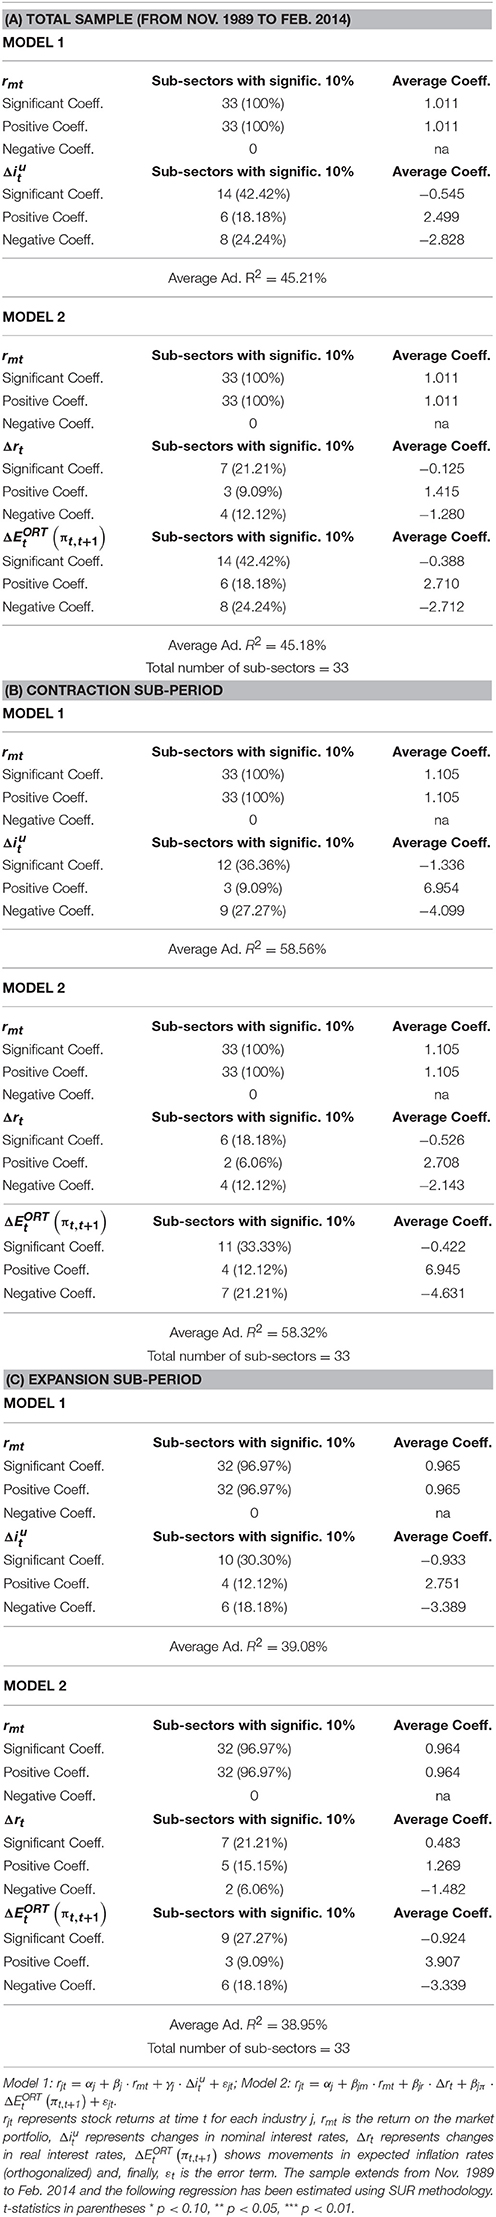
Table 5. Coefficients of sub-sector stock returns to variations in nominal interest rates (model 1) and real interest and expected inflation rates (model 2): % of significant exposure.
For both models, we find a positive and significant market beta for the total sample and for the expansion and contraction sub-periods for all sub-sectors with just one exception. There are <100% sub-sectors with a statistically significant positive market beta during the expansion sub-period because the beta for Construction Materials, while positive, is statistically insignificant. The average beta is close to the theoretical beta of 1, being a little higher in the contraction sub-period and a little lower in the expansion sub-period. For the overall period, betas range between about 0.4 for Electric Utilities and 1.5 for Semiconductors and Semiconductor Equipment. For the sake of brevity, we do not report the coefficients for each of the 33 sub-sectors. They are available from the corresponding author upon request.
The average significant sub-sector coefficients, along with the average of the significant positive and negative coefficients are shown in column 3 of Table 5. The average relation between stock returns and unexpected changes in the nominal interest rate (model 1) and unexpected changes in the real interest and inflation rates (model 2) are negative for the overall period and for the contraction and expansion sub-periods with just one exception. Specifically, in Table 5C the average coefficient for unexpected changes in the real rate of interest is a positive 0.483 for the expansion sub-period. Moreover, when a coefficient is significant, it is most often negative, again except for the expansion sub-period for unexpected changes in the real rate of interest. Specifically, Table 5C, column 2 shows that five of the seven sub-sectors have a significant positive relation between stock returns and unexpected changes in the real rate of interest.
Clearly, the overall results are consistent with most of the prior literature as the relations between stock returns and unexpected changes in the rate of inflation are most often negative. Specifically, column 2 shows that around 42, 33, and 27% of the sub-sectors for the total sample, contraction, and expansion sub-periods, respectively, have stock returns that are significantly and negatively related to unexpected changes in the inflation rate.
Nevertheless, there are some exceptions to the conventionally inverse relations. For instance, Table 5A, column 2 reports that there are six sub-sectors that have a significant positive relation between stock returns and unexpected changes in the nominal rate of interest in the overall period. In addition, we find three contrary positive relations for unexpected changes in the real rate of interest and six contrary positive relations for unexpected changes in inflation rate for the overall sample period. Breaking down the results by sub-period, we observe that with a smaller sample size, there are fewer statistically significant coefficients. During the contraction sub-period, there are more instances of inverse relations and during the expansion sub-period, there are proportionally more instances of positive relations suggesting that on average companies find it easier to pass on unexpected costs during expansions.
In summary, we find that on average, the relation between stock returns and unanticipated changes in the nominal rates of interest (model 1) and unanticipated changes in the real rate of interest and the inflation rate (model 2) are negative. This result is consistent with the literature. However, as we saw at the more aggregate sector level, we continue to find contrary positive relations at the sub-sector level. This motivates us to examine individual industries to see if we can find exceptional industries where investments in these industries can form a natural hedge against sources interest rate and inflation risk.
Results at an Industry Level
As a last step, we regress models 1 and 2 at the industry level. We again examine the relations for the total sample, contraction, and expansion sub-periods and obtain some remarkable results. Tables 6A1,A2 shows the results for model 1 and 2, respectively, for the overall period and Tables 6B1,B2,C1,C2 show the results for model 1 and 2 for the contraction and expansion sub-periods, respectively. All panels present the information in the same way. For instance, Table 6A1, columns 2–5 show by sector the number of industries, the proportion that have a significant response to each factor and the number industries that have a positive and a negative response to each factor, respectively. Column 6 reports the average significant coefficient for the sector and the range of coefficient values by sector while columns 7 and 8 reports the size of the average positive and negative coefficients.
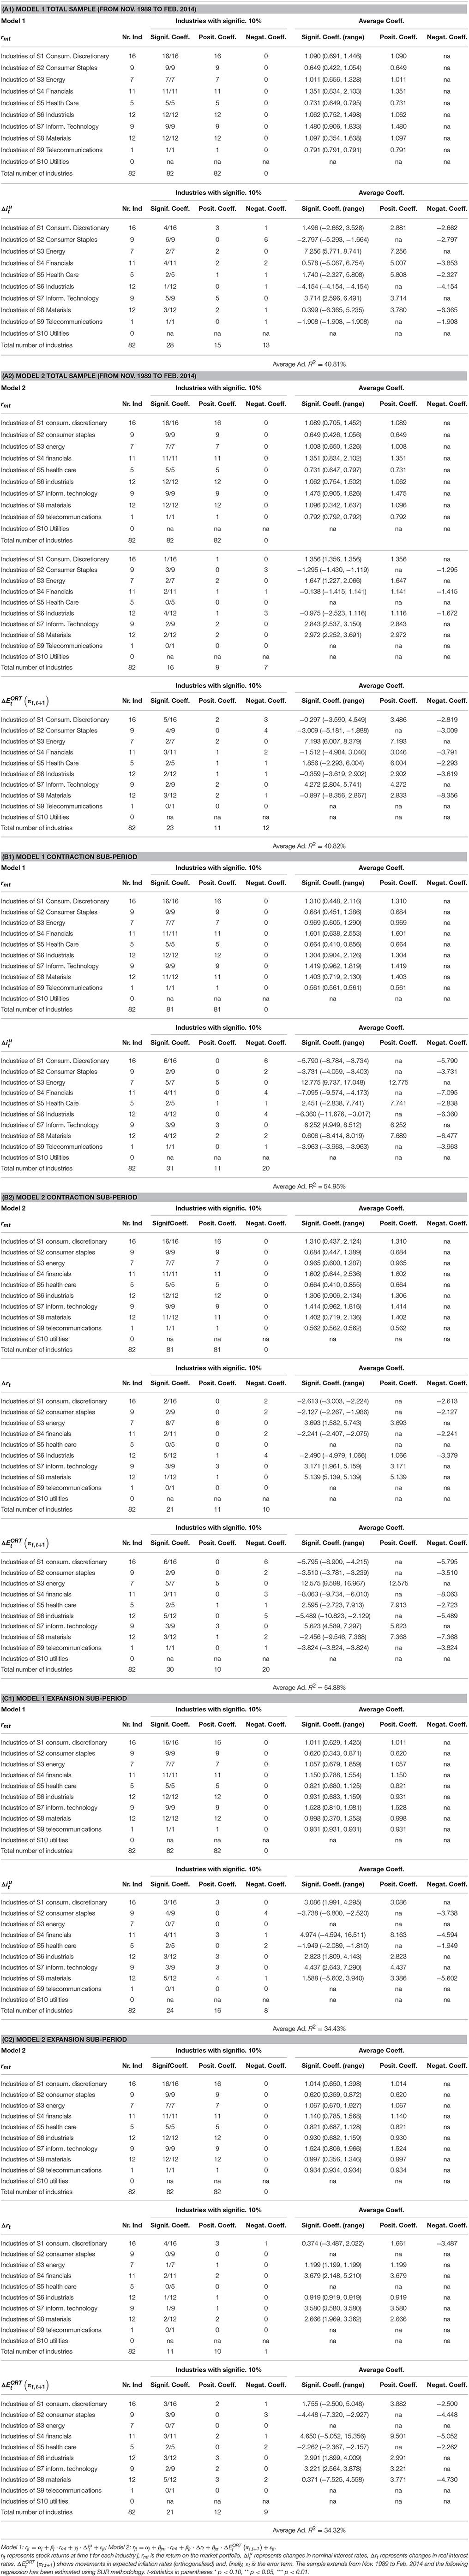
Table 6. Coefficients of industry stock returns to variations in nominal interest rates (model 1) and real interest and expected inflation rates (model 2): Significant industry sensitivity.
For both models in all six panels from A1 to C2, all industries exhibit positive and significant market betas for the overall sample and for the expansion and contraction sub-periods with just one interesting exception. While all of the industry betas during the contraction sub-period in the Materials sub-sector are positive for both models, Tables 6B1,B2 show that only 11 of 12 industries have significant betas. The exceptional industry is Gold, long rumored to be an industry that can provide a safe haven during recessions.
Model 1 (in Table 6A1) reports that at the industry level, there are more instances of contrary positive relations between stock returns and unanticipated changes in nominal interest rates. In fact, the average industry weighted significant coefficient is positive for six of the nine sectors and only three have significant negative average coefficients. The Utilities industry sub-sector is not segmented into industries by Bloomberg so we can conduct our individual industry analysis only within the remaining nine industry sub-sectors. The sectors with the highest number of industries with significant coefficients are Consumer Staples with an average significant coefficient of −2.8 and Information Technology with an average significant coefficient of 3.7. Meanwhile in the Industrials sector, only 1 of 12 industries, namely Building Products, has a significant relation to unexpected changes in nominal interest rates with a coefficient of −4.15. Industries in the Energy sector exhibit the highest average significant response to unexpected changes in the nominal rate of interest (7.256) whereas industries within the Materials and Financials sectors are the least sensitive to unexpected changes in the nominal rate of interest at 0.399 and 0.578, respectively. The sectors with the most heterogeneous industries are Financials, Health Care and Materials as the range of significant coefficients is very large. In contrast, the most homogeneous industry is Consumer Staples where six of nine industries have a significant negative relation between stock returns and unanticipated changes in nominal interest rates.
In Table 6B1 we observe that the results of the contraction sub-period is mostly similar to the total sample but with a few peculiarities. First, the stock returns of more industries are inversely related to unanticipated changes in nominal interest rates to the point where Consumer Discretionary and Financials sectors now join the previous three industry sectors that have an average negative significant coefficient. Second, three more industries in the Energy sector and the Industrials sector now have a significant relation between stock returns and unanticipated changes in nominal interest rates. However, the three additional industries for the Industrials sector are all negatively and the three industries for the Energy sector are all positively related to unanticipated changes in the nominal rate of interest. Meanwhile, it is remarkable that two fewer industries in the Information Technology sector exhibit a significant relation between stock returns and nominal interest rate changes in the contraction sub-period and for the remaining significant Information Technology industries, the coefficients become more positive. Third, in general, we observe that stock returns are more responsive to unexpected changes in nominal interest rates, irrespective of the sign, during the contraction sub-period. Moreover, it is noteworthy that Health Care and Materials are again the sectors with the most heterogeneous response to unexpected changes in the nominal rate of interest and the range of significant values are even larger during the contraction sub-period.
In the expansion sub-period reported in Table 6C1, we find that compared to the overall sample, there are four fewer industries that have a significant relation between stock returns and unexpected changes in nominal interest rate. In fact, the Energy and Telecommunication sectors do not have even one industry that has a significant relation between stock returns and unexpected change in nominal interest rates. The range of significant coefficients is typically smaller as well. In terms of absolute values of the coefficients, stock returns of industries in the Financial sectors have the largest average response (nearly 5) to unexpected changes in the nominal rate of interest whereas industries in the Materials sector have the lowest average response (nearly 1.6) to unexpected changes in the nominal rate of interest.
There is an interest phenomenon contained within these results. Stock returns for the Diversified Metals and Mining industry (within the Materials sector) have a positive and significant relation between stock returns and unexpected changes in nominal interest rates for the overall, contraction and expansion sub-periods. This suggests that an investment in these industries can form a natural safe haven against unexpected changes in the nominal interest rate.
Meanwhile, Model 2 Tables 6A2,B2,C2 provides the following interesting observations. First, the stock returns of most industries have no significant relation with unexpected changes in the real rate of interest. For instance, in the overall period, only 16 of 82 industries have a significant coefficient and independent of the sample period, the stock returns of all industries in the Health Care sector does not have a significant relation to unexpected changes in the real rate of interest. There are a few more industries with a significant relation between stock returns and unexpected changes in the real rate of interest in the contraction sub-period and a few less in the expansion sub-period, 21 and 11, respectively. Clearly, the stock returns of most industries do not respond to unexpected changes in the real rate of interest.
However, within these general results we find three industries, one each in the Energy, Industrials and Materials sectors, have a consistently significant, and positive, relation between stock returns and unexpected changes in the real rate of interest. Specifically, we find that stock returns in the Integrated Oil and Gas, Commercial Services, and Supplies and Diversified Metals and Mining industries have a consistently positive relation with unexpected changes in the real rate of interest for the overall, contraction, and expansion sub-periods. This suggests that investors can find that an investment in these industries can provide some insulation from unexpected changes in the real rate of interest.
We find that the stock returns of many industries respond to unexpected changes in the inflation rate. Overall, 23 of 82 industries respond significantly to unexpected changes in inflation, while during the contraction sub-period the number of significant relations rises to 30 and during expansion the number of significant relations falls only slightly to 21. The stock returns for industries in the Energy sector exhibit the highest average response to unexpected changes in the inflation rate for the total sample (7.19) and contraction sub-period (12.58) whereas firms in the Financial sectors have the highest average response in the expansion sub-period (4.65). In contrast, industries in the Consumer Discretionary sector have the lowest average response to unexpected changes in the inflation rate for the total sample (−0.29) while industries in the Materials sector have the lowest response in the contraction and the expansion sub-periods, −2.46 and 0.37, respectively.
On average, the majority of sectors, most notably Consumer Discretionary, Consumer Staples, Financials, Industrials, and Materials, have an industry weighted negative significant relation between stock returns and unexpected inflation. While overall, and in some of the sub-periods, we can find industries with a significant positive relation between stock returns and unexpected inflation, we are unable to find an industry that has a consistently positive relation with unexpected inflation. However, we do find that stock returns in the Household Durables, Pharmaceuticals, and Gold industries have a negative relation to unanticipated inflation in the overall sample and in the contraction and expansion sub-periods suggesting that stocks in these industries are exposed to significant inflation risk.
Overall Results
As mentioned previously, according to most of literature, the response of stock returns to changes in nominal and real interest rates is usually negative. Our results generally agree with these previous findings. Also, like Booth and Officer (1985), Bae (1990), Jareño (2008), Ferrando et al. (2015), and Jareño et al. (2016), we find that some financial (as well as non-financial) sectors have insignificant relations. However, we also find some contrary results when examining the relations by sector, sub-sector, and industry. We find that three industries, specifically Integrated Oil and Gas, Commercial Services and Supplies, and Diversified Metals and Mining have a consistent significant positive relation between stock returns and unexpected changes in real interest rates while one industry, Diversified Metals and Mining, has a significant consistently positive relation between stock returns and unexpected changes in nominal interest rates. These positive relations suggest that long investments in portfolios of stocks in these particular industries can form a safe haven from unanticipated changes in nominal and real interest rates. Moreover, we find that Gold has an insignificant beta during recessionary conditions hinting that investments in the Gold industry can indeed be a safe haven during recessions. Interestingly, we find that three industries, specifically Household Durables, Pharmaceuticals, and Gold have a negative relation to unanticipated inflation in the overall sample and in the contraction and expansion sub-periods suggesting that these three industries are particularly exposed to inflation risk. It is remarkable that stock returns are inversely related to unexpected inflation for the Gold industry, thereby damaging the image of Gold as a hedge against inflation. Therefore, investor behavior seems to be quite different over time (according to the business cycle) and by sector.
Discussion
Many studies have analyzed the sensitivity of stock returns to changes in nominal interest rates (Sweeney and Warga, 1986; Hevert et al., 1998a,b; O'Neal, 1998; Oertmann et al., 2000; Fraser et al., 2002; Tessaromatis, 2003; Jareño, 2006, 2008; Ferrer et al., 2010), finding a negative and significant relationship between stock returns and unexpected changes in nominal interest rates. We too examine this relationship but at the sector, sub-sector, and industry levels for both contraction and expansion sub-periods as well as for the overall sample period. In general, we find significant and negative relationship between stock returns and unexpected changes in nominal interest rates. Nevertheless, we observe important exceptions where some of these relations are insignificant and other relations that are consistently positive, even at the level of an individual industry in the case of the Diversified Metals and Mining industry.
At the sector level, we find that the most vulnerable sector to fluctuations in 10-year government bond yields are Utilities, so regulated and seriously indebted sectors seem to be the most interest rate sensitive, particularly in the expansion sub-period. Also, we note that Consumer Discretionary and Industrials have the conventional inverse relation between stock returns and unanticipated changes in the nominal rate of interest during the contraction sub-period that turns positive during the expansion sub-period so that for the overall period, there is no significant relation. This suggests that firms in these industries can pass on additional financing costs when economic conditions are robust.
In order to deepen in our analysis, we decompose unexpected changes in the nominal interest rate into unexpected changes in the real interest and inflation rates. In general, the stock returns by sector, sub-sector and industry are inversely related to unexpected changes in the real interest rate movements, and unexpected changes in the inflation rate overall and more so in the contraction than in expansion sub-period. However, it is unusual to find industries with a consistent negative relation between stock returns and unanticipated changes in the real interest rate and the inflation rate. There are three exceptions however. Evidently, inflation is an important source of risk for investments in Household Durables, Pharmaceuticals and Gold industries as they have a negative relation to unanticipated inflation in the overall sample and in the contraction and expansion sub-periods.
It is remarkable that stock returns are inversely related to unexpected inflation for the Gold industry, thereby damaging the image of Gold as a hedge against inflation. Another interesting result is that the stock returns in the Gold industry are not significantly related to the market return during contraction economic sub-periods thereby bolstering Gold's reputation as a safe haven during recessionary conditions.
Interestingly, we find that investments in three industries, specifically Integrated Oil and Gas, Commercial Services and Supplies, and Diversified Metals and Mining can provide a safe haven against unexpected changes in the real rate of interest. Specifically, we find that the stock returns in these industries have a consistently positive relation with unexpected changes in the real rate of interest for the overall, contraction and expansion sub-periods. This suggests that investments in these industries will tend to increase if real rates of interest unexpectedly rise, thereby offsetting extra costs associated with a rise in the real rate of interest.
Our empirical results support the state-dependent nature of the investor behavior in the interest rate sensitivity analysis. Also, this study may find a herding behavior of investors in some scenarios, because in certain times of market stress, investors disregard their own information, and exhibit herding behavior, which is often extremely optimistic or pessimistic and may lead to an unreasonable reaction to movements in interest rates. Finally, we confirm the null hypothesis that investor behavior may depend on different factors that affect the investment or trading decision. Therefore, aspects such as the sector that traded stock belongs to and the business cycle definitely impact on investment behavior.
Author Contributions
All authors listed, have made substantial, direct and intellectual contribution to the work, and approved it for publication.
Conflict of Interest Statement
The authors declare that the research was conducted in the absence of any commercial or financial relationships that could be construed as a potential conflict of interest.
Acknowledgments
This research is funded by “Fundación Ramón Areces (Convocatoria Pública año 2013), Riesgo de interés e inflación: estudio del mercado bursátil norteamericano” grant.
Supplementary Material
The Supplementary Material for this article can be found online at: http://journal.frontiersin.org/article/10.3389/fpsyg.2016.00390
References
Abdymomunov, A., and Gerlach, J. (2014). Stress testing interest rate risk exposure. J. Bank. Finan. 49, 287–301. doi: 10.1016/j.jbankfin.2014.08.013
Arango, L. E., González, A., and Posada, C. E. (2002). Returns and the interest rate: a non-linear relationship in the Bogota stock market. Appl. Finan. Econ. 12, 835–842. doi: 10.1080/09603100110094493
Au Yong, H. H., and Faff, R. (2008). Asia-Pacific banks risk exposures: pre and post the Asian financial crisis. Appl. Finan. Econ. 18, 431–449. doi: 10.1080/09603100600970057
Bae, S. C. (1990). Interest rate changes and common stock returns of financial institutions: revisited. J. Finan. Res. 13, 71–79. doi: 10.1111/j.1475-6803.1990.tb00537.x
Ballester, L., Ferrer, R., and González, C. (2011). Linear and nonlinear interest rate sensitivity of Spanish banks. Span. Rev. Finan. Econ. 9, 35–48. doi: 10.1016/j.srfe.2011.09.002
Bartram, S. M. (2002). The interest rate exposure of nonfinancial corporations. Eur. Finan. Rev. 6, 101–125. doi: 10.1023/A:1015024825914
Bartram, S. M., and Bodnar, G. M. (2009). No place to hide: the global crisis in equity markets in 2008/09. J. Int. Money Finan. 28, 1246–1292. doi: 10.1016/j.jimonfin.2009.08.005
Benink, H., and Wolff, C. (2000). Survey data and the interest rate sensitivity of US Bank stock returns. Econ. Notes 29, 201–213. doi: 10.1111/1468-0300.00030
Bessler, W., and Kurmann, P. (2012). Bank Risk Factors and Changing Risk Exposures of Banks: Capital Market Evidence Before and during the Financial Crisis. Available online at: http://papers.ssrn.com/sol3/papers.cfm?abstract_id=2139113
Blackburn, D. W., Goetzmann, W. N., and Ukhov, A. D. (2014). Is trading behavior stable across contexts? Evidence from style and multi-style investors. Quan. Finan. 14, 605–627. doi: 10.1080/14697688.2013.797595
Booth, J. R., and Officer, D. T. (1985). Expectations, interest rates and commercial bank stocks. J. Finan. Res. 8, 51–58. doi: 10.1111/j.1475-6803.1985.tb00425.x
Browne, F., and Doran, D. (2005). Do equity index industry groups improve forecasts of inflation and production? A US analysis. Appl. Econ. 37, 1801–1812. doi: 10.1080/00036840500215394
Campbell, J. Y. (2006). Household Finance. J. Finan. 61, 1553–1604. doi: 10.1111/j.1540-6261.2006.00883.x
Campos, N., Jareño, F., and Tolentino, M. (2016). Interest rate risk analysis with multifactor model: the US Case. Rom. J. Econ. Forecast. 19, 1–10.
Cornell, B. (2000). Equity duration, growth options, and asset pricing. J. Portf. Manage. 26, 105–111. doi: 10.3905/jpm.2000.319725
Czaja, M., Scholz, H., and Wilkens, M. (2009). Interest rate risk of German financial institutions: the impact of level, slope, and curvature of the term structure. Rev. Quan. Finan. Account. 33, 1–26. doi: 10.1007/s11156-008-0104-9
Díaz, A., and Jareño, F. (2009). Explanatory factors of the inflation news impact on stock returns by sector: the Spanish case. Res. Int. Bus. Finan. 23, 349–368. doi: 10.1016/j.ribaf.2008.12.001
Díaz, A., and Jareño, F. (2013). Inflation news and stock returns: market direction and flow – through ability. Empir. Econ. 44, 775–798. doi: 10.1007/s00181-012-0555-7
Drehmann, M., Sorensen, S., and Stringa, M. (2010). The integrated impact of credit and interest rate risk on banks: a dynamic framework and stress testing application. J. Bank. Finan. 34, 713–729. doi: 10.1016/j.jbankfin.2009.06.009
Elyasiani, E., and Mansur, I. (1998). Sensitivity of the bank stock returns distribution to changes in the level and volatility of interest rate: a GARCH-M model. J. Bank. Finan. 22, 535–563. doi: 10.1016/S0378-4266(98)00003-X
Estep, T., and Hanson, N. (1980). The Valuation of Financial Assets in Inflation. NewYork, NY: Salomon Brothers.
Ferrando, L., Ferrer, R., and Jareño, F. (2015). Interest rate sensitivity of Spanish Industries: a quantile regression approach. Manch. Sch. 84. doi: 10.1111/manc.12143. [Epub ahead of print].
Ferrer, R., Gonzalez, C., and Soto, G. M. (2010). Linear and nonlinear interest rate exposure in Spain. Manage. Finan. 36, 431–451. doi: 10.1108/03074351011039445
Flannery, M. J., and James, C. (1984). The effect of interest rate changes on the common stock returns of financial institutions. J. Finan. 39, 1141–1153. doi: 10.1111/j.1540-6261.1984.tb03898.x
Fraser, D., Madura, J., and Weigand, R. A. (2002). Sources of Bank interest rate risk. Finan. Rev. 37, 351–368. doi: 10.1111/0732-8516.00002
Froot, K. (1989). New hope for the expectations hypothesis of the term structure of interest rates. J. Finan. 44, 283–305. doi: 10.1111/j.1540-6261.1989.tb05058.x
Hevert, K. T., McLaughlin, R. M., and Taggart, R. A. (1998a). Growth options and equity duration. J. Portf. Manage. 25, 43–50. doi: 10.3905/jpm.1998.409659
Hevert, K. T., McLaughlin, R. M., and Taggart, R. A. (1998b). Interest rates, inflation and the value of growth options. Q. Rev. Econ. Finan. 38, 599–613. doi: 10.1016/S1062-9769(99)80092-1
Jareño, F. (2006). Sensibilidad de los rendimientos sectoriales a tipos de interés reales e inflación. Invest. Econ. 30, 577–610.
Jareño, F. (2008). Spanish stock market sensitivity to real interest and inflation rates. An extension of the Stone two-factor model with factors of the Fama and French three factor model. Appl. Econ. 40, 3159–3171. doi: 10.1080/00036840600994187
Jareño, F., Ferrer, R., and Miroslavova, E. (2016). US stock market sensitivity to interest and inflation rates: a quantile regression approach. Appl. Econ. 48, 2469–2481. doi: 10.1080/00036846.2015.1122735
Jareño, F., and Navarro, E. (2010). Stock interest rate risk and inflation shocks. Eur. J. Oper. Res. 201, 337–348. doi: 10.1016/j.ejor.2009.03.025
Joyce, M. A. S., and Read, V. (2002). Asset price reactions to RPI announcements. Appl. Finan. Econ. 12, 253–270. doi: 10.1080/09603100010001090
Kane, E. J., and Unal, H. (1988). Change in market assessments of deposit-institution riskiness. J. Finan. Serv. Res. 1, 207–229. doi: 10.1007/BF00114851
Knif, J., Kolari, J., and Pynnönen, S. (2008). Stock market reaction to good and bad inflation news. J. Finan. Res. 31, 141–166. doi: 10.1111/j.1475-6803.2008.00235.x
Korkeamäki, T. (2011). Interest rate sensitivity of the European stock markets before and after the euro introduction. J. Int. Finan. Mark. Institut. Money, 21, 811–831. doi: 10.1016/j.intfin.2011.06.005
Leiser, D., and Drori, S. (2005). Naïve understanding of inflation. J. Soc. Econ. 34, 179–198. doi: 10.1016/j.socec.2004.09.006
Lynge, M. J. Jr., and Zumwalt, J. (1980). An empirical study of the interest rate sensitivity of commercial bank returns. A multi-index approach. J. Finan. Quant. Anal. 15, 731–742. doi: 10.2307/2330406
Memmel, C. (2011). Banks' exposure to interest rate risk, their earnings from term transformation, and the dynamics of the term structure. J. Bank. Finan. 35, 282–289. doi: 10.1016/j.jbankfin.2010.08.003
Mestel, R., and Gurgul, H. (2003). ARIMA modeling of event induced stock price reactions in Austria. Centr. Eur. J. Oper. Res. 11, 317–334.
O'Neal, E. S. (1998). Why electric utility stocks are sensitive to interest rates. Finan. Rev. 33, 147–162.
Oertmann, P., Rendu, C., and Zimmermann, H. (2000). Interest rate risk of European financial corporations. Eur. Finan. Manage. 6, 459–478. doi: 10.1111/1468-036X.00135
Olugbode, M., El-Masry, A., and Pointon, J. (2014). Exchange rate and interest rate exposure of UK industries using first-order autoregressive exponential GARCH-inmean (EGARCH-M) approach. Manch. Sch. 82, 409–464. doi: 10.1111/manc.12029
Pearce, D. K., and Roley, V. (1988). Firm characteristics, unanticipated inflation, and stock returns. J. Finan. 43, 965–981. doi: 10.1111/j.1540-6261.1988.tb02615.x
Schwert, G. W. (1981). The adjustment of stock prices to information about inflation. J. Finan. 36, 15–29. doi: 10.1111/j.1540-6261.1981.tb03531.x
Shamsuddin, A. (2014). Are Dow Jones Islamic equity indices exposed to interest rate risk? Econ. Model. 39, 273–281. doi: 10.1016/j.econmod.2014.03.007
Soto, G. M., Ferrer, R., and González, C. (2005). Determinants of interest rate exposure of Spanish non-financial firms. Eur. Rev. Econ. Finan. 4, 55–71.
Staikouras, S. K. (2003). The interest rate risk exposure of financial intermediaries: a review of the theory and empirical evidence. Finan. Mark. Institut. Instrum. 12, 257–289. doi: 10.1111/1468-0416.t01-1-00002
Staikouras, S. K. (2005). Equity returns of financial institutions and the pricing of interest rate risk. Appl. Finan. Econ. 15, 499–508. doi: 10.1080/09603100500039557
Staikouras, S. K. (2006). Financial intermediaries and interest rate risk: II. Finan. Mark. Institut. Instrum. 15, 225–272. doi: 10.1111/j.1468-0416.2006.00118.x
Stone, B. K. (1974). Systematic interest rate risk in a two-index model of returns. J. Finan. Quant. Anal. 9, 709–721. doi: 10.2307/2329656
Sweeney, M. E. (1998). Interest rate hedging and equity duration: Australian evidence. Int. Rev. Finan. Anal. 7, 277–298. doi: 10.1016/S1057-5219(99)80018-0
Sweeney, R. J., and Warga, A. D. (1986). The pricing of interest rate risk: evidence from the stock market. J. Finan. 41, 393–410. doi: 10.1111/j.1540-6261.1986.tb05044.x
Tessaromatis, N. (2003). “Stock market sensitivity to interest rates and inflation,” in EFMA 2003 Helsinki Meetings. Available online at: http://ssrn.com/abstract=392589
Veronesi, P. (1999). Stock market overreaction to bad news in good times: a rational expectations equilibrium model. Rev. Finan. Stud. 12, 975–1007. doi: 10.1093/rfs/12.5.975
Keywords: unexpected inflation, interest rates, stock return, business cycle, investor behavior
Citation: González MO, Jareño F and Skinner FS (2016) Interest and Inflation Risk: Investor Behavior. Front. Psychol. 7:390. doi: 10.3389/fpsyg.2016.00390
Received: 29 January 2016; Accepted: 04 March 2016;
Published: 18 March 2016.
Edited by:
Alicia Izquierdo-Yusta, University of Burgos, SpainReviewed by:
Jorge Pelegrín-Borondo, Universidad de La Rioja, SpainInés González, Universidad Pública de Navarra, Spain
Copyright © 2016 González, Jareño and Skinner. This is an open-access article distributed under the terms of the Creative Commons Attribution License (CC BY). The use, distribution or reproduction in other forums is permitted, provided the original author(s) or licensor are credited and that the original publication in this journal is cited, in accordance with accepted academic practice. No use, distribution or reproduction is permitted which does not comply with these terms.
*Correspondence: Francisco Jareño, francisco.jareno@uclm.es