Cognitive Distances between Evaluators and Evaluees in Research Evaluation: A Comparison between Three Informetric Methods at the Journal and Subject Category Aggregation Level
 A. I. M. Jakaria Rahman
 Raf Guns
 Ronald Rousseau
 Tim C. E. Engels
- 1Centre for R&D Monitoring (ECOOM), Faculty of Social Sciences, University of Antwerp, Antwerp, Belgium
- 2Department of Mathematics, KU Leuven, Leuven, Belgium
- 3Faculty of Social Sciences, University of Antwerp, Antwerp, Belgium
This article compares six informetric approaches to determine cognitive distances between the publications of panel members (PMs) and those of research groups in discipline-specific research evaluation. We used data collected in the framework of six completed research evaluations from the period 2009–2014 at the University of Antwerp as a test case. We distinguish between two levels of aggregation—Web of Science Subject Categories and journals—and three methods: while the barycenter method (2-dimensional) is based on global maps of science, the similarity-adapted publication vector (SAPV) method and weighted cosine similarity (WCS) method (both in higher dimensions) use a full similarity matrix. In total, this leads to six different approaches, all of which are based on the publication profile of research groups and PMs. We use Euclidean distances between barycenters and SAPVs, as well as values of WCS between PMs and research groups as indicators of cognitive distance. We systematically compare how these six approaches are related. The results show that the level of aggregation has minor influence on determining cognitive distances, but dimensionality (two versus a high number of dimensions) has a greater influence. The SAPV and WCS methods agree in most cases at both levels of aggregation on which PM has the closest cognitive distance to the group to be evaluated, whereas the barycenter approaches often differ. Comparing the results of the methods to the main assessor that was assigned to each research group, we find that the barycenter method usually scores better. However, the barycenter method is less discriminatory and suggests more potential evaluators, whereas SAPV and WCS are more precise.
Introduction
Since the 1980s, a large number of research evaluation programs have emerged in most OECD (Organization for Economic Co-operation and Development) countries, and this on the level of institutions and on national level (OECD, 1997). Many countries implemented formal policies to assess performance and output of publicly funded research on the national, regional, and institutional level (Whitley, 2007; Hammarfelt and de Rijcke, 2015). In addition, evaluation is also used for funding allocation, performance assessments of researchers, departments, and proposals for new or completed research projects (Geuna and Martin, 2003; Abramo and D’Angelo, 2011). Research evaluation practices vary according to discipline and country, but consultation of peers is normally seen as a necessary part (Langfeldt, 2004). Warner (2003) argued that expert review is the only system that enjoys the confidence as well as the consent of the academic community. Peer review is vital and irreplaceable in research evaluation (HEFCE, 2015). However, bibliometric indicators can support the peer review evaluation process (Aksnes and Taxt, 2004; Allen et al., 2009; Taylor, 2011). The United Kingdom’s Research Excellence Framework system for assessing the quality of research in UK higher education institutions is an example of such an informed peer review evaluation (REF2014, 2014). Developing trustworthy ways of recognizing and supporting the “best research” is key to a healthy research environment (Owens, 2013).
The reliability and validity of peer review are not a given (Cicchetti, 1991; Bazeley, 1998; Wessely, 1998; Langfeldt, 2004; Bornmann and Daniel, 2005; Benda and Engels, 2011; Bornmann, 2011). There may be controversy on a panel’s composition: in some cases, the evaluees are not pleased with the evaluation because reviewers or panelists are perceived as not being expert in the field, poorly chosen, or poorly qualified (McCullough, 1989; Over, 1996; Bornmann and Daniel, 2006; Daniel et al., 2007). Evaluation carried out by colleagues perceived as being non-experts raises credibility questions (Langfeldt, 2004). One way in which the credibility and quality of peer review could be enhanced, is through measurement of the match between the expertise of the panel member (PM) and the research interests of the research groups. Such methods should be able to quantify the cognitive distance between the expert panel and the research groups. In this paper, we focus on approaches that do exactly that.
Cognitive distance has been studied especially in the social and behavioral sciences (Golledge, 1987; Montello, 1991). Nooteboom (2000) (p. 73) defines cognitive distance as “a difference in cognitive function. This can be a difference in domain, range, or mapping. People could have a shared domain but a difference of mapping: two people can make sense of the same phenomena, but do so differently.” Cognitive distance is also a factor in the collaboration between universities and industry for knowledge transfer activities. Different values, norms, and mindsets in these two sectors can increase the cognitive distance for knowledge transfer (Muscio and Pozzali, 2013). The concepts of “cognitive distance” and “cognitive proximity” have been discussed earlier in the information science literature. Hautala (2013) identified that cognitive proximity is achieved through cooperation and suitable tasks for knowledge creation between international research groups. Science overlay maps have been in use in the scientometric literature to assess the degree of similarity or dissimilarity between research profiles (Boyack, 2009; Rafols et al., 2010; Soós and Kampis, 2012). Boyack et al. (2014) used overlay maps to compare the locations of reviewer publications of four expert panels on a base map of science, for the purpose of evaluating a set of grant applications.
As far as we are aware there was, prior to 2013, no method to measure and quantify congruence of expertise or cognitive distance between panels and research groups in discipline-specific research evaluation (Engels et al., 2013). We started to study the problem of quantifying cognitive distance, such that individual PMs’ expertise covers the research domains in the discipline where the units of assessment (in our case: research groups) have publications. In our own work, we focused on determining the cognitive distances between publication portfolios of an expert panel and research groups (Rahman et al., 2015, 2016; Rousseau et al., 2017), while Wang and Sandström (2015) used bibliographic coupling and topic modeling to determine cognitive distance.
More specifically, we explored different ways of quantifying the cognitive distance between PMs’ and research groups’ publication profile in discipline-specific research evaluation. For this, we consider all the publications of the research groups and PMs indexed in the Web of Science (WoS) and pursue an investigation at two levels of aggregation: WoS Subject Categories (SCs in short) and journals. For this purpose, we used the similarity matrix of WoS SCs and a 2-dimensional base map derived from it [for details see Leydesdorff and Rafols (2009), Rafols et al. (2010), and Leydesdorff et al. (2013a)] and also the similarity matrix of journals and its 2-dimensional base map [for details see Leydesdorff and Rafols (2012) and Leydesdorff et al. (2013b)]. Hence, we proposed five different approaches namely a barycenter approach using WoS SCs and journals (Rahman et al., 2015, 2016), a similarity-adapted publication vector (SAPV) using WoS SCs and journals (Rahman et al., 2016; Rousseau et al., 2017) and a weighted cosine similarity (WCS) approach using WoS SCs (Rousseau et al., 2017). The SAPV and WCS methods use the similarity matrix of WoS SCs/journals while the barycenter method uses the respective 2-dimensional base map derived from the similarity matrix of WoS SCs/journals. So far, we have not yet applied the WCS method at the journal level. In this article, we cover that gap. Hence, three methods and two levels of aggregation lead to six informetric approaches to inform cognitive distances between evaluators and evaluees in research evaluation.
Until now we have not compared the two levels of aggregation. More generally, a systematic comparison and test of all six approaches has not yet been carried out. This article fills this gap. Hence, we set the following research questions:
1. (a) What are the correlations between the different approaches?
(b) Which aspect (method versus level of aggregation) has the largest influence on the correlation?
2. To what extent do the approaches agree in matching the PM at the closest cognitive distance from a research group?
3. (a) How accurate are the approaches in matching the main assessor for each research group?
(b) How accurate are they to uniquely match the main assessor?
First, we look at the influence of the level of aggregation and the number of dimensions for determining cognitive distances. Second, we explore whether or not all the methods indicate the same PM as the one at the shortest cognitive distance from a research group. Finally, we investigate if there is any difference between the proposed methods to find the previously assigned main assessor.
Data
The data in this paper stem from the research assessment during the period 2009–2014 of six departments belonging to the University of Antwerp. All research groups in a department are evaluated by the same panel. A research group consists of one professor assisted by junior and/or senior researchers (PhD students and postdocs), or of a group of professors and a number of researchers working with them. These evaluations consider the entire research groups’ scientific activity for a specific period, typically 8 years preceding the year of evaluation. All articles, letters, notes, proceeding papers, and reviews by the research groups published during the reference period are included in the evaluation. In this article, we consider only the publications that are indexed in the Science Citation Index Expanded (SCIE) and the Social Sciences Citation Index (SSCI) of the WoS.
Table 1 lists the publication statistics of the research groups during the 8 years preceding their evaluation. Altogether, there are 58 research groups in six departments. The number of publications per department ranges from 231 to 1,739. In total, these publications appeared in 146–476 different journals and are distributed over 61–108 WoS SCs. Sometimes different research groups collaborated.
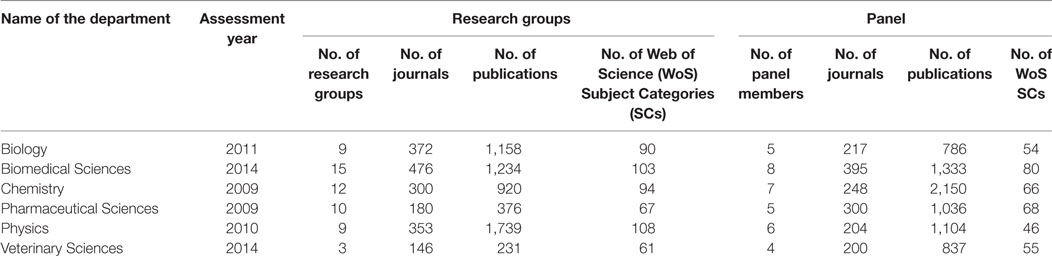
Table 1. Publication statistics of the research groups and panels.
The Department of Research Affairs and Innovation (ADOC) of the University of Antwerp organizes research evaluations. Each department can suggest potential panel chairs and PMs, who have the rank of full professor and have a considerable record of accomplishment. Preferably, they have experience with research evaluations, are editors or board members of reputed journals, and have academic management experience. ADOC checks the publication profile and curriculum vitae of the potential panel chair and PMs and ensures that they do not have co-publications or joint projects with the research groups that are evaluated. In addition, they may not have had an appointment as visiting professor at the University of Antwerp and cannot be a member of an expert panel for the Research Foundation Flanders to avoid any potential bias. ADOC can also make suggestions when the scientists proposed by the departments are not acceptable. Together, the PMs have to cover all the subdomains in the evaluated department. The panel chairs have the last word about the panel composition. The composed panel is presented to the bureau of the university’s research council, which has to ratify the composition.
Table 1 also shows that in total, there are 35 PMs involved in the evaluation of the six departments. As publications reflect the expertise of their authors (Rybak et al., 2014), the entire publication profile of the PMs are included, up to the year of assessment. The number of PMs ranges from 4 to 8 for each department. The number of publications per panel ranges from 786 to 2,150. In total, these publications appeared in 200–395 different journals and are distributed over 46–80 WoS SCs. There is no shared authorship between PMs and research groups in any of the cases. None of the panels has any coauthored publications among the respective PMs except for two Chemistry PMs who have two publications in collaboration.
Methods
Our approaches are based on the assumption that for the evaluation of a research group by a PM, the shorter the cognitive distances between them the better the fit between the two. Since the analysis is based on Clarivate Analytics’ (formerly Thomson Reuters’) WoS data, only publications in journals included in the WoS are taken into account. To identify cognitive distances, we consider the journals and WoS SCs in which publications have appeared. An important characteristic of our approaches is that they take into account the similarity between WoS SCs and between journals: if the publications of a PM and a research group appear in different yet similar or closely related journals, they may still cover the same research areas. Clarivate Analytics has assigned one or more SCs to WoS indexed journals based on “subjective, heuristic methods” and has received criticism for being crude for some research areas (Pudovkin and Garfield, 2002). However, WoS SCs cover all disciplines and are generally used by bibliometric practitioners (Rehn et al., 2014; Leydesdorff and Bornmann, 2016).
We use a global map of science based on WoS SCs data made available at http://www.leydesdorff.net/overlaytoolkit/map10.paj (Leydesdorff and Rafols, 2009; Rafols et al., 2010; Leydesdorff et al., 2013a). These authors created a matrix of citing to cited WoS SCs based on the SCIE and SSCI, which was subsequently normalized in the citing direction. The file “map10. paj” contains a weighted network of WoS SCs.
We also use a global map of science based on journal similarity available at http://www.leydesdorff.net/journals11. We have received the similarity matrix data from Loet Leydesdorff in the context of a joint paper (Rahman et al., 2016). The journal similarity matrix can be considered as an adjacency matrix, and thus is equivalent to a weighted network where similar journals are linked and link weights increase with similarity strength [see Leydesdorff et al. (2013b) for details]. However, as some of the journals underwent name or other changes over time, we had to find a way to handle these changes in a uniform way. For detailed guidelines, we refer to Rahman et al. (2016).
We now explain how the three methods—SAPV, barycenter, and WCS—are calculated. Throughout the discussion, N denotes the number of SCs (224) or the number of journals. There are 10,673 journals in the map, and 10,675 journals in the similarity matrix based on JCR 2011.
SAPV Method
In earlier work, we introduced the idea of SAPVs, which was implemented by Rahman et al. (2016). A regular publication vector counts per WoS SC or journal, whereas in an SAPV these counts are adapted to account for similarity between WoS SCs or journals. We use normalized SAPVs, such that there is scale invariance and publication vectors of entities of varying size can be meaningfully compared.
We calculate SAPVs for each entity, starting from the original publication vector and similarity matrices. Based on their respective SAPVs, the distance can be calculated between two entities. An SAPV is determined as the vector C = (C1, C2,…, CN), where
Here, sj,k denotes the kth coordinate of SC or journal j and mj is the number of publications in SC or journal j. The numerator of Eq. 1 is equal to the kth element of S * M, the multiplication of the similarity matrix S and the column matrix of publications . The denominator is the L1-norm of the unnormalized vector.
Barycenter Method
A barycenter is an entity’s weighted average location on a map. More specifically, an entity’s barycenter is the center of weight (Rousseau, 1989, 2008; Jin and Rousseau, 2001) of the WoS SCs or journals in which it has publications. The barycenter is defined as the point C = (C1, C2), where
Here, Lj,1 and Lj,2 are the horizontal and vertical coordinates of SC or journal j on the map, mj is the number of publications in SC or journal j of the unit under investigation (PM, research group), and is the total number of publications of the entity. Note that, in case of WoS SCs, T is larger than the total number of publications as we use full counting: if a publication appears in a journal belonging to two categories, it will be counted twice.
Subsequently, we determine the Euclidean distance between the barycenters or the SAPVs of the PMs and individual research groups. The Euclidean distance between two vectors a = (an)n=1,…,k and b = (bn)n=1,…,k in Rk, for any strictly positive integer k, is given as follows:
In this paper, we use formula (3) for k = 2 for the barycenter method and k = N for the SAPV method.
WCS Method
Finally, we consider a weighted similarity method (generalized cosine similarity). The WCS between PM k and research group m is as follows (Zhou et al., 2012):
The numerator is the matrix multiplication: , where t denotes matrix transposition, S is the similarity matrix, Mk denotes the column matrix of publications of PM k, and Rm denotes the column matrix of publications of research group m. Similarly, the two products under the square root in the denominator are and . The result is the similarity between PM k and research group m.
The Euclidean distances and similarity values are calculated for each PM and each research group. The shorter the distance or the larger the similarity the closer the cognitive distance. In the Section “Results,” we present the cognitive distances in table form. All values are shown up to the third decimal. Cognitive distances are expressed as arbitrary units on a ratio scale (Egghe and Rousseau, 1990). Hence, we can compare them in terms like “x is twice as large as y.”
Confidence Intervals (CIs)
We further calculated 95% CIs for each Euclidean distance (both between barycenters and SAPVs) and similarity (for WCS) by applying a bootstrapping approach (Efron and Tibshirani, 1998). If two CIs do not overlap, the difference between the distances is statistically significant at the 0.05 level. Although it is possible for overlapping CIs to have a statistically significant difference between the corresponding distances, the difference between the distances is less likely to have practical meaning. If the CI of two or more PMs overlaps, we treat them as interchangeable unless explicitly stated otherwise.
In applying the bootstrap for barycenters and SAPV distances, we generate 1,000 independent bootstrap samples and for each sample calculate a bootstrap replication (barycenter or SAPV). Since we have a two-sample problem (distance between two entities), we calculate the distances between pairs of bootstrap replications, from which we obtain a CI using a bootstrap percentile approach (Efron and Tibshirani, 1998, Chap. 13). To apply the bootstrap to WCS, we again generated 1,000 independent bootstrap samples. For each pair of samples, we calculated the similarity, from which we again obtain a CI using bootstrap percentiles. A more detailed explanation and implementation of our method is provided by Guns (2016a,b).
Figure 1 illustrates the main components of the six approaches at a glance. We have used two levels of aggregation—WoS SCs and journals. For each level of aggregation, there is a similarity matrix (N-dimensions, with N the number of WoS SCs or journals) and a 2-dimensional base map derived from the similarity matrix. The SAPV and WCS methods operate at the level of N-dimensions, whereas the barycenter method uses the 2-dimensional base map. We calculate Euclidean distances between SAPVs (in N-dimensions) or barycenters (in 2-dimensions) of entities, i.e., PMs and research groups. For the WCS case, we do not calculate a distance but a similarity between entities. Furthermore, a bootstrapping method is applied to determine CIs for the distance or similarity between two entities.
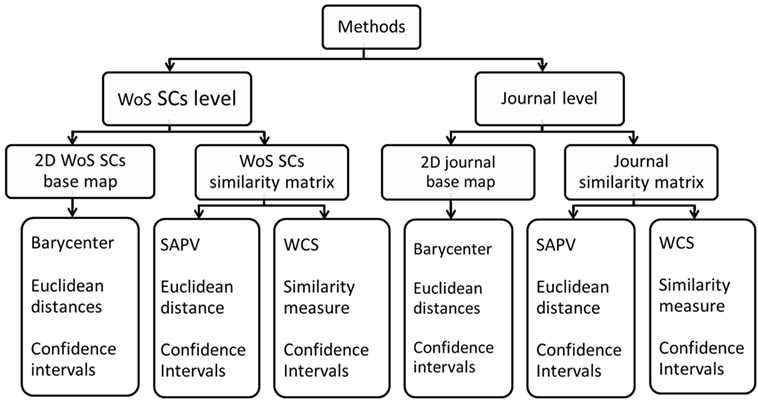
Figure 1. Main components of the six approaches at a glance.
Comparison of the Approaches
To answer the first research question, we calculate Spearman’s rank-order correlation between the results/values of each pair of the six approaches. The distances/similarity values between the individual PMs and individual research groups have been included in the correlation calculation. Since the barycenter and SAPV approaches are distance-based rather than similarity-based, we determine the correlation using the distances between barycenters and between SAPVs, and the dissimilarity of individual research groups and PMs using a normalized weighted cosine dissimilarity = 1 − WCS which can more easily be compared with the other two. For the sake of simplicity, the results are shown under the Section “WCS Method.”
We created a heat map with hierarchical clustering based on the correlation results. For the clustering we used average linkage clustering with the UPGMA (unweighted pair group method with arithmetic mean) algorithm (Sokal and Michener, 1958). The heat map is a 2-dimensional representation of data where the values are represented by colors. It provides a visual summary of the results. The hierarchical clustering directly shows which approaches are more closely related.
To answer the second research question—to what extent do the approaches agree in finding the PM at the closest cognitive distance—we first explore whether the methods agree regarding the first ranked PM ignoring the CIs overlap.
Concerning the third research question, we recall that during the research evaluation exercises at the University of Antwerp, the panel chair of each panel decides which PM should evaluate which research group [see Engels et al. (2013) for details]. This PM is referred to as the research group’s main assessor. Lacking other information and practical considerations, it seems logical that in each case the closest PM is assigned to each group. Hence, we simply compare the closest PM with the main assessor.
For each approach, we ranked all the PMs in decreasing order of distance or in increasing order of similarity to the research group. We use two procedures (procedure A and procedure B, see Table 2) to compare the actual main assessor, assigned by the panel chair, to the PM(s) recommended by our approaches. Procedure A focuses on how accurate the approaches are to identify the main assessor for each research group, whereas Procedure B focuses on how accurate the approaches are to uniquely identify the main assessor.
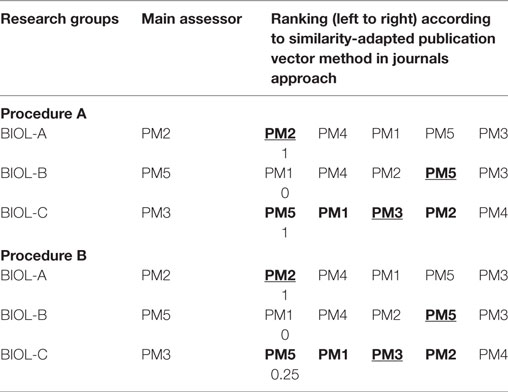
Table 2. Illustrations of procedures A and B.
For the sake of clarity, we underline and show in bold the main assessor in our approaches. We also show in bold the PMs whose CIs overlap with the main assessor’s.
In procedure A, we assign a score of 1 if the main assessor ranks first; a score of one is also assigned if the CI of the PM who ranks first overlaps with the CI of the main assessor. If neither of these cases applies a 0 score is assigned. For example, PM2 is the main assessor of BIOL-A and ranks first for the SAPV method applied to journals. There is no other PM whose CI overlaps with PM2 in that case. Consequently, we assign a score of 1. Further, PM3 is the main assessor of BIOL-C; PM5 ranks first, but its CI overlaps with PM3’s, hence also here a score of one is assigned. Considering BIOL-B, we see that PM5 is the main assessor, but the CI of PM1, ranking first, does not overlap with PM5’s CI. Hence, a 0 score is assigned. In this procedure, even if the main assessor ranks last but the CI of the first ranked PM overlaps with the CIs of the others, including the last ranked PM, a score of 1 is assigned.
For procedure B, we assign a score of 1 if the main assessor ranks first and has no overlapping CI with other PMs and 0 otherwise. For example, PM2 is the main assessor of BIOL-A and ranks first in that case. There are no PMs whose CIs overlap with PM1. Therefore, a score of 1 is assigned to this case. On the other hand, PM5 is the main assessor of BIOL-B, but PM1 ranks first in that case. Therefore, this case does not warrant any score. In case of overlapping CIs among the closest n PMs, one of which is the main assessor, we assign a score of 1/n. For example, PM3 is the main assessor of BIOL-C and ranks first in that case. The CIs of PM5, PM1, and PM2 overlap with PM3. Therefore, we assign a score of 1/4 = 0.25 in this case. The rationale here is that in this case, we randomly pick one of these n PMs, and hence we have a chance of 1/n of picking the main assessor.
The final score is the sum of all individual scores and ranges between 0 and the total number of research groups in the department.
Results
For all six departments, the SAPVs of the PMs and individual research groups are calculated using the journal and WoS SCs similarity matrices by applying formula (1). We also calculate barycenters using the journal and WoS SC 2-dimensional base maps by applying formula (2). We determine the Euclidean distance between two SAPVs and two barycenters by applying formula (3). Finally, WCS values are calculated using the journal and WoS SCs similarity matrices by applying formula (4). We show the results of the Biology department as an example.
Table 3 shows the results for the SAPV method using the WoS SC similarity matrix, Table 4 shows the result of the barycenter method using the 2-dimensional WoS SCs, Table 5 shows the result of the WCS method using the WoS SC similarity matrix, and Table 6 shows the result of the WCS method using the journal similarity matrix. For the comparison between the approaches, we reuse the results of the SAPV and barycenter methods at the level of journals, which were previously obtained by Rahman et al. (2016).
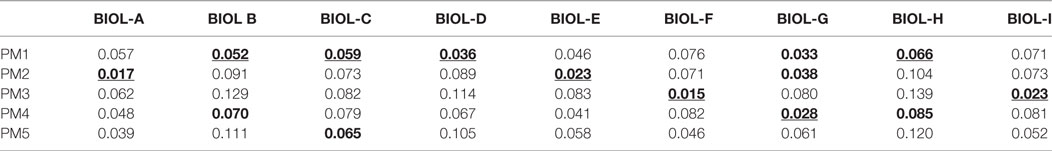
Table 3. Euclidean distances between similarity-adapted publication vectors of Biology panel members and individual research groups using the similarity matrix of Web of Science Subject Categories.
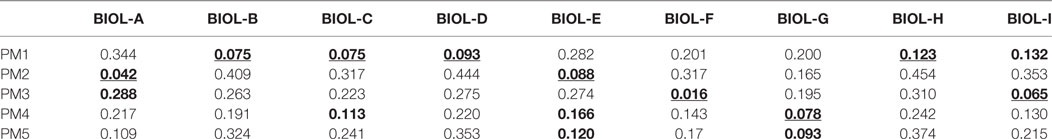
Table 4. Euclidean distances between barycenters of Biology panel members and individual research groups using 2-dimensional base map of Web of Science Subject Categories.
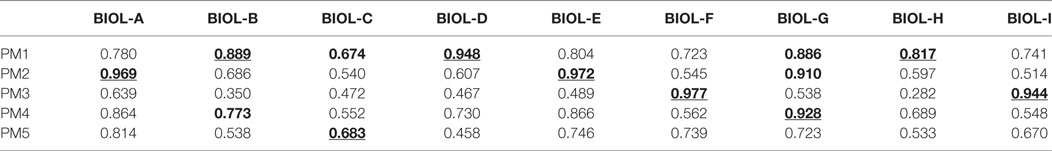
Table 5. Weighted cosine similarity values of the Biology panel members and individual research groups using the similarity matrix of Web of Science Subject Categories.
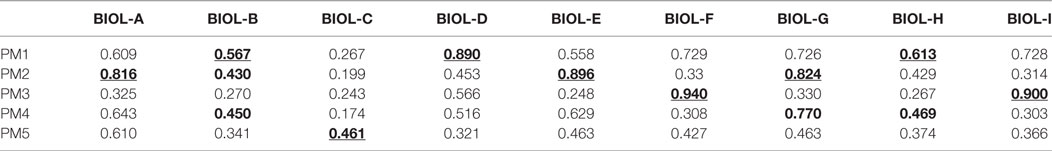
Table 6. Weighted cosine similarity values of the Biology panel members and individual research groups using the similarity matrix of journals.
Tables 3 and 4 show the PM at the shortest distance for each research group. Similarly, Tables 5 and 6 show the PM with the highest similarity for each research group. In both cases, the number in the row corresponding to this PM is indicated in bold and underlined. For the former, distances whose CIs overlap with that of the shortest distance are in bold (same column). For the latter, similarities whose CIs overlap with that of the highest similarities are in bold (same column).
Correlation Coefficients between Six Approaches
We explore how the six approaches are correlated. The heat map (Figure 2) represents the hierarchical clustering based on correlation coefficient between six approaches in the Biology department. Similar heat maps for other departments are available in the supplementary material (Figures 1, 2, 3, and 4 in the supplementary material). The heat maps show that there are two clusters, except in the biology department, the “barycenter” (2-dimensional) cluster and the “similarity matrix cluster” (N-dimensional). We find that, in general the same methods at different levels of aggregation (journals and WoS SCs) are highly correlated. The correlation between the barycenter approaches at both levels of aggregation is strong (between 0.80 and 0.92) except for a moderate correlation (r = 0.59) for Biology. In addition, the correlation for SAPV is strong (range r = 0.78–0.93) as well, except for a moderate correlation (r = 0.68) in Pharmaceutical Sciences. Finally, the correlation for WSC is strong (r = 0.71–0.90) in all disciplines. In total, we find a strong correlation for 16 out of 18 cases.
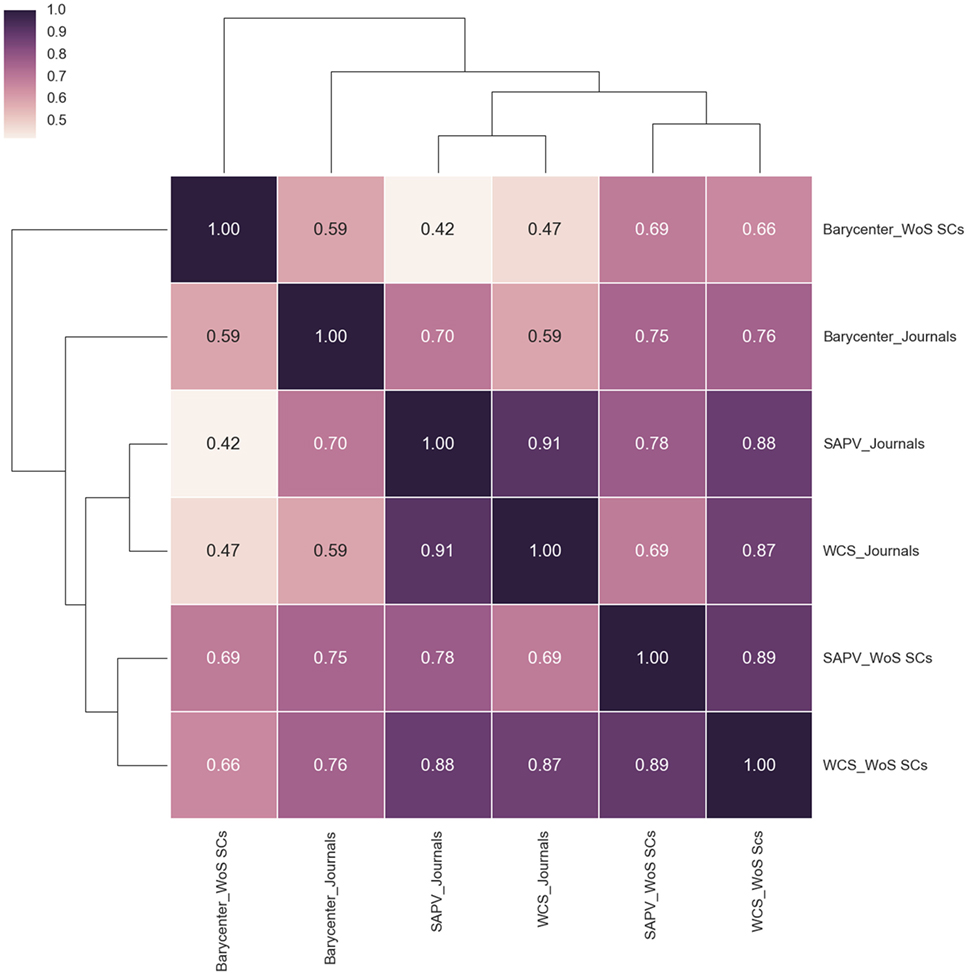
Figure 2. Heat map with hierarchical clustering based on correlation coefficient between six approaches in the Biology department.
At the WoS SC level of aggregation, the heat maps suggest that the correlation between the barycenter and the SAPV method is moderate to strong (range 0.61–0.73). A similar correlation (range r = 0.56–0.71) was found between the barycenter method and the WCS method, while the correlation between the SAPV and WCS methods is strong to very strong (r = 0.75–0.95). Furthermore, at the journal level of aggregation, the correlation between the barycenter and the SAPV method is moderate to strong (0.56–0.71), and between the barycenter and the WCS method is low to moderate (0.36–0.68) except for Veterinary Science where the correlation is strong (r = 0.80). Again, the correlation between the SAPV and the WCS methods is strong to very strong (r = 0.85–0.91).
We combined all the cognitive distances of the six approaches of the six departments and calculated the correlation between them. Figure 3 shows the heat map and the hierarchical clustering based on correlation coefficients between six approaches in the six departments. It also shows that there are two clusters: the “barycenter” cluster and the “similarity matrix” cluster. When the same method is used correlations between WoS SCs and journal level of aggregation are strong. However, the correlation between N-dimensional and 2-dimensional cases is low to moderate.
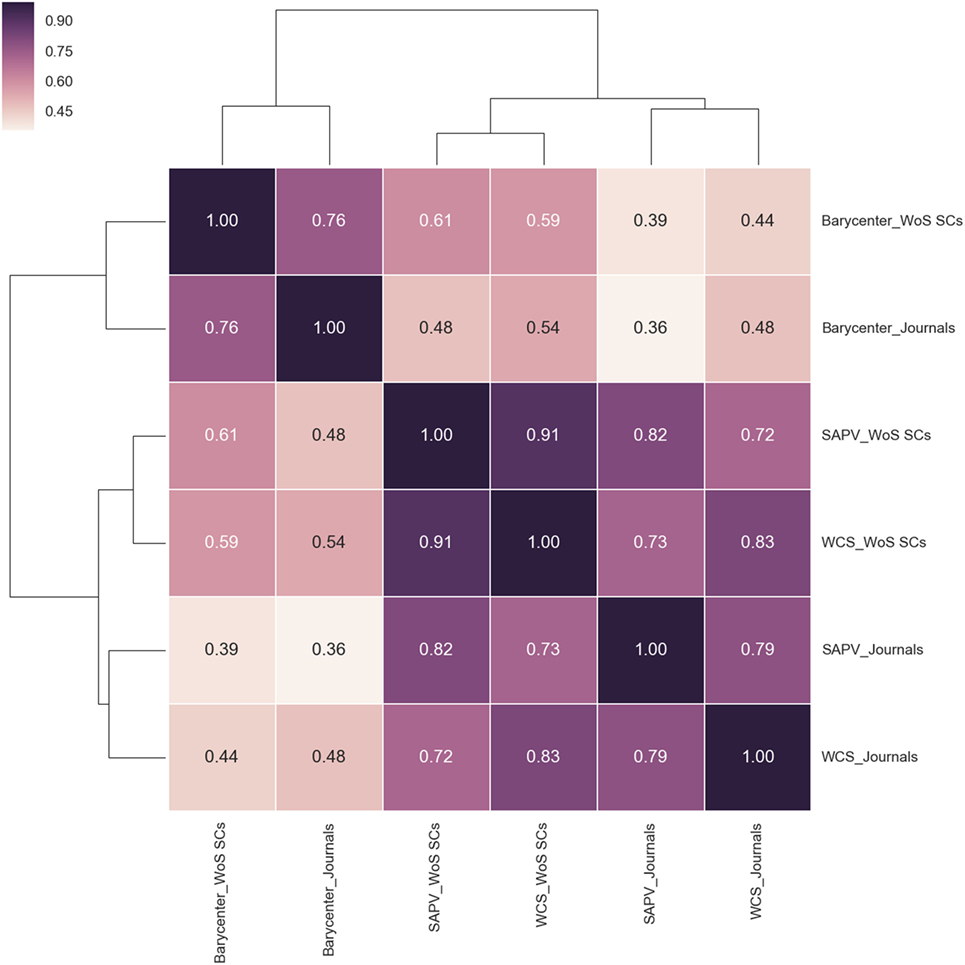
Figure 3. Heat map with hierarchical clustering based on correlation coefficient between six approaches in the six departments.
This finding suggests that different levels of aggregation tend to yield rather similar results. The influence of dimensionality (2-dimensions for barycenter versus N-dimensions for SAPV and WCS) is substantial, however. From here, we can conclude that the level of aggregation has a minor influence for determining cognitive distances in all the proposed six approaches, but the dimension matters.
Agreement between the Approaches
To answer the second research question, we explore whether the approaches agree regarding the PM at the closest cognitive distance to each group. Note that, in this case, we ignore CIs. Without taking CIs into account, the analysis is stricter than if we take CIs into account. Table A1 in Supplementary Material shows the PMs with the closest cognitive distance (first ranked) to the research groups in the six approaches.
There is a clear difference between 2-dimensional and N-dimensional approaches (Table A1 in Supplementary Material). At the journal level of aggregation, the SAPV and WSC methods agree in all, but five cases (91% match, research groups BIOL-G, PHYS-A, BIOM-I, CHEM-C, and PHAR-F) being exceptions. Furthermore, the barycenter method agrees in 30 cases (52%) with the SAPV method and in 27 cases (47%) with the WCS method. Barycenter, SAPV, and WCS methods agree in 27 cases (47%). Similarly, at the WoS SCs level of aggregation, the SAPV and the WCS methods agree in 49 cases (84%). The barycenter method agrees in 41 cases (71%) with SAPV and 34 cases (58%) with WCS. Barycenter, the SAPV and the WCS methods agree in 33 cases (57%).
We also explore whether the same method agrees at both levels of aggregation. Table A1 in Supplementary Material shows that the SAPV method agrees in 52 cases (90% matches), the WCS method in 53 cases (91% matches), and the barycenter method in 34 cases (59% matches). As the SAPV and WCS methods are in N-dimensions, we find that they agree in 47 out of 58 cases (81%) across both levels of aggregation. Hence, we conclude that for finding the first ranked PMs the SAPV and WCS approaches agree in most of the cases at both levels of aggregation, while the barycenter approaches yield considerably different results.
Finding Previously Assigned PMs
We have PMs’ assignment data for all departments, with the exception of Pharmaceutical Sciences. Therefore, the analysis is based on the other five departments. As we stated in the Section “Methods,” we calculated the total score according to procedure A. Tables A2 and A3 in Supplementary Material show the calculation for the Biology department. Table 7 summarizes the outcomes of all the six departments.
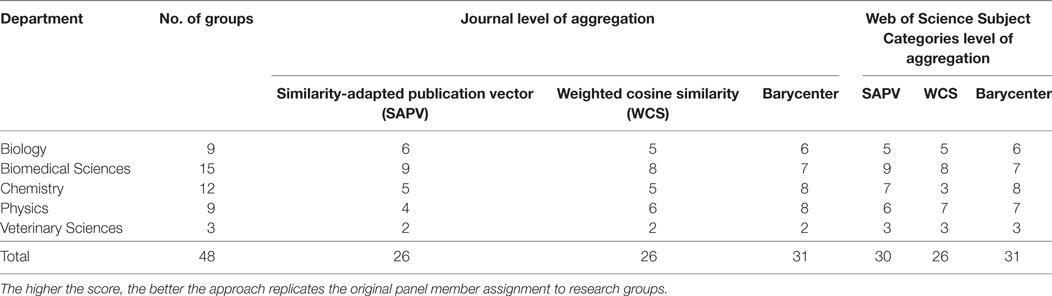
Table 7. The distribution of total scores for six approaches according to procedure A.
With the exception of Biomedical Sciences, the barycenter method (at both levels of aggregation) scores the same as or higher than the other two methods. This is also reflected in the total score. Contrary to what one might expect, the SAPV method scores higher at the level of WoS SCs than at the level of journals. For the WCS method, the level of aggregation does not make a difference. It is evident that the barycenter method performs better than the other two in terms of finding the main assessor for each research group.
We also calculated the total score according to procedure B. Tables A4 and A5 in Supplementary Material show the calculations of the Biology department PMs ranked positions and highlighted the PMs whose CI overlap with shortest distance PMs in all the six methods. Table 8 summarizes the outcomes of all the six departments.
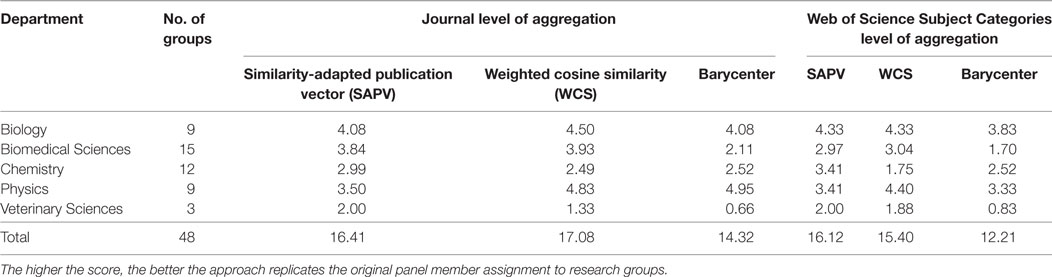
Table 8. The distribution of total scores for six approaches according to procedure B.
Table 8 shows that the journal level analysis scores higher than the WoS SCs level. Moreover, the N-dimensional approaches score higher than 2-dimension approaches at both levels of analysis. However, at both levels, the barycenter method always scores lower than the other methods. This result is what one expects theoretically: using journals is a more refined method than using WoS SCs, and performing calculations in N-dimensions yields a more precise outcome than performing calculations in two dimensions.
From the two procedures, we can conclude that in our case studies, the barycenter methods are, generally speaking, better able to find the main assessor. However, the methods based on barycenters are also less discriminatory, in that they tend to have more overlapping CIs. Simultaneously, all the methods score higher at the journal level than at the WOS SC level in uniquely identifying the main assessor. In addition, the SAPV and WCS methods score higher than the barycenter methods at both levels of aggregation.
Discussion
Our proposed approaches quantify the shortest cognitive distance between a research group and PMs. Simultaneously, they can be used to rank the PMs based on cognitive distances. If the CIs of some PMs overlap, the differences between them are relatively small and work as an indicator to assign the next potential PM to evaluate a research group. The methods can be used ex ante to inform the process during which potential PMs are identified and invited, as well as while the review process takes place (in view of division of labor within a panel) or ex post (to assess the appropriateness of a panel). The quantitative methods can support and inform experts during panel composition, similar to how scientometric indicators can support and inform peer review-based evaluations themselves.
If any of the proposed approaches totally agrees with the previous assignment of a main assessor, we may state that the panel chair or the research affairs department has rightly identified the expertise match between a PM and research group. However, that is not the case in any of the six approaches. The major reason is that the panel assignment was based on a qualitative judgment, whereas our methods use a quantitative approach based on the publication portfolio of panel and research groups. PMs and panel chairs are chosen following the suggestions of research groups and the research affairs department. Panel chairs have the list of PMs and their curricula vitae, and the research activity profile of the research groups as a means to come to a decision. The chair needs to reach a decision to assign a PM to one or two research groups based on the match of the expertise with the research group. As there is no formal method to match expertise, the panel chairs distributed the workload based on their own tacit knowledge. In all the cases except for Veterinary Sciences, there are more research groups than PMs. Hence, one PM can be close to multiple research groups, but due to practical considerations of workload distribution, the panel chair may not assign the PM to more than two research groups. Therefore, another PM who is intellectually further from a particular research group may be assigned to that research group for purely practical reasons.
We observed that some PMs are never the closest to any research group. This is for example the case for PM1 in the Chemistry panel and PM4 in the Veterinary Sciences panel. This raises the question why these members were included in a panel. We have observed that generally PMs are not assigned to more than two research groups, with two exceptions: PM8 of the Biomedical Sciences panel was assigned to three research groups and PM3 of the veterinary panel was not assigned to any research group. Our approaches can help to inform the assignment of PMs by quantifying the cognitive distance between individual PMs and research groups. The proposed approaches rank the PMs based on cognitive distances and indicate the PMs who are at a comparable distance from the research group through the overlap of CIs. The overlap of CIs of the shortest cognitive distance PMs with other potential PMs helps to assign next potential PMs to a research group. Even if a research group has no publications in the WoS SCs or journals where the panel has publications, the panel might be able to evaluate the research group (Rahman et al., 2015, 2016).
Asking research group members and/or PMs for their personal opinions might be an alternative method to determine PMs that are cognitively closest to a given research group. As the research evaluations mentioned in this article were done 3–8 years ago, this was not practically possible for our case studies.
Knowing cognitive distances between entities is an important aspect in panel composition, but in itself it is not sufficient. For instance, our approaches do not consider the aspect of cohesion (Casey-Campbell and Martens, 2009). Cohesion is the common bond that drives colleagues to remain together and to cooperate (Salas et al., 2015). In some cases, a PM could be included in a panel for other reasons than their specific research expertise in relation to the research groups. For example, there might be a selection of a panel chair based on his/her expertise in the discipline in general (e.g., PM1 in the Chemistry panel). S/he may not be the closest PM based on publication profiles to any of the research groups that will be evaluated. A reason could be that the PM plays an important role for the cohesion of the panel. Hence, cohesion may be an indicator in expert panel composition, to be applied in a step-wise manner, once the chair has been selected.
We note that the 2-dimensional base maps at the level of WoS SCs as well as journals are publicly available. In addition, a similarity matrix of WoS SCs is also readily available. A journal similarity matrix, on the other hand, is not available openly. The Journal Citation Reports of 2014 contain 11,149 journals in the SCIE and SSCI (Leydesdorff et al., 2016). This constitutes an increase by 474 journals compared to the journal similarity matrix we used in this article. Since evaluations are retrospective, it is not necessary to always have the most recent journal similarity matrix. Moreover, journals are not static entities and may undergo name changes over time, split in different new journals, or two or more journals can be merged together [see Rahman et al. (2016) for details]. However, any changes to the journal similarity matrix will have—at least in theory—a direct impact on the cognitive distances obtained. It is a topic for further investigation to find out to what extent the cognitive distances differ and the CIs overlap if a different base map or similarity matrix (based on different years) are used for the same panel and research groups.
We have used similarity matrices and base maps derived from them based on data available during the construction of the matrices. If the similarity matrix changed over the years, and we keep the same panel and research groups publication data, this might result in different cognitive distances. Moreover, if we use a different similarity matrix (for example, based on Scopus data) and retrieve the same panel and research groups’ data, we can expect different results as well, because the similarity matrix and the data will not be the same. An interesting follow-up investigation could therefore be based on Scopus data (e.g., Leydesdorff et al., 2010, 2015). Hence, although there is a practical stability problem, the methods we introduced have general applicability.
Our methods start from journal article profiles of PMs and research groups, assuming that these publication profiles adequately represent their expertise or research interest. Therefore, our proposed approaches might be less acceptable in some fields, such as engineering or computer sciences, where core conferences are important publication outlets for original research (Rahm, 2008), or the social sciences and humanities where a large part of the total output occurs as monographs (Engels et al., 2012).
Conclusion
The approaches proposed in this paper can guide the process of panel composition and allow the concerned authority to assess how well the expertise of PMs corresponds with the research interests of the groups to be evaluated (Rahman et al., 2015, 2016; Rousseau et al., 2017). In this article, we focused on the question which of the approaches best reflect cognitive distance, how much influence the level of aggregation (journals and WoS SCs) plays, and how much the dimensionality matters. The results show that the level of aggregation (journals and WoS SCs) has only minor influence for determining cognitive distances in all the proposed six approaches, whereas the influence of the number of dimensions (2 versus N) is substantial. The results also show that the number of dimensions plays a role in the case of identifying shortest cognitive distance. While the SAPV and WCS methods agree at both levels of aggregation, the barycenter method yields different results to identify the PMs at the shortest cognitive distance.
We find that the barycenter method scores highest at both levels of aggregation to identify the previously assigned main assessor. This finding is aligned with our earlier finding that the barycenter method has less discriminatory power than the other methods at WoS SCs level of aggregation (Rousseau et al., 2017). When it comes to uniquely identifying the main assessor, all methods score better at the journal level than at the WoS SC level.
The proposed approaches can be tested in any future scenario where X PMs need to be chosen out of N candidates. Panel composition based on different approaches can then be matched with the opinion of the panel chair. Concrete differences can then be discussed, leading to a better panel composition. In addition, the opinion of the respective PMs can be taken into account beforehand, so that the main assessor is indeed the most qualified person for the job.
Author Contributions
Designed the study and interpreted the results: AR, RG, RR, and TE. Performed the analysis and wrote the first version of the manuscript: AR and RG. Revised the manuscript: RG, RR, and TE.
Conflict of Interest Statement
The authors declare that the research was conducted in the absence of any commercial or financial relationships that could be construed as a potential conflict of interest.
Acknowledgments
The authors thank Loet Leydesdorff making the journal similarity data available and for his collaboration in Rahman et al. (2016).
Funding
This investigation has been made possible by the financial support of the Flemish government to ECOOM. The opinions in the paper are the authors’ and not necessarily those of the government.
Supplementary Material
The Supplementary Material for this article can be found online at https://www.frontiersin.org/article/10.3389/frma.2017.00006/full#supplementary-material.
References
Abramo, G., and D’Angelo, C. A. (2011). Evaluating research: from informed peer review to bibliometrics. Scientometrics 87, 499–514. doi: 10.1007/s11192-011-0352-7
Aksnes, D. W., and Taxt, R. E. (2004). Peer reviews and bibliometric indicators: a comparative study at a Norwegian university. Res. Eval. 13, 33–41. doi:10.3152/147154404781776563
Allen, L., Jones, C., Dolby, K., Lynn, D., and Walport, M. (2009). Looking for landmarks: the role of expert review and bibliometric analysis in evaluating scientific publication outputs. PLoS ONE 4:e5910. doi:10.1371/journal.pone.0005910
Bazeley, P. (1998). Peer review and panel decisions in the assessment of Australian Research Council project grant applicants: what counts in a highly competitive context? Higher Educ. 35, 435–452. doi:10.1023/A:1003118502318
Benda, W. G. G., and Engels, T. C. E. (2011). The predictive validity of peer review: a selective review of the judgmental forecasting qualities of peers, and implications for innovation in science. Int. J. Forecast. 27, 166–182. doi:10.1016/j.ijforecast.2010.03.003
Bornmann, L. (2011). Scientific peer review. Annu. Rev. Inform. Sci. Technol. 45, 197–245. doi:10.1002/aris.2011.1440450112
Bornmann, L., and Daniel, H.-D. (2005). Selection of research fellowship recipients by committee peer review. Reliability, fairness and predictive validity of board of trustees’ decisions. Scientometrics 63, 297–320. doi:10.1007/s11192-005-0214-2
Bornmann, L., and Daniel, H.-D. (2006). Potential sources of bias in research fellowship assessments: effects of university prestige and field of study. Res. Eval. 15, 209–219. doi:10.3152/147154406781775850
Boyack, K. W. (2009). Using detailed maps of science to identify potential collaborations. Scientometrics 79, 27. doi:10.1007/s11192-009-0402-6
Boyack, K. W., Chen, M.-C., and Chacko, G. (2014). Characterization of the peer review network at the center for scientific review, National institutes of health. PLoS ONE 9:e104244. doi:10.1371/journal.pone.0104244
Casey-Campbell, M., and Martens, M. L. (2009). Sticking it all together: a critical assessment of the group cohesion–performance literature. Int. J. Manage. Rev. 11, 223–246. doi:10.1111/j.1468-2370.2008.00239.x
Cicchetti, D. V. (1991). The reliability of peer review for manuscript and grant submissions: a cross-disciplinary investigation. Behav. Brain Sci. 14, 119–135. doi:10.1017/S0140525X00065675
Daniel, H., Mittag, S., and Bornman, L. (2007). “The potential and problems of peer evaluation in higher education and research,” in Quality Assessment for Higher Education in Europe, eds A. Cavalli (London, UK: Portland Press), 71–82.
Efron, B., and Tibshirani, R. J. (1998). An Introduction to the Bootstrap. London: Chapman & Hall/CRC.
Egghe, L., and Rousseau, R. (1990). Introduction to Informetrics. Elsevier Science Publishers. Available at: https://uhdspace.uhasselt.be/dspace/handle/1942/587.
Engels, T. C. E., Goos, P., Dexters, N., and Spruyt, E. H. J. (2013). Group size, h-index, and efficiency in publishing in top journals explain expert panel assessments of research group quality and productivity. Res. Eval. 22, 224–236. doi:10.1093/reseval/rvt013
Engels, T. C. E., Ossenblok, T. L. B., and Spruyt, E. H. J. (2012). Changing publication patterns in the Social Sciences and Humanities, 2000–2009. Scientometrics 93, 373–390. doi:10.1007/s11192-012-0680-2
Geuna, A., and Martin, B. R. (2003). University research evaluation and funding: an International comparison. Minerva 41, 277–304. doi:10.1023/B:MINE.0000005155.70870.bd
Golledge, R. G. (1987). “Environmental cognition,” in Handbook of Environmental Psychology, Vol. 1, eds D. Stokols and I. Altman (New York: Wiley), 131–174.
Guns, R. (2016a). Bootstrapping Confidence Intervals for the Distances between Barycenters. Available at: http://nbviewer.jupyter.org/gist/rafguns/6fa3460677741e356538337003692389
Guns, R. (2016b). Confidence Intervals for Weighted Cosine Similarity. Available at: http://nbviewer.jupyter.org/gist/rafguns/faff8dc090b67a783b85d488f88952ba
Hammarfelt, B., and de Rijcke, S. (2015). Accountability in context: effects of research evaluation systems on publication practices, disciplinary norms, and individual working routines in the faculty of Arts at Uppsala University. Res. Eval., 24(1), 63–77. doi:10.1093/reseval/rvu029
Hautala, J. (2013). Cognitive proximity in international research groups. J. Knowl. Manage., 15(4), 601–624. doi:10.1108/13673271111151983
HEFCE. (2015). The Metric Tide: Correlation Analysis of REF2014 Scores and Metrics (Supplementary Report II to the Independent Review of the Role of Metrics in Research Assessment and Management). Higher Education Funding Council for England (HEFCE). Available at: http://www.dcscience.net/2015_metrictideS2.pdf
Jin, B., and Rousseau, R. (2001). An introduction to the barycentre method with an application to China’s mean centre of publication. Libri 51, 225–233. doi:10.1515/LIBR.2001.225
Langfeldt, L. (2004). Expert panels evaluating research: decision-making and sources of bias. Res. Eval. 13, 51–62. doi:10.3152/147154404781776536
Leydesdorff, L., and Bornmann, L. (2016). The operationalization of “fields” as WoS subject categories (WCs) in evaluative bibliometrics: the cases of “library and information science” and “science & technology studies”. J. Assoc. Inform. Sci. Technol. 67, 707–714. doi:10.1002/asi.23408
Leydesdorff, L., Bornmann, L., and Zhou, P. (2016). Construction of a pragmatic base line for journal classifications and maps based on aggregated journal-journal citation relations. J. Inform. 10, 902–918. doi:10.1016/j.joi.2016.07.008
Leydesdorff, L., and Rafols, I. (2012). Interactive overlays: a new method for generating global journal maps from Web-of-Science data. J. Inform. 6, 318–332. doi:10.1016/j.joi.2011.11.003
Leydesdorff, L., Rafols, I., and Chen, C. (2013b). Interactive overlays of journals and the measurement of interdisciplinarity on the basis of aggregated journal–journal citations. J. Am. Soc. Inf. Sci. Technol. 64, 2573–2586. doi:10.1002/asi.22946
Leydesdorff, L., Rafols, I., and Chen, C. (2013b). Interactive overlays of journals and the measurement of interdisciplinarity on the basis of aggregated journal–journal citations. J. Am. Soc. Inf. Sci. Technol. 64, 2573–2586. doi:10.1002/asi.22946
Leydesdorff, L., de Moya-Anegón, F., and Guerrero-Bote, V. P. (2010). Journal maps on the basis of Scopus data: a comparison with the Journal Citation Reports of the ISI. J. Assoc. Inform. Sci. Technol. 61, 352–369. doi:10.1002/asi.21250
Leydesdorff, L., Moya-Anegón, F., and Guerrero-Bote, V. P. (2015). Journal maps, interactive overlays, and the measurement of interdisciplinarity on the basis of Scopus data (1996–2012). J. Assoc. Inform. Sci. Technol. 66, 1001–1016. doi:10.1002/asi.23243
Leydesdorff, L., and Rafols, I. (2009). A global map of science based on the ISI subject categories. J. Am. Soc. Inf. Sci. Technol. 60, 348–362. doi:10.1002/asi.20967
McCullough, J. (1989). First comprehensive survey of NSF applicants focuses on their concerns about proposal review. Sci. Technol. Human Values 14, 78–88. doi:10.1177/016224398901400107
Montello, D. R. (1991). The measurement of cognitive distance: methods and construct validity. J. Environ. Psychol. 11, 101–122. doi:10.1016/S0272-4944(05)80071-4
Muscio, A., and Pozzali, A. (2013). The effects of cognitive distance in university-industry collaborations: some evidence from Italian universities. J. Technol. Transfer 38, 486–508. doi:10.1007/s10961-012-9262-y
Nooteboom, B. (2000). Learning by interaction: absorptive capacity, cognitive distance and governance. J. Manage. Govern. 4, 69–92. doi:10.1023/A:1009941416749
OECD. (1997). The Evaluation of Scientific Research: Selected Experiences. Paris: OECD, 1–112. Available at: http://www.oecd.org/science/sci-tech/2754549.pdf
Over, R. (1996). Perceptions of the Australian research council large grants scheme: differences between successful and unsuccessful applicants. Austr. Educ. Res. 23, 17–36. doi:10.1007/BF03219618
Pudovkin, A. I., and Garfield, E. (2002). Algorithmic procedure for finding semantically related journals. J. Am. Soc. Inf. Sci. Technol. 53, 1113–1119. doi:10.1002/asi.10153
Rafols, I., Porter, A. L., and Leydesdorff, L. (2010). Science overlay maps: a new tool for research policy and library management. J. Am. Soc. Inf. Sci. Technol. 61, 1871–1887. doi:10.1002/asi.21368
Rahm, E. (2008). Comparing the scientific impact of conference and journal publications in computer science. Inform. Serv. Use 28, 127–128. doi:10.3233/ISU-2008-0562
Rahman, A. I. M. J., Guns, R., Leydesdorff, L., and Engels, T. C. E. (2016). Measuring the match between evaluators and evaluees: cognitive distances between panel members and research groups at the journal level. Scientometrics 109, 1639–1663. doi:10.1007/s11192-016-2132-x
Rahman, A. I. M. J., Guns, R., Rousseau, R., and Engels, T. C. E. (2015). Is the expertise of evaluation panels congruent with the research interests of the research groups: a quantitative approach based on barycenters. J. Inform. 9, 704–721. doi:10.1016/j.joi.2015.07.009
REF2014. (2014). Research Excellence Framework. Available at: http://www.ref.ac.uk/
Rehn, C., Kronman, U., Gornitzki, C., Larsson, A., and Wadskog, D. (2014). Bibliometric Handbook for Karolinska Institutet. Stockholm, Sweden: Karolinska Institute.
Rousseau, R. (1989). Kinematical statistics of scientific output. Part II: standardized polygonal approach. Revue Française de Bibliométrie 4, 65–77.
Rousseau, R., Guns, R., Rahman, A. I. M. J., and Engels, T. C. E. (2017). Measuring cognitive distance between publication portfolios. J. Inform. 11, 583–594. doi:10.1016/j.joi.2017.03.001
Rybak, J., Balog, K., and Nørvåg, K. (2014). “ExperTime: tracking expertise over time,” in Proceedings of the 37th International ACM SIGIR Conference on Research & Development in Information Retrieval (Broadbeach, Australia: ACM), 1273–1274.
Salas, E., Grossman, R., Hughes, A. M., and Coultas, C. W. (2015). Measuring team cohesion: observations from the science. Hum. Factors 57, 365–374. doi:10.1177/0018720815578267
Sokal, R. R., and Michener, C. D. (1958). A statistical method for evaluating systematic relationships. Univ. Kansas Sci. Bull. 38(Part II), 1409–1438.
Soós, S., and Kampis, G. (2012). Beyond the basemap of science: mapping multiple structures in research portfolios: evidence from Hungary. Scientometrics 93, 869–891. doi:10.1007/s11192-012-0713-x
Taylor, J. (2011). The assessment of research quality in UK universities: peer review or metrics? Br. J. Manage. 22, 202–217. doi:10.1111/j.1467-8551.2010.00722.x
Wang, Q., and Sandström, U. (2015). Defining the role of cognitive distance in the peer review process with an explorative study of a grant scheme in infection biology. Res. Eval. 24, 271–281. doi:10.1093/reseval/rvv009
Warner, J. (2003). Citation analysis and research assessment in the United Kingdom. Bull. Am. Soc. Inform. Sci. Technol. 30, 26–27. doi:10.1002/bult.302
Wessely, S. (1998). Peer review of grant applications: what do we know? Lancet 352, 301–305. doi:10.1016/S0140-6736(97)11129-1
Whitley, R. (2007). “Changing governance of the public sciences,” in The Changing Governance of the Sciences: The Advent of Research Evaluation Systems, Vol. 26, eds R. Whitley and J. Gläser (Netherlands: Springer), 3–27.
Keywords: cognitive distances, research expertise, research evaluation, barycenters, similarity-adapted publication vectors, weighted cosine similarity
Citation: Rahman AIMJ, Guns R, Rousseau R and Engels TCE (2017) Cognitive Distances between Evaluators and Evaluees in Research Evaluation: A Comparison between Three Informetric Methods at the Journal and Subject Category Aggregation Level. Front. Res. Metr. Anal. 2:6. doi: 10.3389/frma.2017.00006
Received: 19 June 2017; Accepted: 03 August 2017;
Published: 23 August 2017
Edited by:
Staša Milojević, Indiana University Bloomington, United StatesReviewed by:
Isola Ajiferuke, University of Western Ontario, CanadaNicolás Robinson-Garcia, Universitat Politècnica de València, Spain
Copyright: © 2017 Rahman, Guns, Rousseau and Engels. This is an open-access article distributed under the terms of the Creative Commons Attribution License (CC BY). The use, distribution or reproduction in other forums is permitted, provided the original author(s) or licensor are credited and that the original publication in this journal is cited, in accordance with accepted academic practice. No use, distribution or reproduction is permitted which does not comply with these terms.
*Correspondence: Raf Guns, raf.guns@uantwerpen.be