An Immersive Self-Report Tool for the Affective Appraisal of 360° VR Videos
 Alexander Toet
 Fabienne Heijn
 Anne-Marie Brouwer
 Tina Mioch
 Jan B. F. van Erp
- 1Netherlands Organisation for Applied Scientific Research TNO Human Factors, Soesterberg, Netherlands
- 2Faculty of Social and Behavioral Sciences, Applied Cognitive Psychology, University of Utrecht, Utrecht, Netherlands
- 3Human Media Interaction, University of Twente, Enschede, Netherlands
Immersive 360° virtual reality (VR) movies can effectively evoke a wide range of different emotional experiences. To this end, they are increasingly deployed in entertainment, marketing and research. Because emotions influence decisions and behavior, it is important to assess the user's affective appraisal of immersive 360° VR movies. Knowledge of this appraisal can serve to tune media content to achieve the desired emotional responses for a given purpose. To measure the affective appraisal of immersive VR movies, efficient immersive and validated instruments are required that minimally interfere with the VR experience itself. Here we investigated the convergent validity of a new efficient and intuitive graphical (emoji-based) affective self-report tool (the EmojiGrid) for the assessment of valence and arousal induced by videos representing 360° VEs (virtual environments). Thereto, 40 participants rated their emotional response (valence and arousal) to 62 videos from a validated public database of 360° VR movies using an EmojiGrid that was embedded in the VE, while we simultaneously assessed their autonomic physiological arousal through electrodermal activity. The mean affective ratings obtained with the EmojiGrid and those provided with the database (measured with an alternative and validated instrument) show excellent agreement for valence and good agreement for arousal. The mean arousal ratings obtained with the EmojiGrid also correlate strongly with autonomic physiological arousal. Thus, the EmojiGrid appears to be a valid and immersive affective self-report tool for measuring VE-induced emotions.
Introduction
Motivation of This Study
Interactive and immersive VR movies and virtual environments can effectively evoke a wide range of different emotions (Felnhofer et al., 2015; Ding et al., 2018; Chirico and Gaggioli, 2019). As a result, these media are increasingly deployed in entertainment, marketing and research. However, despite their increasing popularity, it is still not clear how the VE content should be designed to achieve the desired emotional responses of users (Riva et al., 2007). To explore this relation, we need efficient and validated affective self-report instruments to measure the affective responses to VR experiences (Oliveira et al., 2018). In this study we investigate the convergent validity of a new affective self-report tool for the assessment of immersive VE-induced emotions.
According to the circumplex model of affect (Russell, 1980), emotions can be described by their two main principal dimensions: valence (pleasantness) and arousal. Valence refers to the degree of positive or negative affective response to a stimulus, while arousal refers to the intensity of the affective response (i.e., the degree of activation or deactivation). This suggests that participants can report their emotional state by responding along these two dimensions.
Various methods are currently available to assess the affective quality of VR experiences. These methods can be classified as objective and subjective measures (for an overview and discussion see Skarbez et al., 2017). Objective measures include physiological measures (e.g., heart rate variability, pupil size variability, electrodermal activity, electrocardiogram data, electromyogram data, electroencephalogram data, functional magnetic resonance data) and behavioral measures (e.g., gaze behavior, reflexive responses, postural sway). Physiological measures are objective, but also more elaborate and typically require extensive post-processing and interpretation (Brouwer et al., 2015). Subjective measures are typically obtained through questionnaires and rating tools. Although these instruments are typically intrusive, they are still the preferred method of investigation since they are cheap and easy to administer in almost any condition (Grassini and Laumann, 2020).
We recently introduced the EmojiGrid (Toet et al., 2018: see section The EmojiGrid; Kaneko et al., 2018b): an emoji-based graphical self-report tool to assess valence and arousal. The tool is intuitive since it does not require a large amount of cognitive effort, efficient since valence and arousal are registered with a single response, and easy to administer since a response merely requires pointing at the grid and clicking a button. Embedding the EmojiGrid in a VE may therefore enable users to report the affective appraisal of their experience in a minimally disruptive way.
In this study we evaluate the convergent validity of the EmojiGrid as an affective self-report tool for the appraisal of immersive VR experiences. Thereto, we measured the emotional response (valence and arousal) of 40 participants to 62 immersive 360° VR video clips from a database that has previously been validated (Li et al., 2017), and we compared our results with the corresponding ratings provided by the authors of this database. In addition, we obtained an objective measure of arousal by measuring Electro Dermal Activity (EDA), which has been established as a reliable marker for physiological arousal [Roth, 1983: see section Electrodermal Activity (EDA); Boucsein, 1999; Brouwer et al., 2018].
Background
Virtual reality (VR) can be defined as an interactive computer representation of a 3D environment with the ability to give the user a sense of immersion and presence (Gutierrez et al., 2008). The representation may either be a capture (video) of a real environment or a computer generated virtual environment (VE). A VR system allows the user to explore the represented three-dimensional space in real-time. “Immersion” refers to the technological capability of the system to encompass the user and isolate her from the real world (Slater and Wilbur, 1997). “Presence” is the subjective feeling of being located in a VE rather than in the place where one's physical body is actually situated (see also Riva and Waterworth, 2003; e.g., Waterworth et al., 2015).
Immersive 360° VR videos are steadily growing in popularity on social media platforms (e.g., YouTube and Facebook). This is largely due to the increasing availability, quality and comfort of head-mounted displays (HMDs). An immersive 360° VR video is a photorealistic representation of a scene that updates with head-orientation. A total surround scene is obtained by stitching the recordings from multiple cameras together through software. In contrast to traditional videos, in which the user's point of view is fixed and preset by the producer, a viewer watching a video in 360° VR format can interactively select at each instant the direction from which to see the VR scene, resulting in a more immersive experience (e.g., Ramalho and Chambel, 2013). Thus, the user has the freedom to explore the content based on her own interest. Some typical features distinguishing 360° VR video from regular videos are a wide field-of-view (the extent of the observable part of the scene) and natural control over the viewing direction.
Individuals using immersive VR systems that present a full 360° field of view can experience a significant degree of presence while showing a wide range of physiological and emotional responses (Riva et al., 2007; Felnhofer et al., 2015; Oliveira et al., 2018, 2020). The intensity of the elicited emotions is typically higher for more immersive VR systems (i.e., for systems that isolate the user's senses from the external world) than for less immersive systems (Visch et al., 2010; Kim et al., 2014; Beck and Egger, 2018; Ding et al., 2018; Simon and Greitemeyer, 2019) and can be comparable to those evoked by real-life scenarios (Chirico and Gaggioli, 2019). While stereoscopic viewing may elicit stronger emotions (Peperkorn et al., 2015), this finding is not unequivocal (Baños et al., 2008; Ling et al., 2012) and probably depends on the VR contents and scenario. The interaction between presence and emotions appears to be mediated by arousal (Freeman et al., 2005; Diemer et al., 2015) and seems to be reciprocal: higher levels of presence induce stronger emotions (e.g., Västfjäll, 2003), while emotional VEs evoke higher levels of presence (Riva et al., 2007; Gorini et al., 2011). However, the level of presence in a VE seems to be more strongly influenced by emotional factors (i.e., by its content) than by technological attributes of the VE system (i.e., the degree of immersion). Thus, even low-immersive systems may induce high levels of presence if the VR scenario sufficiently engages emotions (Diemer et al., 2015).
The desire for emotional experiences is widely considered to be the main driver for using 360° VR in entertainment, underlying its increasing popularity on video streaming platforms.
Immersive VR is also applied in many other fields where emotions are an important factor, like studies involving consumer behavior and product evaluation (Sester et al., 2013; Bangcuyo et al., 2015; Bonetti et al., 2018; Andersen et al., 2019; Sinesio et al., 2019), the (participatory) design of (landscape) architecture (built) environments and soundscapes to assess the affective appraisal of planned environments (Mobach, 2008; Portman et al., 2015; Hayek et al., 2016; Echevarria Sanchez et al., 2017; Patterson et al., 2017; Puyana-Romero et al., 2017), and product design (Pitt et al., 2005; Söderman, 2005; Hilfert and König, 2016). Immersive VR is also used to study the healing effects of natural environments and to provide restorative environments for relaxation purposes (Valtchanov et al., 2010; Calogiuri et al., 2018), such as the Sensiks Experience Pod (www.sensiks.com). The news industry has adopted immersive 360° videos (Hendriks Vettehen et al., 2019) to give viewers the feeling that they are present at the location of the event, so that they can experience the news story rather than merely watch it (de la Peña et al., 2010; Wang et al., 2018). By establishing an emotional connection between subject and viewer (Hendriks Vettehen et al., 2019) these videos may ultimately lead to greater audience's emotional involvement in current events (de la Peña et al., 2010). The tourism industry has embraced immersive VR systems as a powerful destination marketing tool (Guttentag, 2010; Huang et al., 2016; Marasco et al., 2018; Trindade et al., 2018). In addition to merely providing information, immersive VR systems can provide prospective travelers a compelling virtual experience of remote destinations by allowing them to explore real-world pre-captured (e.g., Fibbi et al., 2015; Tussyadiah et al., 2016) or real-time (e.g., drone-transmitted: Mirk and Hlavacs, 2014) 360° footage. Hence, these systems may provide customers a sneak preview or “try before you buy” travel pre-experience (Tussyadiah et al., 2016, 2017). This is expected to lead to better informed decisions and more realistic expectations, ultimately resulting in a more satisfactory vacation. In this type of experiential marketing (Schmitt, 1999), it is crucial to understand the viewer's emotional responses (Prayag et al., 2013; Beck and Egger, 2018), since travel-decisions are significantly influenced by momentary emotions (Walls et al., 2011). The goal is to enhance the persuasive power of VR by presenting destinations in creative ways that induce higher levels of arousal and positive valence (Tussyadiah et al., 2016).
Despite the increasing mass consumption of VE experiences in entertainment and the steadily growing number of people that watch VR movies using immersive HMDs, it is still not clear how the content of VR media relates to the user's emotional responses (Riva et al., 2007; Oliveira et al., 2018). Hence, more research is needed to fully understand how VR content and its underlying technologically determines the emotions and sense of presence in VE (Seth et al., 2012), and particularly research that compares the emotional effects evoked by real-life experiences to those elicited by corresponding VR experiences (Riva et al., 2007). An essential requirement for these type of studies is the availability of validated and efficient tools for the assessment of affective responses to VR experiences (Oliveira et al., 2018). Preferably, these instruments should be able to unobtrusively blend into the VE so that users do not lose their sense of immersion when they need to step out of the VR to give a response (Regal et al., 2019; Krüger et al., 2020; Voigt-Antons et al., 2020). The recently introduced EmojiGrid is a viable candidate since it is intuitive and language independent (and therefore probably requires minimal cognitive effort: Kaneko et al., 2018b; Toet et al., 2018; Toet and van Erp, 2019; Voigt-Antons et al., 2020), and since it can easily be embedded in a VE.
Related Work
In previous studies on the emotional response to 360° VR systems, users reported their emotions using lists of emotional terms (Suhaimi et al., 2018), verbal rating scales (Riva et al., 2007; Estupiñán et al., 2014; Sharar et al., 2016; Beck and Egger, 2018; Chirico and Gaggioli, 2019), the Self-Assessment Mannikin (SAM: Lang, 1980; e.g., Kim et al., 2014; Marín-Morales et al., 2018; Oliveira et al., 2018) or questionnaires like the Positive and Negative Affect Scale (PANAS: Watson et al., 1988; e.g., Macedonio et al., 2007; Riva et al., 2007; Ding et al., 2018) and the State-Trait Anxiety Inventory (STAI: Spielberger, 1983; e.g., Riva et al., 2007). These tools demand cognitive effort (interpretation) by the user and a significant amount of time to complete (e.g., the PANAS and STAI; Kaneko et al., 2018a) or successive cognitive interpretations of current sensations (Likert, VAS or SAM: Estupiñán et al., 2014; Sharar et al., 2016; Higuera-Trujillo et al., 2017; Marín-Morales et al., 2018; Oliveira et al., 2018). Since the use of these instruments is likely to affect the user's sense of presence, immersion and involvement, they are typically not embedded in the VE itself, but applied after ending the VR experience. As a result, the measurements thus obtained may not fully reflect the range of different emotions that were experienced over the entire course of the VE experience. This suggests a need for immersive affective self-report tools to assess VR evoked emotions, preferably at multiple instances during the VR experience itself (Bouchard et al., 2004; Regal et al., 2019; Oliveira et al., 2020). Recent studies showed that the inclusion of an affective rating tool in the VE can speed up user response by almost a factor of five compared to paper and pencil methods (Krüger et al., 2020), while the superposition of a two-dimensional affective response grid over 360° videos affords continuous affective ratings (Voigt-Antons et al., 2020; Xue et al., 2020). It has also been shown that self-report tools are less invasive and yield more reliable results when they used inside a VR, compared to their application outside the VR (Schwind et al., 2019; Putze et al., 2020).
The EmojiGrid
Although a range of explicit and implicit measures to measure a person's affective state is currently available, there is still no widely accepted method (Mauss and Robinson, 2009). Questionnaires are still the most practical method to assess emotions (Kaneko et al., 2018a). There are two types of questionnaires: verbal questionnaires (King and Meiselman, 2010; Spinelli et al., 2014; Nestrud et al., 2016) and graphical questionnaires (Bradley and Lang, 1994; Obaid et al., 2008; Vastenburg et al., 2011; Laurans and Desmet, 2012; Broekens and Brinkman, 2013; Huisman et al., 2013).
Verbal questionnaires enable people to report their affective state by rating or selecting words that most closely express their momentary affective state. However, these tools have several shortcomings (Toet et al., 2018): (1) people often find it difficult to find the right words to express their emotions, (2) in different cultures and languages emotions are described in different ways using different terms, (3) describing an experience as it happens can affect its nature, and (4) individuals have different vocabularies and language abilities. Also, it requires a considerable amount of time and cognitive effort to describe emotions in words (and this disadvantage increases when questionnaires need to be filled out more than once over the course of an experiment).
Graphical tools enable users to report their affective state in a more intuitive and cognitively less demanding way by indicating the (part of the) figure that best represents their current feelings (see Zentner and Eerola, 2010 for a discussion of the advantages of graphical self-report tools; Toet et al., 2018). Instead of requiring users to verbalize their emotions, these tools use the human ability to intuitively and reliably link graphical elements to human emotions (Aronoff et al., 1988; Windhager et al., 2008; Larson et al., 2012; Watson et al., 2012).
A well-known and widely used graphical affective self-report is the SAM (Self-Assessment Mannikin: Bradley and Lang, 1994). Although the SAM has been validated in several studies, it has also been acknowledged that it has some serious drawbacks. First, although its graphical representation of the valence dimension appears quite intuitive, the way in which the dominance dimension is depicted appears much harder to understand, while the arousal dimension (depicted as an “explosion” in the stomach area) can be misinterpreted (Broekens and Brinkman, 2013; Betella and Verschure, 2016; Chen et al., 2018; Toet et al., 2018). Second, users need to respond to each of the affective dimensions separately and consecutively.
We therefore recently introduced the EmojiGrid (Figure 1; see also Toet et al., 2018) as an intuitive (language independent) and efficient alternative to the SAM. The EmojiGrid is a rectangular grid inspired by the Affect Grid (Russell et al., 1989), but instead of using text labels, its axes are labeled with emoji depicting iconic facial expressions. The expressions of the emoji along the horizontal (valence) axis range from unhappy/not pleased via neutral to happy/pleased, while their intensity gradually increases along the vertical (arousal) axis. The opening of the mouth and the shape of the eyes represents the arousal dimension, while the concavity of the mouth, the orientation and curvature of the eyebrows, and the vertical distribution of these features over the area of the face corresponds to the degree of arousal. In contrast to the SAM, the EmojiGrid does not assess dominance, since the two-dimensional valence and arousal space that constitutes the so called “core affect” (Russell, 2003) is sufficient to describe basic emotions (Russell and Feldman Barrett, 1999; see also Gorini et al., 2009; Mattek et al., 2017).
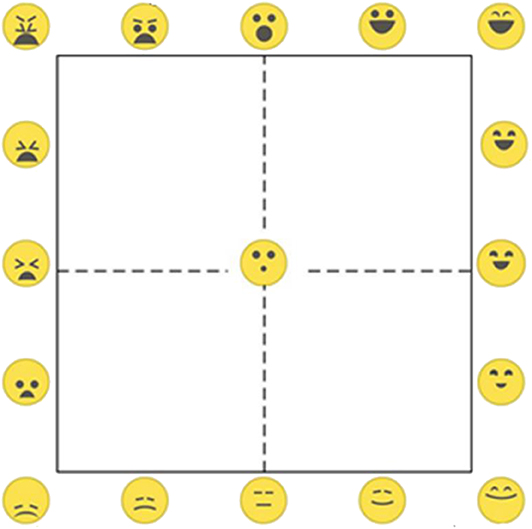
Figure 1. The EmojiGrid.
Validation studies investigating both the individual emojis and their linear arrangement along the valence and arousal dimensions (i.e., the ordering of the emoji along the sides) of the EmojiGrid and their circular arrangement along its borders, showed that participants reliably interpreted the intended degrees of valence and arousal represented by the individual emoji on the EmojiGrid, and that the order in which the different emoji were arranged along the borders of the EmojiGrid appeared highly intuitive (Toet et al., 2018). In the context of food-evoked affective responses, we found that the EmojiGrid yielded appropriate responses whereas the SAM's arousal dimension was typically misinterpreted (Toet et al., 2018). The EmojiGrid has been extensively validated with different age groups, cultures and ethnicities (Kaneko et al., 2018b; Toet et al., 2018, 2019b; Toet and van Erp, 2019).
Users can report their subjectively experienced valence and arousal through the EmojiGrid by positioning a cursor on the location that best represents their affective appraisal and by pressing a response button to register their response (e.g., by pointing and clicking with a mouse). A simple linear scaling can be applied to map the two dimensions of the EmojiGrid to the desired response range. The tool is easy to use, requires minimal instructions (the facial expressions are intuitive and do not need additional explaining), and is efficient (a single response suffices to report both valence and arousal). This suggests that embedding the EmojiGrid in a VE could afford users a way to report their affective response while minimally disrupting the VR experience itself.
Electrodermal Activity (EDA)
Electrodermal activity (EDA) mainly results from an activation of the sweat glands (Andreassi, 2013). Sweat production increases the conductivity of current through the skin. Sweat glands are directly linked to the “fight or flight” sympathetic branch of the autonomous nervous system (Dawson et al., 2000; Benedek and Kaernbach, 2010) such that EDA is a good measure of physiological arousal. Indeed, EDA has been established as a reliable marker for physiological arousal across different contexts (Roth, 1983; Boucsein, 1999; Brouwer et al., 2018; Kaneko et al., 2019) and cannot be affected by demand characteristics or other subjective response biases that may affect self-report (Higuera-Trujillo et al., 2017).
Current Study
In this study the EmojiGrid was used to obtain subjective ratings of valence and arousal for immersive 360° VR video clips from a validated database (Li et al., 2017). The results were compared with corresponding ratings (provided with the database) obtained with the validated SAM self-report tool. Also, simultaneous EDA measurements of were obtained as an objective measure of physiological arousal.
Methods
In this study, participants viewed 360° VR movies using a HMD. They used an EmojiGrid that was embedded in the VE to report their subjective affective response (valence and arousal) to each movie. Their autonomic physiological response (arousal) to the movies was measured through electrodermal activity.
Participants
A total of 40 Caucasian participants (22 females, 18 males) aged between 18 and 29 (M = 22.16; SD = 2.70) took part in this study. Participants were recruited either via direct approach or from the TNO pool of volunteers for human-subject experiments. Exclusion criteria were age (outside the range of 18–35 years old) and hearing or (color) vision deficiencies. Age was an exclusion criterium since recent research has shown that older adults tend to be more susceptible to cybersickness than younger ones (Arns and Cerney, 2005; Knight and Arns, 2006; Park et al., 2006; Liu and Uang, 2007). Hearing and vision deficiencies were adopted as an exclusion criterium since these limitations may influence the affective experience of the VR videos. Physical (heart diseases, high or low blood pressure, epilepsy, etc.) or mental (phobias like claustrophobia, acrophobia, arachnophobia, etc.) health issues were also exclusion criteria since people suffering from these issues might experience problems while watching some of the affectively intense immersive VR videos used in this study. Of the total of 40 participants, 21 had previous experience with watching immersive VR videos on HMDs, while 19 had no previous experience.
The experimental protocol was reviewed and approved by the TNO Internal Review Board (IRB) (Approval Ref: 2019-024) and was in accordance with the Helsinki Declaration of 1975, as revised in 2013 (World Medical Association, 2013). Participation was voluntary. All participants received a financial compensation for their participation (€20 for participants that were directly approached, while participants from the TNO pool received €10 extra to reimburse their additional travel expenses).
Stimulus Material
The stimuli used in this study were 62 immersive VR videos from the public database composed by Li et al. (2017). The videos originate from sources like YouTube, Vrideo, and Facebook. All videos are of short length (<12 min), require no explanation, and have been found to induce different levels of valence and arousal (Li et al., 2017). The database provides mean valence and arousal ratings for each video, as established with the Self-Assessment Mannikin (SAM: Lang, 1980). Table 1 shows a list of all the clips used in this study, together with their identifiers and title in the original database provided by Li et al. (2017), their length (s), their corresponding valence and arousal ratings measured both with the SAM by Li et al. (2017) and with the EmojiGrid (this study), and the EDA arousal measures.
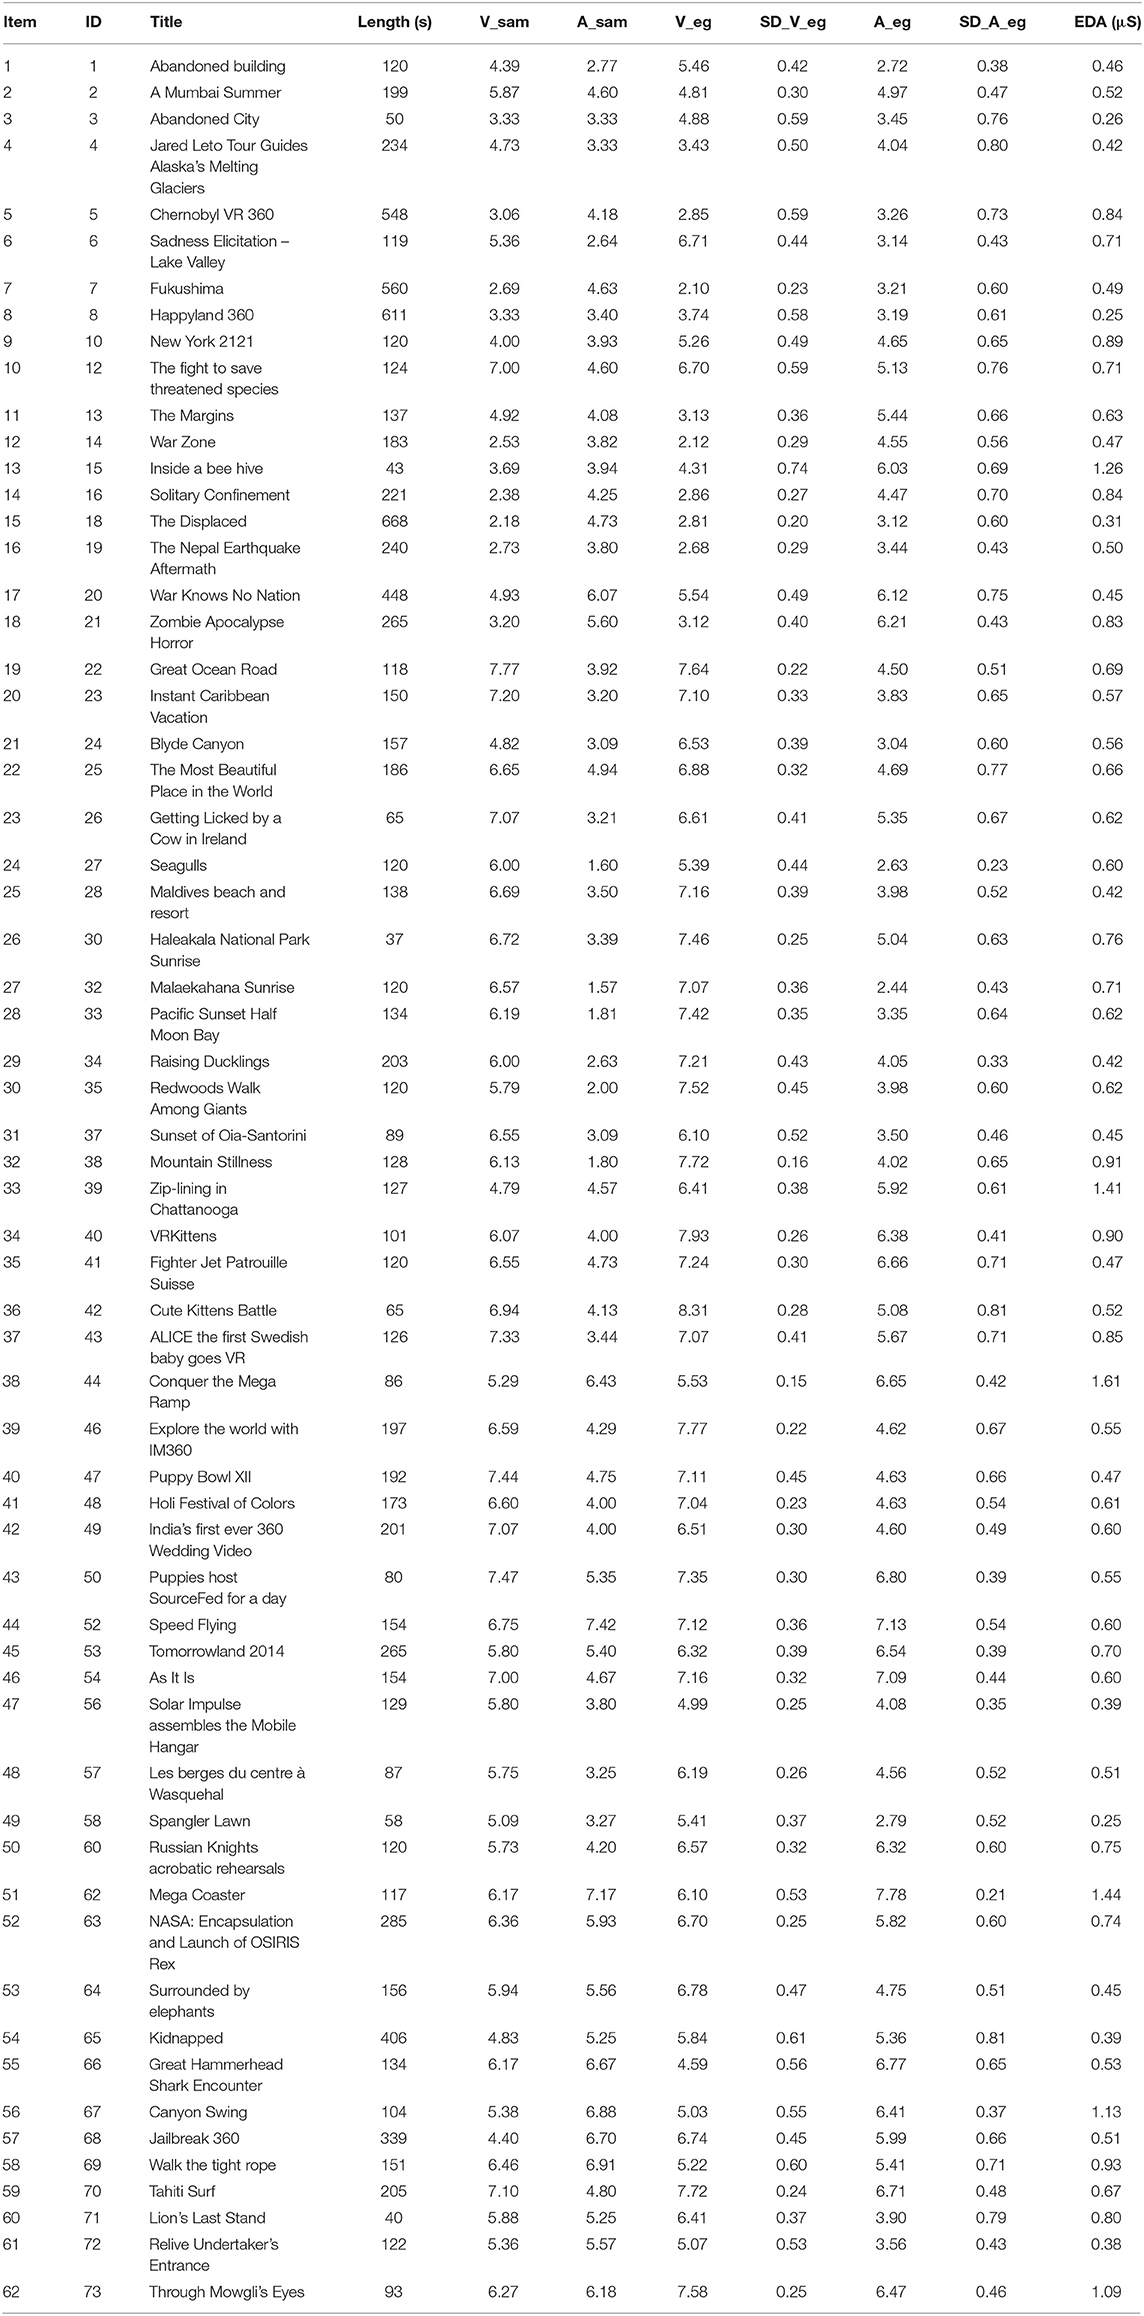
Table 1. List of the 62 videoclips used in this study, with their identifiers (ID) and titles from the original database by Li et al. (2017), their lengths (s), the corresponding valence and arousal values measured by Li et al. (2017) using the SAM (V_sam, A_sam), and with the EmojiGrid V_eg, A_eg: this study, and the EDA values (μS).
Although the original database consists of 73 videos, not all videos could be included in this study. Some videos (nrs. 9, 11, 29, 36, 45) were no longer available online, while others (nrs. 17, 31, 51, 55, 59, 61) were not in a usable format. As a result, 11 videos could not be included. The duration of the remaining 62 videos varied from 37 to 668 s with an average of 187 s per video. The arousal ratings varied from 1.57 to 7.42 on a scale from 1 to 9 (M = 4.32, SD = 1.41), which is comparable to the arousal ratings of the IAPS images from the standard International Affective Picture System (IAPS: Lang et al., 2005), which range from 1.72 to 7.35. The valence ratings of the VR clips varied from 2.18 to 7.77 (M = 5.56, SD = 1.44), which also agrees reasonably well with the valence ratings of the IAPS images, which range from 1.31 to 8.34. All participants watched a subset of the immersive VR videos, such that each video was seen and evaluated by at least seven participants.
Li et al. (2017) found that some participants became nauseous and/or fatigued after uninterrupted watching of immersive 360° VR videos for more than 15 min, while most were at ease with a duration of about 12 min. We therefore divided the 62 immersive 360° VR videos used in this study into clusters with a duration of about 12 min per cluster. The result was a set of 16 clusters, with two to six videos per cluster (see Table 2). Also, following Li et al. (2017) procedure, at most two clips of a particular valence (negative/positive) or arousal (low/high) were shown consecutively. Positive and negative valenced videos in the same subsets were presented in random order (i.e., some subsets started with a negative video, while others started with a positive or neutral video). The order in which the clusters were presented to the participants was also randomized. An Excel file listing the links to the original video clips and the experimental details and results for all videos that were used in this study is provided in the Supplementary Material. All stimuli are available from the OSF repository at https://osf.io/9qgce with doi: 10.17605/OSF.IO/9QGCE.
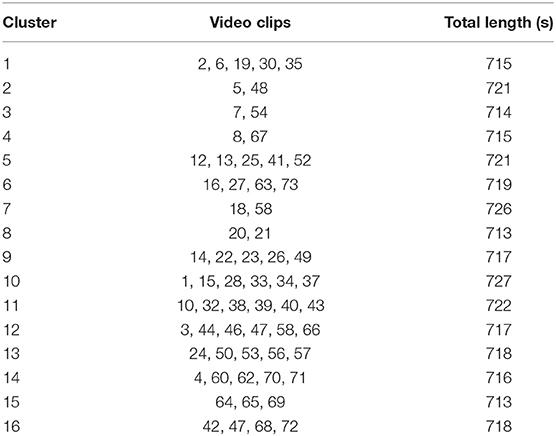
Table 2. Composition (clip IDs) and total length (s) for each of the 16 clusters.
Stimulus Presentation
The immersive monoscopic VR videos were presented on a Samsung Odyssey Windows Mixed Reality headset (www.samsung.com), equipped with a Dual 3.5″ AMOLED 1440 × 1600 resolution display, a 110° field of view and a refresh rate of 90 Hz. The low-latency tracking technology of the Odyssey HMD determines the relative position of the viewer's head and adjusts the view of the immersive video accordingly. To prevent any distractions by ambient sound, the video soundtracks were presented through a Sony MDR-1000 × noise-canceling headset.
The EmojiGrid was embedded in the virtual environment at the end of each video using the A-Frame (https://aframe.io) open source Javascript framework for creating (web-based) VR experiences. Using Node.js (https://nodejs.org), a local server was set up on an Alienware 13 R3 Notebook (Intel Core i7 7700HQ) which ran on Windows 10. Participants used a Samsung Odyssey remote control to point a graphical raycast beam and place a check mark at the appropriate location on the EmojiGrid when rating the videos (Figure 2). The EmojiGrid was displayed with a diameter with an angular size of 31 degrees, while the diameter of the individual emojis was 2.2 degrees.
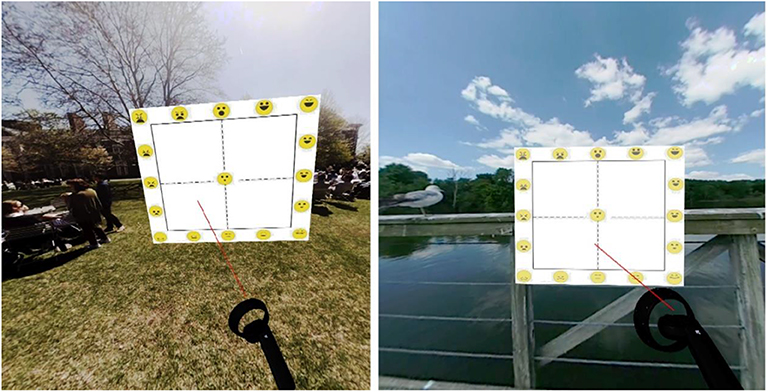
Figure 2. Screenshots from two different 360 VR clips, showing the Samsung Odyssey Controller (bottom right) projecting a graphical raycast beam on the EmojiGrid that is embedded in the VR scene.
Timestamps marking the start and end of each video, were logged in EPOCH format using A-Frame and served to calculate mean EDA responses [see section Electrodermal Activity (EDA)] over the runtime of each individual video.
A-Frame was also used to log the coordinates of the check marks (subjective responses) on the EmojiGrid. As the location of the EmojiGrid was fixed in the VE, a check mark's position on the grid could be determined from its coordinates. These coordinates were rounded to two decimal places.
Measures
Demographics
Participants were asked to report their age and gender.
Subjective Valence and Arousal: EmojiGrid
Participants rated valence and arousal for each VR video clip by pointing a graphical raycast beam at the location of the EmojiGrid (Figure 1; see also Toet et al., 2018) that best represented their affective appraisal of the 360° VR video they had just seen (Figure 3). The responses were digitized with 12 bit accuracy and mapped to a response scale ranging between 1 and 9, to enable comparison with the corresponding SAM ratings provided by Li et al. (2017).

Figure 3. Timeline of the events in the experimental procedure.
Electrodermal Activity (EDA)
Electrodermal activity (EDA) was recorded with the EdaMove 4 EDA and Activity Sensor (Movisens GmbH, Karlsruhe, Germany). Two self-adhesive, gelled electrodes (Ag/AgCl, MTG 102 IMIELLA electrode, W55 SG, textured fleece electrodes, 55 mm diameter) were fixed on the palmar surface of the participant's left hand. In addition, skin-friendly adhesive fleece tape was applied to ensure the attachment of the electrodes. The device applied a constant DC voltage of 0.5 V to the skin. The EDA signal was sampled at 32 Hz. This signal is composed of two components: a tonic (slow) and phasic (fast) activity component (Boucsein et al., 2012). Phasic activity (also referred to as skin conductance response or SCR) most clearly reflects responses to arousing events (e.g., Brouwer et al., 2018). In this study we determined the mean phasic activity (SCR) for each participant and for each immersive VR video over the entire duration of the video.
Procedure
After arriving at the test location, the experimenter welcomed the participants and gave them a verbal introduction and instructions. Participants were informed that they would be presented with immersive VR videos and were asked to rate their affective appraisal of each video. Then, they read and signed the IRB approved informed consent form and filled in a pre-questionnaire about demographic characteristics.
Next, a printed copy of the EmojiGrid was presented (Figure 1). Participants were told they could use this tool to report their emotional response to a video by clicking on a point in the grid. To get familiar with the EmojiGrid, they were given (a maximum of) 2 min to inspect it. No reference was made to the concepts of valence and arousal (the constructs underlying the axes of the EmojiGrid), since we wanted the participants to use the tool intuitively.
Then, the physiological measurements were explained, and the participants were fitted with the EDA sensors. To obtain a baseline for the EDA measurements, the participants were first asked to sit calmly and relax for 1 min.
Next, participants were introduced to the Samsung Odyssey HMD. After putting on this device, they watched and rated a practice cluster consisting of three immersive VR videos from YouTube, with respectively low (broiler chickens on a factory farm: https://www.youtube.com/watch?v=AfXjCJcexSI), moderate (a walk through a park: https://www.youtube.com/watch?v=WXqV7OcbnpY), and high (panda recess at the Wolong National Nature Reserve in China: https://www.youtube.com/watch?v=Jc7mqsD_sWM) valence. Participants were told that they should feel free to look around in the 360° VR scene. This introduction accustomed the participants to the experimental procedure. After this practice trial, the actual experiment started.
During the experiment, each participant was presented with three clusters of immersive 360° VR videos. After watching each video, the participants were asked to indicate the valence and arousal components of their emotional state by pointing the graphical raycast beam at the EmojiGrid using the Samsung Odyssey Controller. By clicking the response button of the controller, their response (i.e., the coordinates of the check mark on the EmojiGrid) was registered, and the next video in the cluster was started. The participants were allowed to take a 5 min break between the presentation of two clusters. They could remove their HMD during the breaks.
After finishing the viewing and rating process of the third (last) cluster, both the HMD and the EDA sensors were removed, and the participants were debriefed about the purpose of the study. The entire experiment lasted about 80 min. A timeline of the entire experimental procedure is shown in Figure 3.
To avoid any distractions, the experiments were performed in a quiet room. Watching immersive VR videos on head mounted displays is known to induce postural instability (Munafo et al., 2017). In this study the participants were therefore seated on a swivel chair during the entire VR experience. This enabled them to look around and take in the full 360° virtual environment in a safe manner.
Data Processing and Analysis
For each VR video we computed the mean valence and arousal responses over all participants. Matlab 2019a (www.mathworks.com) was used to plot the data and to compute a least-squared linear mapping between the valence and arousal tuples measured with (a) the EmojiGrid in this study and (b) with the SAM in the study by Li et al. (2017).
Visual checks were performed on all collected EDA signals to identify and remove erroneous data (e.g., resulting from technical problems such as signal dropout due to lose contacts). The remaining EDA data of 37 participants was analyzed. Phasic activity (SCR) was extracted using Continuous Decomposition Analysis (CDA) as implemented in Ledalab (www.ledalab.de; Benedek and Kaernbach, 2010), and was averaged across individual video epochs.
IBM SPSS Statistics 25 (www.ibm.com) for Windows was used to perform all statistical analyses. To test the convergent validity of the EmojiGrid we computed intraclass correlation coefficients (ICCs) between the mean valence and arousal ratings measured with (a) the EmojiGrid in this study and with (b) the SAM by Li et al. (2017). The ICC reflects not only the degree of correlation but also the agreement between the different measurements (the reliability of the method: Hallgren, 2012; Koo and Li, 2016). ICC estimates and their 95% confident intervals were based on a mean-rating (k = 3), consistency, 2-way mixed-effects model (Shrout and Fleiss, 1979; Hallgren, 2012; Koo and Li, 2016). ICC values <0.5 are indicative of poor reliability, values between 0.5 and 0.75 indicate moderate reliability, values between 0.75 and 0.9 indicate good reliability, while values >0.9 indicate excellent reliability (Cicchetti, 1994). For all other analyses a probability level of p < 0.05 was considered to be statistically significant. Cohen's d was used to quantify the significance of the difference in the mean phasic activity scores between videos that were subjectively scored as high and low arousing.
Results
Inspection of the self-report and physiological data both clearly indicate that the 360° VR videos successfully induced a range of emotions, differing widely in valence and arousal. For instance, participants' arousal varied across the different video clips as expected. Videos showing hang gliding (#52: Speed Flying) and roller coaster (#62: Mega Coaster) experiences were rated highest on arousal, while videos showing birds (#27: Seagulls) and a sunrise beach (#32: Malaekahana Sunrise) were rated lowest on arousal. Videos showing beaches (#22: Great Ocean Road) and puppies (#50: Puppies host SourceFed for a day) were rated highest on valence, while videos showing an isolation prison cell (#16: Solitary Confinement) and war refugees (#18: The Displaced) received the lowest valence ratings. Also, videos subjectively rated as most arousing also evoked the highest EDA levels, while videos subjectively rated as least arousing also evoked the lowest EDA levels (see section Electrodermal Activity).
Valence and Arousal Ratings
For each video, the mean and standard deviation response for valence and arousal across all viewers was computed. Figure 4 shows the relation between the mean subjective valence and arousal ratings obtained with the EmojiGrid in the current study and the corresponding ratings obtained with the SAM by Li et al. (2017). To quantify the agreement between both results we computed the Intraclass Correlation Coefficient (ICC) estimates and their 95% confidence intervals, based on a mean-rating, consistency, two-way mixed-effects model.
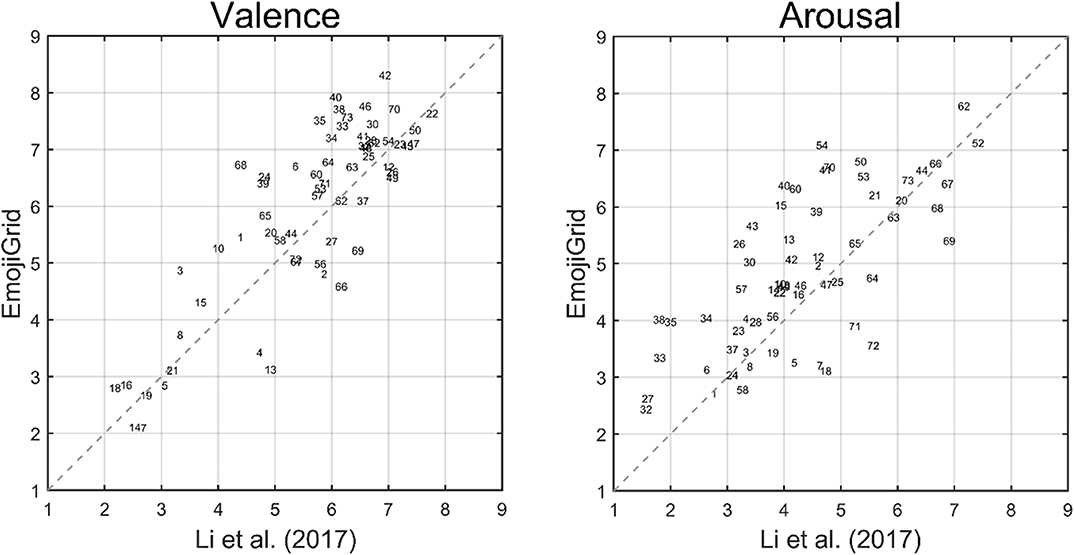
Figure 4. Correlation plots showing the relationship between the mean valence (left) and arousal (right) ratings provided by Li et al. (2017) and those obtained with the EmojiGrid in the current study. The gray dashed line represents the diagonal. The item labels (numbers) refer to the original video clip identifiers in the study by Li et al. (2017).
The ICC for valence was 0.91 (with a 95% confidence interval ranging between 0.85 and 0.95) and the ICC for arousal was 0.83 (with a 95% confidence interval ranging between 0.72 and 0.90). Thus, the valence ratings obtained by both studies are in excellent agreement, while the arousal ratings are in good agreement.
Electrodermal Activity
To examine the relation between the EDA signal and the subjective arousal ratings we computed the mean of the phasic activity for each video and across all viewers. The Pearson product-moment correlation between the mean EDA values and the self-reported arousal ratings obtained with the EmojiGrid was 0.49 (p < 0.0001), and the correlation with the SAM ratings from the study by Li et al. (2017) was 0.30 (p < 0.02). This indicates that videos that are subjectively rated as more arousing also evoked higher levels of physiological arousal.
To further investigate this relation, we determined for each individual participant the three most arousing and the three least arousing VR videos, using their self-reported arousal ratings obtained with the EmojiGrid. The mean phasic activity values corresponding with these videos were then used to calculate the overall average phasic activity over the three most and the three least arousing videos. This way, two mean phasic activity values (one corresponding to the three most arousing videos and one for the three least arousing videos) were obtained for each participant. A paired-samples t-test was conducted to evaluate the difference in mean phasic activity scores for immersive VR videos that were subjectively rated as high and low arousing. There was a statistically significant difference in mean phasic activity scores between videos that were subjectively scored as high arousing (M = 0.74 μS, SD = 0.63) and low arousing (M = 0.56 μS, SD = 0.52), t (36) = 3.54, p < 0.001 (two-tailed). The mean difference in mean phasic activity scores was 0.18 μS with a 95% confidence interval ranging from 0.08 to 0.28 μS. Cohen's d was 0.65, indicating a medium effect size. This indicates that the immersive VR videos subjectively rated as more arousing on the EmojiGrid indeed evoked higher levels of physiological arousal.
Discussion and conclusions
We found that participants were able to intuitively use the EmojiGrid without any further explanation of the concepts of valence and arousal. They efficiently rated both valence and arousal by pointing a raycast beam onto an EmojiGrid that was embedded in the immersive VE and clicking a response button. These are obvious benefits compared to for instance the popular SAM tool, that has an arousal scale that can be misunderstood (Broekens and Brinkman, 2013; Betella and Verschure, 2016; Chen et al., 2018; Toet et al., 2018) and which requires two successive ratings on separate scales.
The first objective of this study was to investigate the convergent validity and effectiveness of the EmojiGrid for the affective appraisal of immersive 360° VR video clips. It appeared that participants could effectively report the degrees of valence and arousal associated with the emotion they experienced after seeing an immersive VR video by simply pointing at an EmojiGrid that was embedded in the VE. To assess the convergent validity of the EmojiGrid for measuring the valence and arousal of immersive VR videos, we compared (1) the mean subjective valence and arousal ratings for all videos obtained with this tool to (2) the corresponding ratings from the study by Li et al. (2017) that were obtained with the validated SAM rating tool. The agreement between both studies was excellent for the subjective valence ratings and good for the subjective arousal ratings. The arousal ratings obtained with the EmojiGrid also corresponded well with another validated and objective arousal standard, namely EDA. Moreover, the correlation between subjective and objective arousal ratings was stronger for the EmojiGrid than for the SAM. Thus, it appears that the EmojiGrid may be used as a language-independent and efficient self-report tool for the affective appraisal of VE-induced emotions. Compared to most existing methods, the EmojiGrid is more efficient (both valence and arousal are rated with a single response) and needs no verbal labels or extensive explanation (it is intuitive and language independent).
The second goal of this study was an objective validation of the arousal scale of the EmojiGrid by relating subjective arousal ratings to electrodermal measurements. Our results show that immersive VR videos that were subjectively rated on the EmojiGrid as more arousing also induced higher levels of physiological arousal. This indicates that subjective ratings of arousal obtained with the EmojiGrid reliably reflect objective autonomic physiological arousal.
The present results suggest that the EmojiGrid may also be used for the real-time affective evaluation of events in VR or for giving affective feedback. For instance, in studies on affective communication in human-computer interaction (e.g., Tajadura-Jiménez and Västfjäll, 2008), the EmojiGrid could be used to enable users to repeatedly report perceived affect (e.g., by projecting a pointer-controlled beam on the grid). Such an application could also be useful for the affective annotation of multimedia (Chen et al., 2007; Soleymani et al., 2008; Runge et al., 2016; Suhaimi et al., 2018), for personalized affective multimedia retrieval (e.g., through query-by-emoji: Cappallo et al., 2019) or multimedia recommender systems (Hanjalic and Xu, 2005; Xu et al., 2008; Zhang et al., 2010; Lopatovska and Arapakis, 2011; Koelstra et al., 2012; Zhao et al., 2013), for the affective appraisal of multimedia entertainment in real-time (Fleureau et al., 2012), to give affective feedback in serious gaming applications (Anolli et al., 2010), and for affective multimedia generation (e.g., music: Kim and André, 2004). We are currently implementing the EmojiGrid in a multisensory VR environment (the Sensiks Sensory Reality Pod: www.sensiks.com) as an interface for the user to select and adjust the desired multisensory (visual, auditory, tactile, and olfactory) affective experiences.
Previous studies suggest that the EmojiGrid is more intuitive and therefore may require less cognitive effort than other affective rating tools, making it more efficient to use. To test this hypothesis, future studies should compare the EmojiGrid with different forms of traditional affective rating tools (e.g., a label-based valance-arousal grid or SAM) embedded in a VE.
Although users can report both valence and arousal with a single click, the EmojiGrid still requires a successive judgement along both axes. Future studies should investigate whether the superposition of additional emoji over the inner area of the grid (with facial expressions “interpolating” those of the emoji near its outer edges) can further improve the intuitiveness of this tool.
Limitations of the Present Study
A limitation of the present study (and also of the study by Li et al., 2017) was the fact that we did not register the viewing direction and did not check what trigger events in the VR movies the participants observed or missed. Although we found no outliers in the current data, a variation in viewing direction may have caused a variation in the obtained assessments, because the participants may have missed some relevant events. Also, participants reported that they found it difficult to give an overall rating to videos containing both pleasant and unpleasant episodes. Future studies should therefore (1) track the instantaneous viewing direction to check what parts of the scene or which events participants actually perceived, and (2) afford a more frequent rating procedure to ensure that participants can rate affectively distinct parts of a VR movies individually, thus eliminating the need to give an overall rating to videos containing episodes of opposite valence. This can for instance be achieved by continuously blending the EmojiGrid in the field-of-view of the observer (e.g., Voigt-Antons et al., 2020) or placing it as a billboard at a fixed location in the scene (e.g., Regal et al., 2019).
Another limitation of this study is that we did not measure the occurrence of cybersickness or discomfort during the experiments. During the debriefing the participants reported that they had not experienced any signs of nauseousness or fatigue after uninterrupted watching the blocks of immersive 360° VR videos for about 12 min. However, this does not preclude that they unconsciously experienced a low degree of cybersickness that influenced their affective state. This could in turn affect the present results, since current mood is known to have a direct impact on subsequent judgements through misattribution (Schwarz and Clore, 1983; Schwarz, 2002; Russell, 2003; Clore and Huntsinger, 2007).
Another limitation of this study is the fact that some of the VR videos were rather long and reflected different emotion overtime, while the participants had to evaluate their emotional response in a summative fashion after watching the whole clip. However, this also applies to the original study by Li et al. (2017), who's experimental protocol we closely followed in this study to guarantee that the results of both studies are comparable.
In this study we did not measure the valence polarity of the user's experience from physiological data. Hence, a full objective validation of the valence scale of the EmojiGrid is still lacking. Future studies using the EmojiGrid for measuring the affective responses to immersive VR experiences should include physiological measures that correlate with subjective valence ratings, such as facial electromyograph (EMG) activity (Mavridou et al., 2018).
Data Availability Statement
The raw data supporting the conclusions of this article will be made available by the authors, without undue reservation.
Ethics Statement
Written informed consent was obtained from the individuals for the publication of any potentially identifiable images included in this article.
Author Contributions
AT had the original idea and supervised this study, provided the resources, analyzed, visualized and curated the data, wrote the original draft paper, and prepared the final manuscript. FH performed the experiments, collected the data, performed the formal analysis, and wrote the original draft paper. A-MB assisted with the original draft preparation and critically revised the final manuscript on article structure, logical organization, and language. TM assisted with the original draft preparation and critically revised the final manuscript on article structure, logical organization, and language. JE critically revised the final manuscript on article structure, logical organization, and language. All authors contributed to the article and approved the submitted version.
Funding
The research reported in this paper was partly funded by the TNO Early Research Program (ERP) Social eXtended Reality (Social XR).
Conflict of Interest
The authors declare that the research was conducted in the absence of any commercial or financial relationships that could be construed as a potential conflict of interest.
Acknowledgments
The authors thank Galit Rahim for programming the EmojiGrid into the virtual environment, and Ivo Stuldreher for assistance with the EDA signal processing. They are also indebted to Prof Duncan Brumby (University College London) for his thoughtful suggestions and helpful comments on an earlier draft of this paper. Part of this work has previously been presented as a poster at the EuroVR 2019 conference in Tallin, Estland, 23–25 October, 2019 (Toet et al., 2019a).
Supplementary Material
The Supplementary Material for this article can be found online at: https://www.frontiersin.org/articles/10.3389/frvir.2020.552587/full#supplementary-material
References
Andersen, I. N. S. K., Kraus, A. A., Ritz, C., and Bredie, W. L. P. (2019). Desires for beverages and liking of skin care product odors in imaginative and immersive virtual reality beach contexts. Food Res. Int. 117, 10–18. doi: 10.1016/j.foodres.2018.01.027
Andreassi, J. L. (2013). Psychophysiology: Human behavior and physiological response, 4th edn. New York, NY: Psychology Press. doi: 10.4324/9781410602817
Anolli, L., Mantovani, F., Confalonieri, L., Ascolese, A., and Peveri, L. (2010). Emotions in serious games: from experience to assessment. Int. J. Emerg. Technol. Learn. 5, 7–16. doi: 10.3991/ijet.v5s3.1496
Arns, L. L., and Cerney, M. M. (2005). “The relationship between age and incidence of cybersickness among immersive environment users,” in IEEE Proceedings. VR 2005. Virtual Reality, 2005 (Bonn), 267–268.
Aronoff, J., Barclay, A. M., and Stevenson, L. A. (1988). The recognition of threatening facial stimuli. J. Pers. Soc. Psychol. 54, 647–655. doi: 10.1037/0022-3514.54.4.647
Bangcuyo, R. G., Smith, K. J., Zumach, J. L., Pierce, A. M., Guttman, G. A., and Simons, C. T. (2015). The use of immersive technologies to improve consumer testing: the role of ecological validity, context and engagement in evaluating coffee. Food Qual. Prefer. 41, 84–95. doi: 10.1016/j.foodqual.2014.11.017
Baños, R. M., Botella, C., Rubi, I., Quero, S., Garcia-Palacios, A., and Alcañiz, M. (2008). Presence and emotions in virtual environments: the influence of stereoscopy. CyberPsychol. Behav. 11, 1–8. doi: 10.1089/cpb.2007.9936
Beck, J., and Egger, R. (2018). “Emotionalise Me: self-reporting and arousal measurements in virtual tourism environments,” in Information and Communication Technologies in Tourism 2018, eds. B. Stangl and J. Pesonen (Cham: Springer International Publishing), 3–15. doi: 10.1007/978-3-319-72923-7_1
Benedek, M., and Kaernbach, C. (2010). A continuous measure of phasic electrodermal activity. J. Neurosci. Methods 190, 80–91. doi: 10.1016/j.jneumeth.2010.04.028
Betella, A., and Verschure, P. F. M. J. (2016). The affective slider: a digital self-assessment scale for the measurement of human emotions. PLoS ONE 11:e0148037. doi: 10.1371/journal.pone.0148037
Bonetti, F., Warnaby, G., and Quinn, L. (2018). “Augmented reality and virtual reality in physical and online retailing: a review, synthesis and research agenda,” in Augmented Reality and Virtual Reality: Empowering Human, Place and Business, eds T. Jung and M. C. tom Dieck (Cham: Springer International Publishing), 119–132. doi: 10.1007/978-3-319-64027-3_9
Bouchard, S., Robillard, G., St-Jacques, J., Dumoulin, S., Patry, M. J., and Renaud, P. (2004). “Reliability and validity of a single-item measure of presence in VR,” in The 3rd IEEE International Workshop on Haptic, Audio and Visual Environments and Their Applications (Ottawa, ON), 59–61.
Boucsein, W. (1999). Electrodermal activity as an indicator of emotional processes. Korean J. Sci. Emotion Sensibility 2, 1–25.
Boucsein, W., Fowles, D. C., Grimnes, S., Ben-Shakhar, G., Roth, W. T., Dawson, M. E., et al. (2012). Publication recommendations for electrodermal measurements. Psychophysiology 49, 1017–1034. doi: 10.1111/j.1469-8986.2012.01384.x
Bradley, M. M., and Lang, P. J. (1994). Measuring emotion: the self-assessment manikin and the semantic differential. J. Behav. Ther. Exp. Psychiatry 25, 49–59. doi: 10.1016/0005-7916(94)90063-9
Broekens, J., and Brinkman, W. P. (2013). AffectButton: a method for reliable and valid affective self-report. Int. J. Hum. Comput. Stud. 71, 641–667. doi: 10.1016/j.ijhcs.2013.02.003
Brouwer, A.-M., van Beurden, M., Nijboer, L., Derikx, L., Binsch, O., Gjaltema, C., et al. (2018). “A comparison of different electrodermal variables in response to an acute social stressor,” in International Workshop on Symbiotic Interaction (Cham: Springer International Publishing), 7–17. doi: 10.1007/978-3-319-91593-7_2
Brouwer, A.-M., Zander, T. O., van Erp, J. B. F., Korteling, J. E., and Bronkhorst, A. W. (2015). Using neurophysiological signals that reflect cognitive or affective state: six recommendations to avoid common pitfalls. Front. Neurosci. 9, 1–11. doi: 10.3389/fnins.2015.00136
Calogiuri, G., Litleskare, S., Fagerheim, K. A., Rydgren, T. L., Brambilla, E., and Thurston, M. (2018). Experiencing nature through immersive virtual environments: environmental perceptions, physical engagement, and affective responses during a simulated nature walk. Front. Psychol. 8:2321. doi: 10.3389/fpsyg.2017.02321
Cappallo, S., Svetlichnaya, S., Garrigues, P., Mensink, T., and Snoek, C. G. M. (2019). New modality: eEmoji challenges in prediction, anticipation, and retrieval. IEEE Trans. Multimedia 21, 402–415. doi: 10.1109/TMM.2018.2862363
Chen, L., Chen, G.-C., Xu, C.-Z., March, J., and Benford, S. (2007). EmoPlayer: a media player for video clips with affective annotations. Interact. Comput. 20, 17–28. doi: 10.1016/j.intcom.2007.06.003
Chen, Y., Gao, Q., Lv, Q., Qian, N., and Ma, L. (2018). Comparing measurements for emotion evoked by oral care products. Int. J. Ind. Ergon. 66, 119–129. doi: 10.1016/j.ergon.2018.02.013
Chirico, A., and Gaggioli, A. (2019). When virtual feels real: comparing emotional responses and presence in virtual and natural environments. Cyberpsychol. Behav. Soc. Netw. 22, 220–226. doi: 10.1089/cyber.2018.0393
Cicchetti, D. V. (1994). Guidelines, criteria, and rules of thumb for evaluating normed and standardized assessment instruments in psychology. Psychol. Assess. 6, 284–290. doi: 10.1037/1040-3590.6.4.284
Clore, G. L., and Huntsinger, J. R. (2007). How emotions inform judgment and regulate thought. Trends Cogn. Sci. 11, 393–399. doi: 10.1016/j.tics.2007.08.005
Dawson, M. E., Schell, A. M., and Filion, D. L. (2000). “The electrodermal system,” in Handbook of psychophysiology, eds J. T. Cacioppo, L. G. Tassinary and G. G. Berntson (New York, NY: Cambridge University Press), 200–223.
de la Peña, N., Weil, P., Llobera, J., Giannopoulos, E., Pomés, A., Spanlang, B., et al. (2010). Immersive journalism: immersive virtual reality for the first-person experience of news. Presence Teleoper. Virtual Environ. 19, 291–301. doi: 10.1162/PRES_a_00005
Diemer, J., Alpers, G. W., Peperkorn, H. M., Shiban, Y., and Mühlberger, A. (2015). The impact of perception and presence on emotional reactions: a review of research in virtual reality. Front. Psychol. 6:26. doi: 10.3389/fpsyg.2015.00026
Ding, N., Zhou, W., and Fung, A. Y. H. (2018). Emotional effect of cinematic VR compared with traditional 2D film. Telematics Informatics 35, 1572–1579. doi: 10.1016/j.tele.2018.04.003
Echevarria Sanchez, G. M., Van Renterghem, T., Sun, K., De Coensel, B., and Botteldooren, D. (2017). Using virtual reality for assessing the role of noise in the audio-visual design of an urban public space. Landsc. Urban Plan. 167, 98–107. doi: 10.1016/j.landurbplan.2017.05.018
Estupiñán, S., Rebelo, F., Noriega, P., Ferreira, C., and Duarte, E. (2014). “Can virtual reality increase emotional responses (arousal and valence)? A pilot study,” in Design, User Experience, and Usability. User Experience Design for Diverse Interaction Platforms and Environments (Cham: Springer International Publishing), 541–549. doi: 10.1007/978-3-319-07626-3_51
Felnhofer, A., Kothgassner, O. D., Schmidt, M., Heinzle, A. K., Beutl, L., Hlavacs, H., et al. (2015). Is virtual reality emotionally arousing? Investigating five emotion inducing virtual park scenarios. Int. J. Hum. Comput. Stud. 82, 48–56. doi: 10.1016/j.ijhcs.2015.05.004
Fibbi, S., Spano, L. D., Sorrentino, F., and Scateni, R. (2015). “WoBo: multisensorial travels through oculus rift,” in 33rd Annual ACM Conference Extended Abstracts on Human Factors in Computing Systems (New York, NY: ACM), 299–302. doi: 10.1145/2702613.2725452
Fleureau, J., Guillotel, P., and Quan, H. (2012). Physiological-based affect event detector for entertainment video applications. IEEE Trans. Affect. Comput. 3, 379–385. doi: 10.1109/T-AFFC.2012.2
Freeman, J., Lessiter, J., Pugh, K., and Keogh, E. (2005). “When presence and emotion are related, and when they are not,” in 8th Annual International Workshop on Presence (PRESENCE 2005) (Vienna: International Society for Presence Research), 213–219.
Gorini, A., Capideville, C. S., De Leo, G., Mantovani, F., and Riva, G. (2011). The role of immersion and narrative in mediated presence: the virtual hospital experience. Cyberpsychol. Behav. Soc. Netw. 14, 99–105. doi: 10.1089/cyber.2010.0100
Gorini, A., Mosso, J. L., Mosso, D., Pineda, E., Ruiz, N. L., Ramíez, M., et al. (2009). Emotional response to virtual reality exposure across different cultures: the role of the attribution process. CyberPsychol. Behav. 12, 699–705. doi: 10.1089/cpb.2009.0192
Grassini, S., and Laumann, K. (2020). Questionnaire measures and physiological correlates of presence: a systematic review. Front. Psychol. 11:349. doi: 10.3389/fpsyg.2020.00349
Gutierrez, M., Vexo, F., and Thalmann, D. (2008). Stepping into virtual reality. London: Springer Science and Business Media. doi: 10.1007/978-1-84800-117-6
Guttentag, D. A. (2010). Virtual reality: applications and implications for tourism. Tourism Manage. 31, 637–651. doi: 10.1016/j.tourman.2009.07.003
Hallgren, K. A. (2012). Computing inter-rater reliability for observational data: an overview and tutorial. Tutorials quant. methods psychol. 8, 23–34. doi: 10.20982/tqmp.08.1.p023
Hanjalic, A., and Xu, L.-Q. (2005). Affective video content representation and modeling. IEEE Trans. Multimedia 7, 143–154. doi: 10.1109/TMM.2004.840618
Hayek, U. W., Waltisberg, D., Philipp, N., and Grêt-Regamey, A. (2016). Exploring issues of immersive virtual landscapes for the support of participatory spatial planning support. J. Digit. Landsc. Arch. 1, 100–108. doi: 10.14627/537612012
Hendriks Vettehen, P., Wiltink, D., Huiskamp, M., Schaap, G., and Ketelaar, P. (2019). Taking the full view: how viewers respond to 360-degree video news. Comput. Hum. Behav. 91, 24–32. doi: 10.1016/j.chb.2018.09.018
Higuera-Trujillo, J. L., López-Tarruella Maldonado, J., and Llinares Millán, C. (2017). Psychological and physiological human responses to simulated and real environments: a comparison between photographs, 360° panoramas, and virtual reality. Appl. Ergon. 65, 398–409. doi: 10.1016/j.apergo.2017.05.006
Hilfert, T., and König, M. (2016). Low-cost virtual reality environment for engineering and construction. Vis. Eng. 4:2. doi: 10.1186/s40327-015-0031-5
Huang, Y. C., Backman, K. F., Backman, S. J., and Chang, L. L. (2016). Exploring the implications of virtual reality technology in tourism marketing: an integrated research framework. Int. J. Tourism Res. 18, 116–128. doi: 10.1002/jtr.2038
Huisman, G., van Hout, M., van Dijk, E., van der Geest, T., and Heylen, D. (2013). “LEMtool: measuring emotions in visual interfaces,” in The SIGCHI Conference on Human Factors in Computing Systems (New York, NY: ACM), 351–360. doi: 10.1145/2470654.2470706
Kaneko, D., Hogervorst, M., Toet, A., van Erp, J. B. F., Kallen, V., and Brouwer, A.-M. (2019). Explicit and implicit responses to tasting drinks associated with different tasting experiences. Sensors 19:4397. doi: 10.3390/s19204397
Kaneko, D., Toet, A., Brouwer, A.-M., Kallen, V., and van Erp, J. B. F. (2018a). Methods for evaluating emotions evoked by food experiences: a literature review. Front. Psychol. 9:911. doi: 10.3389/fpsyg.2018.00911
Kaneko, D., Toet, A., Ushiama, S., Brouwer, A. M., Kallen, V., and van Erp, J. B. F. (2018b). EmojiGrid: a 2D pictorial scale for cross-cultural emotion assessment of negatively and positively valenced food. Food Res. Int. 115, 541–551. doi: 10.1016/j.foodres.2018.09.049
Kim, K., Rosenthal, M. Z., Zielinski, D. J., and Brady, R. (2014). Effects of virtual environment platforms on emotional responses. Comput. Methods Prog. Biomed. 113, 882–893. doi: 10.1016/j.cmpb.2013.12.024
Kim, S., and André, E. (2004). “Composing affective music with a generate and sense approach,” in Flairs 2004 - Special Track on AI and Music (Palo Alto, CA: AAAI).
King, S. C., and Meiselman, H. L. (2010). Development of a method to measure consumer emotions associated with foods. Food Qual. Preference 21, 168–177. doi: 10.1016/j.foodqual.2009.02.005
Knight, M. M., and Arns, L. L. (2006). “The relationship among age and other factors on incidence of cybersickness in immersive environment users,” in The 3rd Symposium on Applied Perception in Graphics and Visualization (New York, NY: ACM), 162. doi: 10.1145/1140491.1140539
Koelstra, S., Muhl, C., Soleymani, M., Lee, J. S., Yazdani, A., Ebrahimi, T., et al. (2012). DEAP: a database for emotion analysis using physiological signals. IEEE Trans. Affect. Comput. 3, 18–31. doi: 10.1109/T-AFFC.2011.15
Koo, T. K., and Li, M. Y. (2016). A guideline of selecting and reporting intraclass correlation coefficients for reliability research. J. Chiropr. Med. 15, 155–163. doi: 10.1016/j.jcm.2016.02.012
Krüger, C., Kojić, T., Meier, L., Möller, S., and Voigt-Antons, J.-N. (2020). “Development and validation of pictographic scales for rapid assessment of affective states in virtual reality,” in Twelfth International Conference on Quality of Multimedia Experience (QoMEX) (Piscatawat, NJ: IEEE), 1–6. doi: 10.1109/QoMEX48832.2020.9123100
Lang, P. J. (1980). “Behavioral treatment and bio-behavioral assessment: computer applications,” in Technology in mental health care delivery systems, eds J. B. Sidowski, J. H. Johnson and T. A. Williams (Norwood, NJ: Ablex Publishing Corporation), 119–137.
Lang, P. J., Bradley, M. M., and Cuthbert, B. N. (2005). International Affective Picture System (IAPS): Instruction Manual And Affective Ratings. Technical Report A-6. Gainesville, FL: The Center for Research in Psychophysiology; University of Florida.
Larson, C., Aronoff, J., and Steuer, E. (2012). Simple geometric shapes are implicitly associated with affective value. Motiv. Emot. 36, 404–413. doi: 10.1007/s11031-011-9249-2
Laurans, G. F. G., and Desmet, P. M. A. (2012). “Introducing PrEmo2: new directions for the non-verbal measurement of emotion in design,” in 8th International Conference on Design and Emotion, eds J. Brassett, P. Hekkert, G. Ludden, M. Malpass, and J. McDonnell (London: Central Saint Martins College of Arts and Design), 11–14.
Li, B. J., Bailenson, J. N., Pines, A., Greenleaf, W. J., and Williams, L. M. (2017). A public database of immersive VR videos with corresponding ratings of arousal, valence, and correlations between head movements and self report measures. Front. Psychol. 8:2116. doi: 10.3389/fpsyg.2017.02116
Ling, Y., Brinkman, W.-P., Nefs, H. T., Qu, C., and Heynderickx, I. (2012). Effects of stereoscopic viewing on presence, anxiety, and cybersickness in a virtual reality environment for public speaking. Presence Teleoper. Virtual Environ. 21, 254–267. doi: 10.1162/PRES_a_00111
Liu, C.-L., and Uang, S.-T. (2007). “Measurement and prediction of cybersickness on older users caused by a virtual environment,” in Universal Access in Human-Computer Interaction. Part II: Ambient Interaction (Berlin; Heidelberg: Springer), 666–675. doi: 10.1007/978-3-540-73281-5_72
Lopatovska, I., and Arapakis, I. (2011). Theories, methods and current research on emotions in library and information science, information retrieval and human–computer interaction. Inform. Process. Manage. 47, 575–592. doi: 10.1016/j.ipm.2010.09.001
Macedonio, M. F., Parsons, T. D., Digiuseppe, R. A., Weiderhold, B. A., and Rizzo, A. A. (2007). Immersiveness and physiological arousal within panoramic video-based virtual reality. CyberPsychol. Behav. 10, 508–515. doi: 10.1089/cpb.2007.9997
Marasco, A., Buonincontri, P., van Niekerk, M., Orlowski, M., and Okumus, F. (2018). Exploring the role of next-generation virtual technologies in destination marketing. J. Destination Mark. Manage. 9, 138–148. doi: 10.1016/j.jdmm.2017.12.002
Marín-Morales, J., Higuera-Trujillo, J. L., Greco, A., Guixeres, J., Llinares, C., Scilingo, E. P., et al. (2018). Affective computing in virtual reality: emotion recognition from brain and heartbeat dynamics using wearable sensors. Sci. Rep. 8:13657. doi: 10.1038/s41598-018-32063-4
Mattek, A. M., Wolford, G. L., and Whalen, P. J. (2017). A mathematical model captures the structure of subjective affect. Perspect. Psychol. Sci. 12, 508–526. doi: 10.1177/1745691616685863
Mauss, I. B., and Robinson, M. D. (2009). Measures of emotion: a review. Cogn. Emot. 23, 209–237. doi: 10.1080/02699930802204677
Mavridou, I., Seiss, E., Hamedi, M., Balaguer-Ballester, E., and Nduka, C. (2018). “Towards valence detection from EMG for virtual reality applications,” in 12th International Conference on Disability, Virtual Reality and Associated Technologies (ICDVRAT 2018) (Highland Park, NJ: International Society for Virtual Rehabilitation).
Mirk, D., and Hlavacs, H. (2014). “Using drones for virtual rourism,” in Intelligent Technologies for Interactive Entertainment, eds D. Reidsma, I. Choi, and R. Bargar (Springer International Publishing), 144–147. doi: 10.1007/978-3-319-08189-2_21
Mobach, M. P. (2008). Do virtual worlds create better real worlds? Virtual Reality 12, 163–179. doi: 10.1007/s10055-008-0081-2
Munafo, J., Diedrick, M., and Stoffregen, T. A. (2017). The virtual reality head-mounted display Oculus Rift induces motion sickness and is sexist in its effects. Exp. Brain Res. 235, 889–901. doi: 10.1007/s00221-016-4846-7
Nestrud, M. A., Meiselman, H. L., King, S. C., Lesher, L. L., and Cardello, A. V. (2016). Development of EsSense25, a shorter version of the EsSense profile. Food Qual. Prefer. 48, 107–117. doi: 10.1016/j.foodqual.2015.08.005
Obaid, M., Han, C., and Billinghurst, M. (2008). “Feed the fish: An affect-aware game,” in The 5th Australasian Conference on Interactive Entertainment (IE 2008) (New York, NY: ACM).
Oliveira, T., Noriega, P., Carvalhais, J., Rebelo, F., and Lameira, V. (2020). “How deep is a virtual reality experience? Virtual environments, emotions and physiological measures,” in AHFE 2019. Advances in Intelligent Systems and Computing, eds F. Rebelo and M. M. Soares (Cham: Springer International Publishing), 462–471. doi: 10.1007/978-3-030-20227-9_43
Oliveira, T., Noriega, P., Rebelo, F., and Heidrich, R. (2018). “Evaluation of the relationship between virtual environments and emotions,” in Advances in Ergonomics in Design. AHFE 2017. Advances in Intelligent Systems and Computing, eds F. Rebelo and M. Soares (Cham: Springer International Publishing), 71–82. doi: 10.1007/978-3-319-60582-1_8
Park, G. D., Allen, R. W., Fiorentino, D., Rosenthal, T. J., and Cook, M. L. (2006). “Simulator sickness scores according to symptom susceptibility, age, and gender for an older driver assessment study,” in Human Factors and Ergonomics Society Annual Meeting (Washington, DC), 2702–2706. doi: 10.1177/154193120605002607
Patterson, Z., Darbani, J. M., Rezaei, A., Zacharias, J., and Yazdizadeh, A. (2017). Comparing text-only and virtual reality discrete choice experiments of neighbourhood choice. Landsc. Urban Plann. 157, 63–74. doi: 10.1016/j.landurbplan.2016.05.024
Peperkorn, H. M., Diemer, J., and Mühlberger, A. (2015). Temporal dynamics in the relation between presence and fear in virtual reality. Comput. Hum. Behav. 48, 542–547. doi: 10.1016/j.chb.2015.02.028
Pitt, M., Goyal, S., Holt, P., Ritchie, J., Day, P., Simmons, J., et al. (2005). An innovative approach to facilities management in the workplace design brief: virtual reality in design. Facilities 23, 343–355. doi: 10.1108/02632770510600290
Portman, M. E., Natapov, A., and Fisher-Gewirtzman, D. (2015). To go where no man has gone before: virtual reality in architecture, landscape architecture and environmental planning. Comput. Environ. Urban Syst. 54, 376–384. doi: 10.1016/j.compenvurbsys.2015.05.001
Prayag, G., Hosany, S., and Odeh, K. (2013). The role of tourists' emotional experiences and satisfaction in understanding behavioral intentions. J. Destination Mark. Manage. 2, 118–127. doi: 10.1016/j.jdmm.2013.05.001
Putze, S., Alexandrovsky, D., Putze, F., Höffner, S., Smeddinck, J. D., and Malaka, R. (2020). “Breaking the experience: effects of questionnaires in vr user studies,” in Proceedings of the 2020 CHI Conference on Human Factors in Computing Systems. Association for Computing Machinery, 1–15. doi: 10.1145/3313831.3376144
Puyana-Romero, V., Lopez-Segura, L. S., Maffei, L., Hernández-Molina, R., and Masullo, M. (2017). Interactive soundscapes: 360°-Video based immersive virtual reality in a tool for the participatory acoustic environment evaluation of urban areas. Acta Acustica united Acustica 103, 574–588. doi: 10.3813/AAA.919086
Ramalho, J., and Chambel, T. (2013). “Immersive 360° mobile video with an emotional perspective,” in 2013 ACM International Workshop on Immersive Media Experiences (New York, NY: ACM), 35–40. doi: 10.1145/2512142.2512144
Regal, G., Voigt-Antons, J.-N., Schmidt, S., Schrammel, J., Kojić, T., Tscheligi, M., et al. (2019). Questionnaires embedded in virtual environments: reliability and positioning of rating scales in virtual environments. Qual. User Exp. 4:5. doi: 10.1007/s41233-019-0029-1
Riva, G., Mantovani, F., Capideville, C. S., Preziosa, A., Morganti, F., Villani, D., et al. (2007). Affective interactions using virtual reality: the link between presence and emotions. CyberPsychol. Behav. 10, 45–56. doi: 10.1089/cpb.2006.9993
Riva, G., and Waterworth, J. A. (2003). Presence and the self: a cognitive neuroscience approach. Presence Connect 3, 1–11.
Roth, W. T. (1983). “A comparison of P300 and skin conductance response,” in Advances in Psychology. Tutorials in Event Related Potential Research: Endogenous Components, ed W. K. G. Anthony (Amsterdam: North-Holland), 177–199. doi: 10.1016/S0166-4115(08)62039-7
Runge, N., Hellmeier, M., Wenig, D., and Malaka, R. (2016). “Tag your emotions: a novel mobile user interface for annotating images with emotions,” in 18th International Conference on Human-Computer Interaction with Mobile Devices and Services Adjunct (New York, NY: ACM), 846–853. doi: 10.1145/2957265.2961836
Russell, J. A. (1980). A circumplex model of affect. J. Pers. Soc. Psychol. 39, 1161–1178. doi: 10.1037/h0077714
Russell, J. A. (2003). Core affect and the psychological construction of emotion. Psychol. Rev. 110, 145–172. doi: 10.1037/0033-295X.110.1.145
Russell, J. A., and Feldman Barrett, L. (1999). Core affect, prototypical emotional episodes, and other things called emotion: dissecting the elephant. J. Pers. Soc. Psychol. 76, 805–819. doi: 10.1037/0022-3514.76.5.805
Russell, J. A., Weiss, A., and Mendelson, G. A. (1989). Affect grid: a single-item scale of pleasure and arousal. J. Pers. Soc. Psychol. 57, 493–502. doi: 10.1037/0022-3514.57.3.493
Schmitt, B. (1999). Experiential marketing. J. Mark. Manage. 15, 53–67. doi: 10.1362/026725799784870496
Schwarz, N. (2002). “Feelings as information: moods influence judgments and processing strategies,” in Heuristics and Biases: The Psychology of Intuitive Judgment, eds T. Gilovich, D. Griffin, and D. Kahneman (New York, NY: Cambridge University Press), 534–547.
Schwarz, N., and Clore, G. L. (1983). Mood, misattribution, and judgments of well-being: informative and directive functions of affective states. J. Pers. Soc. Psychol. 45, 513–523. doi: 10.1037/0022-3514.45.3.513
Schwind, V., Knierim, P., Haas, N., and Henze, N. (2019). “Using presence questionnaires in virtual reality,” in CHI Conference on Human Factors in Computing Systems (CHI 2019) (New York, NY: ACM). doi: 10.1145/3290605.3300590
Sester, C., Deroy, O., Sutan, A., Galia, F., Desmarchelier, J.-F., Valentin, D., et al. (2013). “Having a drink in a bar”: an immersive approach to explore the effects of context on drink choice. Food Qual. Preference 28, 23–31. doi: 10.1016/j.foodqual.2012.07.006
Seth, A., Suzuki, K., and Critchley, H. (2012). An interoceptive predictive coding model of conscious presence. Front. Psychol. 2:395. doi: 10.3389/fpsyg.2011.00395
Sharar, S. R., Alamdari, A., Hoffer, C., Hoffman, H. G., Jensen, M. P., and Patterson, D. R. (2016). Circumplex model of affect: a measure of pleasure and arousal during virtual reality distraction analgesia. Games Health J. 5, 197–202. doi: 10.1089/g4h.2015.0046
Shrout, P. E., and Fleiss, J. L. (1979). Intraclass correlations: uses in assessing rater reliability. Psychol. Bull. 86, 420–428. doi: 10.1037/0033-2909.86.2.420
Simon, S. C., and Greitemeyer, T. (2019). The impact of immersion on the perception of pornography: a virtual reality study. Comput. Hum. Behav. 93, 141–148. doi: 10.1016/j.chb.2018.12.018
Sinesio, F., Moneta, E., Porcherot, C., Abbà, S., Dreyfuss, L., Guillamet, K., et al. (2019). Do immersive techniques help to capture consumer reality? Food Qual. Preference 77, 123–134. doi: 10.1016/j.foodqual.2019.05.004
Skarbez, R., Brooks, F. P., and Whitton, M. C. (2017). A survey of presence and related concepts. ACM Comput. Surveys 50:96. doi: 10.1145/3134301
Slater, M., and Wilbur, S. (1997). A framework for immersive virtual environments (FIVE): speculations on the role of presence in virtual environments. Presence Teleoper. Virtual Environ. 6, 603–616. doi: 10.1162/pres.1997.6.6.603
Söderman, M. (2005). Virtual reality in product evaluations with potential customers: an exploratory study comparing virtual reality with conventional product representations. J. Eng. Design 16, 311–328. doi: 10.1080/09544820500128967
Soleymani, M., Chanel, G., Kierkels, J. J. M., and Pun, T. (2008). “Affective ranking of movie scenes using physiological signals and content analysis,” in 2nd ACM workshop on Multimedia semantics (New York, NY: ACM), 32–39. doi: 10.1145/1460676.1460684
Spielberger, C. D. (1983). State-Trait Anxiety Inventory for adults. Mountain View, CA: Consulting Psychologists Press, Inc. doi: 10.1037/t06496-000
Spinelli, S., Masi, C., Dinnella, C., Zoboli, G. P., and Monteleone, E. (2014). How does it make you feel? A new approach to measuring emotions in food product experience. Food Qual. Preference 37, 109–122. doi: 10.1016/j.foodqual.2013.11.009
Suhaimi, N. S., Yuan, C. T. B., Teo, J., and Mountstephens, J. (2018). “Modeling the affective space of 360 virtual reality videos based on arousal and valence for wearable EEG-based VR emotion classification,” in 2018 IEEE 14th International Colloquium on Signal Processing & Its Applications (CSPA) (Piscataway, NJ: IEEE), 167–172. doi: 10.1109/CSPA.2018.8368706
Tajadura-Jiménez, A., and Västfjäll, D. (2008). “Auditory-induced emotion: a neglected channel for communication in human-computer interaction,” in Affect and Emotion in Human-Computer Interaction, eds C. Peter and B. R. Berlin (Heidelberg: Springer), 63–74. doi: 10.1007/978-3-540-85099-1_6
Toet, A., Eijsman, S., Liu, Y., Donker, S., Kaneko, D., Brouwer, A.-M., et al. (2019a). The relation between valence and arousal in subjective odor experience. Chemosens. Percept. 13, 141–151. doi: 10.1007/s12078-019-09275-7
Toet, A., Heijn, F., Brouwer, A.-M., Mioch, T., and van Erp, J. B. F. (2019b). “The EmojiGrid as an immersive self-report tool for the affective assessment of 360 VR videos,” in EuroVR 2019: Virtual Reality and Augmented Reality, eds P. Bourdot, V. Interrante, L. Nedel, N. Magnenat-Thalmann, and G. Zachmann (Cham: Springer International Publishing), 330–335. doi: 10.1007/978-3-030-31908-3_24
Toet, A., Kaneko, D., Ushiama, S., Hoving, S., de Kruijf, I., Brouwer, A.-M., et al. (2018). EmojiGrid: a 2D pictorial scale for the assessment of food elicited emotions. Front. Psychol. 9:2396. doi: 10.3389/fpsyg.2018.02396
Toet, A., and van Erp, J. B. F. (2019). The EmojiGrid as a tool to assess experienced and perceived emotions. Psych 1, 469–481. doi: 10.3390/psych1010036
Trindade, Y., Rebelo, F., and Noriega, P. (2018). “Tourism and virtual reality: user experience evaluation of a virtual environment prototype,” in Design, User Experience, and Usability: Users, Contexts and Case Studies (DUXU 2018), eds M. A. and W. W. (Cham: Springer International Publishing), 730–742. doi: 10.1007/978-3-319-91806-8_57
Tussyadiah, I., Wang, D., and Jia, C. H. (2016). “Exploring the persuasive power of virtual reality imagery for destination marketing,” in 2016 TTRA International Conference: Advancing Tourism Research Globally. Tourism Travel and Research Association.
Tussyadiah, I. P., Wang, D., and Jia, C. (2017). “Virtual reality and attitudes toward tourism destinations,” in Information and Communication Technologies in Tourism 2017, eds R. Schegg and B. Stangl (Cham: Springer International Publishing), 229–239. doi: 10.1007/978-3-319-51168-9_17
Valtchanov, D., Barton, K. R., and Ellard, C. (2010). Restorative effects of virtual nature settings. Cyberpsychol. Behav. Soc. Netw. 13, 503–512. doi: 10.1089/cyber.2009.0308
Vastenburg, M., Romero Herrera, N., Van Bel, D., and Desmet, P. (2011). “PMRI: development of a pictorial mood reporting instrument,” in CHI '11 Extended Abstracts on Human Factors in Computing Systems, 2155−2160. doi: 10.1145/1979742.1979933
Västfjäll, D. (2003). The subjective sense of presence, emotion recognition, and experienced emotions in auditory virtual environments. CyberPsychol. Behav. 6, 181–188. doi: 10.1089/109493103321640374
Visch, V. T., Tan, E. S., and Molenaar, D. (2010). The emotional and cognitive effect of immersion in film viewing. Cogn. Emot. 24, 1439–1445. doi: 10.1080/02699930903498186
Voigt-Antons, J.-N., Lehtonen, E., Palacios, A. P., Ali, D., Kojić, T., and Möller, S. (2020). “Comparing emotional states induced by 360 deg videos via head-mounted display and computer screen,” in Twelfth International Conference on Quality of Multimedia Experience (QoMEX). IEEE, 1–6. doi: 10.1109/QoMEX48832.2020.9123125
Walls, A. R., Okumus, F., and Wang, Y. (2011). Cognition and affect interplay: a framework for the tourist vacation decision-making process. J. Travel Tourism Mark. 28, 567–582. doi: 10.1080/10548408.2011.588121
Wang, G., Gu, W., and Suh, A. (2018). “The effects of 360-degree VR videos on audience engagement: evidence from the New York Times,” in International Conference on HCI in Business, Government, and Organizations, eds F. H. Nah and B. Xiao (Cham: Springer), 217–235. doi: 10.1007/978-3-319-91716-0_17
Waterworth, J. A., Waterworth, E. L., Riva, G., and Mantovani, F. (2015). “Presence: form, content and consciousness” in Immersed in Media: Telepresence Theory, Measurement and Technology, eds M. Lombard, F. Biocca, J. Freeman, W. Ijsselsteijn, and R. J. Schaevitz (Cham: Springer International Publishing), 35–58. doi: 10.1007/978-3-319-10190-3_3
Watson, D., Clark, L. A., and Tellegen, A. (1988). Development and validation of brief measures of positive and negative affect: the PANAS scales. J. Pers. Soc. Psychol. 54, 1063–1070. doi: 10.1037/0022-3514.54.6.1063
Watson, D. G., Blagrove, E., Evans, C., and Moore, L. (2012). Negative triangles: simple geometric shapes convey emotional valence. Emotion 12, 18–22. doi: 10.1037/a0024495
Windhager, S., Slice, D., Schaefer, K., Oberzaucher, E., Thorstensen, T., and Grammer, K. (2008). Face to face: the perception of automotive designs. Hum. Nat. 19, 331–346. doi: 10.1007/s12110-008-9047-z
World Medical Association (2013). World Medical Association declaration of Helsinki: ethical principles for medical research involving human subjects. J. Am. Med. Assoc. 310, 2191–2194. doi: 10.1001/jama.2013.281053
Xu, C., Chen, L., and Chen, G. (2008). “A color bar based affective annotation method for media player,” in Frontiers of WWW Research and Development - APWeb 2006, eds X. Zhou, J. Li, H. T. Shen, M. Kitsuregawa, and Y. Zhang (Heidelberg; Berlin: Springer), 759–764. doi: 10.1007/11610113_70
Xue, T., Ghosh, S., Ding, G., El Ali, A., and Cesar, P. (2020). “Designing real-time, continuous emotion annotation techniques for 360° VR videos,” in CHI Conference on Human Factors in Computing Systems Extended Abstracts. Association for Computing Machinery, 1–9. doi: 10.1145/3334480.3382895
Zentner, M., and Eerola, T. (2010). Self-report measures and models, in Handbook of music and emotion: Theory, research, applications (Oxford: Oxford University Press), 187–221. doi: 10.1093/acprof:oso/9780199230143.003.0008
Zhang, S., Huang, Q., Jiang, S., Gao, W., and Tian, Q. (2010). Affective visualization and retrieval for music video. IEEE Trans. Multimedia 12, 510–522. doi: 10.1109/TMM.2010.2059634
Keywords: 360° VR, immersive VR, valence, arousal, emotions, EmojiGrid
Citation: Toet A, Heijn F, Brouwer A-M, Mioch T and van Erp JBF (2020) An Immersive Self-Report Tool for the Affective Appraisal of 360° VR Videos. Front. Virtual Real. 1:552587. doi: 10.3389/frvir.2020.552587
Received: 16 April 2020; Accepted: 17 August 2020;
Published: 25 September 2020.
Edited by:
Gabriel Zachmann, University of Bremen, GermanyReviewed by:
Tabitha C. Peck, Davidson College, United StatesDaniel Roth, Technical University of Munich, Germany
Copyright © 2020 Toet, Heijn, Brouwer, Mioch and van Erp. This is an open-access article distributed under the terms of the Creative Commons Attribution License (CC BY). The use, distribution or reproduction in other forums is permitted, provided the original author(s) and the copyright owner(s) are credited and that the original publication in this journal is cited, in accordance with accepted academic practice. No use, distribution or reproduction is permitted which does not comply with these terms.
*Correspondence: Alexander Toet, lex.toet@tno.nl