Virtual Reality for Interactive Medical Analysis
 Casey R. Koger
 Sohail S. Hassan
 Jie Yuan
 Yichen Ding
- 1Department of Bioengineering, Erik Jonsson School of Engineering and Computer Science, The University of Texas at Dallas, Richardson, TX, United States
- 2Hamon Center for Regenerative Science and Medicine, UT Southwestern Medical Center, Dallas, TX, United States
Molecular imaging along with 3-dimensional (3-D) or 4-D (3-D spatial + 1-D temporal) visualization is widely used in clinical diagnosis and surgical planning. However, the pre-defined perspective and confined manipulation limit the in-depth exploration and analysis in 3-D/4-D. To overcome this obstacle, we utilized virtual reality (VR) to interact with CT images of the cardiopulmonary system in a 3-D immersive environment. We implemented manipulative functionalities into the VR environment that altered the cardiopulmonary models to interactively generate new data analysis perspectives. We successfully sliced a CT cardiac model showing in-depth surface visualizations of the ventricles and atria. Our customized framework enables enhanced data interpretation interactivity of CT images and establishes a user-directed manipulative VR platform derived from imaging results for remote medical practices including training, education, and investigation.
Introduction
Molecular imaging has been advancing fundamental investigations and clinical assessments of biophysical and biochemical processes for decades (Weissleder, 2001; Weissleder and Pittet, 2008; Wu and Shu, 2018). This non-invasive method, including computed tomography (CT), magnetic resonance imaging (MRI), and positron emission tomography (PET), especially assists in revealing detailed physiological structures. The biological detail established CT and MRI clinically as methods for accurate clinician diagnosis, providing inherently quantifiable information with a visualization tool (Weissleder and Pittet, 2008; Wu and Shu, 2018). While conventional volume rendering and visualization allow for the analysis towards quantifiable data with measurement, the pre-defined perspectives and restricted 2-dimensional (2-D) display limit the data interpretation in an interactive manner, leading to the incidental discarding of intrinsic information (Maher et al., 2004; Cutrale et al., 2019).
Virtual reality (VR) is an emerging platform that provides an immersive 3-D environment for user-interactivity (Bryson, 1996; Ding et al., 2017; Silva et al., 2018; Spark et al., 2020). The cost-efficient head mounted display (HMD) with controllers enables the generation of an immersive environment that is not replicable with a display screen, creating a sense of involvement and enhancing the interactivity between the user and data (Bryson, 1996; Hussein et al., 2015; Spark et al., 2020). VR allows implementation of custom interactions that alter the representation of data within the 3-D immersive environment. For this reason, integrating the VR environment with imaging results resolves the limitation of 2-D data representation resulting in conclusive data analysis from new perspectives.
Motivated from the advantages of VR, an effective workflow interfacing VR with CT images was carried out to enhance data interactivity and interpretability for the sake of fundamental investigation and clinical planning. Previous studies and available software incorporate medical imaging data with VR utilizing volume rendering or point-cloud visualization, we expand upon this workflow by incorporating segmentation for the generation of 3-D surface models (Krapichler et al., 1998; Pidhorskyi et al., 2018; Kalarat and Koomhin, 2019; Spark et al., 2020; Arivis, 2021; immSci, 2021). The 3-D surface model VR platform links real data from the physical world to virtual simulation, providing interactivity and immersive feeling over simple volume rendering. We form complex 3-D models in VR from CT image stacks, broadening previous methods that detail 2-D image to 3-D model conversion by precisely segmenting multiple pulmonary sections for a detailed immersive exploration of a CT pulmonary model (Rizzi et al., 2007; Nocerino et al., 2016; Ding et al., 2017; Uccheddu et al., 2018; Sutherland et al., 2019). To further enhance data analysis and surgical planning capabilities, we successfully developed user-directed manipulations, which alter data representation from conventional visualization. The manipulations altered complex models generating advanced perspectives for analysis and planning through interactive cutting and immersive grabbing. Interfacing CT image data collection with VR, we founded a robust framework for the transition of VR visualization into clinical settings.
Methods
While our framework interfaced VR with CT image stacks of cardiopulmonary system, this method is broadly applicable to many types of organs and is clinically scalable to other imaging modalities such as MRI, PET, and ultrasound. The framework consisted of processing and segmenting CT images, producing and editing a surface mesh, model importing, and script applications. The procedure for the development of the VR platform is illustrated in Figure 1. CT image datasets were obtained from the open-source database offered by the International Early Lung Cancer Action Program (ELCAP) and from the OsiriX DICOM Image Library. The software utilized is not mandatory, providing other programs such as Unreal Engine and ImageJ feasible. All utilized software comes with educational licenses or is free to use. All applications and processing tests were performed on a computer running on Microsoft Windows 10 Enterprise with an Intel Core i9-10900X CPU and a NVIDIA Quadro RTX 5000 GPU on 64 GB of installed physical memory.
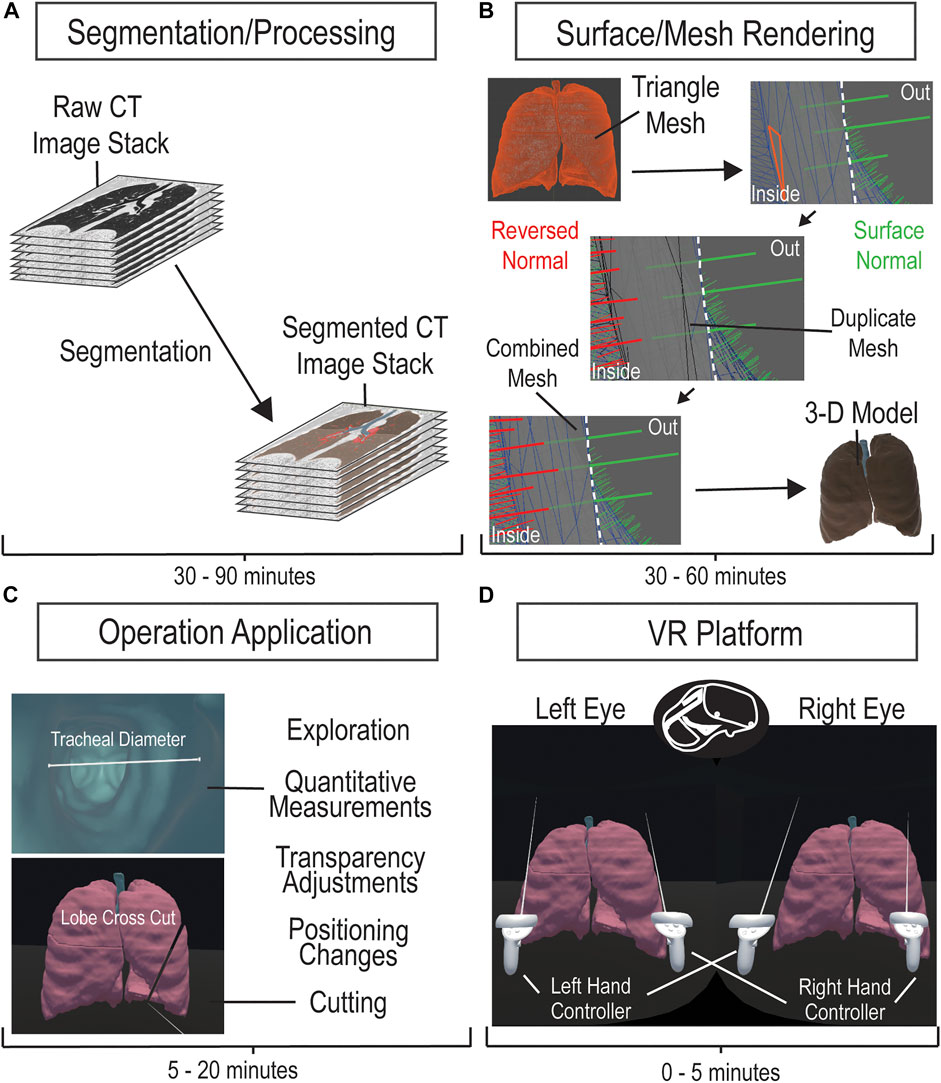
FIGURE 1. CT Imaging to VR Framework Pipeline. A four-step process to develop a VR platform for viewing CT images. Acquired CT image stacks are processed and segmented over 30–90 min (A) to generate a mesh surface (B). The mesh surface normals are manipulated to properly generate a 3-D surface model using Maya within 30–60 min (B). The model is loaded onto the VR platform and is applied with the corresponding manipulation scripts (C). The VR platform generates an environment that allows the user to interactively explore and manipulate the 3-D model (D).
Segmentation
We imported imaging datasets into 3-D Slicer version 4.11, an open-source platform that provides extensive tools for image processing and segmentation. After data importation, we adjusted contrast thresholds for enhanced image visualization, allowing ease of anatomical structure identification. To segment, or label, specific regions of interest (ROI), we utilized semi-automatic image processing tools, such as Grow from seeds, Fill between slices, Threshold, Smoothing, Scissors, Islands, Logical Operators, and Surface Cut, in combination with manual tools, such as Paint, Draw, and Erase. Descriptions on how to use these tools can be found in the documentation for 3-D Slicer (Slicer Community, 2020). Semi-automatic tools allow for expedited, yet general, labeling of ROIs, through computation and user adjustment based on satisfaction. Manual tools allow for labeling of finer details, ensuring that segments best match the anatomy in the dataset. Overall, we labeled structural portions separately, such as pulmonary lobes or cardiac ventricles. While the time to label each portion varies depending on the organ, each overall model, whether the pulmonary or cardiac, took 30–90 min for a full segmentation. The accuracy of our segmentation to the original data was verified by a physician. After segmentation, we exported the data as a surface mesh in the . obj file format. This surface mesh is a 3-D model generated directly from our segmentation and can be observed and manipulated in the VR environment.
Mesh Correction
We sought to render the inner surface of our mesh for better visualization in VR, following the generation of the surface mesh in 3-D Slicer. The .obj file was imported into Maya 2020, where we could observe model properties such as surface normal vectors and triangles. We manually duplicated the mesh and reversed the surface normal vectors, utilizing the Maya duplicate and reverse functions, respectively, generating two opposing meshes. We merged the “exterior” mesh with the duplicate “interior” mesh for one model by selecting both meshes and using a merge function within Maya. This produced a mesh with outer normal vectors and inner normal vectors and was repeated for the separate meshes of our model. Each individual mesh could be rapidly duplicated, reversed, and merged within 5 min, but depending on the quantity of meshes within a single model, the time to process one model could take 30 min to an hour. The double-sided surface model was then exported as a .fbx file.
Virtual Reality Operations
We generated a VR environment, utilizing an educational licensed Unity game engine, to house the subject model within a box. The environment is structured to focus on the model and was manually created using a Unity cube object. The desired 3-D model, .fbx file, would be imported into Unity, placed into the scene/environment, have read/write enabled, and have colliders generated. With the model in the scene, one would have to manually apply scripts to the model for the cutting manipulation to function. The process of importing the model and ensuring its functionality could take between 5 and 20 min, depending on the familiarity with Unity. Automatic application and enabling of the model are intended to be implemented in the future for the completed program. Inside of the VR program, the user directly alters the model, selectively grabbing and interacting with segmented parts. The measuring tool was verified with comparisons to 3-D Slicer’s measuring tool and was verified as reliable for anatomical information by a physician. A user-directed cut manipulation automatically slices the model planarly for alternate perspective analysis. The code for the 3-D model manipulation was created by utilizing online assets, searching online forums, and personal coding/debugging. The slicer manipulation formulates a plane from a user-defined line that bisects mesh triangles to split the model into two. The operation then separates the created objects and generates a surface for each. To enhance the slicing operation, a Unity asset was utilized for optimizations. The 3-D model interactions allow detailed investigation of the subject anatomical structure.
Virtual Reality Application
We utilized an Oculus Quest II HMD and controllers, to manipulate the 3-D model and explore the subject structure within the VR environment. Interactive operations and manipulations were attached to the left and right controllers’ functional buttons, while a menu was created for additional functions. Utilizing Unity 2020.3.2f1, we published the model and scene as a single application allowed for repetitive use of the VR platform for multiple users. The specific hardware and software versions should not be necessary to utilize the methodology and platform mentioned.
Results
We developed a VR framework that utilizes CT images to render an explorative subject platform enhancing user involvement in patient data analysis through an immersive 3-D environment. The platform establishes selective grabbing and user-directed cutting manipulations for interactive structural investigations generating perspectives that conventional visualization methods cannot.
Our framework generated a pulmonary 3-D model for visualization from 276 raw CT images. To demonstrate user-directed movement inside the VR environment, we have included multiple perspectives of the outer pulmonary lobes in Figures 2A–C. This is further demonstrated by the user walking through the pulmonary environment in a shared video depicting the VR HMD perspective (Supplementary Video S1). We enhanced the in-depth viewing and 3-D perception of the model by implementing a selectively adjustable opacity (Figures 2A,D,E). The changing model transparency allows viewing of the pulmonary vessels (Figure 2E) from outside and assists with user focus on the vessels. Alternatively, the walkability within the VR environment allows the user to walk into the model and view the pulmonary vessels and inner lobe surfaces from a close perspective (Figure 2F). To perform quantitative analysis, a distance measurement tool allows for quantitative data on pulmonary vessel branches within the VR environment (Figure 2G). This quantitative tool can be adjusted and reused as desired to measure other subjects such as tracheal diameter. We created a label to assist in differentiating the separate pulmonary lobes and vessels (Figure 2H). The labeling, distance measurement tool, and user-selective transparency enhances the immersive VR environment for the generation of new views on the CT lungs. The unconfined user visual perspective within VR formulates data insights with qualitative and quantitative analysis.
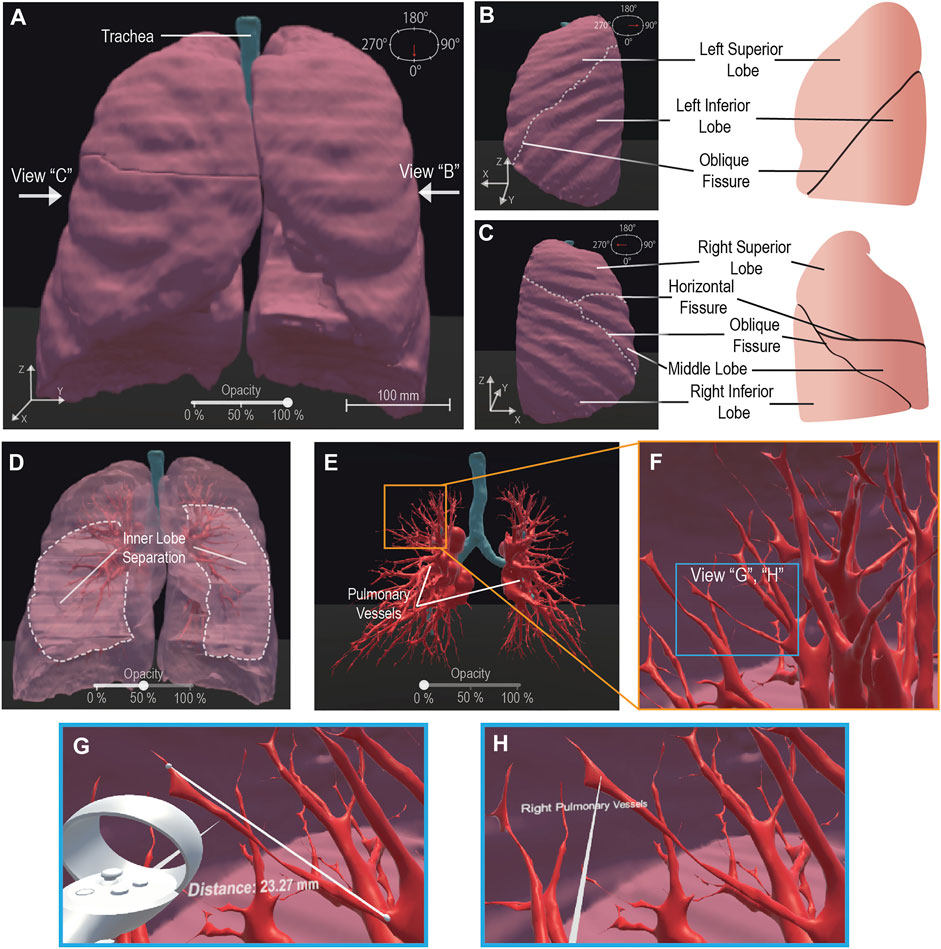
FIGURE 2. VR Basic Operations on 3-D CT Lung Model. We demonstrate the maneuverability within VR to explore the 3-D model moving from an initially centralized view (A) to a 90° rotated view (B) and a 270° perspective (C), the scale is noted at 100 mm (A). The 100% opacity model (A–C) is returned to a centralized view wherein we demonstrate the adjustable opacity functionality (D, E). We adjust the opacity to 50% (D) visibly displaying the inner distinction between lobes within the lung, then further adjust the opacity to 0% (E) to display the visibility of the pulmonary vessels for analysis. We represent VR immersion by going into the lung and viewing the 3-D pulmonary vessels (F). Inside VR to enhance model analysis, it is demonstrated that a measurement functionality (G) is present, for quantitative information, displaying “Distance: 23.27 mm” and a labeling functionality (H), for qualitative description, details a specific model section as the “Right Pulmonary Vessels”. Scale bar: 100 mm.
Further, our platform expands the benefits of VR from simple exploration and established tools to interactive ROI manipulations of a cardiac model (Figure 3). A CT heart was segmented for the generation of a 3-D patient model that was loaded onto the VR platform (Figure 3A). To demonstrate an interactive manipulative function, we grabbed and removed the segmented pericardium from the cardiac model (Figures 3A,C). By removing the pericardium, we focused on the underlying cardiac structure for larger manipulations on a specific region. We demonstrated the VR platform ability to slice a model by creating a user-defined cut across the ventricles and atria (Figure 3D). The user manipulation elucidated the proper structure of the cardiac model as compared to one of the CT slices (Figure 3E) and revealed the inner surface structures of the cardiac ventricle and atrial cavities. To further generate alternate perspectives and enhance user exploration, our platform is capable of multiple cut and grab manipulations being performed upon the model (Figure 3F). Offered through a user menu, we implemented an undo function for the cutting manipulation (Figure 3F) to avoid the full resetting of the application. To demonstrate the performance, the manipulations and operations on the cardiac model, we have shared Supplementary Video S2. The manipulative functions generate new perspectives inside the immersive 3-D environment enhancing the user interactivity for the patient data analysis on CT models.

FIGURE 3. VR Platform Manipulative Functionalities on a CT Heart Model. The framework generates an immersive biologically accurate 3-D model (A, B) and allows the user to interactively manipulate the model bypassing the pre-defined operations. The user accesses a grab function to directly alter the model and move the cardiac pericardium from an initial position (A) to a secondary position (B). The grab function allows for a focused perspective on the ventricles, atria, veins, and arteries that may require further applied manipulations, such as a cut (D). The user defines a specific line to form a plane that splits the targeted ventricles and atria (D), allowing for alternate analysis to be taken from the generated perspectives of the cut plane (E). The user can utilize the generated perspective to further verify the model according to the initial CT data (E) or explore differing views; LV: Left Ventricle; LA: Left Atrium; RV: Right Ventricle; RA: Right Atrium. The functionality of the platform allows for a multitude of cuts to be applied as needed and contains the ability to undo any unwanted cuts through a menu application (F). To understand system functionality, we depict the relation of model vertices to the cutting operation processing time for the initial and second cut on a model (G). The relation is then depicted comparing the cardiac model object meshes to the same object split into five separate meshes revealing a processing time improvement (H). For each cut examination, 7 data points with n = 10 independent runs. The dashed fits denote an exponential growth regression; R-Square = 0.88 and 0.94, respectively. Shaded regions: standard deviation.
Though the functionality of the model manipulations can be visualized, it is seen that the necessary time to complete mesh manipulations increases with the complexity of the mesh, taking
To determine the effectiveness of the VR platform and side effects associated with VR, we surveyed a small sample size of seven people. All seven were given full access to the demos represented in Supplementary Videos S1 and S2 and asked to fill out a simple questionnaire. The questionnaire asked for users to determine the usefulness and immersiveness of the program, the comfortability associated with the VR headset, and the disorientation or dizziness that was experienced. The users would respond to the question on a 1-5 scale (1: strongly disagree; 5: strongly agree). It was found, as seen in Table 1, that users strongly believed the VR demo to be immersive and to provide a utility to the understanding and exploration of the anatomical models. Users also were found to have little disorientation or dizziness for the duration and after use. Despite the effectiveness of the program, users tended not be extremely comfortable utilizing the VR HMD. The feedback supports the application and expansion of our program to improve upon the manipulation of medical data.
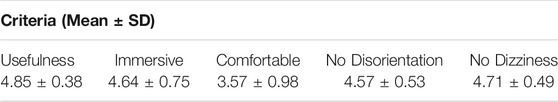
TABLE 1. VR user experience feedback.
Discussion
Our VR framework establishes an effective platform to perform interactive data analysis. The framework offers user-directed visualization and interaction of biomedical imaging data, enabling patient CT scan exploration and pre-surgical planning. The platform implements manipulation techniques, allowing user data alteration to generate insightful perspectives. The VR platform creates enhanced multi-angle perspectives to interpret the imaging information, paving a direction for education, discovery, and clinical utilization with high spatial resolution 3-D models.
Our VR platform successfully demonstrated the utilization of VR for detailed data exploration. We elucidated the effectiveness of VR to perform a cutting operation for rapid analysis of a CT human heart, allowing advanced exploration of the structure. While the cutting operation was optimized for speed, we found the manipulation processing time directly resulted from the model vertex quantity. To perform manipulations for complex models over
We recognize that our model consists of reduced details and fails to account for the variable thickness of anatomical structures. These inaccuracies could be a result of the mesh corrections that had been performed, but as the mesh correction goal was for the proper visualization of the model inside and out, without changing the original mesh structure, it is more likely these inaccuracies are a result of segmentation. Manual segmentation requires precision of proper element selection for the filtering and segmenting of the dataset. Human error and improper segmentations could result in less detailed models, which is avoided with trained deep learning segmentation. Deep learning segmentation provides an avenue of segmentation that is automatic and fast; however, deep learning requires large training datasets and its ability to transfer learning for datasets is weak (Lecun et al., 2015; Akkus et al., 2017; Esteva et al., 2019). We desired to segment multiple structures in a rapid time frame, which led to our use of manual segmentation. We intend to move forward with an efficient and robust image segmentation method for the retention of detail in the future (Ding et al., 2021).
Another alternate avenue to 3-D surface visualization is volume rendering, generating the texture that creates a semi-transparent 3-D image for data visualization and analysis. The use of volume rendering would bypass the need for segmentation, directly generating the 3-D texture from the image stack; however, volume rendering lacks the detail of inner and outer surface structure that a 3-D surface mesh contains and fails to incorporate immersive manipulations that a surface texture allows. We intend to generate a volume rendering platform for VR to visualize and interact with imaging datasets, while maintaining the founded manipulative operations.
Furthermore, we intend to expand the operational abilities of the VR platform leaning towards specific ROI selection and depth cutting operations. The targeted ROI manipulations would allow for improved user-directed environment and operational abilities. The depth cutting would simulate a scalpel for pre-surgical planning with the detail and interaction provided by VR. Utilizing the platform with a 4-D model would generate a visualization of structural biomechanisms with alternate perspectives for analysis. This platform and operations could be combined with a haptic feedback system, simulating resistance between objects part of the manipulated model.
Our platform retains outlooks towards the future generations of 3-D image visualization with innovative user interactions and manipulative tools. The VR platform generates new perspectives for enhanced interpretation of 3-D structure through user-defined data alterations under physiological and pathophysiological conditions. The applicable visualization and manipulations in VR enable quantitative and qualitative insights into clinical and fundamental research data. Acquired innovative insights could lay the foundation for the urgent demands in remote medical practices, and propel productive, safer surgeries from advanced pre-surgical analysis and planning on personalized imaging data.
Data Availability Statement
The original contributions presented in the study are included in the article/Supplementary Files, further inquiries can be directed to the corresponding author.
Ethics Statement
Ethical review and approval was not required for the study on human participants in accordance with the local legislation and institutional requirements. Written informed consent for participation was not required for this study in accordance with the national legislation and the institutional requirements.
Author Contributions
YD proposed the experiments and reviewed the process. CK and SH performed experiments and analyzed results. All authors contributed to the manuscript preparation, revision, and final approval.
Funding
This work was supported by NIH R00 HL148493 (YD) and the University of Texas at Dallas.
Conflict of Interest
The authors declare that the research was conducted in the absence of any commercial or financial relationships that could be construed as a potential conflict of interest.
Publisher’s Note
All claims expressed in this article are solely those of the authors and do not necessarily represent those of their affiliated organizations, or those of the publisher, the editors and the reviewers. Any product that may be evaluated in this article, or claim that may be made by its manufacturer, is not guaranteed or endorsed by the publisher.
Acknowledgments
The authors appreciate all other lab members for constructive discussion. The authors acknowledge and appreciate the accessibility of the CT imaging data accredited to The Vision and Image Analysis Group of Cornell University and Pixmeo, the foundation behind the OsiriX platform (The Vision and Image Analysis Group, 2003; Pixmeo, 2021). The authors acknowledge a Unity asset, Mesh Slicer, by Staz Bz that assisted in the optimizations of the manipulation code.
Supplementary Material
The Supplementary Material for this article can be found online at: https://www.frontiersin.org/articles/10.3389/frvir.2022.782854/full#supplementary-material
References
Akkus, Z., Galimzianova, A., Hoogi, A., Rubin, D. L., and Erickson, B. J. (2017). Deep Learning for Brain MRI Segmentation: State of the Art and Future Directions. J. Digit Imaging 30, 449–459. doi:10.1007/s10278-017-9983-4
Arivis (2021). VisionVR. Arivis A Zeiss Company. Available at: https://www.arivis.com/solutions/visionvr/visualization.
Bryson, S. (1996). Immersing the User in the Virtual Reality in Scientific Visualization. Commun. ACM 39, 5. doi:10.1145/229459.229467
Cutrale, F., Fraser, S. E., and Trinh, L. A. (2019). Imaging, Visualization, and Computation in Developmental Biology. Annu. Rev. Biomed. Data Sci. 2, 223–251. doi:10.1146/annurev-biodatasci-07201810.1146/annurev-biodatasci-072018-021305
Ding, Y., Abiri, A., Abiri, P., Li, S., Chang, C.-C., Baek, K. I., et al. (2017). Integrating Light-Sheet Imaging with Virtual Reality to Recapitulate Developmental Cardiac Mechanics. JCI Insight 2, e97180. doi:10.1172/jci.insight.97180
Ding, Y., Gudapati, V., Lin, R., Fei, Y., Packard, R. R. S., Song, S., et al. (2021). Saak Transform-Based Machine Learning for Light-Sheet Imaging of Cardiac Trabeculation. IEEE Trans. Biomed. Eng. 68, 225–235. doi:10.1109/TBME.2020.2991754
Esteva, A., Robicquet, A., Ramsundar, B., Kuleshov, V., DePristo, M., Chou, K., et al. (2019). A Guide to Deep Learning in Healthcare. Nat. Med. 25, 24–29. doi:10.1038/s41591-018-0316-z
Hussein, M., Nätterdal, C., and Steghöfer, J.-P. (2015). The Benefits of Virtual Reality in Education: A Comparison Study Master’s thesis/dissertation. Göteborg(SE): University of Gothenburg.
immSci (2021). ExMicroVR. Immersive Science. Available at: http://www.immsci.com/exmicrovr-license/.
Kalarat, K., and Koomhin, P. (2019). Real-time Volume Rendering Interaction in Virtual Reality. IJTech 10, 1307–1314. doi:10.14716/ijtech.v10i7.3259
Krapichler, C., Haubner, M., Engelbrecht, R., and Englmeier, K.-H. (1998). VR Interaction Techniques for Medical Imaging Applications. Comp. Methods Programs Biomed. 56, 65–74. doi:10.1016/s0169-2607(98)00007-8
Lecun, Y., Bengio, Y., and Hinton, G. (2015). Deep Learning. Nature 521, 436–444. doi:10.1038/nature14539
Li, X., Yi, W., Chi, H.-L., Wang, X., and Chan, A. P. C. (2018). A Critical Review of Virtual and Augmented Reality (VR/AR) Applications in Construction Safety. Automation in Construction 86, 150–162. doi:10.1016/j.autcon.2017.11.003
Maher, M. M., Kalra, M. K., Sahani, D. V., Perumpillichira, J. J., Rizzo, S., Saini, S., et al. (2004). Techniques, Clinical Applications and Limitations of 3D Reconstruction in CT of the Abdomen. Korean J. Radiol. 5, 55. doi:10.3348/kjr.2004.5.1.55
Nocerino, E., Remondino, F., Uccheddu, F., Gallo, M., and Gerosa, G. (2016). 3D Modelling and Rapid Prototyping for Cardiovascular Surgical Planning - Two Case Studies. Int. Arch. Photogramm. Remote Sens. Spat. Inf. Sci. XLI-B5, 887–893. doi:10.5194/isprs-archives-xli-b5-887-2016
Pidhorskyi, S., Morehead, M., Jones, Q., Spirou, G., and Doretto, G. (2018). syGlass: Interactive Exploration of Multidimensional Images Using Virtual Reality Head-Mounted Displays. arXiv. ArXivID 1804.08197.
Pixmeo (2021). OsiriX DICOM Image Library. Available at: https://www.osirix-viewer.com/resources/dicom-image-library/.
Rizzi, S., Banerjee, P. P., and Luciano, C. (2007). “Automating the Extraction of 3D Models from Medical Images for Virtual Reality and Haptic Simulations,” in IEEE Conference on Automation Science and Engineering, Scottsdale, AZ, USA, September 22-25, 2007. doi:10.1109/coase.2007.4341748
Silva, J. N. A., Southworth, M., Raptis, C., and Silva, J. (2018). Emerging Applications of Virtual Reality in Cardiovascular Medicine. JACC: Basic Translational Sci. 3, 420–430. doi:10.1016/j.jacbts.2017.11.009
Slicer Community (2020). Segment Editor. 3-D Slicer. Available at: https://slicer.readthedocs.io/en/latest/user_guide/modules/segmenteditor.html.
Spark, A., Kitching, A., Esteban-Ferrer, D., Handa, A., Carr, A. R., Needham, L.-M., et al. (2020). vLUME: 3D Virtual Reality for Single-Molecule Localization Microscopy. Nat. Methods 17, 1097–1099. doi:10.1038/s41592-020-0962-1
Sutherland, J., Belec, J., Sheikh, A., Chepelev, L., Althobaity, W., Chow, B. J. W., et al. (2019). Applying Modern Virtual and Augmented Reality Technologies to Medical Images and Models. J. Digit Imaging 32, 38–53. doi:10.1007/s10278-018-0122-7
The Vision and Image Analysis Group (2003). ELCAP Public Lung Image Database. Available at: http://www.via.cornell.edu/databases/simbadb.html.
Uccheddu, F., Carfagni, M., Governi, L., Furferi, R., Volpe, Y., and Nocerino, E. (2018). 3D Printing of Cardiac Structures from Medical Images: an Overview of Methods and Interactive Tools. Int. J. Interact Des. Manuf 12, 597–609. doi:10.1007/s12008-017-0415-y
Weissleder, R. (2001). A Clearer Vision for In Vivo Imaging. Nat. Biotechnol. 19, 316–317. doi:10.1038/86684
Weissleder, R., and Pittet, M. J. (2008). Imaging in the Era of Molecular Oncology. Nature 452, 580–589. doi:10.1038/nature06917
Keywords: virtual reality, visualization, manipulation, interactive, exploration, analysis
Citation: Koger CR, Hassan SS, Yuan J and Ding Y (2022) Virtual Reality for Interactive Medical Analysis. Front. Virtual Real. 3:782854. doi: 10.3389/frvir.2022.782854
Received: 25 October 2021; Accepted: 21 January 2022;
Published: 14 February 2022.
Edited by:
Dirk Reiners, University of Central Florida, United StatesReviewed by:
Ashima Keshava, Osnabrück University, GermanyMatthew W. Zackoff MEd, Cincinnati Children’s Hospital Medical Center, United States
Copyright © 2022 Koger, Hassan, Yuan and Ding. This is an open-access article distributed under the terms of the Creative Commons Attribution License (CC BY). The use, distribution or reproduction in other forums is permitted, provided the original author(s) and the copyright owner(s) are credited and that the original publication in this journal is cited, in accordance with accepted academic practice. No use, distribution or reproduction is permitted which does not comply with these terms.
*Correspondence: Yichen Ding, Yichen.Ding@utdallas.edu
†These authors have contributed equally to this work