The Physical Driver of the Optical Eigenvector 1 in Quasar Main Sequence
 Swayamtrupta Panda
 Bożena Czerny
 Conor Wildy
- 1Center for Theoretical Physics, Polish Academy of Sciences, Warsaw, Poland
- 2Nicolaus Copernicus Astronomical Center, Polish Academy of Sciences, Warsaw, Poland
Quasars are complex sources, characterized by broad band spectra from radio through optical to X-ray band, with numerous emission and absorption features. This complexity leads to rich diagnostics. However, Boroson and Green (1992) used Principal Component Analysis (PCA), and with this analysis they were able to show significant correlations between the measured parameters. The leading component, related to Eigenvector 1 (EV1) was dominated by the anticorrelation between the FeII optical emission and [OIII] line and EV1 alone contained 30% of the total variance. It opened a way in defining a quasar main sequence, in close analogy to the stellar main sequence on the Hertzsprung-Russel (HR) diagram (Sulentic et al., 2001). The question still remains which of the basic theoretically motivated parameters of an active nucleus (Eddington ratio, black hole mass, accretion rate, spin, and viewing angle) is the main driver behind the EV1. Here we limit ourselves to the optical waveband, and concentrate on theoretical modeling the FeII to Hβ ratio, and we test the hypothesis that the physical driver of EV1 is the maximum of the accretion disk temperature, reflected in the shape of the spectral energy distribution (SED). We performed computations of the Hβ and optical FeII for a broad range of SED peak position using CLOUDY photoionisation code. We assumed that both Hβ and FeII emission come from the Broad Line Region represented as a constant density cloud in a plane-parallel geometry. We expected that a hotter disk continuum will lead to more efficient production of FeII but our computations show that the FeII to Hβ ratio actually drops with the rise of the disk temperature. Thus either hypothesis is incorrect, or approximations used in our paper for the description of the line emissivity is inadequate.
1. Introduction
Quasars are rapidly accreting supermassive black holes at the centers of massive galaxies. In type 1 AGN, we see the nucleus directly, the continuum emission dominating the energy output in the optical/UV band comes from an accretion disk surrounding a supermassive black hole (e.g., Czerny and Elvis, 1987; Capellupo et al., 2015), and the optical/UV emission broad emission lines, FeII pseudo-continuum and Balmer Component are usually considered to be coming from the Broad Line Region (BLR) clouds. Broad band spectral properties and line emissivity are highly correlated (Boroson and Green, 1992; Sulentic et al., 2000, 2002, 2007b; Yip et al., 2004; Shen and Ho, 2014; Sun and Shen, 2015), and the Principal Component Analysis (PCA) analysis is a powerful tool herein. As suggested by Sulentic et al. (2001), those correlations allow the identification of the quasar main sequence, analogous to the stellar main sequence on the HR diagram where the classification was also based purely on spectral properties of the stellar atmospheres. The stellar main sequence found the dependence of the spectra on the effective temperature of stars. Quasar main sequence was suggested to be driven mostly by the Eddington ratio (Boroson and Green, 1992; Sulentic et al., 2000; Shen and Ho, 2014) but also on the additional effect of the black hole mass, viewing angle and the intrinsic absorption (Sulentic et al., 2000; Kuraszkiewicz et al., 2009; Shen and Ho, 2014).
We postulate that the true driver behind the RFeII is the maximum of the temperature in a multicolor accretion disk which is also the basic parameter determining the broad band shape of the quasar continuum emission. The hypothesis seems natural because the spectral shape determines both broad band spectral indices as well as emission line ratios, and has already been suggested by Bonning et al. (2007). We expect an increase in the maximum of the disk temperature as the RFeII increases. According to Figure 1 from Shen and Ho (2014), increase in RFeII implies increase in the Eddington ratio or decrease in the mass of the black hole. We expect that this maximum temperature depends not only on the Eddington ratio (Collin et al., 2006) but on the ratio of the Eddington ratio to the black hole mass (or, equivalently, on the ratio of the accretion rate to square of the black hole mass).
2. Theory
Most of the quasar radiation comes from the accretion disk and forms the Big Blue Bump (BBB) in the optical-UV (Czerny and Elvis, 1987; Richards et al., 2006), and this thermal emission is accompanied by an X-ray emission coming from a hot optically thin mostly compact plasma, frequently refered to as a corona (Czerny and Elvis, 1987; Haardt and Maraschi, 1991; Fabian et al., 2015). The ionizing continuum emission thus consists of two physically different spectral components. We parameterize this emission in the following way. For convenience, the BBB component is parameterized by the maximum temperature of an accretion disk. In the standard accretion disk model this temperature is related to the black hole mass and accretion rate
where TBBB, maximum temperature corresponding to the Big Blue Bump; G, gravitational constant; M, black hole mass; , black hole accretion rate; r, radial distance from the center; Rin, radius corresponding to the innermost stable circular orbit. M and are in cgs units. Similar formalism has been used by Bonning et al. (2007) although the coefficient differs by a factor of 2.6 from Equation 1. This maximum is achieved not at the innermost stable orbit around a non-rotating black hole (3RSchw) but at 4.08 RSchw. The spectral energy distribution (SED) component peaks at the frequency
where νmax, frequency corresponding to TBBB; L, accretion luminosity ; LEdd, Eddington limit . The exact value of the proportionality coefficient has to be calculated numerically, and for a standard Shakura-Sunyaev disk hνmax/kTBBB = 2.092. We expect that the thin-disk formalism applies to all the Type 1 AGN radiating above 0.01LEdd and below 0.3LEdd. Instead of a full numerical model of an accretion disk spectrum, we simply use a power law with the fixed slope, αuv, and the value of TBBB to determine an exponential cut-off. The X-ray coronal component shape is defined by the slope (αx) and has an X-ray cut-off. The relative contribution is determined by fixing the broad band spectral index αox, and finally the absolute normalization of the incident spectrum is set assuming the source bolometric luminosity. We fix most of the parameters, and TBBB is the the basic parameter of our model.
Some of this radiation is reprocessed in the BLR which produces the emission lines. In order to calculate the emissivity, we need to assume the mean hydrogen density (nH) of the cloud, and a limiting column density (NH) to define the outer edge of the cloud. Ionization state of the clouds depends also on the distance of the BLR from the nucleus. We fix it using the observational relation by Bentz et al. (2013)
The values for the constants considered in Equation 3 are taken from the Clean Hβ RBLR−L model from Bentz et al. (2013) where λ = 5100 Å.
3. Results and Discussions
As a first test we check the dependence of the change in the RFeII as a function of the accretion disk maximum temperature, TBBB at constant values of Lbol, αuv, αox, nH, and NH. We fix the bolometric luminosity at the AGN, Lbol = 1045 erg s−1 with accretion efficiency ϵ = 1/12, since we consider a non-rotating black hole in Newtonian approximation (see Equation 1). This determines the accretion rate, Ṁ. The BBB's exponential cutoff value is determined by the maximum temperature of the disk. Our branch of solutions covers the disk temperature range between 1.06 × 10⁴K and 1.53 × 10⁵K. The corresponding range of the black hole mass range obtained from Equation (1) is [, ], and it implies the range of Eddington ratio (L/LEdd) [0.002, 0.33] calculated from the mentioned range of maximum disk temperatures. Large disk temperature corresponds to low black hole mass, since we fix the bolometric luminosity. Finally, we use a two-power law SED with optical-UV slope, αuv = −0.36, and X-ray slope, αx = −0.91 (Różańska et al., 2014). The exponential cutoff for the X-ray component is fixed at 100 keV (Frank et al., 2002 and references therein). By setting a value for the spectral index, αox = −1.6, we specify the optical-UV and X-ray luminosities. An example of SED is shown in upper panel of Figure 1.
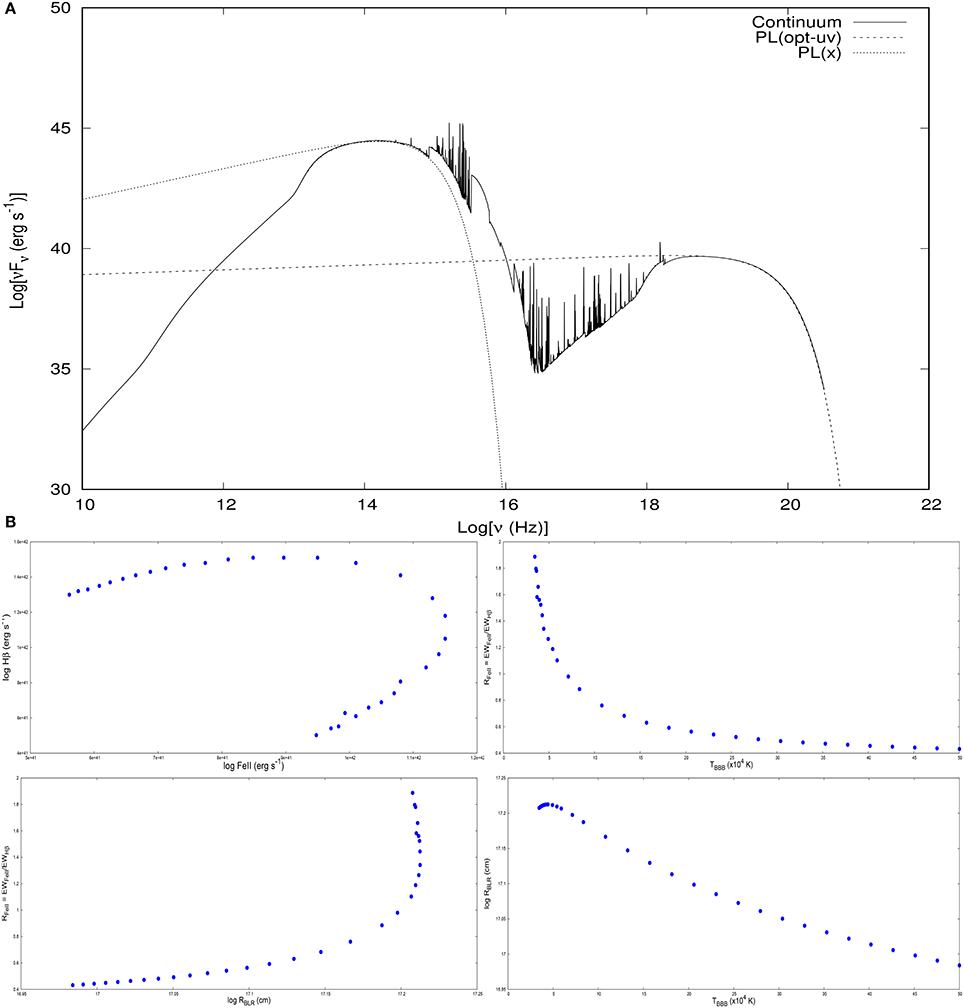
Figure 1. (A) An example of the spectral energy distribution of the AGN transmitted continuum and line emission produced by CLOUDY: , αox = −1.6, αuv = −0.36, αx = −0.9, , and log(RBLR) = 17.208. The two-component power law serves as the incident radiation. (B) The family of solutions is parameterized by maximum accretion disk temperature: (i) composite FeII line luminosity [erg s−1] − Hβ line luminosity [erg s−1]; (ii) TBBB − RFeII; (iii) log RBLR − RFeII; (iv) TBBB − log RBLR. Trends plotted for the following values of the parameters: , nH = 1011 cm−3 and NH = 1024 cm−2.
We now use this one-dimensional family of SED to calculate the line emission. We have dropped the X-ray power-law component in the subsequent analyses which we plan to re-introduce once we start to see the expected trend in the RFeII − TBBB. As a start, we use the values of parameters from Bruhweiler and Verner (2008) i.e., , , without including microturbulence (the motion that occurs within a cloud's line-forming region to whose variation the line formation and the emission spectrum is sensitive). The distance of the cloud from the source depends on adopted disk temperature. From the incident continuum, we estimate the L5,100 that in turn is used to calculate the inner radius of the BLR cloud using Equation (3).
Knowing the irradiation, we produce the intensities of the broad FeII emission lines from the corresponding levels of transitions present in CLOUDY 13.04 (Ferland et al., 2013). We calculate the FeII strength (RFeII = EWFeII / EWHβ), which is the ratio of FeII EW within 4,434–4,684 Å to broad Hβ EW. This prescription is taken from Shen and Ho (2014).
The results are shown in lower panel of Figure 1. The rise of the disk temperature initially leads to weak change of the cloud distance from the source, since the SED maximum is close to 5,100 Å for such massive black holes, and later with increasing distance from the source it decreases. The FeII intensity changes monotonically with TBBB but it is a decreasing, not an increasing trend. This is not what we have expected—high temperatures should correspond to low mass high accretion rate sources (Shakura and Sunyaev, 1973), Narrow Line Seyfert 1 galaxies, which show strong FeII component. This monotonic trend appears despite non-monotonic change with the disk temperature both in Hβ and FeII itself.
We thus extend our study for a broader parameter range, allowing for log(nH) in the range 10–12, and log(NH) from the range 22.0–24.0. The range of values obtained for RFeII went up from [0.005, 0.4] to [0.4, 1.95] with increasing NH. The change in the local density is also important. For a constant log(NH) = 24, changing log(nH) = 10–12 shifts the maximum of RFeII from 1.93 [for log(nH) = 10] down to 0.095 [for log(nH) = 12], thus, there is a declining trend in the maximum of RFeII with an increase in nH at constant NH. We see a definite change in the trend going from lower mean density to higher in the character of TBBB − RFeII dependence. In the case of the lower nH case, we see the turnover peak close to log[TBBB(K)] = 4.2 which couldn't be reproduced by the models generated using higher values of nH and NH owing to non-convergence of the CLOUDY code at lower values of TBBB. But on the higher end of TBBB we still get the same declining behavior of RFeII. The two extreme cases of changing both parameters are in Figure 2. We thus find that the obtained values of RFeII are heavily affected by the change in the maximum temperature of the BBB-component. The range of the RFeII is well covered, in comparison with the plots of Shen and Ho (2014): higher density solutions reproduce large values and lower values are obtained by lowering the local density and column density. But, in general, there is a decay in the FeII strength with the rise of the disk temperature while it was expected to follow a rising curve.
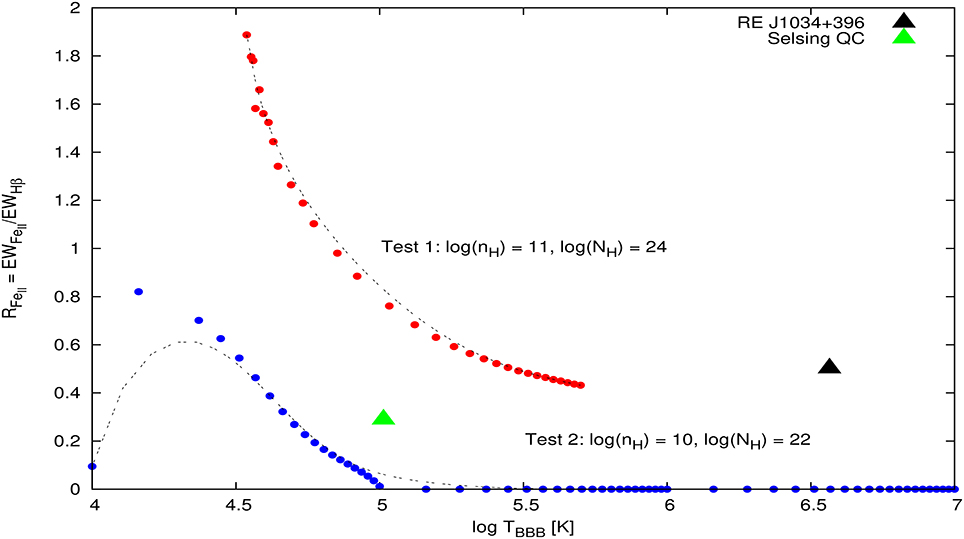
Figure 2. Comparison between RFeII–TBBB for two different constant-density single cloud models. Observational data RE J1034+396 (Czerny et al., 2016) and Selsing quasar composite (Selsing et al., 2016) plotted on the simulated trends.
To understand the nature of this trend in our CLOUDY computations we plot Hβ and FeII emissivity profiles (Figures 3, 4) where we consider only the first five FeII transitions in the 4,434–4,684 Å range. We compute these profiles by varying nH [log(nH) = (10, 12)], NH [log(NH) = (22, 24)] and testing the dependence of TBBB for three different temperature cases. The Hβ nearly always dominates over the selected FeII emissions. But close to the outer surface of the cloud i.e., as log(NH) → 24, the Hβ emission starts to drop while the FeII increases with increasing NH, and there is some overlap region (see Figure 3, 4). In Figure 3, we find that with increasing nH, the peak of the Hβ formation shifts closer to the inner surface of the cloud, so the relative contribution of FeII rises. However, with increasing TBBB the emissivity zones move deeper, and the relative role of Hβ (see the extreme right panel of Figure 4) goes down.
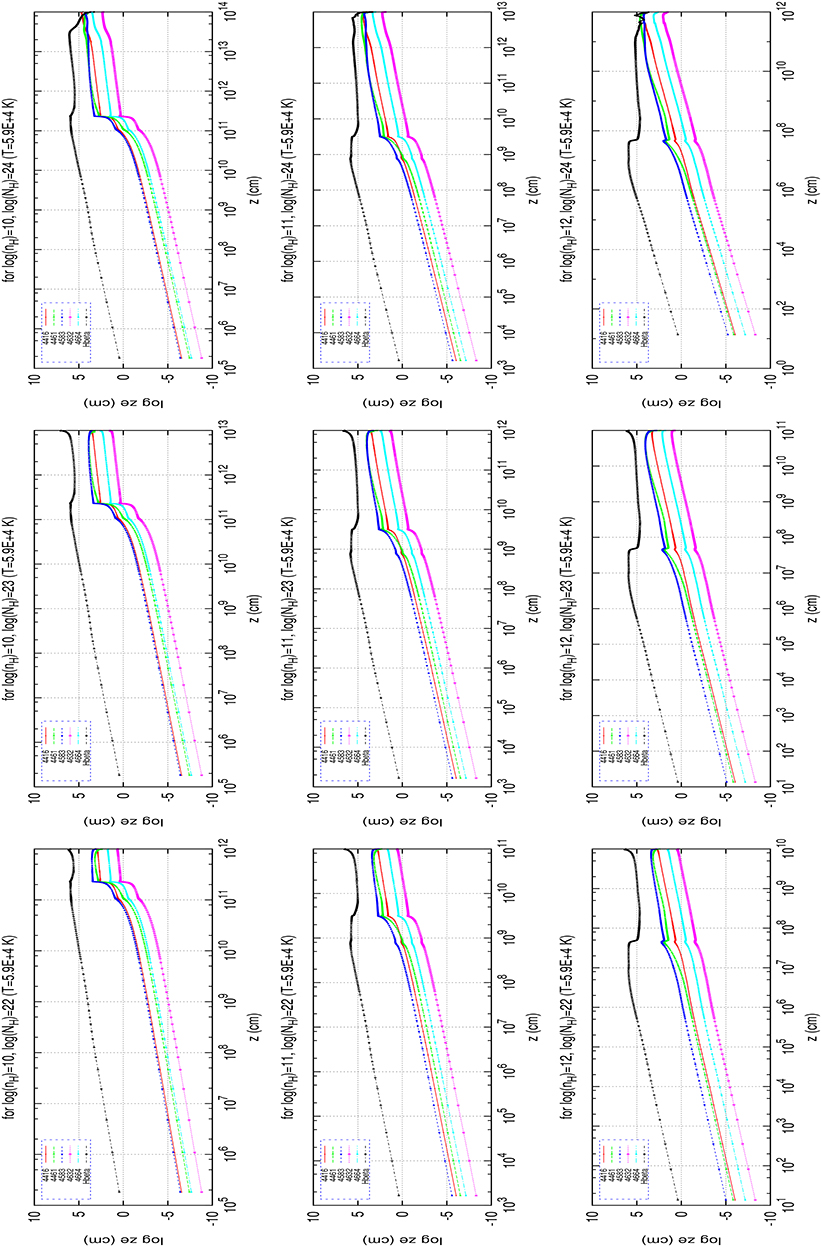
Figure 3. Emissivity profiles of Hβ and FeII for different local densities and column densities: TBBB = 5.9 × 10⁴ K. X-axis label, geometrical depth (in cm); Y-axis label, geometrical depth (z) × emissivity (e).
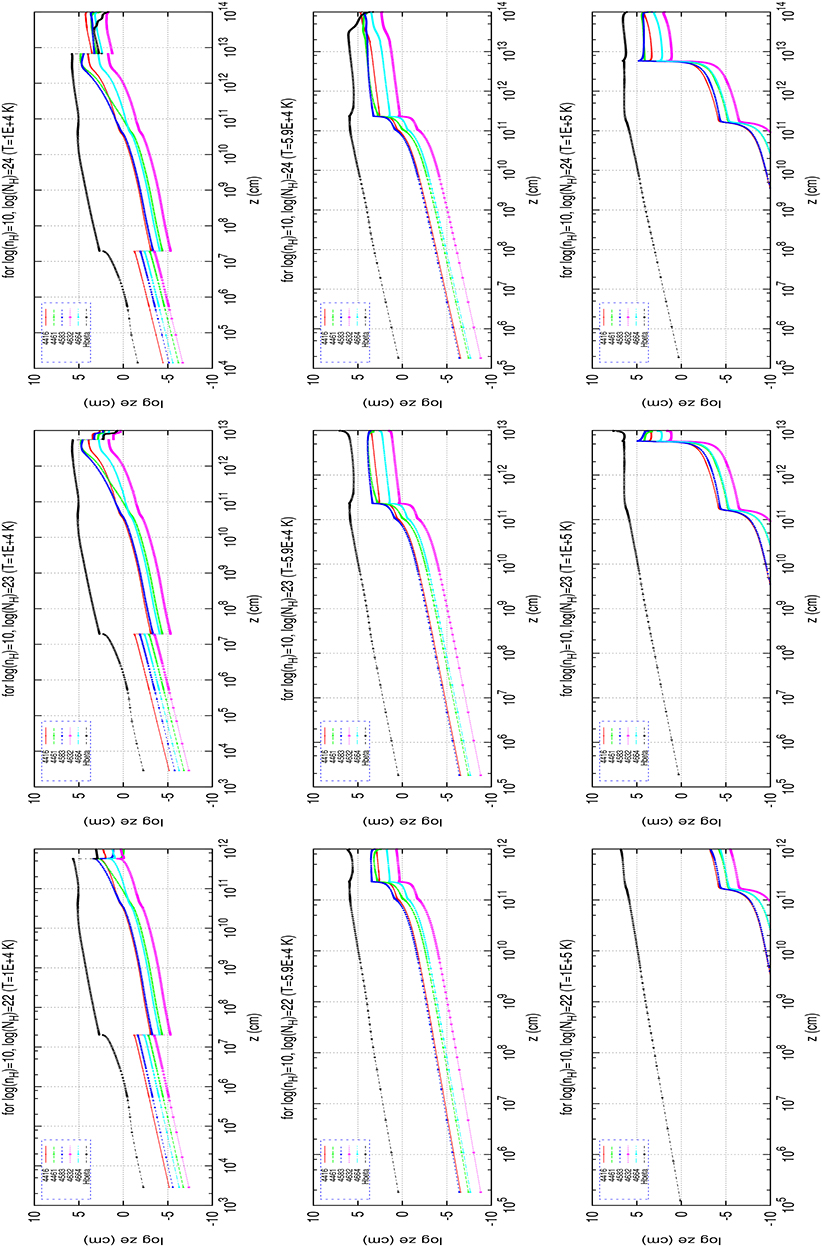
Figure 4. Emissivity profiles of Hβ and FeII: comparison at three different TBBB values and column densities. X-axis label, geometrical depth (in cm); Y-axis label, geometrical depth (z) × emissivity (e).
In general, the emissivity profile is much more shallow for Hβ while FeII emission is more concentrated toward the back of the cloud. Thus, an increase in NH brings the RFeII ratio up, but increasing irradiation pushes the Hβ and FeII emitting regions deeper into the cloud and RFeII drops (see Figures 3, 4). Our sequence of solutions for fixed bolometric luminosity and rising accretion disk temperature creates an increasing irradiation, and apparently the change of the SED shape cannot reverse the trend.
Therefore, the question is whether our hypothesis of the dominant role is incorrect or the set of computations is not satisfactory. To answer it we used two objects with well measured SED as well as RFeII: RE J1034+396 (Czerny et al., 2016) and an X-Shooter quasar composite from Selsing et al. (2016). In order to determine the parameter TBBB for those sources we created a set of full-GR disk models following the Novikov-Thorne prescription, we simulate an array of SED curves with LEdd parametrization where we consider simultaneous dependence on spin (0 ≤ a ≤ 0.998) and accretion rate (; where , ). The value of the black hole mass has been taken from Capellupo et al. (2016). The two values represent the extreme tails of the possible trend, with X-Shooter composite having the SED peak in UV and RE J1034+396 peaikng in soft X-rays. The corresponding points are shown in Figure 2. Observations show a rise in the value of RFeII with increase in TBBB which the simulations have been unable to reproduce so far. However, the rise in RFeII is not very large, from 0.3 to 0.5, despite huge change in the disk temperature difference implied by the observed SED in the two objects.
4. Future
The reason for starting the project from purely theoretical modeling of the line ratios is the fact that determinations of the black hole mass, accretion rate and the observational parameter RFeII available in the literature are not accurate enough to be used to test our hypothesis about the nature of the EVI (Sniegowska et al., 2017). The subsquent tasks will be to check the RFeII dependence on other parameters (see Sulentic et al., 2000; Mao et al., 2009; Marziani et al., 2015) which are used (Lbol, αuv, αox, nH, NH, cos(i), a and others). We intend to incorporate the microturbulence as suggested in Bruhweiler and Verner (2008). Better, more physical description of the SED may be needed, i.e model of a disk + corona with full GR and more complex geometry of the BLR using Czerny et al. (2011), Czerny and Hryniewicz (2011), and Czerny et al. (2015). We intend to implement the constant density LOC (Locally Optimized Cloud) model and subsequently the constant pressure model to repeat the tests and check for discrepancies with respect to the current model. Next stage to consider is the possibility of shielding of some BLR regions by the puffed inner disk (e.g., Wang et al., 2014), or to consider independent production regions of Hβ and FeII. Different studies have proposed that FeII is mainly produced in BLR (Bruhweiler and Verner, 2008; Shields et al., 2010) while many others have suggested that these emissions are mostly produced in the accretion disk (Martínez-Aldama et al., 2015 and references therein). Finally, we have to test our theory observationally for more sources with known SED peak position. To have an overview of the EV1, it is necessary to study it in other ranges of frequencies, including X-ray, radio, UV, and IR spectral ranges. Considerable progress along these line have been made by Sulentic et al. (2007a) and Sulentic et al. (2017) (UV range), Dultzin-Hacyan et al. (1999) (Figure 4), and Martínez-Aldama et al. (2015) (IR range).
Author Contributions
SP has tested the basic model and carried out the photoionisation simulations based on the idea and formalism proposed by BC. CW has provided computational assistance and helped solve the TBBB issue.
Funding
Part of this work was supported by Polish grant No. 2015/17/B/ST9/03436/.
Conflict of Interest Statement
The authors declare that the research was conducted in the absence of any commercial or financial relationships that could be construed as a potential conflict of interest.
Acknowledgments
The authors would like to acknoweledge the referees for their comments and suggestions to bring the paper to its current state. SP would like to acknowledge the organizing committee and the participants of the Quasars at all Cosmic Epochs conference held during 2nd Apr–7th Apr 2017 in Padova, Italy and, subsequently for providing the opportunity to present a talk on his research after being adjudged with the Best Poster award. SP would also like to extend his gratitude to the Center for Theoretical Physics and Nicolaus Copernicus Astronomical Center, Warsaw, the National Science Center (NSC) OPUS 9 grant for financing the project and Dr. Gary Ferland and Co. for the photoionisation code CLOUDY. SP would like to acknowledge the unending academic and personal support from Mr. Tek Prasad Adhikari. SP is also obliged to the Strong Gravity group at CAMK, Warsaw for engaging discussions resulting in this work.
References
Bentz, M. C., Denney, K. D., Grier, C. J., Barth, A. J., Peterson, B. M., Vestergaard, M., et al. (2013). The low-luminosity end of the radius-luminosity relationship for active galactic nuclei. Astrophys. J. 767:149. doi: 10.1088/0004-637X/767/2/149
Bonning, E. W., Cheng, L., Shields, G. A., Salviander, S., and Gebhardt, K. (2007). Accretion disk temperatures and continuum colors in QSOs. Astrophys. J. 659, 211–217. doi: 10.1086/510712
Boroson, T. A., and Green, R. F. (1992). The emission-line properties of low-redshift quasi-stellar objects. Astrophys. J. Suppl. Ser. 80, 109–135. doi: 10.1086/191661
Bruhweiler, F., and Verner, E. (2008). Modeling fe II emission and revised Fe II (UV) empirical templates for the seyfert 1 galaxy I Zw 1. Astrophys. J. 675, 83–95. doi: 10.1086/525557
Capellupo, D. M., Netzer, H., Lira, P., Trakhtenbrot, B., and Mejía-Restrepo, J. (2015). Active galactic nuclei at z 1.5 - I. Spectral energy distribution and accretion discs. Mon. Not. R. Astron. Soc. 446, 3427–3446. doi: 10.1093/mnras/stu2266
Capellupo, D. M., Netzer, H., Lira, P., Trakhtenbrot, B., and Mejía-Restrepo, J. (2016). Active galactic nuclei at z 1.5 - III. Accretion discs and black hole spin. Mon. Not. R. Astron. Soc. 460, 212–226. doi: 10.1093/mnras/stw937
Collin, S., Kawaguchi, T., Peterson, B. M., and Vestergaard, M. (2006). Systematic effects in measurement of black hole masses by emission-line reverberation of active galactic nuclei: eddington ratio and inclination. Astron. Astrophys. 456, 75–90. doi: 10.1051/0004-6361:20064878
Czerny, B., and Elvis, M. (1987). Constraints on quasar accretion disks from the optical/ultraviolet/soft X-ray big bump. Astrophys. J. 321, 305–320. doi: 10.1086/165630
Czerny, B., and Hryniewicz, K. (2011). The origin of the broad line region in active galactic nuclei. Astron. Astrophys. 525:L8. doi: 10.1051/0004-6361/201016025
Czerny, B., Hryniewicz, K., Nikołajuk, M., and Sa̧dowski, A. (2011). Constraints on the black hole spin in the quasar SDSS J094533.99+100950.1. Mon. Not. R. Astron. Soc. 415, 2942–2952. doi: 10.1111/j.1365-2966.2011.18912.x
Czerny, B., Modzelewska, J., Petrogalli, F., Pych, W., Adhikari, T. P., Życki, P. T., et al. (2015). The dust origin of the broad Line region and the model consequences for AGN unification scheme. Adv. Space Res. 55, 1806–1815. doi: 10.1016/j.asr.2015.01.004
Czerny, B., You, B., Kurcz, A., Średzińska, J., Hryniewicz, K., Nikołajuk, M., et al. (2016). The mass of the black hole in RE J1034+396. Astron. Astrophys. 594:A102. doi: 10.1051/0004-6361/201628103
Dultzin-Hacyan, D., Taniguchi, Y., and Uranga, L. (1999). “Where is the Ca II Triplet Emitting Region in AGN?” in Structure and Kinematics of Quasar Broad Line Regions, Vol. 175, eds C. M. Gaskell, W. N. Brandt, M. Dietrich, D. Dultzin-Hacyan, and M.Eracleous (Astronomical Society of the Pacific Conference Series), 303.
Fabian, A. C., Lohfink, A., Kara, E., Parker, M. L., Vasudevan, R., and Reynolds, C. S. (2015). Properties of AGN coronae in the NuSTAR era. Mon. Not. R. Astron. Soc. 451, 4375–4383. doi: 10.1093/mnras/stv1218
Ferland, G. J., Porter, R. L., van Hoof, P. A. M., Williams, R. J. R., Abel, N. P., Lykins, M. L., et al. (2013). The 2013 Release of Cloudy. Rev. Mex. Astron. Astrofis. 49, 137–163. Available online at: http://adsabs.harvard.edu/abs/2013RMxAA..49..137F
Frank, J., King, A., and Raine, D. J. (2002). Accretion Power in Astrophysics, 3rd Edn. Cambridge: Cambridge University Press
Haardt, F., and Maraschi, L. (1991). A two-phase model for the X-ray emission from Seyfert galaxies. Astrophys. J. 380, L51–L54. doi: 10.1086/186171
Kuraszkiewicz, J., Wilkes, B. J., Schmidt, G., Smith, P. S., Cutri, R., and Czerny, B. (2009). Principal component analysis of the spectral energy distribution and emission Line properties of Red 2MASS active galactic nuclei. Astrophys. J. 692, 1180–1189. doi: 10.1088/0004-637X/692/2/1180
Mao, Y.-F., Wang, J., and Wei, J.-Y. (2009). Extending the Eigenvector 1 space to the optical variability of quasars. Res. Astron. Astrophys. 9, 529–537. doi: 10.1088/1674-4527/9/5/004
Martínez-Aldama, M. L., Marziani, P., Dultzin, D., Sulentic, J. W., Bressan, A., Chen, Y., et al. (2015). Observations of the Ca ii IR triplet in high luminosity quasars: exploring the sample. J. Astrophys. Astron. 36, 457–465. doi: 10.1007/s12036-015-9354-9
Marziani, P., Sulentic, J. W., Negrete, C. A., Dultzin, D., Del Olmo, A., Martínez Carballo, M. A., et al. (2015). UV spectral diagnostics for low redshift quasars: estimating physical conditions and radius of the broad line region. Astrophys. Space Sci. 356, 339–346. doi: 10.1007/s10509-014-2136-z
Richards, G. T., Lacy, M., Storrie-Lombardi, L. J., Hall, P. B., Gallagher, S. C., Hines, D. C., et al. (2006). Spectral energy distributions and multiwavelength selection of Type 1 Quasars. Astrophys. J. Suppl. Ser. 166, 470–497. doi: 10.1086/506525
Różańska, A., Nikołajuk, M., Czerny, B., Dobrzycki, A., Hryniewicz, K., Bechtold, J., et al. (2014). Absorption features in the quasar HS 1603 + 3820 II. Distance to the absorber obtained from photoionisation modelling. New Astron. 28, 70–78. doi: 10.1016/j.newast.2013.08.009
Selsing, J., Fynbo, J. P. U., Christensen, L., and Krogager, J.-K. (2016). An X-Shooter composite of bright 1 < z < 2 quasars from UV to infrared. Astron. Astrophys. 585:A87. doi: 10.1051/0004-6361/201527096
Shakura, N. I., and Sunyaev, R. A. (1973). Black holes in binary systems. Observational appearance. Astron. Astrophys. 24, 337–355. doi: 10.1007/978-94-010-2585-0_13
Shen, Y., and Ho, L. C. (2014). The diversity of quasars unified by accretion and orientation. Nature 513, 210–213. doi: 10.1038/nature13712
Shields, G. A., Ludwig, R. R., and Salviander, S. (2010). Fe II emission in active galactic nuclei: the role of total and gas-phase iron abundance. Astrophys. J. 721, 1835–1842. doi: 10.1088/0004-637X/721/2/1835
Sniegowska, M., Czerny, B., You, B., Panda, S., Wang, J.-M., Hryniewicz, K., et al. (2017). The properties of active galaxies at the extreme of Eigenvector 1. ArXiv e-prints 1701.03694. Available online at: http://adsabs.harvard.edu/abs/2017arXiv170103694S
Sulentic, J. W., Bachev, R., Marziani, P., Negrete, C. A., and Dultzin, D. (2007a). C IV λ1549 as an Eigenvector 1 parameter for active galactic nuclei. Astrophys. J. 666, 757–777. doi: 10.1086/519916
Sulentic, J. W., Calvani, M., and Marziani, P. (2001). Eigenvector 1: an H-R diagram for AGN? Messenger 104, 25–28. Available online at: http://adsabs.harvard.edu/abs/2001Msngr.104…25S
Sulentic, J. W., del Olmo, A., Marziani, P., Martínez-Carballo, M. A., D'Onofrio, M., Dultzin, D., et al. (2017). What does C IV λ1549 tell us about the physical driver of the eigenvector quasar sequence? ArXiv e-prints 1708.03187. Available online at: http://adsabs.harvard.edu/abs/2017arXiv170803187S
Sulentic, J. W., Dultzin-Hacyan, D., and Marziani, P. (2007b). “Eigenvector 1: Towards AGN Spectroscopic Unification,” in Revista Mexicana de Astronomia y Astrofisica Conference Series, Vol. 28, Revista Mexicana de Astronomia y Astrofisica, Vol. 27, ed S. Kurtz (Mexico City), 83–88.
Sulentic, J. W., Marziani, P., Zamanov, R., Bachev, R., Calvani, M., and Dultzin-Hacyan, D. (2002). Average Quasar Spectra in the Context of Eigenvector 1. Astrophys. J. Lett. 566, L71–L75. doi: 10.1086/339594
Sulentic, J. W., Zwitter, T., Marziani, P., and Dultzin-Hacyan, D. (2000). Eigenvector 1: an optimal correlation space for active galactic nuclei. Astrophys. J. Lett. 536, L5–L9. doi: 10.1086/312717
Sun, J., and Shen, Y. (2015). Dissecting the quasar main sequence: insight from host galaxy properties. Astrophys. J. Lett. 804:L15. doi: 10.1088/2041-8205/804/1/L15
Wang, J.-M., Qiu, J., Du, P., and Ho, L. C. (2014). Self-shadowing effects of slim accretion disks in active galactic nuclei: the diverse appearance of the broad-line region. Astrophys. J. 797:65. doi: 10.1088/0004-637X/797/1/65
Keywords: quasars, broad line region, Eigenvector 1, FeII strength, accretion disk temperature, constant density, photoionisation, CLOUDY
Citation: Panda S, Czerny B and Wildy C (2017) The Physical Driver of the Optical Eigenvector 1 in Quasar Main Sequence. Front. Astron. Space Sci. 4:33. doi: 10.3389/fspas.2017.00033
Received: 25 August 2017; Accepted: 20 October 2017;
Published: 07 November 2017.
Edited by:
Paola Marziani, Osservatorio Astronomico di Padova (INAF), ItalyReviewed by:
Alenka Negrete, Universidad Nacional Autónoma de México, MexicoMilan S. Dimitrijevic, Astronomical Observatory, Serbia
Tomaz Zwitter, University of Ljubljana, Slovenia
Copyright © 2017 Panda, Czerny and Wildy. This is an open-access article distributed under the terms of the Creative Commons Attribution License (CC BY). The use, distribution or reproduction in other forums is permitted, provided the original author(s) or licensor are credited and that the original publication in this journal is cited, in accordance with accepted academic practice. No use, distribution or reproduction is permitted which does not comply with these terms.
*Correspondence: Swayamtrupta Panda, panda@cft.edu.pl