Gradual Pre-eruptive Phase of Solar Coronal Eruptions
 Bojan Vršnak
- Hvar Observatory, Faculty of Geodesy, University of Zagreb, Zagreb, Croatia
Physical background of the evolution of a coronal magnetic flux rope embedded in the magnetic arcade during the gradual-rise pre-eruptive stage is studied. It is assumed that this stage represents an externally-driven evolution of the pre-eruptive structure through a series of quasi-equilibrium states, until a point when the system losses equilibrium and erupts due to unbalanced internal forces. In particular, three driving processes are considered: twisting motions of the flux-rope footpoints, emergence of new magnetic flux beneath the flux rope, and the mass leakage down the flux-rope legs. For that purpose, an analytical flux-rope model is employed, to inspect how fast the equilibrium height of the structure rises due to the increase of the poloidal-to-axial field ratio, the increase of axial electric current, and the decrease of mass. It is shown that the flux-rope twisting itself is not sufficient to reproduce the rising speeds observed during the pre-eruptive stage. Yet, it is essential for the loss-of-equilibrium process. On the other hand, the considered emerging flux and the mass loss processes reproduce well the rate at which the pre-eruptive structure rises before the main acceleration stage of the eruption sets in.
1. Introduction
There is a general consensus that solar eruptions, which lead to coronal mass ejections (CMEs) and are frequently associated with solar flares, are a consequence of instability of coronal structures, most often considered to be coronal magnetic arcades embedding a helically twisted magnetic flux rope (for a review see, e.g., Schmieder et al., 2015; Green et al., 2018). Basically, there are three different scenarios that can explain the presence of the flux rope within the eruptive structure: (i) an already-formed flux rope emerged from the subphotospheric layers; (ii) rope is formed gradually by a series of reconnections within a sheared arcade; (iii) it forms during the eruption itself (e.g., Green et al., 2018, and references therein). In this paper a situation where the flux rope exists already prior to the eruption (i.e., the mentioned first two options) will be studied to get an insight into physical background of the evolution of the pre-eruptive arcade/flux-rope structure.
Most of eruptions show three basically different stages: a gradual pre-eruptive stage, main acceleration stage, and the propagation stage (e.g., Vršnak, 2001; Zhang et al., 2001, 2004; Chen, 2011; Mierla et al., 2013; D'Huys et al., 2017). The pre-eruptive stage, which is the main objective of this paper, most briefly can be described as externally-forced evolution of the pre-eruptive system through a series of equilibrium states until a stage when the system comes to the point when no equilibrium of forces is possible anymore (e.g., Priest, 1982; Vršnak, 1990; Green et al., 2018, and references therein). After that the system finds itself in an instability regime, dynamically erupting in trying to find a new equilibrium state. Such type of evolution is usually denoted as loss-of-equilibrium scenario. A critical height where the system losses equilibrium and starts rapidly accelerating is usually comparable with the flux-rope footpoint half-separation(for the observatins see, e.g., Vršnak, 1990; Chen et al., 2006, for the theoretical aspect see, e.g., Vršnak 1990; Chen and Krall 2003; Chen et al. 2006).
From the observational point of view, the pre-eruptive stage, often called also a gradual-rise phase, is characterized by a number of different signatures. Frequently, the new magnetic flux emergence, shearing/twisting motions, and flux cancelation are observed (e.g., Schmieder et al., 2015; Green et al., 2018, and references therein). At the same time the pre-eruptive structure slowly rises at a low almost-constant velocity, and shows signatures of swelling (e.g., Tandberg-Hanssen, 1974; Vršnak et al., 1993; Maričić et al., 2004; Veronig et al., 2018), appearance of helical structures within the prominence (e.g., Tandberg-Hanssen, 1974; Sakurai, 1976; Vršnak et al., 1988, 1991, 1993; Rompolt, 1990; Romano et al., 2003; Ali et al., 2007), and mass-draining down the footpoints (e.g., Tandberg-Hanssen, 1974; Rust et al., 1975; Vršnak et al., 1987, 1993).
In this paper we analyze the influence of these processes on the evolution of the pre-eruptive system, focusing on the effects of the flux rope twisting, electric current increase, and the mass loss. The following analysis of these effects is based on the analytical semi-toroidal flux-rope model employed by Vršnak (2008), Vršnak (2016), and Green et al. (2018), where mainly a quantitative analysis of the acceleration stage of eruptions was considered. In contrast, this paper is focused on a quantitative study of characteristics of the pre-acceleration stage.
2. Kinematics of the Gradual-Rise Phase
In Figure 1 the kinematics of a limb CME that erupted on May 15, 2001 is presented (for details see, Maričić et al., 2004), to illustrate a typical example of the height–time evolution of the eruption (see, e.g., Tandberg-Hanssen, 1974, and references therein). The height–time measurements of the frontal rim, the top of the cavity, and the top of the embedded prominence are displayed in Figure 1A, whereas the corresponding velocity–time graph is shown in Figure 1B. In both graphs the gradual-rise phase and the impulsive acceleration stage are indicated.
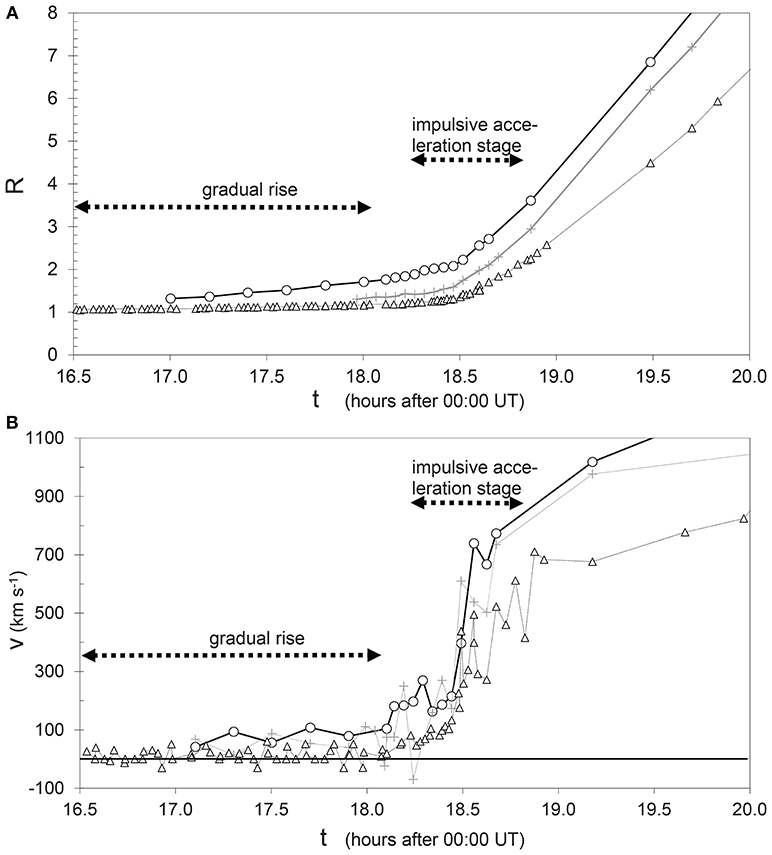
Figure 1. Kinematics of the eruption of May 15, 2001: (A) height–time; (B) velocity–time. The heliocentric distance R is expressed in units of solar radius. Measurements of the frontal rim, top of the cavity, and top of the embedded prominence are shown by circles, crosses, and triangles, respectively. The gradual-rise phase and the impulsive acceleration stage are indicated by horizontal dashed arrows.
In Figure 2 the gradual-rise phase of the prominence is shown enlarged. The measured velocity slowly increases from 5 to 15 km s−1, within Δt ~ 2 h, which corresponds to a very weak acceleration on the order of ~ 1 m s−2. In the following, effects of the flux-rope twisting, external flux emergence, and mass loss will be considered, to find out if these processes can explain the described flux-rope behavior.
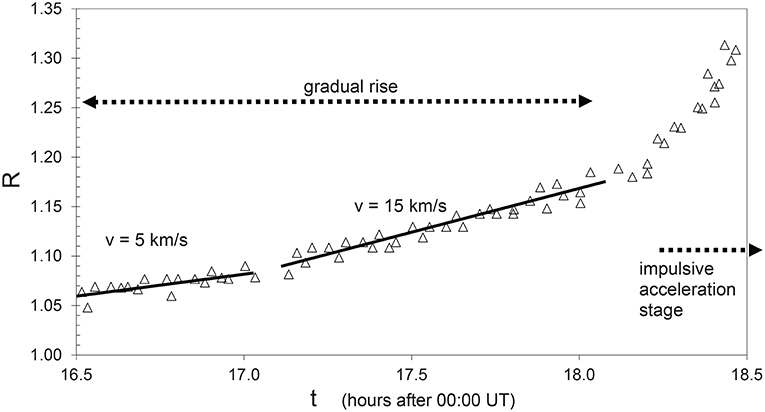
Figure 2. Detailed kinematics of the gradual-rise phase of the eruptive prominence shown in Figure 1A.
3. Flux-Rope Model
For the previously mentioned purpose, let us apply the semi-toroidal flux-rope model (Figure 3) proposed by Vršnak (1990) and elaborated by Vršnak (2008), Vršnak (2016), and Green et al. (2018), to study the effects of the increase of the flux-rope twist, the increase of the flux-rope electric current, and the mass leakage through the flux-rope legs (the former two processes are illustrated schematically in Figure 4). A simplified equation of motion, relevant for the processes which are essential for comprehending processes that govern the gradual-rise phase, can be expressed in the form that defines the force per unit mass (i.e., acceleration):
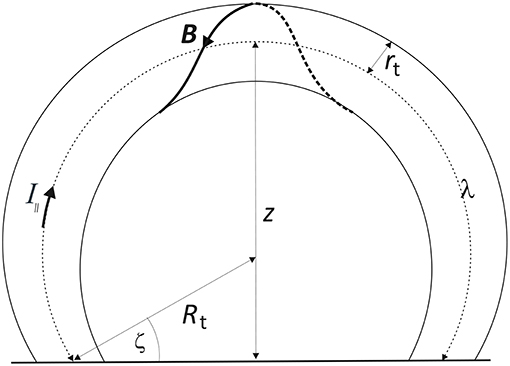
Figure 3. Schematic presentation of a semi-toroidal flux-rope geometry. For details see the main text.
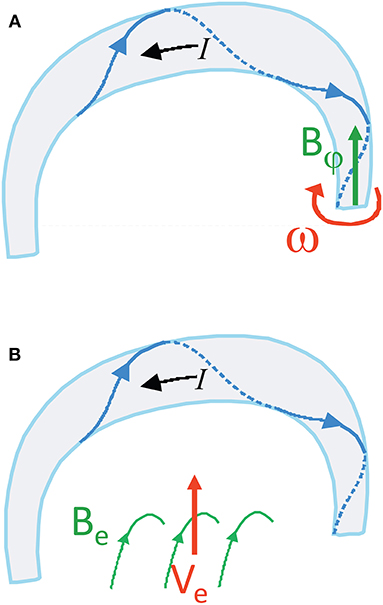
Figure 4. Schematic presentation of: (A) poloidal flux injection (depicted by green arrow) into the rope, caused by twisting motion at the footpoint (red arrow); (B) emerging flux effect. For details see the main text.
where Λ, Rt, and Z are the length of the flux rope axis, major radius of the torus, and the height of its summit, all normalized with respect to the footpoint half-separation d [Λ = λ/d, , Z = z/d; for symbols see Figure 3; see also (Vršnak, 2008; Green et al., 2018)], whereas X represents the ratio of the poloidal and axial flux-rope field X ≡ Bφ/B∥ at the flux-rope surface. The first two terms in brackets on the right-hand side of Equation (1) represent the so called “hoop force” (Chen, 1989), whereas the third term is due to the diamagnetic effect (Kuperus and Raadu, 1974). The last term represents the Lorentz force related to the background arcade magnetic field.
The expressions for the parameter CL and Cc read:
respectively. Here, I∥ and M represent the axial electric current and total mass within the flux rope, respectively, Bc is the background arcade field and μ0 stands for the permeability.
Note that a, CL, and Cc are expressed in m s−2, and that in Equation (1) the drag force and gravity are neglected. Details of derivation of Equation (1) can be found in Vršnak (2008) and Green et al. (2018).
The geometrical quantities Λ, Rt, and Z are mutually related, i.e., Λ ≡ Λ(Z) and Rt ≡ Rt(Z). Taking approximately that the flux-rope axis remains a part of the circle with fixed footpoint separation 2d, and inspecting Figure 3, where the angle ζ is introduced, one finds simple parametric relationships: Rt = 1/cosζ, Z = (1 + sinζ)/cosζ, and Λ = (π + 2ζ)/cosζ. Thus, at given values of CL and X, Equation (1) in fact defines a as a function of Z, a ≡ aCL, X(Z). For low values of X and CL, the structure is stable (da/dZ < 0) and has only one equilibrium height Zs, where aCL, X(Zs) = 0 (e.g., black curve in Figure 5A). As X or CL increase, the equilibrium height rises and the shape of a(Z) transforms, which is illustrated in Figure 5. To distinguish what are the effects of increasing X and CL, the graphs a(Z) are shown separately for the case when the evolution of the system is driven by increasing X, and analogously, by increasing CL. The former option is presented in Figures 5A,B, where the graph in Figure 5B shows an enlarged part of Figure 5A around the stable-equilibrium. Analogous graphs are displayed in Figures 5C,D for the effect of increasing CL, where the increase of CL can be either due to the increasing current I∥ or decreasing mass M [see Equation (2)]. In Figure 5D, the stable-equilibrium heights are explicitly denoted as Z1 – Z4, and the height at which the system looses equilibrium as Z* (red curve). In the insets of Figures 5B,D the change of the stable-equilibrium height Zs(X) and Zs(CL) is presented, respectively, all the way to the state when the system looses equilibrium (marked by a square symbol).
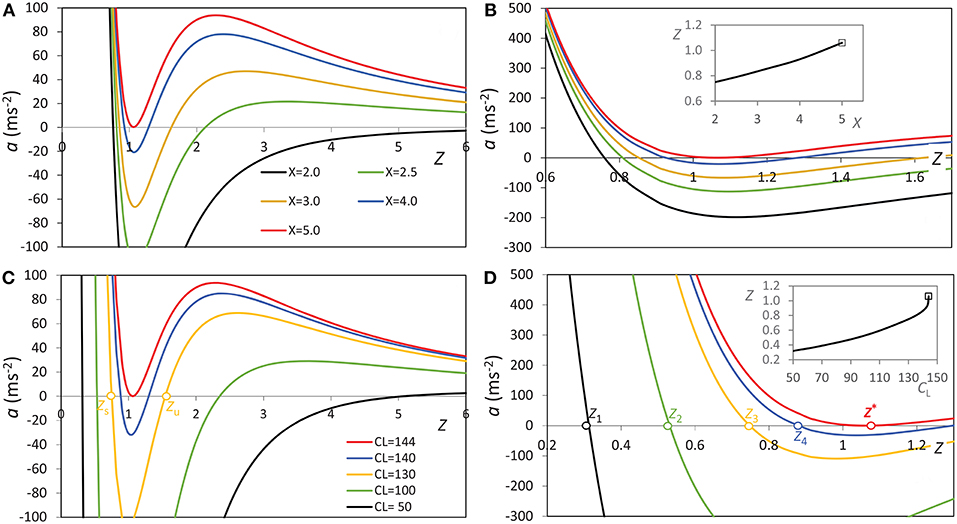
Figure 5. Equation of motion results shown in the form a(Z) dependencies: (A) a(Z) curves for different values of X, combined with CL = 144 m s−2; (B) a part of (A) enlarged, focusing on the equilibrium heights; (C) a(Z) curves for different values of CL, combined with X = 5; (D) a part of (C) enlarged, focusing on the equilibrium heights. In (C) a pair of stable- and unstable-equilibrium heights on the yellow a(Z) curve is denoted by Zs and Zu, respectively. In all graphs a fixed value m s−2 is used [see Equation (3)]. In (D) the stable-equilibrium heights Zs are marked as Z1, Z2, Z3, and Z4, whereas the height at which the flux rope losses equilibrium is denoted as Z* (the red a(Z) curve). Insets in (B,D) show the increase of stable-equilibrium height as a function of X and CL, respectively.
Inspecting Figure 5, one finds that by increasing CL and/or X, first the a(Z) curve evolves into a shape where another equilibrium point occurs Zu. However, this one is unstable (green, yellow, and blue curves in Figures 5A,C), since da/dZ > 0. Thus, in this stage the structure is metastable, since if pushed from a stable equilibrium height Zs to a height above the unstable-equilibrium height Zu, it will erupt, because beyond this height the acceleration becomes a(Z) > 0 for any Z > Zu.
In other words, Figure 5 shows that the increase of CL or X implies rising of Zs, and in the following this will be considered as a cause of the gradual rise of the pre-eruptive structure. Furthermore, one finds out that the unstable equilibrium height Zu descends, so the distance between Zs and Zu decreases, implying that the structure becomes more and more unstable, since weaker and weaker push is required to move the structure from the stable to the unstable equilibrium point. Eventually, at a given critical combination of CL and X, the stable and unstable heights merge, Zu = Zs, meaning that there is no equilibrium existing any more, i.e., equilibrium state is lost and the structure erupts (a(Z) > 0 for any Z; see red curve in Figures 5A–D).
In the following, Equation (1) will be employed to inspect the effects of the increasing CL and X, as generally illustrated in Figure 5, by specifically considering the two processes depicted in Figure 4. These are twisting motions at the flux-rope footpoints (e.g., Török et al., 2013, and references therein) and emerging-flux process (e.g., Schmieder et al., 2015, and references therein). The former process leads to the increase of X, whereas the latter one directly induces an increase of the current I∥, i.e., increases the value of the parameter CL. It should be noted that the change of X causes also a change of I∥, whereas the change of I∥ causes also the change of X, i.e., the behaviors of X and CL are tightly physically related. Finally, note that from the point of view of Equation (1), the mass loss related to the material draining down the prominence legs is equivalent to the increase of axial electric current I∥ related to emerging flux and/or twisting processes, since the mass loss also increases the value of CL [see Equation (2)].
4. Results
4.1. Poloidal Flux Injection
In Figure 6 the effect of increasing poloidal flux caused by twisting motion at one of the flux-rope footpoints is illustrated for two initial CL values, 145 and 150 m s−2, respectively, combined with two values of the normalized flux-rope initial minor radius, r/d = 0.1 and 0.2, where in all combinations the flux-rope footpoint half-separation is taken as d = 50 Mm and the axial field as B∥ = 100 G. The presented cases correspond to the longitudinal magnetic flux of Mx (red curve) and Mx (gray and blue curve), as listed in 7th column of Table 1.
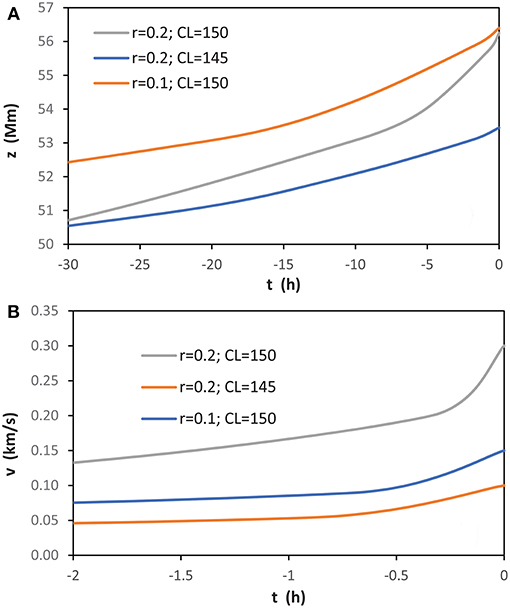
Figure 6. Evolution of the flux rope caused by the poloidal flux injection, until the moment of the loss of equilibrium (t = 0): (A) height–time; (B) velocity–time. The blue curve represents the case where the initial value of X is 3.5, whereas red and gray curves represent the case when it is 4.5. To better resolve the evolution of the rising speed, in the lower panel only a segment of 2 h before the eruption is presented.
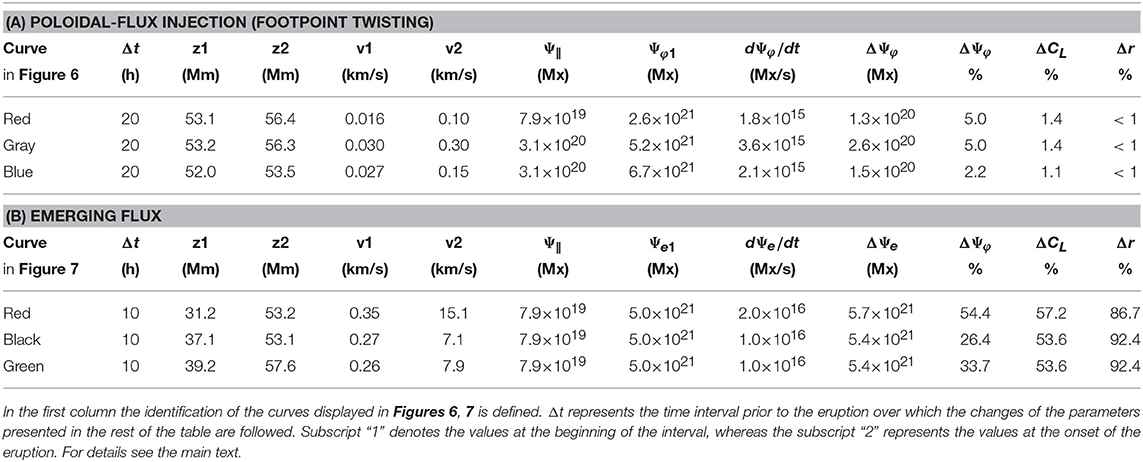
Table 1. Comparison of the footpoint-twisting process and the emerging-flux process.
Note that the values of the parameter CL and r/d are not kept fixed, but they evolve due to change of the poloidal flux. The evolution of CL is followed by taking into account that the poloidal flux and the axial current scale as Ψφ∝Bφrλ and I∥∝Bφr, respectively, where Bφ is the poloidal field at the flux-rope boundary. From this one finds Ψφ∝I∥λ, i.e., I∥∝Ψφ/λ∝Ψφ/Λ. Substitution of this relation to Equations (2, 3) defines the evolution of CL. Setting a = 0 in Equation (1) and taking into account the expressions for CL(Ψφ, Λ) and CL(Ψφ, Λ), Equation (1) becomes an implicit relation that defines the equilibrium value of the angle ζ as a function of prescribed values of X, i.e., Ψφ. The solution of this equation, giving the equilibrium ζ, then provides also the equilibrium values of Rt, z, and λ, as well as the equilibrium value of I∥. In a similar manner, the evolution of the torus minor radius r can be traced. From the poloidal-to-axial flux ratio one finds r∝XλΨ∥/Ψφ. Since the rotational motions at the footpoints do not affect Ψ∥ and thus it stays constant, the value of r scales as r∝Xλ/Ψφ, where the evolution of X and Ψφ is prescribed as the input.
For the twisting motion, i.e., rotational motion at one of footpoints (illustrated in Figure 4A), a typical value of ω = 100 deg/day (e.g., Török et al., 2013, and references therein) is applied to the flux rope characterized by the initial value X1 = 3.5 (blue curve in Figure 6) and 4.5 (red and gray curves in Figure 6). The twisting motion increases the polidal flux, and consequently changes the value of X. The change of the parameter X can be expressed as dX/dt = ωr/λ, where λ represents the length of the flux-rope axis. Since the poloidal and axial flux are related as Ψφ = Ψ∥λX/2rπ, the rate at which the poloidal flux increases, dΨφ/dt can be calculated (the corresponding values are shown in Column 9 of Table 1A). Other relevant informations related to the graphs displayed in Figure 6 are presented in the upper part of Table 1, where the first column identifies the curves in Figure 6. The duration of the pre-eruption interval, Δt over which the changes are followed is shown in Column 2. The height and speed of the flux-rope axis at the beginning of the interval (z1 and v1) are presented in Columns 3 an 5, respectively, whereas the height and speed at the onset of the eruption (z2 and v2) are given in Columns 4 and 6, respectively. The values of the axial and the initial poloidal flux are presented in the Columns 7 and 8. The rate by which the poloidal flux is changing due to the twisting motion at the flux-rope footpoint is displayed in Column 9, its total change over the interval Δt is presented in Column 10, and the relative change, expressed in percentages, is given in Column 11. The last two columns show the corresponding relative change of the parameter CL and the flux-rope minor radius r, both presented in percentages.
The graph of the gradual-rise velocity presented in Figure 6B shows that the twisting motion itself cannot explain the characteristics of the gradual-rise pre-eruptive phase, since the obtained velocities are for at least an order of magnitude too low. Yet, note that the increase of X is important in reaching the critical loss-of-equilibrium state (see Figures 5A,B).
4.2. Increase of CL (Emerging Flux Process or Mass Loss)
In Figure 7 the evolution caused by increasing value of CL, which can either be due to the increasing electric current in the flux rope, or the mass draining down the flux-rope legs, is illustrated. Particulary, in the following the increase of current is attributed to the emerging flux along the magnetic inversion line beneath the flux rope (Figure 4B). The change of the magnetic flux Ψe encircled by the flux-rope current channel causes the increase of the flux-rope current, due to the relation dΨe/dt = μ0dI∥/dt (see e.g., Batygin and Toptygin, 1962; Jackson, 1998), implying also the change of I, i.e., CL. Note that the change of I leads also to change of Ψφ, X, and r, which can be followed employing a procedure analogous to that presented in section 4.1 for the evolution of I and r, where the change of Ψφ was used as the input.
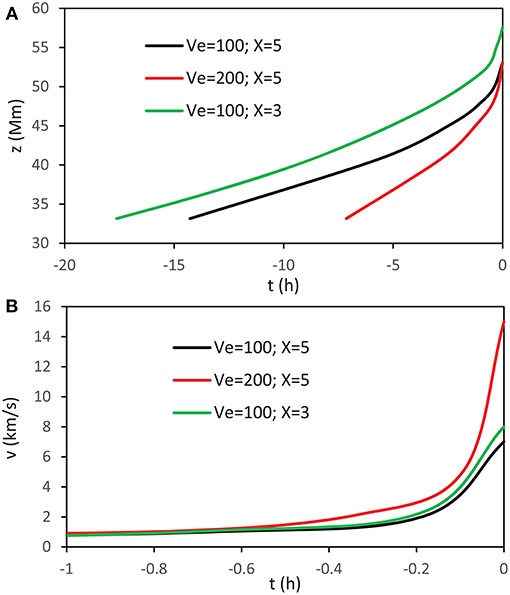
Figure 7. Evolution of the flux rope caused by emerging flux, until the moment of the loss of equilibrium (t = 0): (A) height–time; (B) velocity–time. The black and red curves are calculated for the initial CL1 = 11 m s−2, whereas green curve represents CL1 = 12 m s−2. To better resolve the evolution of the rising speed, in the lower panel only the 1-h interval before the eruption is presented.
Let us consider a situation where the magnetic field of Be = 100 G emerges (see the sketch in Figure 4B) at the speed of Ve = 100 m s−1 (black and green curves in Figure 7) and Ve = 200 m s−1 (red curve in Figure 7), which implies that the external unit-length magnetic flux increases at the rate dΨe/dt= BeVe = 1 and 2 × 10⁶ Mx s−1 cm−1, respectively. Assuming that the flux emerges over the distance of 2d = 100 Mm, one finds that the rate at which the magnetic flux encircled by the flux-rope, Ψe, increases as listed in Column 9 of Table 1B (dΨe/dt). The total increase of Ψe over the time of Δt = 10 h is shown in Cloumn 10. Taking for the initial flux encircled by the flux rope the value of Mx cm−1 (Column 8 in Table 1B), and the initial value CL1 = 11 m s−2 (black and red curves in Figure 7) and 12 m s−2 (green curve in Figure 7), one gets the relative change of Ψφ, CL, and r, as displayed in the last three columns of Table 1B (all expressed in percentages).
Figure 7B shows that at the stage when the system approaches the loss-of-equilibrium point, the rise caused by increasing CL results in rise-velocities on the order of 10 km s−1, which is compatible with observations (Figure 2). Comparing Figure 7B with Figure 6B one finds that the rise related to the emerging flux process is more than an order of magnitude faster than that related to the poloidal flux injection.
5. Discussion and Conclusion
In the presented analysis three processes relevant for the evolution of the pre-eruptive structure during the gradual-rise phase are considered. In particular, we focused on the height–time and velocity–time evolution, to compare it with typical behavior usually observed during the gradual-rise stage.
The first process is twisting motion at the flux-rope footpoint, which leads to the increase of the flux-rope twist, indirectly enhancing also the axial electric current and minor radius of the flux rope at its summit, causing the rise of the pre-eruptive structure. All of these signatures drive the pre-eruptive system toward a point where the structure losses its equilibrium and erupts. However, the considered twisting process is not effective enough to cause a sufficiently fast rise of the pre-eruptive structure, i.e., its rise is for at least an order of magnitude slower than observed. Note that the three examples presented in Figure 6 cover typical values coming from observations, and even increasing the parameter-values related the poloidal flux injection (including much too-high values) could not result in sufficiently high pre-eruptive rising speeds.
The second process is related to the emergence of a new magnetic flux beneath the flux rope. This causes an increase of the magnetic flux encircled by the flux rope, which induces an increase of the electric current flowing along the rope. The increase of the current causes also the increase of the flux-rope twist and its minor radius. The analysis has demonstrated that this process results in the rise of the pre-eruptive structure that is faster than in the case of twisting for almost two orders of magnitude, and is compatible with observations. This process is more effective than the footpoint twisting, since the emerging flux occurs on the spatial scale comparable with the flux-rope length, whereas the footpoint twisting is restricted to the footpoint radius, and that is generally an order of magnitude smaller than the flux-rope length. This results in an order of magnitude larger change of poloidal flux caused by the emerging flux (see Table 1). Note also that the processes like flux cancellation and other various forms of reconnection beneath the flux rope, as well as the converging motions of the arcade footpoints, can result in the same effects as described emerging flux process.
The third process, the mass leakage down the flux-rope legs, results in the pre-eruptive rise similar to that caused by the emerging flux process, except that the mass loss does not cause the increase of the flux-rope twist. Although the draining of the cold plasma from the embedded prominence is most prominent during the acceleration stage of the eruption, it is frequently observed already during the gradual-rise phase. This is caused by stretching of the flux rope as it rises, which makes the magnetic dips containing dense prominence plasma successively shallower, i.e., certain fraction of the prominence material is no longer supported against the gravity. Thus, the rise of the pre-eruptive structure caused by emerging flux is likely to be additionally enhanced by the mass-loss effect, making the pre-eruptive rise even faster than shown in Figure 7.
To conclude, the enhancement of the flux-rope electric current, the increase of the twist, and the mass loss, are tightly related phenomena, expected to occur during the gradual pre-eruptive phase of an eruption. Combination of these three processes is sufficiently effective to explain the nature of the gradual rise of the pre-eruptive structure and its evolution to the loss-of-equilibrium point.
Author Contributions
The author confirms being the sole contributor of this work and has approved it for publication.
Funding
This work has been fully supported by Croatian Science Foundation under the project no. 7549 Millimeter and submillimeter observations of the solar chromosphere with ALMA (MSOC).
Conflict of Interest Statement
The author declares that the research was conducted in the absence of any commercial or financial relationships that could be construed as a potential conflict of interest.
References
Ali, S. S., Uddin, W., Chandra, R., Mary, D. L., and Vršnak, B. (2007). Helical eruptive prominence associated with a pair of overlapping CMEs on 21 April 2001. Sol. Phys. 240, 89–105. doi: 10.1007/s11207-006-0203-5
Batygin, V. V., and Toptygin, I. N. (1962). Problems in Electrodynamics. New York, NY: Academic Press.
Chen, J. (1989). Effects of toroidal forces in current loops embedded in a background plasma. Astrophys. J. 338, 453–470. doi: 10.1086/167211
Chen, J., and Krall, J. (2003). Acceleration of coronal mass ejections. J. Geophys. Res. 108:1410. doi: 10.1029/2003JA009849
Chen, J., Marqué, C., Vourlidas, A., Krall, J., and Schuck, P. W. (2006). The flux-rope scaling of the acceleration of coronal mass ejections and eruptive prominences. Astrophys. J. 649, 452–463. doi: 10.1086/506466
Chen, P. F. (2011). Coronal mass ejections: models and their observational basis. Liv. Rev. Sol. Phys. 8:1. doi: 10.12942/lrsp-2011-1
D'Huys, E., Seaton, D. B., De Groof, A., Berghmans, D., and Poedts, S. (2017). Solar signatures and eruption mechanism of the August 14, 2010 coronal mass ejection (CME). J. Space Weather Space Clim. 7:A7. doi: 10.1051/swsc/2017006
Green, L. M., Török, T., Vršnak, B., Manchester, W., and Veronig, A. (2018). The origin, early evolution and predictability of solar eruptions. Space Sci. Rev. 214:46. doi: 10.1007/s11214-017-0462-5
Kuperus, M., and Raadu, M. A. (1974). The support of prominences formed in neutral sheets. Astron. Astrophys. 31:189.
Maričić, D., Vršnak, B., Stanger, A. L., and Veronig, A. (2004). Coronal mass ejection of 15 May 2001: I. Evolution of morphological features of the eruption. Sol. Phys. 225, 337–353. doi: 10.1007/s11207-004-3748-1
Mierla, M., Seaton, D. B., Berghmans, D., Chifu, I., De Groof, A., Inhester, B., et al. (2013). Study of a prominence eruption using PROBA2/SWAP and STEREO/EUVI data. Sol. Phys. 286, 241–253. doi: 10.1007/s11207-012-9965-0
Priest, E. R. (1982). Solar Magneto-Hydrodynamics. Dordrecht; Boston, MA: D. Reidel Pub. Co. ; Hingham.
Romano, P., Contarino, L., and Zuccarello, F. (2003). Eruption of a helically twisted prominence. Sol. Phys. 214, 313–323. doi: 10.1023/A:1024257603143
Rust, D. M., Nakagawa, Y., and Neupert, W. M. (1975). EUV emission, filament activation and magnetic fields in a slow-rise flare. Sol. Phys. 41, 397–414.
Sakurai, T. (1976). Magnetohydrodynamic interpretation of the motion of prominences. Publ. ASJ. 28, 177–198.
Schmieder, B., Aulanier, G., and Vršnak, B. (2015). Flare-CME models: an observational perspective (invited review). Sol. Phys. 290, 3457–3486. doi: 10.1007/s11207-015-0712-1
Török, T., Temmer, M., Valori, G., Veronig, A. M., van Driel-Gesztelyi, L., and Vršnak, B. (2013). Initiation of coronal mass ejections by sunspot rotation. Sol. Phys. 286, 453–477. doi: 10.1007/s11207-013-0269-9
Veronig, A. M., Podladchikova, T., Dissauer, K., Temmer, M., Seaton, D. B., Long, D., et al. (2018). Genesis and impulsive evolution of the 2017 September 10 coronal mass ejection. Astrophys. J. 868:107. doi: 10.3847/1538-4357/aaeac5
Vršnak, B. (2001). Dynamics of solar coronal eruptions. J. Geophys. Res. 106, 25249–25260. doi: 10.1029/2000JA004007
Vršnak, B. (2008). Processes and mechanisms governing the initiation and propagation of CMEs. Ann. Geophys. 26, 3089–3101. doi: 10.5194/angeo-26-3089-2008
Vršnak, B. (2016). Solar eruptions: the CME-flare relationship. Astron. Nachr. 337:1002. doi: 10.1002/asna.201612424
Vršnak, B., Ruzdjak, V., Brajsa, R., and Dzubur, A. (1988). Structure and stability of prominences with helical structure. Sol. Phys. 116, 45–60.
Vršnak, B., Ruždjak, V., Messerotti, M., Mouradian, Z., and Urbarz, H. (1987). Reconnection driven by an erupting filament in the May 14, 1981 flare. Sol. Phys. 114, 289–310.
Vršnak, B., Ruzdjak, V., and Rompolt, B. (1991). Stability of prominences exposing helical-like patterns. Sol. Phys. 136, 151–167.
Vršnak, B., Ruzdjak, V., Rompolt, B., Rosa, D., and Zlobec, P. (1993). Kinematics and evolution of twist in the eruptive prominence of August 18, 1980. Sol. Phys. 146, 147–162.
Zhang, J., Dere, K. P., Howard, R. A., Kundu, M. R., and White, S. M. (2001). On the temporal relationship between coronal mass ejections and flares. Astrophys. J. 559, 452–462. doi: 10.1086/322405
Keywords: sun, coronal mass ejections (CMEs), magnetohydrodynamics (MHD), MHD instabilities, twisted magnetic structures
Citation: Vršnak B (2019) Gradual Pre-eruptive Phase of Solar Coronal Eruptions. Front. Astron. Space Sci. 6:28. doi: 10.3389/fspas.2019.00028
Received: 24 January 2019; Accepted: 01 April 2019;
Published: 18 April 2019.
Edited by:
Rui Liu, University of Science and Technology of China, ChinaReviewed by:
Yuhong Fan, University Corporation for Atmospheric Research (UCAR), United StatesMarilena Mierla, Royal Observatory of Belgium, Belgium
Copyright © 2019 Vršnak. This is an open-access article distributed under the terms of the Creative Commons Attribution License (CC BY). The use, distribution or reproduction in other forums is permitted, provided the original author(s) and the copyright owner(s) are credited and that the original publication in this journal is cited, in accordance with accepted academic practice. No use, distribution or reproduction is permitted which does not comply with these terms.
*Correspondence: Bojan Vršnak, bvrsnak@geof.hr