1
The John B Pierce Laboratory, New Haven, CT, USA
2
Department of Psychiatry, Yale University School of Medicine, New Haven, CT, USA
3
Department of Internal Medicine, Yale University School of Medicine, New Haven, CT, USA
Brain glucosensing is essential for normal body glucose homeostasis and neuronal function. However, the exact signaling mechanisms involved in the neuronal sensing of extracellular glucose levels remain poorly understood. Of particular interest is the identification of candidate membrane molecular sensors that would allow neurons to change firing rates independently of intracellular glucose metabolism. Here we describe for the first time the expression of the taste receptor genes Tas1r1, Tas1r2 and Tas1r3, and their associated G-protein genes, in the mammalian brain. Neuronal expression of taste genes was detected in different nutrient-sensing forebrain regions, including the paraventricular and arcuate nuclei of the hypothalamus, the CA fields and dentate gyrus of the hippocampus, the habenula, and cortex. Expression was also observed in the intra-ventricular epithelial cells of the choroid plexus. These same regions were found to express the corresponding gene products that form the heterodimeric T1R2/T1R3 and T1R1/T1R3 sweet and L-amino acid taste G-protein coupled receptors, respectively, along with the taste G-protein α-gustducin. Moreover, in vivo studies in mice demonstrated that the hypothalamic expression of taste-related genes is regulated by the nutritional state of the animal, with food deprivation significantly increasing expression levels of Tas1r1 and Tas1r2 in hypothalamus, but not in cortex. Furthermore, exposing mouse hypothalamic cells to a low-glucose medium, while maintaining normal L-amino acid concentrations, specifically resulted in higher expression levels of the sweet-associated gene Tas1r2. This latter effect was reversed by adding the non-metabolizable artificial sweetener sucralose to the low-glucose medium, indicating that taste-like signaling in hypothalamic neurons does not require intracellular glucose oxidation. Taken together, our findings suggest that the heterodimeric G-protein coupled sweet receptor T1R2/T1R3 is a candidate membrane-bound brain glucosensor.
Brain glucosensors are specialized neurons that respond to local fluctuations in extracellular glucose levels, modulating their mean firing rate according to changes in glucose concentration (Gonzalez et al., 2008
; McCrimmon, 2008
). Early electrophysiological studies described the presence of glucosensing neurons in brain regions known to influence glucose homeostasis, including the hypothalamus and the brainstem (Anand et al., 1964
; Oomura et al., 1969
; Ritter et al., 1981
). Later studies have identified the presence of glucosensing neurons in other brain regions including the amygdala (Nakano et al., 1986
), septum (Shoji, 1992
) and cortex (Lee et al., 1996
).
How is glucose sensed by neurons? Glucosensing neurons are generally classified as “glucose-excited” (GE) or “glucose-inhibited” (GI), according to whether their mean firing rate increase or decrease, respectively, in response to local changes in extracellular glucose (Gonzalez et al., 2008
; McCrimmon, 2008
). In the case of GE neurons, the insulin-secreting β-cells of the pancreas have been adopted as the cellular model of neuronal glucosensing (Matschinsky, 1996
; Schuit et al., 2001
). In the pancreatic islets, glucose is carried into the cell through facilitated transport via GLUT proteins, resulting in equilibration between extracellular and cytosolic glucose (McCrimmon, 2008
). In these cells, intracellular glucose metabolism is controlled by glucokinase (GK), the rate-limiting factor in glycolysis (Matschinsky, 1996
; Schuit et al., 2001
). The action of GK on glucose results in a series of intracellular events eventually leading to rises in the cytosolic ATP:ADP ratio and subsequent closure of ATP-sensitive potassium (KATP) channels, which in turn causes cell depolarization (Gonzalez et al., 2008
; McCrimmon, 2008
). The discovery that both GK and KATP are expressed in glucosensing regions of the brain then naturally led to the hypothesis that GK and KATP, like in pancreas, play essential roles in the generation of GE responses to rises in extracellular glucose (Ashford et al., 1990
; Kang et al., 2006
; Routh, 2002
).
However, several lines of evidence strongly suggest that glucosensing neurons might use alternative, GK/KATP-independent pathways to respond to local fluctuations in glucose levels. For example, rises in glucose concentration at physiological levels fail to elevate cytosolic ATP levels in the hypothalamus (Ainscow et al., 2002
). In addition, KATP channels are expressed in several regions of the brain, most often in non-glucosensing neurons (Karschin et al., 1997
). Another compelling evidence in favor of the existence non-metabolic glucosensing pathways in the brain relates to the lack of expression of pancreatic glucosensor elements in a significant fraction of glucosensing neurons; in fact, over 30% of glucosensing neurons were found to not express GK or SUR1, a subunit of the pancreatic β-cell KATP channels (Kang et al., 2004
). These results have recently led to the hypothesis that the primary role of GK in neurons relates to cellular metabolic support rather than glucosensing per se (Gonzalez et al., 2008
, 2009
). Finally, it is noticeable that GE neurons are present in the hypothalamus of KATP channel knockout (Kir6.2 null) mice (Fioramonti et al., 2004
). Likewise the GE case, GI neurons also seem to make use of GK-independent pathways. In addition to the fact that only a fraction of GI neurons are found to express GK (Kang et al., 2004
), stimulating ATP production via lactate infusions did not result in inhibition of hypothalamic GI neurons (Song and Routh, 2005
). Moreover, while inhibition of orexin GI neurons by glucose was shown to depend on tandem-pore K2P ion channels (Burdakov et al., 2006
), the same study also demonstrates that intracellular applications of glucose did not affect the extracellular action of glucose, suggesting that glucose acts extracellularly on currently undetermined glucose sensors located on the cell membrane (Burdakov et al., 2006
). Overall, it must be concluded from the above that at least part of the mechanism regulating neuronal glucosensing involves signaling pathways that do not require intracellular metabolic processing of glucose.
In this study, we propose that one of the metabolism-independent mechanisms that GE and GI neurons might use to respond to local changes in extracellular glucose levels involves a sweet taste-like signaling pathway. Sweet taste signaling is known to be mediated by heterodimeric G-protein coupled receptors and specific downstream signaling elements. More precisely, the transduction of sweet tastants is mediated by the taste genes Tas1r2 and Tas1r3 (Bachmanov and Beauchamp, 2007
), whose T1R2 and T1R3 products assemble to form the heterodimeric sweet receptor T1R2/T1R3 (Nelson et al., 2001
; Zhang et al., 2003
; Zhao et al., 2003
). A similar mechanism mediates the recognition of L-amino acids via the Tas1r1 and Tas1r3 genes (Bachmanov and Beauchamp, 2007
; Nelson et al., 2002
). T1R2/T1R3 and T1R1/T1R3 receptor signaling are at least in part supported by the taste-specific heterotrimeric G-protein gustducin, formed by α-gustducin (McLaughlin et al., 1992
), Gβ3 and Gγ13 (Huang et al., 1999
). Because the sweet receptor T1R2/T1R3 is also expressed in the gastrointestinal tract (Bezencon et al., 2007
), where it plays important physiological roles by mediating hormonal responses to the presence of tastants in the lumen (Margolskee et al., 2007
), we hypothesized that sweet taste-related signaling molecules might also be involved in responses to extracellular levels of brain glucose in a way that is independent from its intracellular metabolic processing.
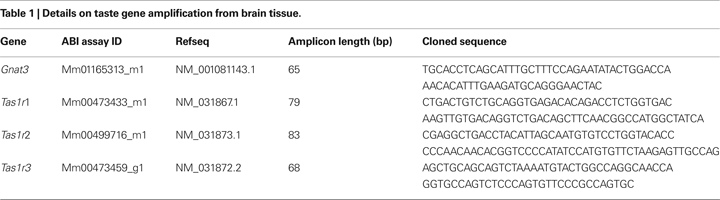
Amplification and Sequencing of Taste Genes from Mouse Brain cDNA
Total RNAs were extracted from mouse or rat brain tissue using the TRIzol reagent (Invitrogen), purified by Acid-Phenol:Chloroform (Applied Biosystems) and reverse-transcribed into cDNA using SuperScriptII (Invitrogen) according to the manufacturer’s instructions. The cDNA (equivalent to 200 ng RNA) was amplified by real-time (RT)-PCR using an ABIPRISM 7900HT sequence detection system (Applied Biosystems). Taqman primers and probes for the following genes were purchased from Applied Biosystems (Mm99999915_g1 for GAPDH, Mm00516381_m1 for Gnb3, Mm00458152_ml for Gng13. The assay IDs for Gnat3, Tas1r1, Tas1r2 and Tas1r3 are listed in Table 1
). The cycling conditions were 1 cycle at 50°C for 2 min, 1 cycle at 95°C for 10 min, followed by 50 cycles at 95°C for 15 s and 60°C for 1 min. GAPDH primers were used as internal controls. To confirm the specificity of the products and rule out genomic contamination in the RT-PCR assay, the products of Gnat3, and Tas1r1, Tas1r2 and Tas1r3 from mouse cortex were purified using the QIAquick PCR Purification Kit (Qiagen), ligated into the pDrive cloning vector with the QIAGEN PCR Cloning Kit (Qiagen) and sequenced (the presence of Gnb3 and Gng13 had been shown in brain previously, Huang et al., 1999
). Multiple sequence alignment was performed on the sequenced amplified segments using the CLUSTAL W (V. 1.8) software.
Relative Quantification of Gene Expression Levels from Real-Time PCR Data
Relative gene expression levels across regions and/or conditions were computed using the  method as described previously (Livak and Schmittgen, 2001
). In all experiments, GAPDH was used as an internal reference in order to control for variations in cDNA concentration across samples. Briefly, given a specific sample and a target gene of interest, the quantity ΔCT = (CT, Target − CT, GAPDH) was computed, where CT, Target and CT, GAPDH correspond to the detected threshold cycles for the target gene and GAPDH, respectively, for this particular sample. To compute the relative expression levels for a target gene across different brain regions, the quantity
method as described previously (Livak and Schmittgen, 2001
). In all experiments, GAPDH was used as an internal reference in order to control for variations in cDNA concentration across samples. Briefly, given a specific sample and a target gene of interest, the quantity ΔCT = (CT, Target − CT, GAPDH) was computed, where CT, Target and CT, GAPDH correspond to the detected threshold cycles for the target gene and GAPDH, respectively, for this particular sample. To compute the relative expression levels for a target gene across different brain regions, the quantityΔΔCT = (CT, Target − CT, GAPDH)R1 − (CT, Target − CT, GAPDH)R2 = (ΔCT)R1 − (ΔCT)R2
was calculated, where R1 and R2 correspond to two different brain regions. Then, the relative levels of expression between regions were computed as . The resulting values were then multiplied by 100 and expressed as percent values, with 100% corresponding to no relative differences in expression levels, by definition, since 20 = 1. By analogy, the relative changes in expression levels of a target gene in a given brain region due to a certain experimental manipulation (e.g., food-deprived vs. fed animals) was computed via the quantity
. The resulting values were then multiplied by 100 and expressed as percent values, with 100% corresponding to no relative differences in expression levels, by definition, since 20 = 1. By analogy, the relative changes in expression levels of a target gene in a given brain region due to a certain experimental manipulation (e.g., food-deprived vs. fed animals) was computed via the quantityΔΔCT = (CT, Target − CT, GAPDH)C1 − (CT, Target − CT, GAPDH)C2 = (ΔCT)C1 − (ΔCT)C2
where C1 and C2 correspond to two different experimental conditions. By analogy, the relative changes in expression levels in a given brain region to specific experimental manipulation were computed as .
.One important assumption of the method concerns the insensitivity of the internal control reference gene to experimental treatment. Table 2
displays the CT values for GAPDH for all experimental conditions reported in this study, including GAPDH CT values associated with the different brain regions analyzed. In each case, appropriate statistical tests were performed to ascertain that GAPDH levels did not vary due to our experimental treatments and/or depend on brain region analyzed.
method concerns the insensitivity of the internal control reference gene to experimental treatment. Table 2
displays the CT values for GAPDH for all experimental conditions reported in this study, including GAPDH CT values associated with the different brain regions analyzed. In each case, appropriate statistical tests were performed to ascertain that GAPDH levels did not vary due to our experimental treatments and/or depend on brain region analyzed.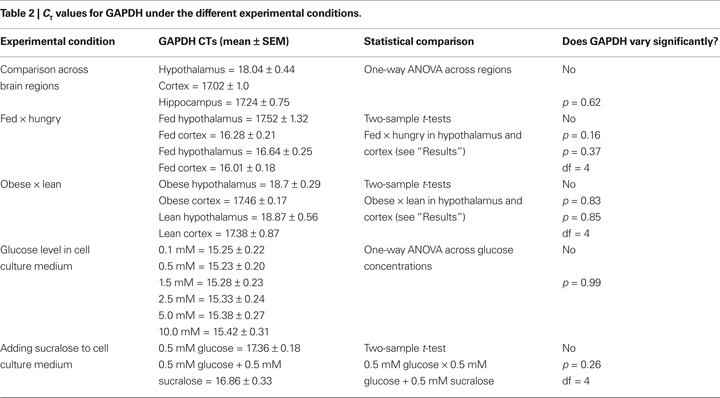
Finally, the option for , a relative expression method, rather than for an absolute quantification approach is based on the fact that no hypotheses concerning the effects of our experimental treatments on the amount of genes have been formulated a priori. While we considered relevant to determine whether gene levels were up- or downregulated according to experimental conditions such as changes in nutritional state, we assumed that such analysis does not require the quantification of absolute gene copy numbers. This is consistent with the principle that absolute quantification should be restricted to situations where it is necessary to determine the absolute transcript copy numbers (Livak and Schmittgen, 2001
).
, a relative expression method, rather than for an absolute quantification approach is based on the fact that no hypotheses concerning the effects of our experimental treatments on the amount of genes have been formulated a priori. While we considered relevant to determine whether gene levels were up- or downregulated according to experimental conditions such as changes in nutritional state, we assumed that such analysis does not require the quantification of absolute gene copy numbers. This is consistent with the principle that absolute quantification should be restricted to situations where it is necessary to determine the absolute transcript copy numbers (Livak and Schmittgen, 2001
).In Situ Hybridization
In situ hybridization (ISH) was performed using radiolabeled riboprobes according to conventional protocols with minor modifications (Newton et al., 2002
). The reverse primer included a T7 template sequence (TAATACGACTCACTATAGGGAGA) on the 5’end while the forward primer included a Sp6 template sequence (ATTTAGGTGACACTATAGAA). For Tas1r2, PCR product was generated by PCR using gene-specific primers, forward-ccacaccctccacagactcc; reverse-ccacacactcgaagcagcac. For Gnat3, primers were forward-cgtgccaaatgagcaagatg; reverse-tctggaaagcaaatgctgagg and for Tas1r3 primers were forward-acggtgtgacgacatcatgc, reverse-ggtgtagggctctgccacac. Mouse hippocampal cDNA was used as the template for PCR, which was performed in a RT-PCR instrument (SmartCycler; Cepheid, Sunnyvale, CA, USA) using the Quantitect Sybr Green PCR Kit (Qiagen). PCR product was purified by ethanol precipitation and was resuspended in TE buffer. One microgram of each PCR product was used to produce radiolabeled riboprobes using a T7 or Sp6-based in vitro transcription kit (Maxiscript, Ambion). Sp6 transcription was used to generate the sense Tas1r2 probe while T7 transcription was used to produce the sense probe. Specificity of the PCR product was verified by sequencing. Radiolabeled CTP was included in the in vitro transcription reaction and 2 million counts were added to each slide. Sections were opposed to autoradiographic film (Kodak BioMax MR film, Cat# 870 1302) and developed in an automated developer. ISH images were captured using a digital camera (Scion Corporation) and visualized using NIH Image J software. Specificity of probes were tested by verifying that anti-sense probes produced no significant hybridizations to brain tissue (results shown in Figure 1 in Supplementary Material).
Immunohistochemistry
Mice were anesthetized with 5% isoflurane, injected with a lethal dose of Euthasol (0.1 ml i.p.) and cardio-perfused with PBS followed by 4% paraformaldehyde (PFA) in PBS. Brains were removed, postfixed in 4% PFA overnight. All brains were cryoprotected in 30% sucrose in PBS. Thirty micrometer sections were cut using a cryostat. For DAB staining, floating sections were pretreated for 1 h in PBS containing 0.3% H2O2 to eliminate endogenous peroxidase activity, incubated overnight with rabbit anti-T1R2, or goat anti-T1R3 (1:50, Santa Cruz Biotechnology and Abcam) in 3% normal donkey serum (NDS) in PBS containing 0.25% Triton X-100 (PBST), and then incubated for 1 h with biotinylated donkey anti-rabbit IgG or anti-goat IgG antibody (1:500, Vector Laboratories) followed by ABC solution (Vectastain ABC elite kit, Vector Laboratories). Signals were visualized in PBS containing 0.02% 3,3′-diaminobenzidine-4HCl, and 0.001% H2O2. For immunofluorescent labeling, brain sections were incubated overnight with both rabbit anti-α-gustducin (1:100, Santa Cruz, sc-395) and mouse anti-Neun (1:100, Millipore), and then incubated with Alexa-594 donkey anti-rabbit IgG for 1 h, followed by Alexa-488 donkey anti-mouse IgG for 1 h (Invitrogen), and finally mounted on slides using Vectashield anti-fade (Vector Laboratories, CA, USA). Fluorescence images were obtained using a confocal microscope (Fluoview F1000, Olympus).
In Vivo Studies
Adult male mice with a C57BL/6 background were used. At the time of experiments animals were 3–6 months old. Leptin-deficient ob/ob mice and their lean wild-type counterparts were obtained from the Jackson Laboratory (Bar Harbor, ME, USA). For the food-deprivation study, 10 wild-type single-housed animals were either selected to be food-deprived for 24 h (water access only) or to remain under ad libitum chow and water access. After this period, animals were anesthetized with an overdose of Euthasol (0.1 ml i.p.) and brains were quickly removed, selected brain areas were dissected and samples were immediately sonicated and treated for total RNA extraction as explained above. For experiments with obese hyperglycemic ob/ob animals, procedures were as above, with the exception that all animals in this case were maintained at ad libitum conditions. Glucose levels were determined by using a hand-held glucometer (OneTouch) following overnight fasting. All procedures were approved by The J. B. Pierce Laboratory Animal Care and Use Committee.
Embryonic Mouse Hypothalamic Cell Line
Plates containing the Embryonic Mouse Hypothalamic Cell Line N38 (Cellutions Biosystems Inc.) was grown in 1 × DMEM (high glucose, Invitrogen) with 10% fetal bovine serum, and 1% penicillin/streptomycin and maintained at 37°C under 5% CO2. For the glucose-sensing experiments, the cells were washed with PBS and cultured in a no glucose DMEM medium (Invitrogen), to which was added either one of 0.1, 0.5, 1.5, 2.5, 5 and 10 mM glucose (Sigma-Aldrich) or 0.5 mM glucose + 0.5 mM sucralose (USP), for 45 min before RNA extraction. All the other procedures including amplification and analysis of RT quantitative PCR data were as above. To confirm the specificity of and rule out genomic contamination on the RT-PCR assay, the products of Gnat3, and Tas1r1, Tas1r2 and Tas1r3 from mouse cortex were purified using the QIAquick PCR Purification Kit (Qiagen), ligated into the pDrive cloning vector with the QIAGEN PCR Cloning Kit (Qiagen) and sequenced. Multiple sequence alignment was performed on the sequenced amplified segments using the CLUSTAL W (V. 1.8) software. For immunofluorescence experiments, plated cells were fixed for 20 min with 4% PFA in PBS at room temperature, incubated overnight with goat anti-T1R3 and either rabbit anti-α-gustducin or anti-T1R2. Cultured cells were then incubated with Alexa488 donkey anti-rabbit IgG for 1 h, followed by Alexa-594 donkey anti-goat for 1 h (Invitrogen), and finally mounted on slides using Vectashield anti-fade (Vector Laboratories, CA, USA).
Amplification and Cloning of Taste Genes from Mouse Brain cDNA
Gene-specific Taqman probes and primers (see “Materials and Methods” section) were used to amplify the following taste-related genes: Tas1r1, Tas1r2, Tas1r3, Gnat3, Gnb3 and Gng13 from mouse brain cDNA. The first three gene products encode the subunits forming the heterodimeric taste receptors T1R1/T1R3 (L-amino acid, Nelson et al., 2002
) and T1R2/T1R3 (sweet, Zhao et al., 2003
), and the last three respectively encode the products α-gustducin, Gβ3 and Gγ13 that form the α, β and γ subunits of heterotrimeric taste G-protein gustducin (Huang et al., 1999
; McLaughlin et al., 1992
). All probes were designed to amplify regions containing exon–exon junctions, and PCR product sizes were verified by gel electrophoresis. To completely exclude the possibility that amplification of taste genes resulted from genomic DNA contamination in the samples, PCR products for Tas1r1, Tas1r2, Tas1r3 and Gnat3 were ligated into pDrive cloning vectors, cloned and sequenced. Sequencing results revealed that the amplified regions corresponded to intronless segments 100% similar to the cDNA published sequences (see Table 1
for the actual cloned sequences and further details).
Taste-Related Genes are Highly Expressed in Hypothalamus Compared to Cortex and Hippocampus
Having established that the taste-related genes above are reliably expressed in the mouse brain, we proceeded to quantify the relative amounts of gene expression across different brain regions. We have used an RT quantitative PCR assay similar to a procedure previously employed to quantify relative amounts of taste-related gene expression in the gastro-intestinal tract (Bezencon et al., 2007
). Relative gene expression levels across regions were computed using the method (see “Materials and Methods” and Livak and Schmittgen, 2001
) and were expressed as percent expression levels in hypothalamus relative to either cortex or hippocampus. Values = 100% imply that the hypothalamus displayed no relative differences in expression levels with respect to a given region; values > 100% imply that the hypothalamus displayed relatively higher levels of expression compared to a given region; and values < 100% imply that the hypothalamus displayed relatively lower levels of expression compared to a given region (see “Materials and Methods” for details). Templates were obtained from dissected brains of seven adult male C57B6 mice, and relative quantification was performed using a within-subject design and expressed as mean% levels ± SEM in hypothalamus compared to either cortex or hippocampus.
method (see “Materials and Methods” and Livak and Schmittgen, 2001
) and were expressed as percent expression levels in hypothalamus relative to either cortex or hippocampus. Values = 100% imply that the hypothalamus displayed no relative differences in expression levels with respect to a given region; values > 100% imply that the hypothalamus displayed relatively higher levels of expression compared to a given region; and values < 100% imply that the hypothalamus displayed relatively lower levels of expression compared to a given region (see “Materials and Methods” for details). Templates were obtained from dissected brains of seven adult male C57B6 mice, and relative quantification was performed using a within-subject design and expressed as mean% levels ± SEM in hypothalamus compared to either cortex or hippocampus.In the forebrain, we have primarily detected the presence of Tas1r1, Tas1r2, Tas1r3, Gnat3, Gnb3 and Gng13 in the hypothalamus, hippocampus and cortex. Overall, we found that the hypothalamus displayed the highest levels of taste-related gene expression, followed by cortex and hippocampus. We compared the overall percent levels in hypothalamus (with respect to cortex and hippocampus) against the baseline level of 100%. First, a two-way taste gene × brain region ANOVA revealed significant main effects of taste gene (F = 10.34, df = 5, p < 0.001) and brain region (F = 6.92, df = 1, p < 0.02) on expression levels, with no significant interaction effects (F = 1.04, df = 5, p = 0.4). This result suggests, in particular, a difference in expression levels between cortex and hippocampus when these regions are normalized to hypothalamic expression levels. Next, we analyzed expression levels in cortex and hippocampus, in relation to hypothalamic levels, for each taste gene separately. Most often, taste genes were found to be expressed at significantly higher levels in hypothalamus compared to the hippocampus and, to a lesser extent, the cortex. In fact, Tas1r1 was found to be significantly more expressed in hypothalamus compared to the hippocampus (250 ± 47% of hypothalamic levels, one-sample t-test against 100% baseline t = 3.15, df = 6, p < 0.02) but only marginally higher in hypothalamus compared to cortex (126 ± 26%, t = 0.73, df = 6, p > 0.3, Figure 1
A; red dashed line denotes 100% baseline level). On the other hand, Tas1r2 was found to be expressed at significantly higher levels in hypothalamus compared to both cortex and hippocampus, with relative expression levels of 121 ± 6% (t = 3.05, df = 6, p < 0.03) and 156 ± 16% (t = 3.41, df = 6, p < 0.02), respectively (Figure 1
B). A pattern similar to Tas1r2 was observed for Tas1r3, with this receptor gene being expressed at significantly higher levels in hypothalamus compared to both cortex and hippocampus, with relative expression levels of 228 ± 45% (t = 2.8, df = 6, p < 0.02) and 505 ± 207% (one-tailed t = 1.95, df = 6, p < 0.05), respectively (Figure 1
C). We have also analyzed the relative expression levels of the taste G-protein genes. For Gnat3, although expression levels were on average higher in hypothalamus compared to cortex and hippocampus, such difference did not reach significance (129 ± 31%, t = 0.94, df = 6, p = 0.37 for cortex and 321 ± 136%, t = 1.62, df = 6, p = 0.15 for hippocampus, Figure 1
D). The expression levels of Gnb3, on the other hand, were clearly higher in hypothalamus compared to both cortex (735 ± 104%, t = 6.09, df = 6, p < 0.001) and hippocampus (1413 ± 468%, t = 2.8, df = 6, p < 0.04, Figure 1
E). Finally, for Gng13, expression levels in hypothalamus were only 85 ± 16% of those observed in cortex, a difference that nevertheless was not significant (t = −0.84, df = 6, p = 0.43), although levels of this gene were significantly higher in hypothalamus compared to hippocampus (224 ± 49%, t = 2.5, df = 6, p < 0.05, Figure 1
F).
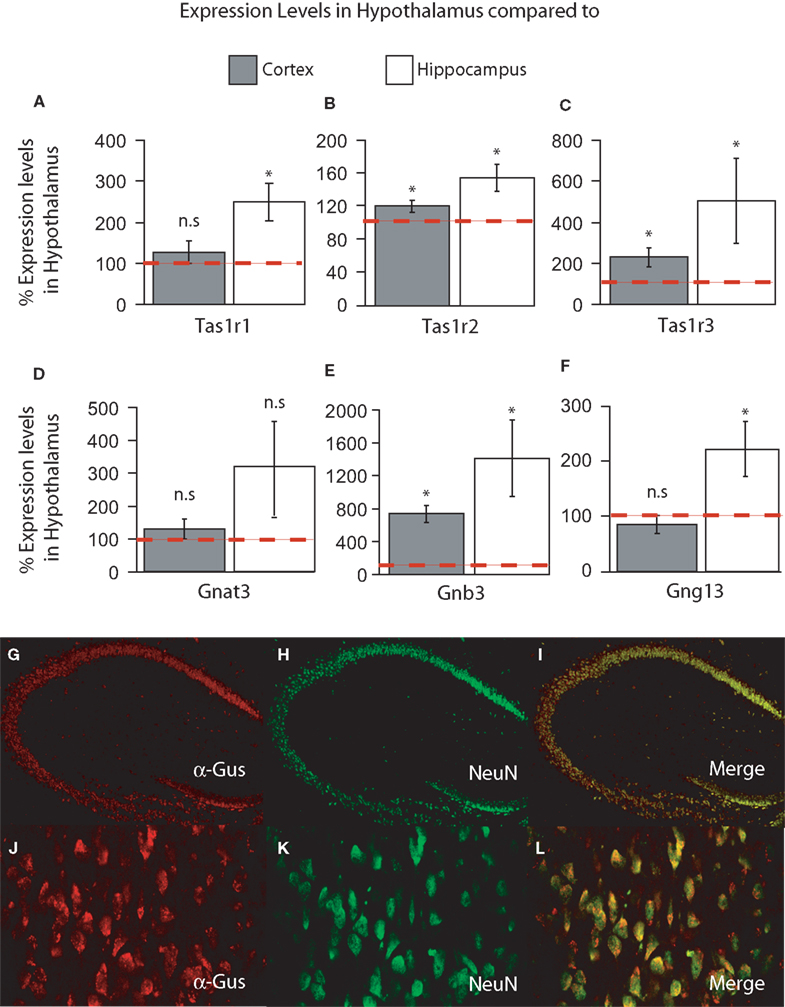
Figure 1. (A–F) Relative levels of expression of taste genes in the mouse hypothalamus compared to cortex and hippocampus. Taste genes were found to be expressed at significantly higher levels in the hypothalamus compared to the other regions found to express these genes, i.e., cortex and hippocampus. The panels depict the results of quantifying the relative levels of expression as obtained by using real-time quantitative PCR methods. Relative gene expression levels across regions were computed using the method (see “Materials and Methods” and Livak and Schmittgen, 2001
) and were expressed as percent expression levels in hypothalamus relative to either cortex or hippocampus. Values = 100% imply that the hypothalamus displayed no relative differences in expression levels with respect to a given region; values > 100% imply that the hypothalamus displayed relatively higher levels of expression compared to a given region; and values < 100% imply that the hypothalamus displayed relatively lower levels of expression compared to a given region (see “Materials and Methods” for details). (A–C) Relative levels for taste receptor-related genes Tas1r1, Tas1r2 and Tas1r3, respectively. (D–F) Relative levels for taste G-protein-related genes Gnat3, Gnb3 and Gng13, respectively. Note that, overall, the hypothalamus displayed significantly higher levels of expression compared to cortex and hippocampus, with the noted exception of Tas1r1 in cortex (similar levels in hypothalamus compared to cortex) and the G-protein gene Gnat3. See “Results” for details. Dashed red line depicts the 100% baseline levels. (*All p < 0.05, one-sample t-test against 100%). n.s.: p ≥ 0.05. (G–I) Co-expression of taste signaling molecules and the nuclear neuronal marker NeuN in the mouse hippocampus as assessed by immunofluorescence methods. Confocal images (×10 magnification) of the mouse hippocampus labeled for α-gustducin (G) and NeuN (H). Strong co-expression patterns were observed (I), suggesting that taste-related molecules of the brain are preferentially expressed in neurons. (J–L) The same as in (G–I), but for the case of the medial hypothalamus (×60 magnification). Results were qualitatively the same in hypothalamus as in hippocampus.
method (see “Materials and Methods” and Livak and Schmittgen, 2001
) and were expressed as percent expression levels in hypothalamus relative to either cortex or hippocampus. Values = 100% imply that the hypothalamus displayed no relative differences in expression levels with respect to a given region; values > 100% imply that the hypothalamus displayed relatively higher levels of expression compared to a given region; and values < 100% imply that the hypothalamus displayed relatively lower levels of expression compared to a given region (see “Materials and Methods” for details). (A–C) Relative levels for taste receptor-related genes Tas1r1, Tas1r2 and Tas1r3, respectively. (D–F) Relative levels for taste G-protein-related genes Gnat3, Gnb3 and Gng13, respectively. Note that, overall, the hypothalamus displayed significantly higher levels of expression compared to cortex and hippocampus, with the noted exception of Tas1r1 in cortex (similar levels in hypothalamus compared to cortex) and the G-protein gene Gnat3. See “Results” for details. Dashed red line depicts the 100% baseline levels. (*All p < 0.05, one-sample t-test against 100%). n.s.: p ≥ 0.05. (G–I) Co-expression of taste signaling molecules and the nuclear neuronal marker NeuN in the mouse hippocampus as assessed by immunofluorescence methods. Confocal images (×10 magnification) of the mouse hippocampus labeled for α-gustducin (G) and NeuN (H). Strong co-expression patterns were observed (I), suggesting that taste-related molecules of the brain are preferentially expressed in neurons. (J–L) The same as in (G–I), but for the case of the medial hypothalamus (×60 magnification). Results were qualitatively the same in hypothalamus as in hippocampus.Overall, our expression analyses revealed that the taste receptor Tas1r genes are highly expressed in the hypothalamus compared to both hippocampus and cortex (with the notable exception of Tas1r1). In addition, a similar pattern was observed regarding the associated taste G-protein genes, with the exception of Gnat3, the gene encoding for the G-protein α-gustducin, which appears to be more homogenously expressed throughout these three forebrain regions than the other taste genes.
Taste-Related Genes are Preferentially Expressed in Neurons
We were also interested in determining the brain cell types more likely to express the taste-related genes. More specifically, to determine whether taste-related proteins are preferentially expressed in neurons compared to other cell types, we performed double-labeling immunofluorescence experiments using antibodies against taste-related proteins and the neuronal marker NeuN, a neuronal-specific nuclear protein in vertebrates (Mullen et al., 1992
). Overall, based on our immunohistochemical (IHC) assay, we found that the expression of taste-related genes in the brain is predominantly neuronal. In Figures 1
G–I are shown the results of double labeling the hippocampal area with antibodies against α-gustducin and NeuN. Whereas essentially all α-gustducin-expressing cells were also labeled by NeuN, virtually none of the large number of astrocytes in this region reacted to the α-gustducin antibody. The same pattern was found to hold for the hypothalamus; the same IHC procedure applied to the hypothalamus revealed a very consistent overlap between α-gustducin- and NeuN-labeled cells (Figures 1
J–L). Similar patterns were observed for the other taste gene products including T1R2 and T1R3 (not shown). However, it must be noted that scarce numbers of non-neuronal cells also reacted to taste proteins and their expression in non-neuronal tissue cannot be excluded based on our findings.
Anatomical Localization of Taste-Related Genes and their Products in the Mouse Brain
To further explore the anatomical localization of the taste-related genes and their products, we performed both ISH and IHC analyses of taste genes and their associated protein products, respectively. We were especially interested in the expression of the subunits forming the heterodimeric sweet receptor T1R2/T1R3. Overall, the pattern resulting form both analyses were highly consistent. We have detected by ISH robust expression of Tas1r2 and Tas1r3 in the neurons of the CA fields and dentate gyrus of the hippocampus (Figures 2
A and 3
A, respectively). An equivalent expression pattern was obtaining by IHC using two different antibodies against their products (see “Materials and Methods”), as shown in Figures 2
B and 3
B for T1R2 and T1R3, respectively. In addition, strong expression was found in the hypothalamus, in particular in areas surrounding the ventral part of the third ventricle as pointed in the overall brain section by both ISH (Figures 2
C and 3
C) and IHC (Figures 2
D and 3
D) for T1R2 and T1R3, respectively. Note that IHC allowed us to visualize in particular a population of putative neuroendocrine neurons in the paraventricular nucleus of the hypothalamus reacting to both T1R2 and T1R3 (Figures 2
D and 3
D, respectively). In addition, expression patterns were detected in cortex by both ISH (Figure 2
E) and IHC (Figures 2
F and 3
F). Figures 2
E and 3
E show the results of immunolabeling against T1R2 and T1R3 antibodies, respectively, in the hypothalamic arcuate nucleus. Finally, it must be noted that additional areas were found to express taste-related genes and proteins, especially areas of the periventricular regions around the dorsal aspect of the third ventricle, including the medial habenula and the epithelial cells of the choroid plexus (shown Figures 2
A–C and 3
A–B for Tas1r2/T1R2 and Tas1r3/T1R3, respectively) as well as the paraventricular nucleus of the thalamus (not shown).
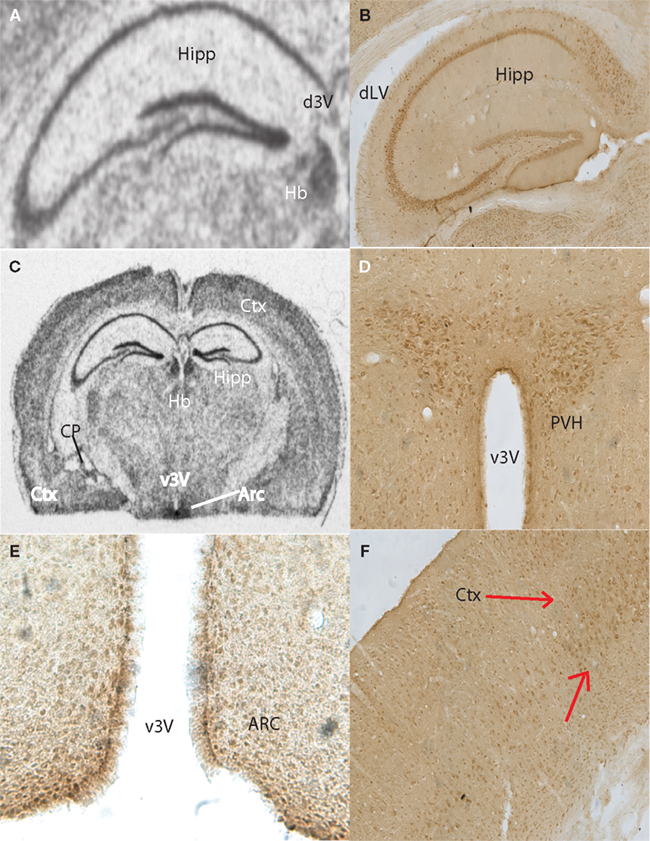
Figure 2. Anatomical distribution of the gene Tas1r2, and of its product, the taste receptor subunit T1R2. Images from the mouse hippocampus, hypothalamus and cortex obtained from both in situ hybridization and DAB immunolabeling methods were placed alongside. (A) Tas1r2 and (B) T1R2 expression in the hippocampus. Note the strong levels of both gene and protein expression on the CA fields and dentate gyrus, further demonstrating the preferential expression of taste-related elements in neurons. Note also the proximity of the hippocampus to the lateral ventricle. (C) Overall view of a brain section hybridized against a Tas1r2 probe. Note the high levels of expression in hippocampus, periventricular, including arcuate nucleus, of the hypothalamus, cortex and habenula. ISH also identified Tas1r2 expression in the epithelial cells of the choroid plexus. (D) T1R2 expression in the paraventricular nucleus of the hypothalamus. Note the generally higher expression levels of both gene and protein in proximity to the third ventricle. (E) T1R2 expression in the arcuate nucleus of the hypothalamus. Note the generally higher expression levels of both gene and protein in proximity to the third ventricle. (F) T1R2 expression in the cortex. Note that cortical expression seems to be restricted to layer IV of the cortex for both gene and protein expression. Arc, arcuate nucleus of the hypothalamus; Ctx, cortex; CP, choroid plexus; dLV, dorsal part of the lateral ventricle; d3V, dorsal part of the third ventricle; Hb, habenula; Hipp, hippocampal region; PVH, paraventricular nucleus of the hypothalamus; v3V, ventral part of the third ventricle.
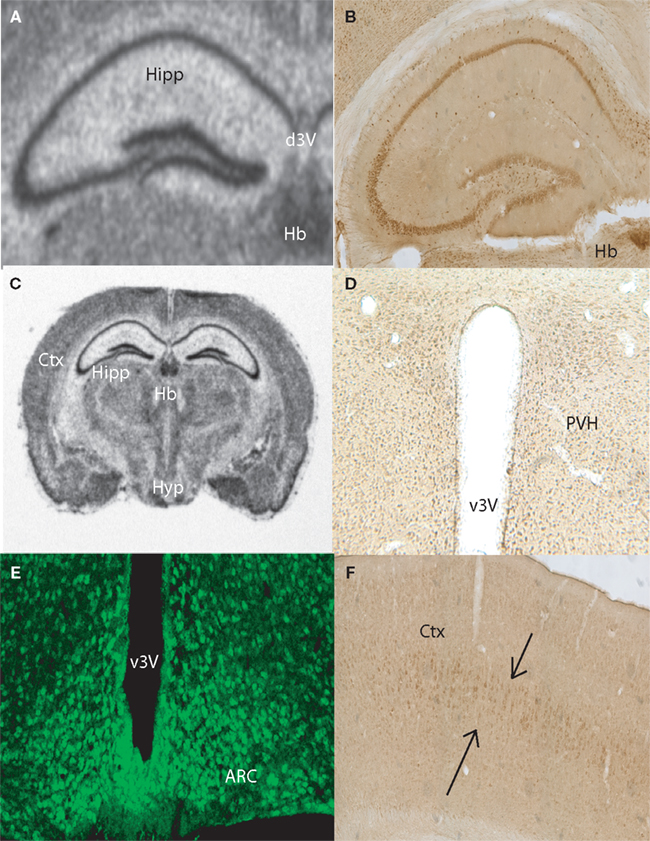
Figure 3. Anatomical distribution of the gene Tas1r3, and of its product, the taste receptor subunit T1R3. Images from the mouse hippocampus, hypothalamus and cortex obtained from both in situ hybridization and DAB immunolabeling methods were placed alongside. (A) Tas1r3 and (B) T1R3 expression in the hippocampus. Note the strong levels of both gene and protein expression on the CA fields and dentate gyrus, further demonstrating the preferential expression of taste-related elements in neurons. Note also the proximity of the hippocampus to the lateral ventricle. (C) Overall view of a brain section hybridized against a Tas1r3 probe. Note the high levels of expression in hippocampus, hypothalamus, cortex and habenula. ISH also identified Tas1r3 expression in the epithelial cells of the choroid plexus. (D) T1R3 expression in the hypothalamus. In (D), note the generally higher expression levels of both gene and protein in proximity to the third ventricle (PVH). (E) T1R3 expression in the arcuate nucleus of the hypothalamus as revealed by immunofluorescence methods. Picture was taken using a confocal microscope. (F) T1R3 expression in the cortex. Note that cortical expression seems to be restricted to layer IV of the cortex. ARC, arcuate nucleus of the hypothalamus; Ctx, cortex; CP, choroid plexus; dLV, dorsal part of the lateral ventricle; d3V, dorsal part of the third ventricle; Hb, habenula; Hipp, hippocampal region; Hyp, basal aspect of the hypothalamus; PVH, paraventricular nucleus of the hypothalamus; v3V, ventral part of the third ventricle.
Food Deprivation and Nutrient Excess Regulate Expression Levels of Tas1r1 and Tas1r2 in Hypothalamus but not Cortex
To assess the possible functional roles of taste-related signals in the brain, we have performed further RT quantitative PCR analyses on hypothalamic and cortical samples from five mice exposed to 24-h food deprivation and compared the gene expression levels in these animals to those observed in five mice that were fed ad libitum. We reasoned that, if taste-related signaling elements play a role in sensing nutrients in the brain, then their levels might be regulated by the nutritional state of the animal, which will determine the concentration and identity of nutrients including glucose and amino acids that actually reach the brain. Overall, we found that the taste receptor genes Tas1r1 and Tas1r2 increased their levels of expression following food deprivation in the hypothalamus, but not in cortex, indicating that taste receptor-related genes are sensitive to nutrient levels in the brain regions regulating energy homeostasis. These changes in expression levels seemed to be specific to the taste receptor genes Tas1r1 and Tas1r2. In fact, compared to fed animals, deprived animals showed non-significant decreases in Gnat3 in both hypothalamus (81 ± 25%, paired within-subject two-sample one-tailed t-test against 100% baseline, df = 4, t = −0.7, p > 0.7) and cortex (73 ± 26%, t = −0.1, p > 0.8, see Figure 4
A); however, Tas1r1 levels were significantly higher in deprived compared to fed animals in hypothalamus (164 ± 21%, t = 2.94, p < 0.03) but not in cortex (165 ± 35%, t = 1.84, p = 0.07, see Figure 4
B). A similar effect was found for Tas1r2: expression levels were significantly higher in deprived, compared to fed, animals in hypothalamus (255 ± 64%, t = 2.41, p < 0.04) but not in cortex (124 ± 25%, t = 0.94, p = 0.2, see Figure 4
C). Finally, and rather strikingly given the above, no significant changes were observed for Tas1r3 in either hypothalamus (90 ± 7%, t = −1.14, p > 0.8) or cortex (99 ± 9%, t = −0.15, p > 0.5, see Figure 4
D). These results indicate that the expression levels of the taste receptor genes Tas1r1 and Tas1r2 in the hypothalamus are under the control of nutrient availability.
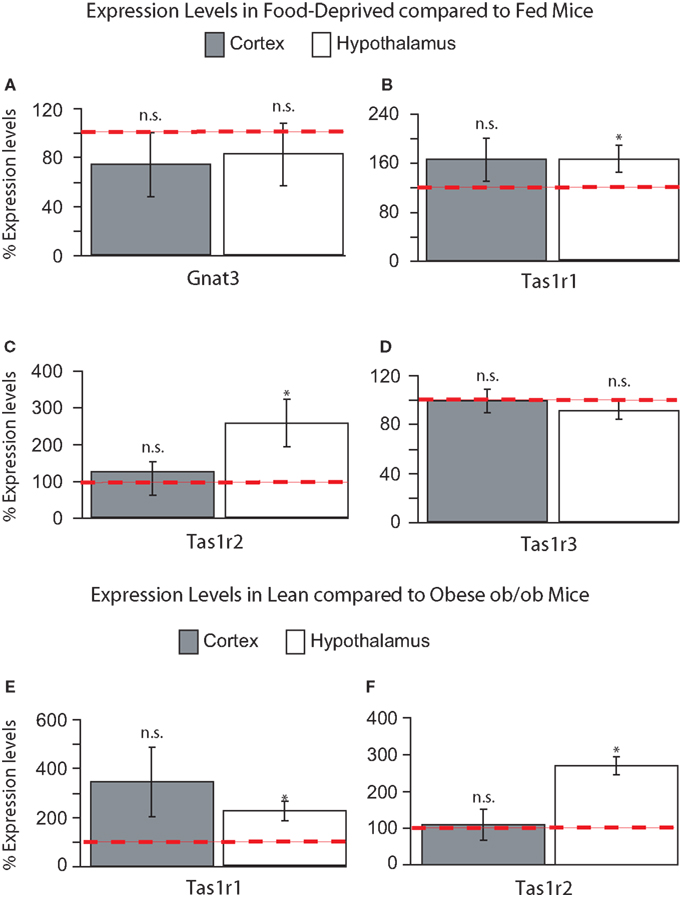
Figure 4. (A–D) Relative levels of expression of taste genes in food-deprived mice compared to fed mice in hypothalamus and cortex. Taste receptor-related genes Tas1r1 and Tas1r2 were found to be expressed at significantly higher levels in the hypothalamus, but not cortex, of food-deprived animals when compared to fed animals. The panels depict the results of quantifying the relative levels of expression as obtained by using real-time quantitative PCR methods. Relative gene expression levels across regions were computed using the method (see “Materials and Methods” and Livak and Schmittgen, 2001
) and were expressed as percent expression levels in hypothalamus or cortex observed in deprived compared to fed animals. Values = 100% imply that the brain region displayed no relative differences in expression levels in deprived compared to fed animals; values > 100% imply that the brain region displayed relatively higher levels of expression in deprived compared to fed animals; and values < 100% imply that the brain region displayed relatively lower levels of expression in deprived compared to fed animals (see “Materials and Methods” for details). (A–D) Relative levels for taste receptor-related genes Gnat3, Tas1r1, Tas1r2 and Tas1r3, respectively. Note significant changes in Tas1r1 and Tas1r2 levels. (E–F) Taste receptor-related genes Tas1r1 and Tas1r2 were found to be expressed at significantly higher levels the hypothalamus, but not cortex, of lean animals when compared to obese, hyperglycemic ob/ob mice. Data are expressed as percent levels of expression in the deprived animals compared to the fed animals, with 100% representing baseline (no relative change) levels. Panels show relative levels for taste receptor-related genes Tas1r1 (E) and Tas1r2 (F). The other genes did not show significant changes in expression levels. (*All p < 0.05, one-sample t-test against 100%). Dashed red line depicts the 100% baseline levels.
method (see “Materials and Methods” and Livak and Schmittgen, 2001
) and were expressed as percent expression levels in hypothalamus or cortex observed in deprived compared to fed animals. Values = 100% imply that the brain region displayed no relative differences in expression levels in deprived compared to fed animals; values > 100% imply that the brain region displayed relatively higher levels of expression in deprived compared to fed animals; and values < 100% imply that the brain region displayed relatively lower levels of expression in deprived compared to fed animals (see “Materials and Methods” for details). (A–D) Relative levels for taste receptor-related genes Gnat3, Tas1r1, Tas1r2 and Tas1r3, respectively. Note significant changes in Tas1r1 and Tas1r2 levels. (E–F) Taste receptor-related genes Tas1r1 and Tas1r2 were found to be expressed at significantly higher levels the hypothalamus, but not cortex, of lean animals when compared to obese, hyperglycemic ob/ob mice. Data are expressed as percent levels of expression in the deprived animals compared to the fed animals, with 100% representing baseline (no relative change) levels. Panels show relative levels for taste receptor-related genes Tas1r1 (E) and Tas1r2 (F). The other genes did not show significant changes in expression levels. (*All p < 0.05, one-sample t-test against 100%). Dashed red line depicts the 100% baseline levels.We next asked the question of whether, conversely, abnormally high levels of circulating nutrients could induce a relative decrease in expression levels in hyperglycemic compared to euglycemic mice. We have therefore compared the taste gene expression levels in hypothalamus and cortex between obese hyperglycemic ob/ob mice (n = 5) and wild-type lean controls (n = 5). Hyperglycemia in ob/ob was confirmed by measuring blood glucose levels with glucometer (lean: 199 ± 28 mg/dL; obese: 440 ± 58 mg/dL, p < 0.02). Based on the results above, we hypothesized that Tas1r genes would be expressed at higher levels in the hypothalamus, but not cortex, of lean compared to obese mice. In fact, a direct comparison between Tas1r expression levels between lean and obese animals reveal that lean mice displayed significantly higher levels of expression in hypothalamus (205 ± 53%, paired within-subject two-sample one-tailed t-test against 100%, t = 1.94, p < 0.04) but not in cortex (192 ± 54%, t = 1.69, p = 0.056), although one must note that results from cortex were close to reach significant levels. In any event, once again the main contributors to this result were Tas1r1 (221 ± 38% in hypothalamus vs. 345 ± 143% in cortex, see Figure 4
E) and Tas1r2 (269 ± 58% in hypothalamus vs. 107 ± 41% in cortex, see Figure 4
F). Overall, the results from our in vivo experiments indicate that the expression levels of the taste receptor genes Tas1r1 and Tas1r2 in the mouse hypothalamus, but not cortex, reflect the current nutritional state of the animal.
Glucose and Sucralose Specifically Modulate Tas1r2 Expression Levels in a Mouse Hypothalamic Cell Line
It could be argued, however, that the patterns described above result from systemic effects related to prolonged food deprivation or obesity, rather than nutrient sensing per se. In fact, one must consider the possibility that systemic factors such as changes in insulin and/or stress hormone levels drive expression levels of taste-related genes in the brain. Therefore, to ascertain that gene levels were primarily under the control of extracellular levels of nutrients, we adopted as an additional experimental model an embryonic mouse hypothalamic cell line (see “Materials and Methods”). We reasoned that, if the levels of expression of taste-related genes are controlled by extracellular availability of nutrients independently of systemic or metabolic factors, then manipulating the levels of nutrients in the medium should suffice to specifically alter taste gene levels in these dissociated cells. In particular, we hypothesized that imposing physiological changes in glucose levels to the medium while maintaining other nutrient levels unaltered should specifically alter expression levels of Tas1r2, the sweet-specific gene, while leaving the levels of the other Tas1rs unaltered.
Before running the hypothalamic cell culture experiments we ascertained the plausibility of this model by verifying that these cells endogenously express taste-receptor genes. Likewise the case of our fresh brain samples, gene-specific Taqman probes and primers (see “Materials and Methods”) were used to amplify the following taste-related genes: Tas1r1, Tas1r2, Tas1r3, Gnat3, Gnb3 and Gng13 from cultured hypothalamic cells cDNA. As explained above, all probes were designed to amplify regions containing exon–exon junctions, and PCR product sizes were verified by gel electrophoresis. To completely exclude the possibility of genomic DNA contamination in the samples, PCR products for Tas1r1, Tas1r2, Tas1r3 and Gnat3 were ligated into pDrive cloning vectors, cloned and sequenced. Sequencing results revealed that the amplified regions corresponded to intronless segments 100% similar to cDNA, and 100% similar to the sequences cloned from adult mouse brains as described above (see Table 1
for the actual cloned sequences). These findings were corroborated by probing plated cells with T1R2 and T1R3 antibodies (Figures 5
A,B) and verifying their co-expression (Figure 5
C). The same procedure was adopted using antibodies against α-gustducin and T1R2 or T1R3 (not shown).
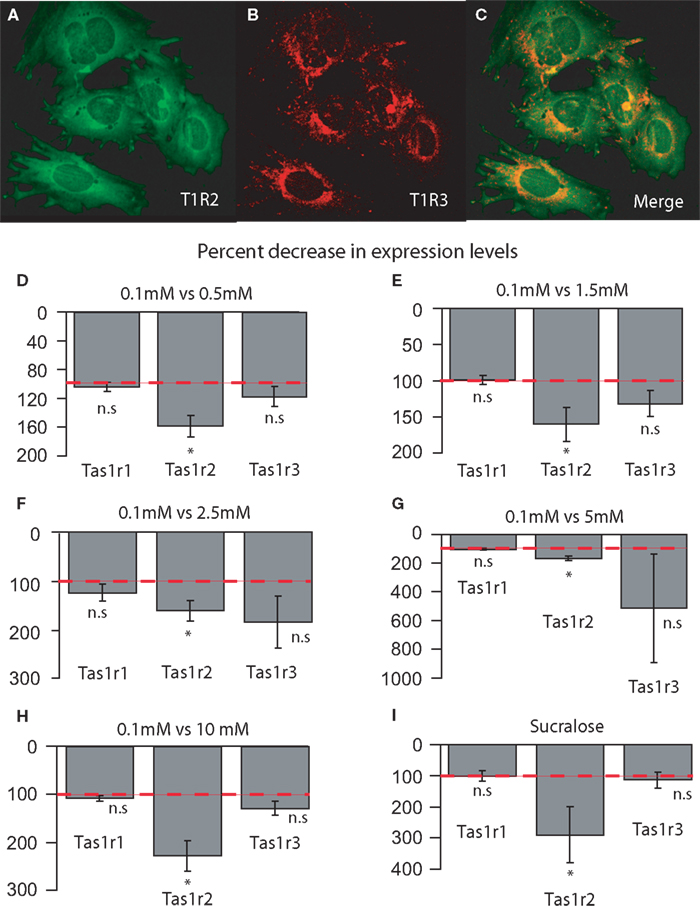
Figure 5. (A–C) Co-expression of taste signaling molecules in the embryonic mouse hypothalamic cell line N38 as assessed by immunofluorescence methods. Confocal images (×10 magnification) of N38 cells that we determine endogenously express taste-related molecules. (A) Expression of the receptor subunit T1R2; (B) expression of the receptor subunit T1R3; (C) merging, showing that these cells express both subunits of the sweet receptor T1R2/T1R3. (D–E) Relative decrease in the levels of expression of the sweet-specific receptor gene Tas1r2 in cultured N38 cells as a function of glucose levels in culture medium. The sweet receptor-specific gene Tas1r2, but not others, was found to be expressed at significantly higher levels in N38 cells exposed to a low-glucose medium (0.1 mM) compared to cells exposed to higher glucose levels. The panels depict the results of quantifying the relative levels of expression as obtained by using real-time quantitative PCR methods. Relative gene expression levels across regions were computed using the method (see “Materials and Methods” and Livak and Schmittgen, 2001
) and were expressed as percent decrease in expression levels in cells exposed to a medium containing from 0.5 up to 10 mM glucose compared to cells exposed to a medium containing 0.1 mM glucose. Values = 100% imply that no relative differences in expression levels were detected in cells exposed to a medium containing higher glucose levels (0.5–10 mM) compared to cells exposed to a medium containing 0.1 mM glucose; values < 100% imply that significant decreases in expression levels were detected in cells exposed to a medium containing higher glucose levels compared to cells exposed to a medium containing 0.1 mM glucose. (D) Decrease in taste receptor levels produced by increasing glucose medium from 0.1 to 0.5 mM glucose. (E) Decrease in taste receptor levels produced by increasing glucose medium from 0.1 to 1.5 mM glucose. (F) Decrease in taste receptor levels produced by increasing glucose medium from 0.1 to 2.5 mM glucose. (G) Decrease in taste receptor levels produced by increasing glucose medium from 0.1 to 5 mM glucose. (H) Decrease in taste receptor levels produced by increasing glucose medium from 0.1 to 10 mM glucose. (I) Decrease in Tas1r2 levels produced by adding 0.5 mM sucralose to 0.5 mM glucose. Values = 100% imply that no relative differences in expression levels were detected in cells exposed to a medium containing 0.5 mM glucose + 0.5 mM sucralose compared to cells exposed to a medium containing 0.5 mM glucose; values < 100% imply that significant decreases in expression levels were detected in cells exposed to a medium containing 0.5-mM glucose + 0.5 mM sucralose compared to cells exposed to a medium containing 0.5 mM glucose. Dashed red line depicts the 100% baseline levels. (*All p < 0.05, one-sample t-test against 100%). n.s.: p ≥ 0.05.
method (see “Materials and Methods” and Livak and Schmittgen, 2001
) and were expressed as percent decrease in expression levels in cells exposed to a medium containing from 0.5 up to 10 mM glucose compared to cells exposed to a medium containing 0.1 mM glucose. Values = 100% imply that no relative differences in expression levels were detected in cells exposed to a medium containing higher glucose levels (0.5–10 mM) compared to cells exposed to a medium containing 0.1 mM glucose; values < 100% imply that significant decreases in expression levels were detected in cells exposed to a medium containing higher glucose levels compared to cells exposed to a medium containing 0.1 mM glucose. (D) Decrease in taste receptor levels produced by increasing glucose medium from 0.1 to 0.5 mM glucose. (E) Decrease in taste receptor levels produced by increasing glucose medium from 0.1 to 1.5 mM glucose. (F) Decrease in taste receptor levels produced by increasing glucose medium from 0.1 to 2.5 mM glucose. (G) Decrease in taste receptor levels produced by increasing glucose medium from 0.1 to 5 mM glucose. (H) Decrease in taste receptor levels produced by increasing glucose medium from 0.1 to 10 mM glucose. (I) Decrease in Tas1r2 levels produced by adding 0.5 mM sucralose to 0.5 mM glucose. Values = 100% imply that no relative differences in expression levels were detected in cells exposed to a medium containing 0.5 mM glucose + 0.5 mM sucralose compared to cells exposed to a medium containing 0.5 mM glucose; values < 100% imply that significant decreases in expression levels were detected in cells exposed to a medium containing 0.5-mM glucose + 0.5 mM sucralose compared to cells exposed to a medium containing 0.5 mM glucose. Dashed red line depicts the 100% baseline levels. (*All p < 0.05, one-sample t-test against 100%). n.s.: p ≥ 0.05.We then proceeded to assess changes in gene expression levels as a function of glucose concentration in the medium. Specifically, we have quantified the expression levels of taste genes in hypothalamic cells exposed to different concentrations of glucose in the culture medium. We assured that these manipulations in glucose levels were physiologically significant by using concentrations of extracellular glucose close to those found in the rodent hypothalamus during hypo-, eu- and hyperglycemic states (de Vries et al., 2003
). More precisely, we have compared the expression levels of taste genes in hypothalamic cells exposed to a severely hypoglycemic (0.1 mM) medium to those observed in cells exposed to higher glucose levels including eu- and hyperglycemic concentrations (from 0.5 up to 10 mM). Importantly, during these experiments only glucose levels were manipulated, whereas levels of other nutrients including L-amino acids remained unaltered. We have therefore hypothesized that increasing glucose levels in the culture medium would produce a significant reduction in the expression levels of the sweet-specific gene Tas1r2, but not of the other receptor genes, in cultured hypothalamic cells. Consistent with our hypothesis, hypothalamic cells exposed to a 0.5 mM medium expressed significantly lower levels of Tas1r2 compared to those exposed to the 0.1 mM medium (157 ± 21% relative decrease in expression with 0.5 mM medium compared to 0.1 mM medium, one-tailed one-sample t-test against 100%, t = 2.68, df = 4, p < 0.05), whereas no significant changes were observed for Tas1r1 or Tas1r3 (103 ± 6%, t = 0.56, df = 4, p = 0.3 and 116 ± 13%, t = 1.19, df = 4, p = 0.14, respectively, see Figure 5
D). For G-protein gene levels, except for a slight but robust decrease in Gnb3 levels, no other changes were detected (for Gnat3, Gnb3 and Gng13, 106 ± 4%, t = 1.46, df = 4, p = 0.1; 113 ± 4%, t = 2.91, df = 4, p < 0.03 and 113 ± 10%, t = 1.29, df = 4, p = 0.13, respectively, not shown).
A similar pattern holds for the other glucose concentrations used. In fact, hypothalamic cells exposed to a 1.5 mM medium expressed significantly lower levels of Tas1r2 compared to those exposed to the 0.1 mM medium (161 ± 23%, t = 2.61, df = 4, p < 0.03), whereas no significant changes were observed for Tas1r1 or Tas1r3 (99 ± 6%, t = −0.1, df = 4, p = 0.54 and 132 ± 17%, t = 1.81, df = 4, p = 0.07, respectively, see Figure 5
E). No changes were associated in this case with the G-protein gene levels (for Gnat3, Gnb3 and Gng13, 96 ± 6%, t = −0.56, df = 4, p = 0.69; 112 ± 12%, t = 1.0, df = 4, p = 0.18 and 108 ± 8%, t = 1.03, df = 4, p = 0.17, respectively, not shown). Similarly, hypothalamic cells exposed to a 2.5 mM medium expressed significantly lower levels of Tas1r2 compared to those exposed to the 0.1 mM medium (162 ± 21%, t = 2.91, df = 4, p < 0.03), whereas no significant changes were observed for Tas1r1 or Tas1r3 (125 ± 18%, t = 1.39, df = 4, p = 0.11 and 187 ± 54%, t = 1.59, df = 4, p = 0.09, respectively, see Figure 5
F). No changes were associated in this case with the G-protein gene levels (for Gnat3, Gnb3 and Gng13, 126 ± 19%, t = 1.32, df = 4, p = 0.12; 151 ± 31%, t = 1.63, df = 4, p = 0.08 and 124 ± 18%, t = 1.3, df = 4, p = 0.13, respectively, not shown).
The above was still the case for hypothalamic cells exposed to hyperglycemic media. In fact, hypothalamic cells exposed to a 5.0 mM medium expressed significantly lower levels of Tas1r2 compared to those exposed to the 0.1 mM medium (167 ± 15%, t = 4.49, df = 4, p < 0.006), whereas no significant changes were observed for Tas1r1 or Tas1r3, despite the large variance associated with this gene (102 ± 8%, t = 0.28, df = 4, p = 0.39 and 509 ± 375%, t = 1.08, df = 4, p = 0.16, respectively, see Figure 5
G). No changes were associated, once again, with the G-protein gene levels (for Gnat3, Gnb3 and Gng13, 103 ± 2%, t = 1.18, df = 4, p = 0.14; 116 ± 10%, t = 1.57, df = 4, p = 0.09 and 104 ± 7%, t = 0.67, df = 4, p = 0.26, respectively, not shown). Finally, hypothalamic cells exposed to a 10.0 mM medium expressed significantly lower levels of Tas1r2 compared to those exposed to the 0.1 mM medium (227 ± 31%, t = 4.0, df = 4, p < 0.009), whereas no significant changes were observed for Tas1r1 or Tas1r3 (107 ± 4%, t = 1.64, df = 4, p = 0.08 and 128 ± 15%, t = 1.88, df = 4, p = 0.06, respectively, see Figure 5
H). No changes were associated, once more, with the G-protein gene levels (for Gnat3, Gnb3 and Gng13, 109 ± 5%, t = 1.65, df = 4, p = 0.08; 124 ± 18%, t = 1.29, df = 4, p = 0.13 and 112 ± 7%, t = 1.54, df = 4, p = 0.09, respectively, not shown).
It is noticeable from the above results that hypothalamic cells exposed to the hyperglycemic media (5 and 10 mM) seem to express considerably greater decreases in Tas1r2 levels compared to cells exposed to the 1.5 and 2.5 mM euglycemic media (all comparisons with respect to the baseline 0.1 mM medium). In fact, based on the data described in the previous section regarding the comparison between hyperglycemic ob/ob mice and their euglycemic counterparts, one should expect that hypothalamic cells exposed to hyperglycemic media should express considerably greater decreases (with respect to the 0.1 mM medium) in Tas1r2 levels compared to the cells exposed to euglycemic media. In accordance with our hypothesis, a direct comparison between the two conditions revealed that cells exposed to hyperglycemic media expressed significantly greater decreases in Tas1r2 levels compared to cells exposed to euglycemic media (197 ± 19% vs. 161 ± 14%, respectively, one-tailed two-sample t = 1.86, df = 9, p < 0.05). Therefore, although the Tas1r2 levels do not seem to change in strict accordance with fluctuations in extracellular glucose concentrations, this receptor gene does function as a sensor whose expression levels change according to whether glucose levels deviate from euglycemic concentrations, an observation that is consistent with our in vivo studies presented above using ob/ob mice.
We then reasoned that, if sweet taste-like signaling mechanisms do in fact function as monitors of extracellular levels independently of either systemic or intracellular, GK-mediated mechanisms, then adding the non-metabolizable artificial sweetener sucralose to the medium should produce specific decreases in Tas1r2, but not Tas1r1 or Tas1r3, levels. In fact, a one-way ANOVA performed on the percent change data associated with adding sucralose to the 0.5 mM medium revealed a significant main effect of gene (p < 0.04) on the relative changes in gene expression level. Conforming to our initial hypothesis, the larger decreases in gene expression levels produced by adding sucralose to the hypoglycemic medium were observed for the sweet-specific gene Tas1r2 (288 ± 89% of baseline levels), compared to no changes for the L-amino acid specific gene Tas1r1 (99 ± 16%) or Tas1r3 (113 ± 25%, Figure 5
I). No detectable changes in expression were found for taste G-protein-related genes (Gnat3 106 ± 18%, Gng13 105 ± 12% and Gnb3 137 ± 25%, not shown), although the relatively larger although non-statistically significant change in Gnb3 might indicate a possible specific role of this G-protein in sweet taste.
In conclusion, our experiments with cultured cells provide evidence in favor of a functional role for neuron-expressed sweet taste receptors, supporting the more general proposal that neuronal cells can monitor changes in extracellular levels of glucose via sweet taste signaling pathways that are independent of intracellular metabolic events.
Based on the results of the present study, we propose that the brain makes use of nutrient-sensing mechanisms analogous to those known to operate in the periphery, i.e., via G-protein coupled taste receptors and their downstream signaling molecules. More specifically, we have demonstrated that neurons located in different forebrain regions, including the hypothalamus, the hippocampus, the cortex and the habenula, express the genes Tas1r1, Tas1r2 and Tas1r3, that in turn encode for the subunits of the heterodimeric G-protein coupled nutrient-sensing taste receptors T1R1/T1R3 (L-amino acids) and T1R2/T1R3 (sweet, Zhao et al., 2003
). In addition, the genes encoding for the subunits of the taste-specific heterotrimeric G-protein gustducin, formed by α-gustducin (McLaughlin et al., 1992
), Gβ3 and Gγ13 (Huang et al., 1999
), were also found to be expressed in these same brain regions. ISH and IHC analyses revealed a high degree of anatomical overlap between these taste-related genes, strongly suggesting that taste-like signaling mechanisms might be capable of effectively influence neuronal activity. Furthermore, we also provide the first supporting evidence that the levels of expression of taste-related genes are under the control of the nutritional state of animal, since we found that food deprivation and hyperglycemia induced significant changes in expression levels of the Tas1r1 and Tas1r2 genes in the hypothalamus. Finally, the fact that changes in expression levels as a function of nutritional state were restricted to the hypothalamus in turn suggests that taste-like signaling mechanisms in the brain might be involved in the central regulation of homeostatic processes.
Different lines of evidence support the notion that taste signaling molecules might function as chemosensors in different physiological settings. In fact, seminal work by Hofer, Drenckhahn and colleagues provided the first line of evidence that taste-like signaling mechanisms might be used by the gastrointestinal tract to sense the presence of nutrients in the lumen (e.g., Hofer et al., 1996
). They have extended their findings to show that taste mechanisms might also be involved in more general endocrine functions via their expression in the pancreas (Höfer and Drenckhahn, 1998
). Early indication that such taste mechanisms play important physiological functions came with the discovery by Rozengurt and colleagues that the taste G-protein α-gustducin is expressed in PYY- and GLP-1-producing L cells of the intestine (Rozengurt and Sternini, 2007
; Rozengurt et al., 2006
). More recently, it has been shown that taste receptor molecules are richly expressed in the intestinal mucosa, including the sweet receptor T1R2/T1R3 (Bezencon et al., 2007
), where it plays important physiological roles by mediating hormonal responses to the presence of tastants in the lumen (Margolskee et al., 2007
). Of particular interest to our case is the fact that transcript levels of Tas1r2 are strongly reduced following jejunal glucose perfusion in mice (Young et al., 2009
), a result that closely reflects our own findings in hypothalamus (see below). More generally, we propose that an analogous phenomenon to those observed in the gut takes place with respect to neuronal glucosensing, with similar chemosensory mechanisms acting as glucose receptors in disparate physiological settings.
The principle that taste-like signaling mechanisms might play functional roles in the central nervous system also has its precedents. For example, it has been shown that the tongue-expressed PKD2L1, a polycystic-kidney-disease-like ion channel and candidate mammalian sour taste sensor, is also expressed in specific neurons surrounding the central canal of the spinal cord (Huang et al., 2006
). More specifically, it has been demonstrated that the PKD2L1-expressing neurons send terminals to the central canal and trigger action potentials in response to decreases in extracellular pH (Huang et al., 2006
).
Among all brain regions, one would expect that nutrient-sensing taste receptors must be found primarily in the hypothalamus, the master brain circuit controlling body homeostasis (Elmquist et al., 1999
). In fact, our RT quantitative PCR expression data shows that the hypothalamus expresses significantly higher levels of taste-related genes compared to the cortex or hippocampus. Of particular interest was the expression of taste receptors in hypothalamic regions surrounding the ventral aspect of the third ventricle. This privileged anatomical location allows neurons to have proximal access to the contents of the cerebrospinal fluid and to modulate their responses accordingly. In this regard, it is of interest that T1R2 and T1R3 signals were strongly expressed in the paraventricular nucleus of the hypothalamus, a brain region fundamentally implicated in counter-regulatory responses to hypoglycemia. One interesting topic for future investigation concerns the possibility that paraventricular neurons expressing corticotrophin releasing factor (CRF), a secretagogue factor whose liberation by paraventricular neurons eventually results in adrenal discharge via actions on the anterior pituitary (Porterfield and White, 2007
), express sweet taste receptors. CRF release is a fundamental response to deviations from normal glucose levels (McCrimmon, 2008
), and the presence of T1R2 and T1R3 in paraventricular regions known to contain CRF-producing neurons is suggestive of chemosensory functions in this region. Of particular interest will be the testing of the hypothesis that T1R2 knockout mice display abnormal counter-regulatory responses to hypoglycemia due to impaired glucosensing abilities in CRF neurons.
The expression of taste sensors in the hippocampus, on the other hand, is seemingly less likely to have been anticipated. However, it must be noted that several molecular studies demonstrated that the hippocampus is a primary target for ligands that reflect body physiology, including ion balance (calcium, magnesium), insulin, immunity response elements, as well as reproductive, satiety and stress hormones (reviewed in Lathe, 2001
). This argues that a primary, more fundamental role for the hippocampus refers to sensing soluble molecules present in blood and cerebrospinal fluid (Lathe, 2001
). We propose that the currently known list of chemosensory functions of the hippocampus must be expanded to include nutrient sensing. The idea that hippocampal neurons have the ability to sense extracellular levels of nutrients is further corroborated by the fact that, in rats, moderate recurrent hypoglycemia prevented age-related decline in hippocampal-related cognitive functions (McNay et al., 2006
), indicating that hippocampal neurons might functionally detect extracellular levels of glucose in this region.
We note that the Allen Mouse Brain Atlas
1
, a massive ISH project dedicated to map the brain expression of the mouse genome, also displays expression maps for Tas1r genes. However, we believe that our expression analyses add considerably to the brain maps reported in the atlas. First, it is not possible to visualize, from the rather weak and diffuse patterns displayed in the atlas, the expression of hypothalamic taste receptors in proximity to the ventral part of the third ventricle. Among these hypothalamic regions, we must mention as of great interest the paraventricular and arcuate nuclei of the hypothalamus. The expression of taste receptor signals in these hypothalamic regions known to be involved in neuroendocrine control strongly suggests a role for these molecules as glucose sensors in the brain (Porterfield and White, 2007
). A similar observation holds for structures such as the habenula and the choroid plexus. Another crucial piece of information deriving from our IHC analyses – that cannot be readily obtained from the atlas – refers to the neuronal expression of taste receptor proteins. In fact, our analysis is the first one, to our knowledge, to indicate that nutrient sensing in the brain via taste-like signaling pathways might directly influence electrical neuronal activity. This is particularly relevant for the identification of the chemosensors that have the ability to induce hormone release from neuroendocrine neurons of the paraventricular and arcuate nuclei of the hypothalamus during low glycemic levels (see above).
Finally, the results from our in vivo and cell culture experiments indicate that the expression levels of the genes that code for G-protein sweet receptors are under the control of nutritional status. On one hand, our in vivo experiments have shown that nutritional deficiency and excess produce opposing effects on the expression levels of Tas1r1 and Tas1r2, with states of nutrient deficiency being associated with upregulation of transcript levels while the opposite effect on gene levels was observed in obese, hyperglycemic mice. However, it could be argued that such effects depended not on neuronal nutrient sensing per se, but rather on non-specific systemic effects produced for example by chronic nutrient excess. To resolve the issue of whether nutrient sensing occurs in neuronal cells expressing taste receptors independently of systemic factors or synaptic contact, we have compared the expression levels of taste genes in cultured hypothalamic cells exposed to a severely hypoglycemic (0.1 mM) medium to those observed in cells exposed to higher glucose levels including eu- and hyperglycemic concentrations (from 0.5 up to 10 mM). Consistent with our in vivo studies, increasing glucose levels in the culture medium produced a significant reduction in the expression levels of the sweet-specific gene Tas1r2, but not of the other receptor genes (since in these experiments only glucose, but not other nutrients including L-amino acids, levels were manipulated). Although our experiments with cultured cells showed that Tas1r2 levels do not seem to change in strict accordance (i.e., linearly) to fluctuations in extracellular glucose, these experiments demonstrate that this membrane receptor gene does function as a sensor whose expression levels change according to whether glucose levels deviate from euglycemic concentrations. In particular, we have shown that hypothalamic cells exposed to hyperglycemic (5 and 10 mM glucose) media express considerably lower levels of Tas1r2 compared to the cells exposed to euglycemic (1.5 and 2.5 mM) media. This finding might shed further light on the mechanisms underlying deficient central regulation of glucose homeostasis in obese subjects (Elmquist et al., 2005
).
The above effects of extracellular glucose concentrations on Tas1r2 expression levels did not depend on intracellular metabolism of glucose. In fact, the finding that adding the non-metabolizable artificial sweetener sucralose to the cultured cells medium resulted in lower expression levels of Tas1r2, the only sweet-specific gene, but not others, suggest that brain glucosensing might be partially mediated by taste-like signaling pathways that do not depend on metabolic actions of GK, the enzyme considered to function as the primary glucosensor in neurons (Karschin et al., 1997
). Our findings are consistent with several lines of evidence suggesting that glucosensing neurons might use alternative, GK/KATP-independent pathways to respond to local fluctuations in glucose levels (reviewed in Gonzalez et al., 2008
, 2009
). Further studies must determine the extent to which intracellular glucose metabolism might interact with membrane receptors in regulating neuronal responses to extracellular levels of glucose.
Another noticeable aspect of our cell culture experiments relates to the fact that whereas changes in glucose levels or addition of sucralose to the culture medium strongly modulated Tas1r2 expression levels, no such changes were detected in Tas1r3 levels. This result is certainly intriguing given the fact that the sweet taste receptor for glucose is the heterodimer T1R2/T1R3. However, some of the characteristics of T1R3 function might provide some explanation for why no significant variations in Tas1r3 levels were detected as a function of changes in glucose concentrations. It must be noted initially that T1R3 is not a sensory-specific taste gene product; rather, T1R3 has the ability to form dimers with both T1R1 and T1R2, shaping two receptors that, in turn, are sensitive to separate classes of chemicals (Zhao et al., 2003
). T1R1 and T1R2, on the other hand, seem to form dimers exclusively with T1R3. In fact, to our knowledge, no functional T1R1/T1R2 dimers have ever been detected in tongue or other tissue (Zhao et al., 2003
). One could therefore expect that changes in the levels of a certain nutrient can significantly regulate expression levels of a taste gene only to the extent that the gene is specifically associated with the detection of that nutrient. In the case of our experiments using hypothalamic cells lines, changes in glucose levels were induced while leaving L-amino acid levels unaltered. This might be sufficient to prevent the detection of significant changes in expression levels of Tas1r3 since quantitative PCR methods can only determine the overall levels of a given transcript. The above could also explain why in these hypothalamic cells experiments Tas1r2 levels were robustly modulated by glucose while large, although non-significant, variations in Tas1r3 were observed. This observation is in addition consistent with the fact that Tas1r1 levels did not respond to changes in glucose levels. Second, T1R3, unlike T1R1 and T1R2, seems to also have the ability to form T1R3/T1R3 homodimers (Zhao et al., 2003
). In particular T1R3/T1R3 homodimers display sensitivity to sugars only at relatively high concentrations, e.g., >100 mM (Zhao et al., 2003
), which is certainly outside the limits of physiological glucose concentrations in the brain. Although we cannot ascertain, based on transcript levels, that such dimers are expressed in neurons, this is potentially another factor contributing to the insensitivity of Tas1r3 levels to variations of glucose in the brain at physiological limits. Third, we finally note that T1R3 has been recently implicated in calcium detection by taste cells (Tordoff et al., 2008
). Because calcium also acts as a nutritional signal in the brain (Ruat et al., 1995
), it is possible that our experimental treatments did not robustly affect Tas1r3 expression levels because calcium levels have not been explicitly manipulated as an experimental factor. In summary, the lack of specificity of T1R3 to any particular class of nutrients might preclude detection of overall changes in transcript levels of Tas1r3 in response to the experimental treatments used in our study. We furthermore conjecture that a pervasive change in nutrient concentrations in the brain, involving fluctuations in glucose, L- and D-amino acids, and ionic minerals such as calcium and magnesium, are required to produce sizeable changes in brain Tas1r3 levels. We conclude with the speculation that changes in Tas1r2 following variations in brain glucose might enhance the ability of T1R2 to “compete” for dimer formation with T1R3 in detriment of T1R1, although such conjecture has no experimental support at this point.
A similar issue is posed by the lack of significant effects on taste G-protein genes expression levels by changes in nutrient levels. In fact, it appears that all signaling mechanisms downstream to taste G-protein coupled receptors are shared by different classes of chemicals. This holds for the case of both the taste phospholipase PLCβ2 and the non-selective ionic taste channel TRPM5, the deletion of which induces severe impairments in sweet, umami and bitter transduction (Zhang et al., 2003
). Similarly, the G-protein gustducin seems to be important not only for sweet taste signaling, but also for umami and bitter detection (Margolskee et al., 2007
). Therefore, and likewise the T1R3 case presented above, the fact that taste G-proteins might be part of the transduction pathways of different taste qualities might have precluded us from detecting changes in these molecules based on analyses of transcript levels.
In summary, our study provided the first line of evidence that G-protein coupled taste receptors might operate as membrane-bound chemosensors in brain, and in particular that the sweet T1R2/T1R3 receptor is a candidate to be associated with the elusive brain glucose receptor.
The authors declare that the research was conducted in the absence of commercial or financial relationships that could be construed as a potential conflict of interest.
This work has been funded and supported by The John B. Pierce Laboratory. Ligang Zhou is a recipient of a JDRF Research Fellowship. We also thank Jozelia Ferreira for technical assistance with the immunolabeling experiments.
The Supplementary Material for this article can be found online at http://www.frontiersin.org/integrativeneuroscience/paper/10.3389/ neuro.07/012.2009
.
Margolskee, R. F., Dyer, J., Kokrashvili, Z., Salmon, K. S., Ilegems, E., Daly, K., Maillet, E. L., Ninomiya, Y., Mosinger, B., and Shirazi-Beechey, S. P. (2007). T1R3 and gustducin in gut sense sugars to regulate expression of Na+-glucose cotransporter 1. Proc. Natl. Acad. Sci. U. S. A. 104, 15075–15080.