Genotype × Environment Interaction and Stability Analysis for Root Yield in Sweet Potato [Ipomoea batatas (L.) Lam]
 Emmanuel C. Ebem
 Solomon O. Afuape
 Samuel C. Chukwu
 Benjamin E. Ubi
- 1Department of Biotechnology, Ebonyi State University, Abakaliki, Nigeria
- 2National Root Crops Research Institute, Umudike, Nigeria
- 3Department of Crop Production and Landscape Management, Ebonyi State University, Abakaliki, Nigeria
Sweet potato breeding in Africa, more especially in Nigeria, has mainly focused on improving productivity on farmers' fields and on fresh root consumption. In order to target the breeding program, the study was conducted to estimate the magnitude of genotype × environment interaction (G × E) and to select stable and high yielding sweet potato genotypes for fresh root yield and root Cylas severity in two locations, and to identify the most discriminating and representative test environments in Nigeria. The 41 genotypes were evaluated across two diverse environments using a randomized complete block design (RCBD) with three replications. Data were collected on total number of roots per plant, number and weight of marketable roots per plant, fresh root yield, and root Cylas severity. The data were subjected to analysis of variance using the Generalized Linear Model procedure of SAS 9.2 where genotype was treated as a fixed factor and replication treated as a random variable. Stability analysis was conducted using Genotype and Genotype x Environment Interaction (GGE) bi-plot. Environment, genotype, and G × E interaction variances were highly significant (p < 0.01) among the assessed agronomic traits. Moreover, the analysis of variance revealed highly significant (p < 0.01) differences among genotypes, environments, and G × E interaction effects for all the studied traits. The GGE biplot analyses identified three promising genotypes—G13, G11, and G14—that possess both high mean root yield and high stability, closest to the ideal genotype for root performance and consistency of performance across environments. This study provides valuable information that could be utilized in a breeding program to ameliorate local clones of sweet potato in Nigeria.
Introduction
Sweet potato (Ipomoea batatas [L.] Lam), is a hexaploid (2n = 6x = 90) and is one of the most important food security crops globally. It belongs to the family Convolvulaceae, genus Ipomoea, and, according to Vaeasey et al. (2008), the genus has over 600 species, of which batatas is the only one with economic value. In many developing countries, sweet potato is reported to be the fifth most important food crop after rice, wheat, maize, and cassava (Aina et al., 2012). Over 110 million metric tons of sweet potato was produced in 2018, with China producing 53.01 million metric tons representing 65.6% of the world sweet potato production (FAOSTAT, 2018). Africa was responsible for 20.7 million tons which represents about 25.4% of the world production. Nigeria is the second highest sweet potato producer in Africa and the third highest producer in the world, with production of 4.03 million metric tons, which is 5.0% of the world's production (FAOSTAT, 2018). Over the years, sweet potato production has been on the increase in Nigeria. In the last two decades, production has increased 10-fold. However, the increased production can be attributed to the expansion of land under sweet potato cultivation rather than increased yield per unit area, as yield remains abysmally low at an average of <3.0 tons/ha. This low yield is mainly due to the widespread use of obsolete production inputs and methods, chief of which are the use old, unimproved cultivars and the practice of mixed cropping with incompatible crops. Therefore, one important way of mitigating against poor root yield in farmers' fields is to develop and release new sweet potato varieties with stable and high root yield potential into the farming system.
Understanding the differential response of crop genotypes to changing environmental conditions is of key importance in plant breeding. One major step toward the development of improved crop genotypes is the assessment of the nature of interactions that exist between genotypes and the production environment for a particular triat (Sabri et al., 2020). When genotypes are evaluated across a range of different locations and/or years, their yield performances could differ significantly. The existence of large G × E interaction usually causes serious confounding effects in comparing and recommending good genotypes for wide adaptation (Moussa et al., 2011). Previous G × E studies on several traits have demonstrated that sweet potato is sensitive to environmental changes. According to Madawal et al. (2015), Gurmu et al. (2017), and Ngailo et al. (2019), changes in environmental conditions have been reported to affect sweet potato storage root yield and yield components. This makes the analysis for G × E interaction crucial for genotype selection, cultivar release, and identification of suitable production environments for optimum yield. Therefore, having a basic understanding on G × E interactions, stability parameters, and genetic correlations for root yield and yield components are considered necessary for sweet potato breeders in making an informed choice concerning which locations and input systems should be used in their breeding efforts (Gruneberg et al., 2005).
Statistical tools such as the Additive Main Effect and Multiplicative Interaction (AMMI) (Gauch, 1992) and genotype and genotype-by-environment interaction (GGE) biplot analyses (Yan and Kang, 2003; Yan and Tinker, 2006) have been reported as appropriate for use in GEI analyses. These statistical tools have then been extensively used in several sweet potato improvement programs by authors such as Caliskan et al. (2007) (AMMI model analysis for GEI and stability analysis of sweet potato genotypes across different environments in Turkey) and Laurie and Booyse (2015) (GGE biplots used in and identifying suitable sweet potato genotypes and representative environments in South Africa). The objective of this study, therefore, was to determine the magnitude of GEI for storage root yield, yield-related traits, and sweet potato weevil (Cylas spp.) damage among candidate sweet potato genotypes, as well as to assess the adaptability and stability of 41 improved sweet potato genotypes in two sweet potato representative and contrasting production environments.
Materials and Methods
Plant Materials
Forty-one sweet potato genotypes comprising breeding lines, farmer cultivars, and released varieties (checks) were used for the trials. The genotypes were selected based on their high root dry matter contents (RDMC), flesh color (as an indicator of the level of β-carotene content), and fresh root yield.
Research Locations
The field evaluation was conducted in two consecutive seasons at two different locations of Abakaliki (Ebonyi State) and National Root Crops Research Institute (NRCRI) (Iresi Osun State). The two locations differed in ecological characteristics, altitude, rainfall, and atmospheric temperature; the climate could be described as hot humid tropic, with high humidity and adequate rainfall (Table 1).

Table 1. Weather information of the research locations.
Field Layout and Experimental Design
The field trial was conducted using a randomized complete block design (RCBD) with three replications. The experimental plots consisted of a three—row plot of three meters long for each genotype. The spacing between rows was 1.0 m and within rows was 0.3 m, giving a total of 10 plants per row and 30 plants per plot (Afuape et al., 2019). The sweet potato was planted in June and harvested in October in 2018 and 2019 in Abakaliki, Ebonyi state (rain forest belt) and Iresi, Osun state (savannah transition ecology) for 2 years. The experiment was conducted under rain-fed conditions. Fertilizer (NPK 15:15:15) was applied at the rate of 400 kg/ha in the test sites, while weeding was done as necessary.
Quality Traits Analysis
The sweet potato genotypes evaluated in Abakaliki were analyzed for chemical quality traits. Dry matter content was determined according to Seruwu (2012), crude protein, fiber, and ash content were determined using the micro Kjeldahl method of AOAC (2010), while fat content was determined according to AOAC (2010) soxhlet extraction method. Carbohydrate was determined using Gravimetric Copper Reduction Method (AOAC, 2010; Okporie et al., 2013). Total carotenoid content of the sweet potato genotypes was determined by the procedure described by Amaya (2001).
Data Collection and Analysis
Agronomic data (number and weight of marketable and unmarketable roots, sweet potato root Cylas severity) were collected and subjected to analysis of variance (ANOVA) using the Generalized Linear Model procedure of SAS 9.2 where genotype was treated as a fixed factor and replication treated as a random variable according to the model of Steel and Torrie (1980). Number of marketable (or saleable) roots represents the number of roots that were more than or equal to 100 g (Levette, 1993) or with diameters at the widest point >25 mm roots. These were counted and the number recorded per plot. Number of unmarketable roots represents the number of roots that are <100 g or 25 mm at the widest point (Levette, 1993; Stathers et al., 2003). Weight of marketable roots is the weight (kg/plot) of roots suitable for marketing. Weight of unmarketable roots is the weight (kg/plot) of roots not suitable for marketing. Total root yield (t/ha) weight is obtained as the sum of weights of marketable and unmarketable roots converted to tons per hectare. Severity of root Cylas infection was taken as the mean damage level of SPVD-diseased plants in a plot on a 1–5 infection scale where 1= no apparent damage, 2 = mild/very little damage, 3 = moderate damage, 4 = considerable/severe damage, and 5 = severe/very severe damage (Mwanga et al., 2002).
The agronomic data were first analyzed on a location basis since the variances of the two locations were significantly different following a Bartlett's test for homogeneity of the variances of the two locations. The Least Square (LS) means of the genotypes in each location were estimated and separated using standard error of difference (SED). However, the 41 genotypes were then analyzed as a combined trial to increase the resolving power of the estimate of genotype × environment interaction across the two locations and years.
The ANOVA model used for the single-site analysis is as stated below:
where
yij = observation on experimental unit in block k assigned treatments i and j;
μ = overall mean averaged over all treatments and all blocks;
αi = effect of genotype i; considered as fixed variable;
γj = effect of year j considered as random variable;
βk = effect of block k considered as random variable;
eijk = random error associated with experimental units assigned to treatments i and j in block k.
The ANOVA table and expected mean squares for combined sites and population are as shown in Table 2.
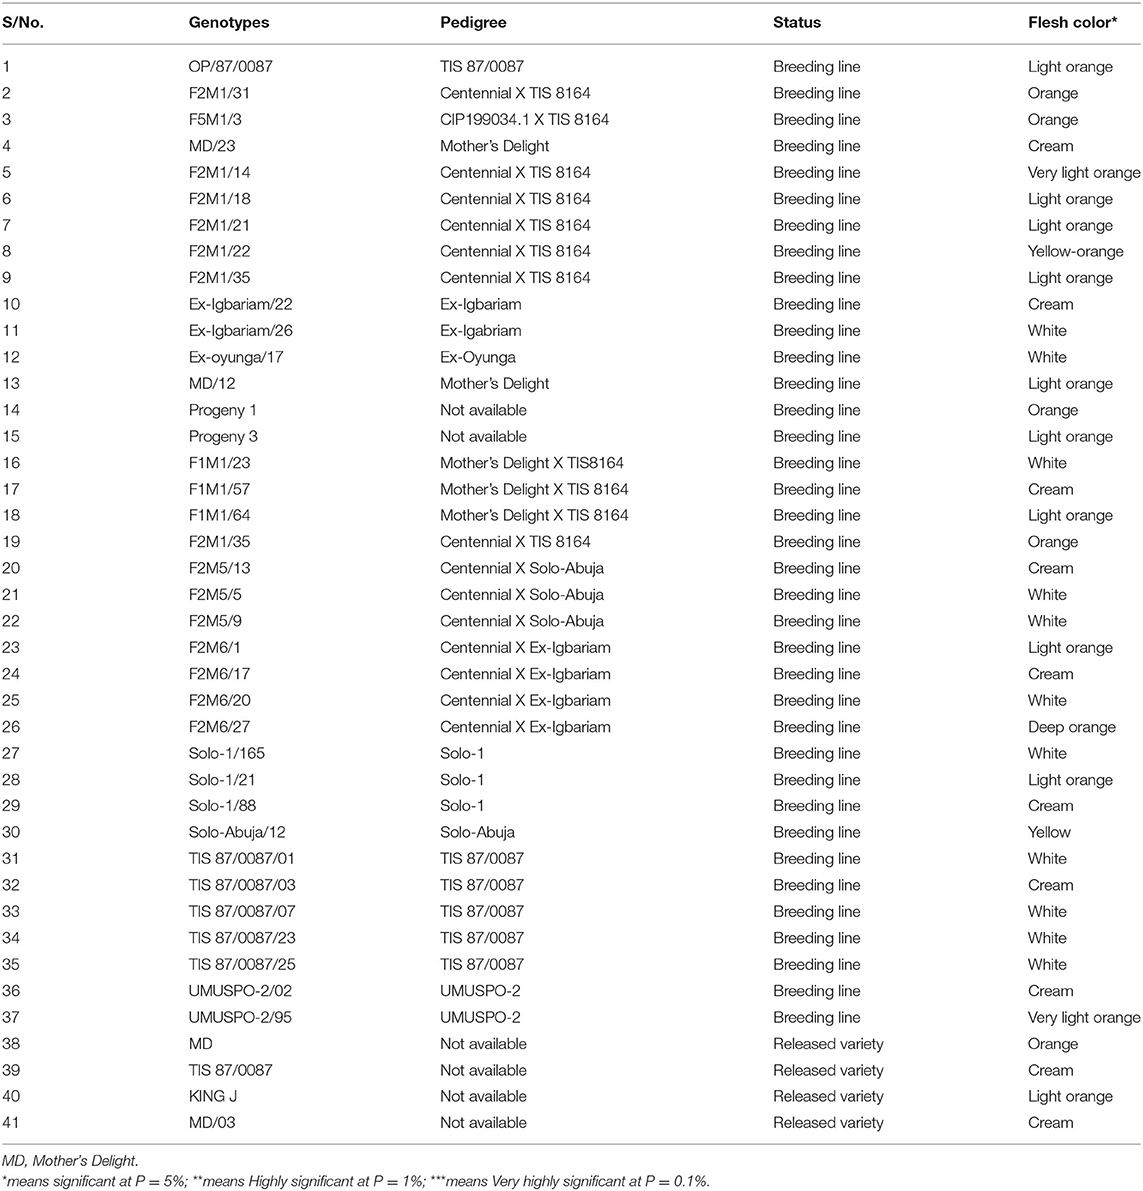
Table 2. Description (background information) of sweet potato genotypes used for the study.
Genotype × Environment Interaction (GEI) and Stability Analysis
The data generated were analyzed for GEI using GenStat (14th edition) GGE biplot procedure (Yan, 2001, 2002; Yan and Ma, 2006). The model for the GGE biplot based on singular value decomposition (SVD) of t principal components is:
where Yij is the measure of the ith genotype in the jth environment, μ is the grand mean, αi is the main effect of the ith genotype, βj is the main effect of the jth environment, and jij is the interaction between the ith genotype and jth environment.
Results
The mean squares of the analyses of variance (ANOVA) of the agronomic traits evaluated in two different locations (Abakaliki and Iresi) revealed that there were significant (p < 0.01) variations among the genotypes for all the traits in each location and across both locations (Tables 3–5). The combined analysis (Table 6) also showed that all the agronomic traits varied with respect to genotype, the location, and Genotype-by-Location Interaction. Correlation coefficients for the agronomic traits evaluated in the two locations and 2 years are presented in Table 7. Generally, all the traits except root Cylas spp. severity exhibited a positive and significant (p < 0.01) correlation with root yield. Most of the traits also exhibited significant and positive association among themselves, except root Cylas spp. severity at harvest which did not correlate with all other traits.
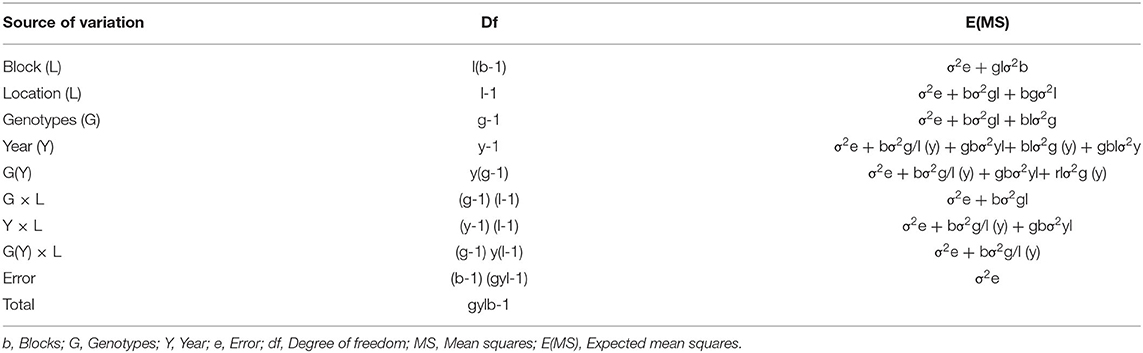
Table 3. Format of ANOVA Table for combined sites and population.
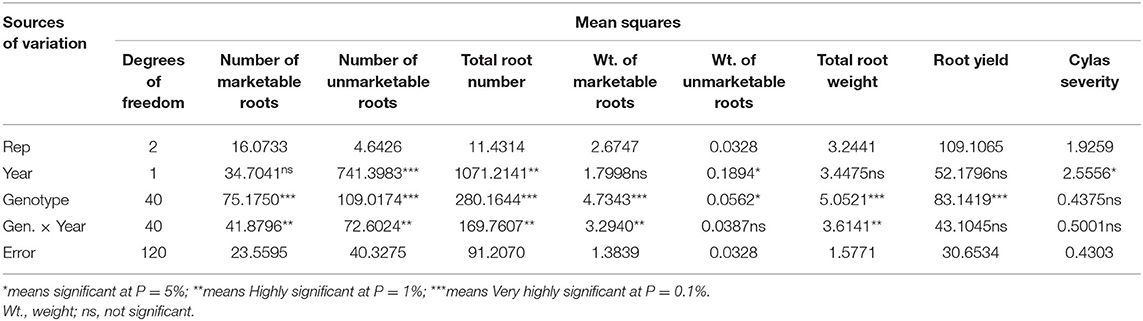
Table 4. Mean squares of the analyses of variance of agronomic traits of sweet potato genotypes evaluated at Abakaliki across 2 years.
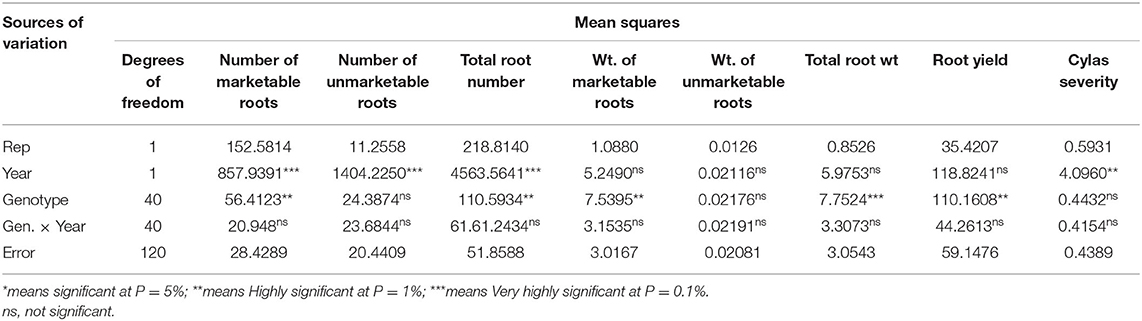
Table 5. Mean squares of the analyses of variance of agronomic traits of sweet potato genotypes evaluated at Iresi, Osun State across 2 years.
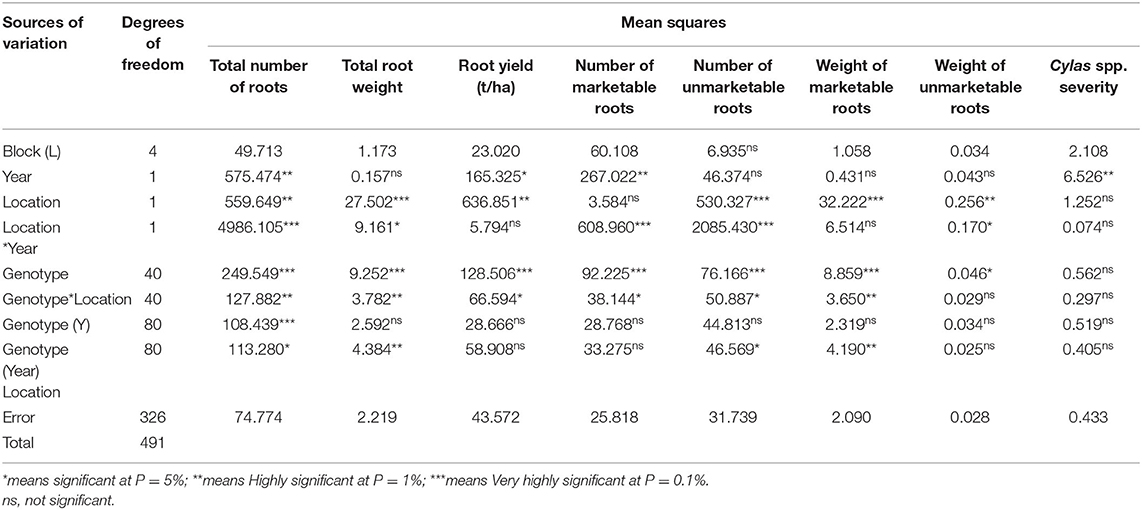
Table 6. Mean squares of the analysis of variance of sweet potato genotypes evaluated for root yield and yield components at two locations in 2 years.
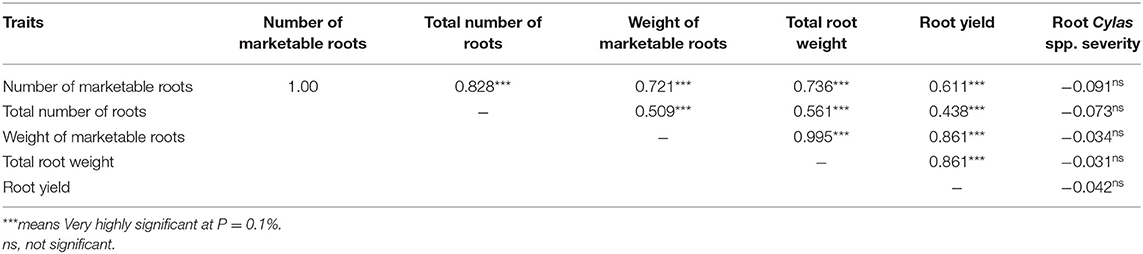
Table 7. Combined Pearson correlation coefficients (r) of agronomic traits evaluated in two locations and 2 years.
Genetic Studies
The genotypic (Vg), environmental (Ve), and phenotypic (Vp) variances, as well as the broad sense heritability (HB) estimates of the agronomic traits at each and combined locations, are presented in Tables 8–10. For all the agronomic traits in each location and across locations, Ve was higher than Vg. Heritability estimate for number of marketable roots at Abakaliki was 0.44, while at Iresi it was 0.69. The broad-sense heritability (HB) estimates for number of unmarketable roots were 0.33 and 0.02 at Abakaliki and Iresi, respectively, and 0.30 and 0.74 for weight of marketable roots at Abakaliki and Iresi, respectively. HB for root yield at Abakaliki and Iresi, respectively, were 0.48 and 0.81. Understanding the genetic parameters of the traits that impact on farmers and consumers' variety preference is a good guide during the selection of parental lines. Table 9 shows the genotypic, phenotypic, and environmental variances and the broad sense heritability estimates (HB) of the agronomic traits in both locations. The result in Table 9 shows that environmental variances (Ve) were slightly higher than genotypic variance (Vg) for all traits at both locations, depicting environmental influence on the expression of the traits. The heritability (HB) estimates were either low or high and ranged between 0.02 and 0.52 for all the agronomic traits.
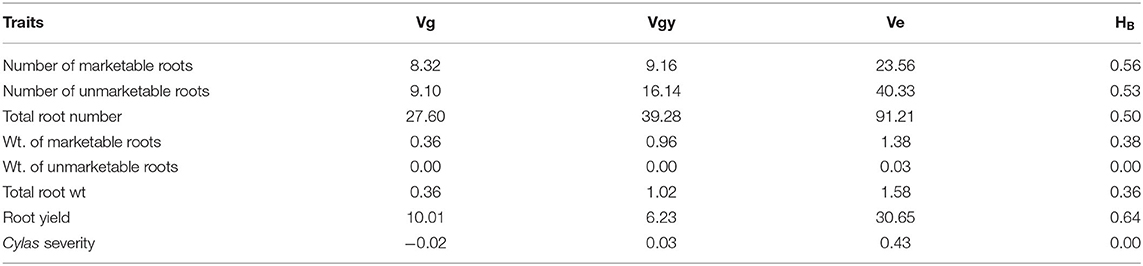
Table 8. Variance components and broad-sense heritability estimates of agronomic traits of sweet potato genotypes evaluated at Abakaliki, Ebonyi State across 2 years.
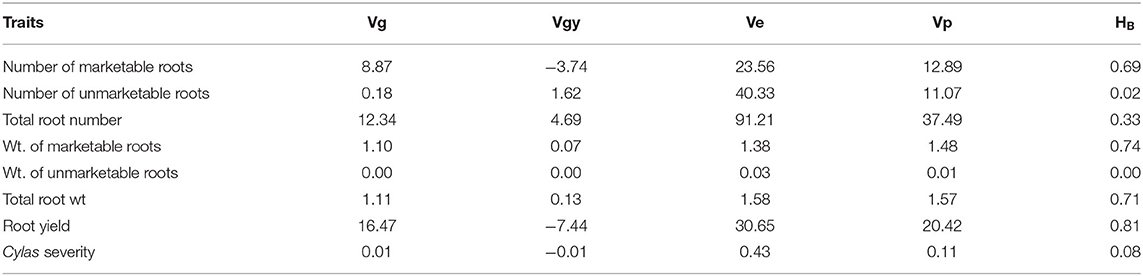
Table 9. Variance components and broad-sense heritability estimates of agronomic traits of sweet potato genotypes evaluated at Iresi, Osun State across 2 years.
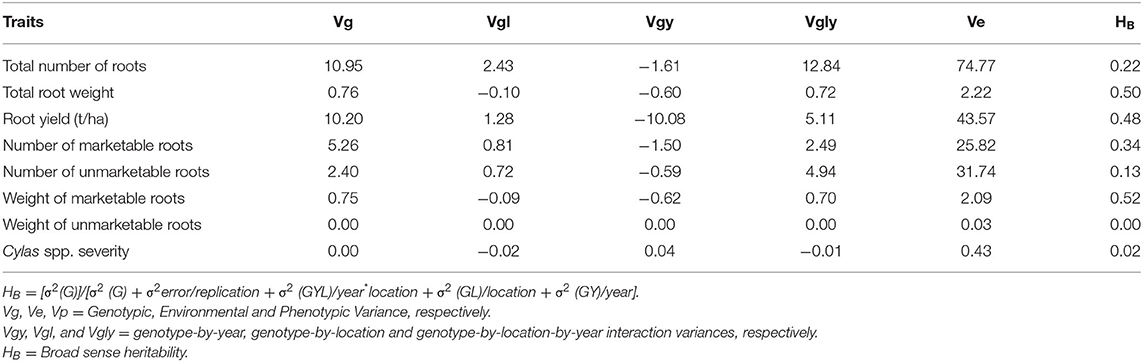
Table 10. Variance components and broad-sense heritability estimates of agronomic traits of sweet potato genotypes evaluated across two locations and years.
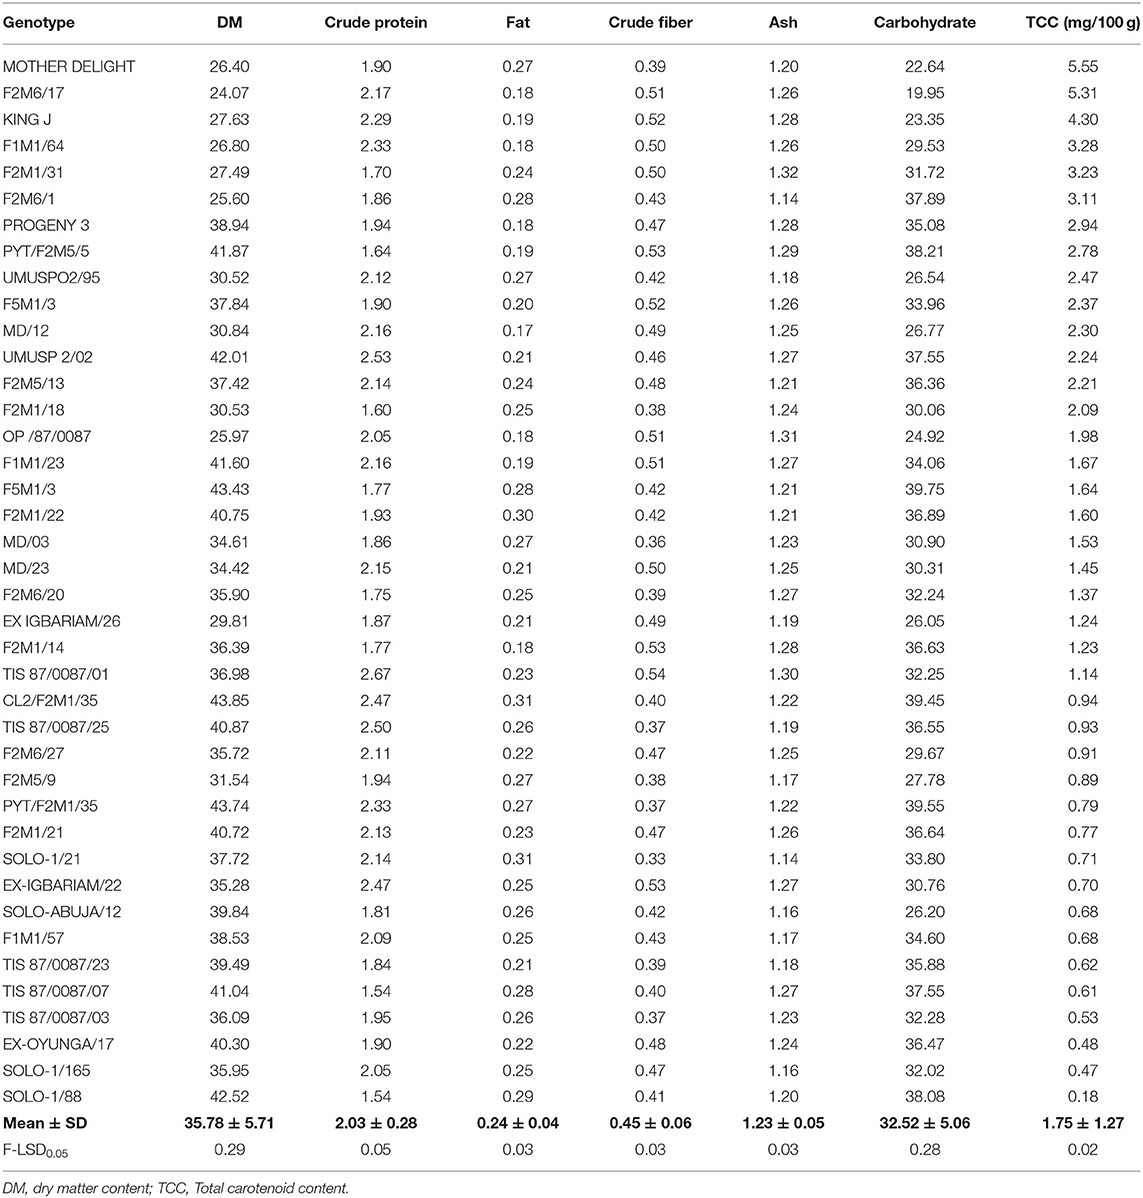
Table 11. Analyses of some chemical quality traits of the Sweet potato genotypes evaluated at Abakaliki across 2 years.
Genotype and Genotype by Environment (GGE) Biplots
Storage Root Yield
The GGE biplot analyses (which-won-where, mean, stability, and genotype ranking) for storage root yield are presented in Figures 1A–C. Figure 1A shows the “which-won-where” root yield performance of the sweet potato genotypes evaluated in the four environments. The two principal components (Axis 1 and 2) revealed about 73% of the total variation observed with Axis 1 accounting for 50% of the total variation, while Axis 2 influenced 23% of the observed variation. Genotype G11 had the highest root yield performance at Iresi 1 and Iresi 2 environments, while G14 was best adapted to the two Abakaliki environments as both were located at the vertices of the polygon in the environments (Yan and Tinker, 2006; Ngailo et al., 2019). Genotype G13 was second best in all the environments. The three genotypes were better than the rest in all the environments.
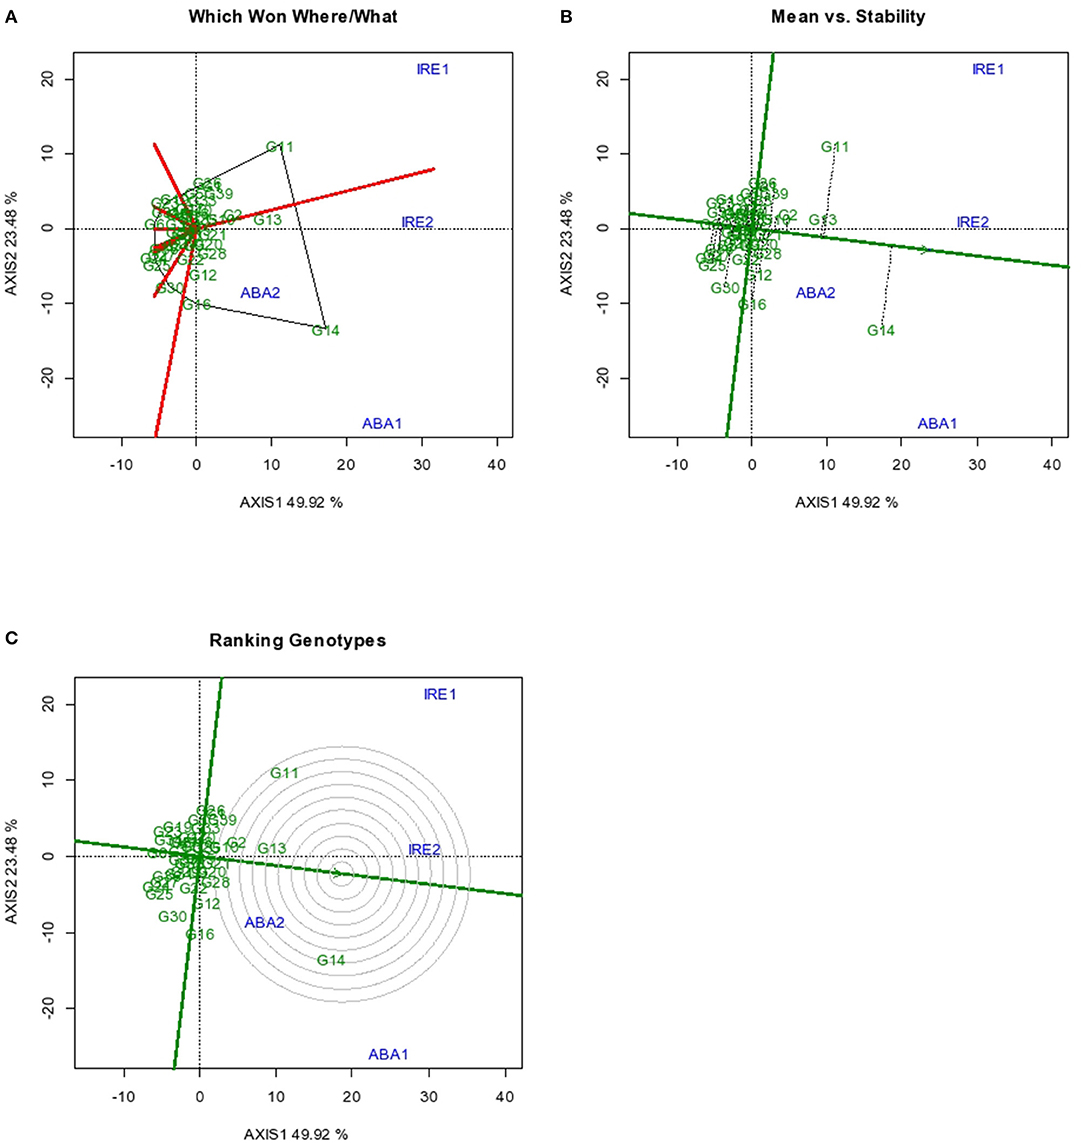
Figure 1. GGE Biplot for root yield indicating (A) superior genotype in a particular environment (B) Mean vs. Stability (C) ranking of genotypes. Codes of genotypes and environments are presented in Table 11.
The GGE biplot “Mean vs. Stability” results are as presented in Figure 1B. The result showed that G14 had the highest mean root yield across all environments, followed by G11 and G13. The other genotypes had mean root yield around the grand mean value by their relative locations in the biplot. Among the genotypes with high mean root yield, G13 was the most stable, with G11 and G14 exhibiting marked variability in root yield in the various environments. However, there were some genotypes with high stability, but their mean root yields were very poor. According to Yan and Tinker (2006), only stable genotypes with high mean performance are desirable.
An ideal genotype should have both high mean performance and high stability across environments. The center of the concentric circle (Figure 1C) is the location for the ideal genotype. Among the test genotypes, the one closest to the point is the best. Though G14 had the highest storage root yield among the 41 genotypes, G13 that possessed both high mean root yield and high stability is closest to the ideal genotype for root yield with consistency of performance across environments.
Root Cylas spp. Severity
The GGE biplot results for the severity of sweet potato root Cylas damage are as presented in Figures 2A–C. The two principal component axes used for making the biplots accounted for 62% of the total variation, with Axis 1 and Axis 2 accounting for 38.09 and 24.77% of the total variation, respectively. For root Cylas spp. severity, genotypes with high and positive axis 1 scores entailed high susceptibility and those with negative axis 1 were mostly resistant. Sweet potato root Cylas spp. severity has been reported to be a major factor that affects the production of sweet potato in Africa (Gibson et al., 1998). Root Cylas damage is further enhanced by the cultivation of infested genotypes and a lack of efficient control measures which, in addition, result in low sweet potato yields in many countries. Improved sweet potato genotypes that are resistant to root Cylas severity with high yield potential would increase sweet potato production in sub-Sahara Africa (Rukundo et al., 2017; Ngailo et al., 2019).
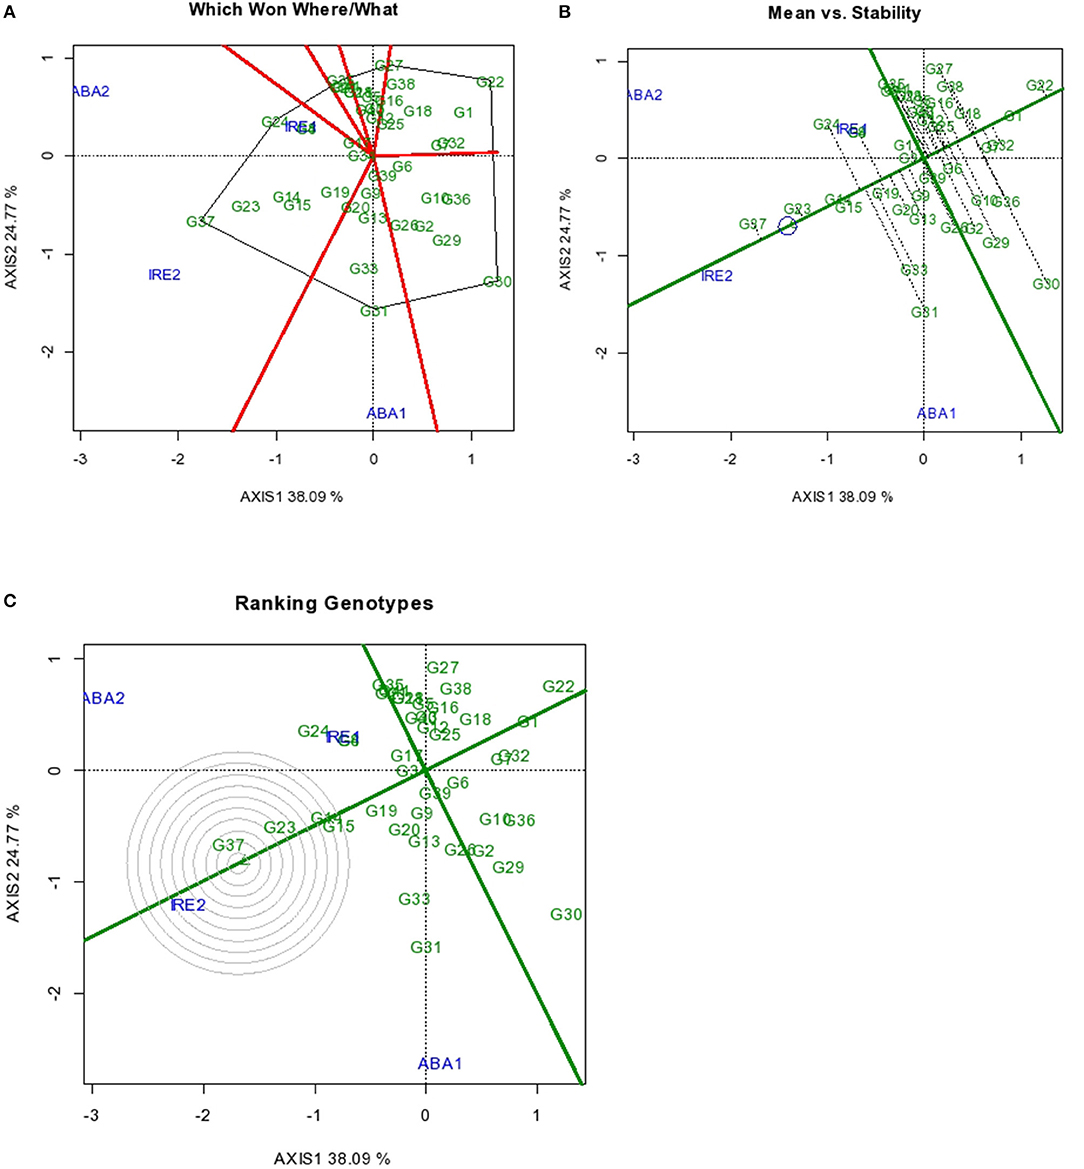
Figure 2. GGE Biplot for root Cylas spp. indicating (A) superior genotype in a particular environment (B) Mean vs. Stability (C) ranking of genotypes. Codes of genotypes and environments are presented in Table 11.
The GGE biplot that analyzed for genotype performance in a specific environment (which-won-where) showed that G24 had the least Cylas spp. damage in environments IRE 1 and ABA 2, while G37 and G31 exhibited least root damage in IRE 2 and ABA 1, respectively (Figure 2A). Genotypes G22 and G30 had the most severe Cylas spp. damage across environments. The differential expression of tolerance by the genotypes in different environments is unexpected as tolerance to Cylas spp. is known to be largely influenced by strong environmental control.
Across all environments, G37 also had the least mean Cylas spp. damage, followed by G23, G14, and G15 in that order (Figure 2B). The four genotypes also exhibited high Cylas spp. tolerance stability, thereby enhancing the probability of identifying highly tolerant genotypes that could be deployed across many environments. These genotypes can form an elite genetic resource pool in the global efforts toward the genetic control of Cylas spp. damage in sweet potato.
Overall, G37 can be ranked as the most tolerant genotype to Cylas spp. damage due to its position very close to the center of the concentric circle that represents the “ideal genotype” (Yan and Tinker, 2006). The ranking of the leading genotypes according to their tolerance to Cylas spp. damage performance can be given as: G37 > G23 > G14 > G15. Figures 3, 4 describe the severity of root Cylas spp. in Abakaliki and Iresi Osun State, respectively.
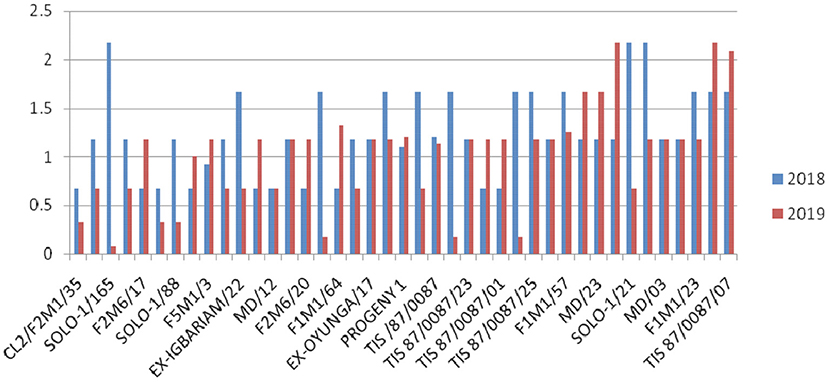
Figure 3. Root Cylas spp. severity in Abakaliki across 2 years.
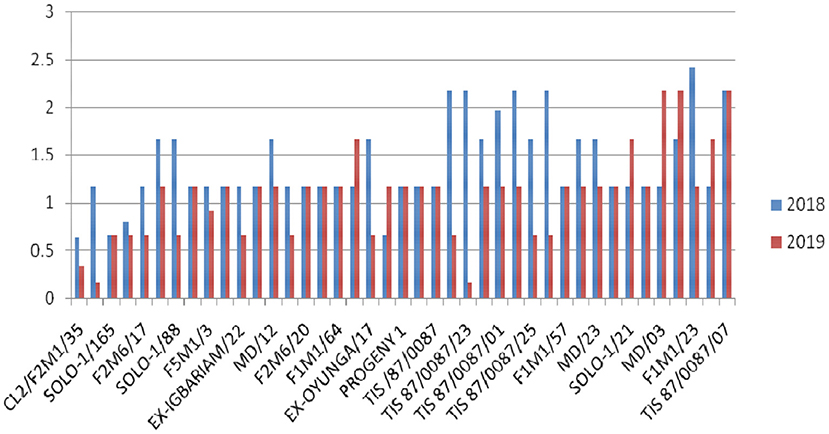
Figure 4. Root Cylas spp. severity in Iresi Osun State across 2 years.
Discussion
Genetic variability is essential for selection (Sarif et al., 2020). Except for Cylas weevil damage severity (in all environments) and weight of unmarketable roots (in some environments), significant variation exists among the genotypes evaluated for all the traits, an occurrence that has also been reported by Vimala et al. (2011), Madawal et al. (2015), and Afuape et al. (2019). In this study, year as a factor exerted a reducing influence on the agronomic traits. Cylas weevil damage severity is largely controlled by the environment as genetic resistance to Cylas weevil is still unavailable. By its epidemiology, Cylas spp. incidence and severity occurs in the dry season when soil moisture level is very low (Stathers et al., 2003). This explains the observed large environmental variance (0.43) compared to the genotypic variance (0.00), and the extremely low broad-sense heritability estimate (0.02) recorded in this study for the trait. The very low genotypic variance (0.00) and heritability estimate (HB = 0.00) for weight of unmarketable roots (roots <100 g) also portend that environment is largely responsible for the formation of small sweet potato roots. This is true as plant density, drought spell, and poor weed management among other factors could lead to the formation of small storage roots.
The genetic study reveals that environmental variance (Ve) was higher than genotypic variance (Vg), leading to moderate broad sense heritability (HB) estimates in both locations and in the combined form. As HB estimate is a reflection of the genetic component of an observed phenotype expression of a trait, the moderate HB in the combined genotype-location-year interaction analysis depicts that genetic gain could be achieved in such important traits as total root weight (HB = 0.5), weight of marketable roots (0.52), root yield (0.46), and number of marketable roots (0.34). Moderate heritability is often deemed acceptable for quantitative traits (Tumwegamire et al., 2011) and has been variously reported for most root yield and yield components by Tumwegamire et al. (2011) and Afuape et al. (2019). The observed differences in the HB estimates for each trait in both locations shows that location affects trait heritability estimates, with poor environment lowering the value by confounding the true genotypic value with non-experiment wise errors which could lead to selection error in the breeding cycle.
Correlation coefficient is a measure of the extent and direction of the relationship between any two traits (variables). The positive and strong relationships between root yield and number of marketable roots (r = 0.786), total number of roots (r = 0.438), marketable roots (r = 0.861), and total root weight (r = 0.861) suggests that these traits are important root yield components, and that their simultaneous selection will be a good approach to increasing root yield. This same relationship had been observed by Afuape et al. (2011) and Yahaya et al. (2015). As the severity of Cylas spp. is a yield-reducing affect, the negative correlation observed between it and root yield and yield components is expected as severely infested fields often exhibit reduced plant density at harvest, severe reduction in root weight, significant reduction in good roots, and impaired plant physiological processes due to severed food translocation organs, as infested plants often have the vine cortex and pith eaten up by the Cylas weevil larvae developing inside the plant.
The stability analysis aims at helping the breeder to identify which genotypes have specific and/or general adaptability to various production environments. It also helps in the analyses of the test environments for prudent decision making for future evaluations. As expected, the two locations (Iresi and Abakaliki) clustered in different quadrants, depicting that both locations are truly different. The Iresi environments (IRE 1 and IRE 2) were higher performing environments for root yield and Cylas damage suppression compared to the Abakaliki environments (ABA 1 and ABA 2). The differences between these locations were so large that year effect could not nullify it, meaning that testing data from one location cannot represent the performance of same materials in the other location, irrespective of the number of years used in the testing process. As different genotypes performed differently in each of these locations, we are able to identify genotypes that are specifically adapted to each environment, knowledge that will help breeders to adequately advise farmers on what cultivar to use where, provided the various cultivars possess acceptable end-user quality preferences. Conducting a stability analyses has thus helped in identifying specific genotypes for both locations, as well as a stable genotype that can be cultivated across all the locations tested and locations that share similar attributes to the test locations.
Dry matter content according to Mok et al. (1997) and Cervantes-Flores et al. (2011) is among the main attributes that further improve the quality and acceptability of sweet potato for consumption and processing in sub-Sahara Africa. The dry matter content ranged from 43.85% (F2M1/35) to 24.07% (F2M6/17) and varied significantly (p < 0.0001) between the sweet potato genotypes. Findings from this study are in accord with records reported by Okunade et al. (2019) in Osun (21.35–42.10%) and Kanu et al. (2018) in Umudike, Abia State (27.30–41.56%), but disagrees with the result (19.4–22.6%) reported by Laurie et al. (2013) for some OFSPs. The low dry matter content recorded in F2M6/17 could be a result of the presence of high moisture in the tuber. Factors such as variety, crop season, age of the plant, and location could affect dry matter content in sweet potato. According to Eleazu and Ironua (2013), high dry matter content improves storability, texture, and product yield. It also has the potential of being utilized for industrial purposes and for flour production in confectioneries. Proteins are essential nutrients for structural and functional performers of different biomolecules in the human body, and they provide the essential amino acids required for metabolism. The protein content recorded in this study varied significantly (p < 0.0001) across the forty sweet potato genotypes. Results from this study revealed that protein was highest in TIS 87/0087/01 (2.67%), followed by UMUSP 2/02 (2.53%), and lowest in SOLO-1/88 (1.54%). This result correlated well with reports credited to Rakesh et al. (2017) in some sweet potato cultivars. Studies show that protein content in sweet potato, especially orange fresh sweet potato (OFSP), is comparable to cassava (1.6%) and yam (1.5) (Woolfe, 2008).
The fat content among the forty sweet potato varieties ranged between 0.17 to 0.31% and showed significant (p < 0.0001) differences among the genotypes. The fat content was high in solo-1/21 (0.31%) while fat was least in the MD/12 genotype with 0.17%. The results of fat content from this study were in agreement with Ishida et al. (2000) and Mohammad et al. (2016), who reported 0.17–0.30% and 0.2–0.33%, respectively. Sweet potato, like other known roots and tubers, is well-known for its low fat content. The fat concentration of some sweet potato, especially the orange fresh sweet potato, are still little better than other roots and tubers such as cassava (0.28%) and yam (0.17%) (USDA, 2018). Crude fiber, which is also an important indicator of a healthy food material that plays a major role in reducing the incidences of colon cancer, diabetes, heart disease, and certain digestive diseases, were observed in an appreciable amount. The crude fiber content of the sweet potato ranged from 0.33% (in SOLO-1/21) to 0.54% (in TIS 87/0087/01) and was significantly different among the genotypes. This result is in line with 0.35% reported by Endrias et al. (2016) for different varieties of OFSP.
Ash is an inorganic residue in any food substance which directly denotes the mineral content. The sweet potato has a reasonable amount of ash content, an indication of rich mineral constituents. The ash value varied from 1.14% (in F2M6/1 and SOLO-1/21) to 1.32% (in F2M1/31). The ash values obtained from this study were in line with the results reported by Mohammad et al. (2016), who recorded 1.17–1.31% ash content. Carbohydrate was among the most abundant nutritive constituent of the sweet potato. This is consistent with previous reports credited to Adepoju and Adejumo (2015), Amha and Baruch (2016), and Endrias et al. (2016). The carbohydrate content obtained from this study ranged from 19.95% in F2M6/17 to 39.75% in F5M1/3 and varied significantly among the genotypes, indicating that they are a good source of energy. This study is within FAO Corporate Document Repository carbohydrate range but appreciably higher than 21 and 25% for nine orange-fleshed sweet potato varieties grown in Bangladesh by Mohammad et al. (2016).
There was high variation among the genotypes with respect to total carotene content. The orange fleshed sweet potato recorded among the genotypes had the highest amount of total carotene content. The amount of total carotenoid content of the roots ranged from 0.18 to 5.55 mg. Highest total carotene content was observed in Mother Delight with 5.55 mg/100 g (fresh weight basis), followed by F2M6/17 (5.31 mg/100 g) which are orange fleshed, and was lower in genotype Ex- Oyunga/17 (0.48 mg/100 g), Solo-1/165 (0.47 mg/100 g), and Solo-1/88 (0.18 mg/100 g). This result agrees with the findings of Adepoju and Adejumo (2015), Mohammad et al. (2016), and Islam et al. (2016) but inconsistent with Donado-Pestana et al. (2012) who reported 0.390 to 8.823 mg/100 g.
Conclusion
The current study determined the magnitude of genotype-by-environment interaction and stability for storage root yield and root Cylas severity. Since most sweet potato breeding programs are often tailored toward the development of high yielding, biotic and abiotic resistance and/or tolerance, this work has identified G14 as a high yielding and Cylas spp. tolerant genotype that is stable for both traits. These combined attributes will make it possible for its deployment across many environments. Genotypes such as G11 and G13 could be cultivated in environments with low Cylas spp. pressure as they are highly productive but exhibit low Cylas spp. tolerance. Genotypes G24, G37, and G31, which had average yield but high and stable tolerance to Cylas damage, could be used as elite germplasm toward the development of new varieties that combine high yield and Cylas tolerance. In general, the knowledge and extent of the genotype-by-environment interaction (GEI) provided by this study would assist breeders in deploying limited resources in the right varietal development cycle. This study suggests that deploying resources into conducting genotype testing in many locations and years would be a worthwhile investment.
Data Availability Statement
The original contributions presented in the study are included in the article/supplementary material, further inquiries can be directed to the corresponding author/s.
Author Contributions
All authors listed have made a substantial, direct and intellectual contribution to the work, and approved it for publication.
Conflict of Interest
The authors declare that the research was conducted in the absence of any commercial or financial relationships that could be construed as a potential conflict of interest.
References
Adepoju, A. L., and Adejumo, B. A. (2015). Some proximate properties of sweet potato (Ipomoea batatas L) as influenced by cooking methods. Int. J. Sci. Technol. Res. 4, 2277–8616.
Afuape, S. O., Okocha, P. I., and Njoku, D. (2011). Multivariate assessment of the agromorphological variability and yield components among sweet potato (Ipomoea batatas (L.) Lam) landraces. Afr. J. Plant Sci. 5, 123–132. doi: 10.9734/AJEA/2014/5827
Afuape, S. O., Tongoona, P. B., Asante, I. K., Egesi, C. N., Nwaigwe, G., and Offei, S. K. (2019). Breeding new sweetpotato genotypes combining elevated content of two antagonistic traits of high dry matter and beta-carotene content in a high root yield background. Euphytica 215, 211–224. doi: 10.1007/s10681-019-2532-0
Aina, A. J., Falade, K. O., Akingbala, J. O., and Titus, P. (2012). Physicochemical properties of Caribbean sweetpotato (Ipomoea batatas (L) Lam) starches. Food Bioprocess Technol, 5, 576–583. doi: 10.1007/s11947-009-0316-6
Amaya, D. R. (2001). A Guide to Carotenoid Analysis in Foods, 1st Edn. Washington, DC: ILSI Press, 1–59.
Amha, A., and Baruch, R. (2016). Evaluation of proximate composition of sweet potato [Ipomoea batatas (L.) Lam] for better utilization through agro-food processing chain. Glob. J. Anim. Breed. Genet. 4, 248–255.
AOAC (2010). Official Methods of Analysis of the Association of Official Analytical Chemists, eds S. Williams. Rockville, MD; VA: AOAC Inc.
Caliskan, S. M., Aslan, M., Uremis, I., and Caliskan, M. E. (2007). The effect of row spacing on yield and yield components of full season and double cropped soybean. Turk. J. Agric. For. 31, 147–154.
Cervantes-Flores, J. C., Sosinski, B., Pecota, K. V., Mwanga, R. O. M., Catignani, G. L., Truong, V. D., et al. (2011). Identification of quantitative trait loci for dry matter, starch, and β-carotene content in sweet potato. Mol. Breed. 28, 201–216. doi: 10.1007/s11032-010-9474-5
Donado-Pestana, C. M., Salgado, J. M., de Oliveira Rios, A., dos-Santos, P. R., and Jablonski, A. (2012). Stability of carotenoids, total phenolics and in vitro antioxidant capacity in the thermal processing of orange-fleshed sweet potato (Ipomoea batatas Lam.) cultivars grown in Brazil. Plant Foods Hum. Nutr. 67, 262–270. doi: 10.1007/s11130-012-0298-9
Eleazu, C. O., and Ironua, C. (2013). Composition and antioxidant properties of a sweetpotato variety (Ipomoea batatas L) commercially sold in South Eastern Nigeria. Afr. J. Biotechnol. 12, 720–727. doi: 10.5897/AJB12.2935
Endrias, D., Negussie, R., and Gulelat, D. (2016). Comparison of three sweet potato (Ipomoea batatas (L.) Lam) varieties on nutritional and anti-nutritional factors. Glob. J. Sci. Front. Res. D Agric. Vet. 16, 1–11. doi: 10.1016/j.trstmh.2006.05.010
FAOSTAT (2018). Food and Agricultural Organization of the United Nations, Production Statistics. Available online at: http://faostat.fao.org/ (accessed August 5, 2019).
Gauch, H. G. (1992). Statistical Analysis of Regional Yield Trials:AMMI Analysis of Factorial Designs. Amsterdam: Elsevier.
Gibson, R. W., Mpembe, I., Alicai, T., Carey, E. E., Mwanga, R. O. M., and Seal, S. E. (1998). Vetten Symptoms, aetiology and serological analysis of sweetpotato virus disease in Uganda Plant Pathol. 47, 95–102. doi: 10.1046/j.1365-3059.1998.00196.x
Gruneberg, W. J., Manrique, K., Zhang, D., and Hermann, M. (2005). Genotype X environment interactions for a diverse set of sweetpotato clones evaluated across vary-ing eco-geographic conditions in Peru. Crop Sci. 45, 2160–2171. doi: 10.2135/cropsci2003.0533
Gurmu, F., Hussein, S., and Laing, M. (2017). Genotype-by-environment interaction and stability of sweetpotato genotypes for root dry matter, b-carotene and fresh root yield. Open Agric. 2, 473–485. doi: 10.1515/opag-2017-0052
Ishida, H., Suzuno, H., Sugiyama, N., Innami, S., Tadokoro, T., and Mae-kawa, A. (2000). Nutritive evaluation on chemical components of leaves, stalks, and stems of sweet potatoes (Ipomoea batatas Poir) Food Chemistry 68, 359–367. doi: 10.1016/S0308-8146(99)00206-X
Islam, S. N., Nusrat, T., Begum, P., and Ahsan, M. (2016). Carotenoids and β-carotene in orange fleshed sweet potato: a possible solution to vitamin A deficiency. Food Chem. 199, 628–631. doi: 10.1016/j.foodchem.2015.12.057
Kanu, N. A., Afuape, S. O., Ezeocha, V. C., and Nwafor, J. O. (2018). Proximate composition and functional properties of improved orange-fleshed sweetpotato breeding lines developed in Umudike, Abia State. Nigeria Agric. J. 49, 125–133.
Laurie, S. M., and Booyse, M. (2015). Employing the GGE SREG model plus Elston index values for multiple trait selection in sweetpotato. Euphytica 204, 1–10. doi: 10.1007/s10681-015-1359-6
Laurie, S. M., Faber, M., Calitz, F. J., Moelich, E. I., Muller, N., and Labuschagne, M. T. (2013). The use of sensory attributes, sugar content, instrumental data and consumer acceptability in selection of sweet potato varieties. J. Sci. Food Agric. 93, 1610–1619. doi: 10.1002/jsfa.5932
Levette, M. P. (1993). The effects of methods of plant cuttings of sweet potato (Ipomoea batatas (L) Lam) on yield. Tropical Agric. Trinidad 70, 110–115.
Madawal, S. I., Madarakhandi, T. B. S., and Narasannavar, A. (2015). Genetic variability study in sweetpotato (Ipomoea batatas L.) genotypes. Int. J. Trop Agric. 33, 279–282.
Mohammad, K. A., Ziaul, H. R., and Sheikh, N. I. (2016). Comparison of the proximate composition, total carotenoids and total polyphenol content of nine orange-fleshed sweet potato varieties grown in Bangladesh. Foods 5, 64–75. doi: 10.3390/foods5030064
Mok, I. G., Zhang, D., and Carey, E. E. (1997). “Sweet potato breeding strategy of CIP,” in Proceedings of International Workshop on Sweet Potato Production System Towards the 21st Century, 9–27.
Moussa, S. A. M., Hala, A. A. E., and Nashwa, I. A. E. (2011). Stability study of sweetpotato yield and its component characters under different environments by joint regression analysis. J. Horticult. Sci. Ornamental Plants 3, 43–54. doi: 10.5897/AJMR11.054
Mwanga, R. O. M., Yencho, G. C., and Moyer, J. W. (2002). Diallel analysis of sweepotato resistance to sweetpotato virus dis-ease. Euphytica 128, 237–248. doi: 10.1023/A:1020828421757
Ngailo, S., Shimelis, H., Sibiya, J., Mtunda, K., and Mashilo, J. (2019). Genotype-by environment interaction of newly-developed sweet potato genotypes for storage root yield, yield-related traits and resistance to sweet potato virus disease. Heliyon 5:e01448. doi: 10.1016/j.heliyon.2019.e01448
Okporie, E. O., Chukwu, S. C., and Onyishi, G. C. (2013). Phenotypic recurrent selection for increase yield and chemical constituents of maize (Zea mays L.). World Appl. Sci. J. 21, 994–999. doi: 10.5829/idosi.wasj.2013.21.7.2863
Okunade, A. F., Alfonso, O. C., Afuape, S. O., Abimbola, O. O., and Salawu, I. A. (2019). Effect of vine harvesting regimes on root proximate composition of three sweetpotato varieties. Nigerian Agric. J. 50, 1–9.
Rakesh, K., Narendra, K., Sudhir, K., Amitesh, K. S., and Bohra, J. S. (2017). Effect of NPKS and Zn fertilization on, growth, yield and quality of baby corn-a review. Int. J. Curr. Microbiol. Appl. Sci. 6, 1392–1428. doi: 10.20546/ijcmas.2017.603.161
Rukundo, P., Shimelis, H., Laing, M., and Gahakwa, D. (2017). Combining ability, maternal effects, and heritability of drought tolerance, yield and yield components in sweetpotato. Front. Plant Sci. 7:1981. doi: 10.3389/fpls.2016.01981
Sabri, R. S., Rafii, M. Y., Ismail, M. R., Yusuff, O., Chukwu, S. C., and Hasan, N. (2020). Assessment of agro-morphologic performance, genetic parameters and clustering pattern of newly developed blast resistant rice lines tested in four environments. Agronomy 10:1098. doi: 10.3390/agronomy10081098
Sarif, H. M., Rafii, M. Y., Ramli, A., Oladosu, Y., Musa, H. M., Rahim, H. A., et al. (2020). Genetic diversity and variability among pigmented rice germplasm using molecular marker and morphological traits. Biotechnol. Biotechnol. Equip. 34, 747–762. doi: 10.1080/13102818.2020.1804451
Seruwu, G. (2012). Breeding of sweetpotato [Ipomoea batatas (L.) Lam.] for storage root yield and resistance to Alternaria leaf petiole and stem blight (Alternaria spp.) in Uganda (Ph.D. thesis), University of KwaZulu-Natal, Pietermaritzburg.
Stathers, T. E., Rees, D., Nyango, A., Kiozya, H., Mbilinyi, L., Jeremiah, S., et al. (2003). Sweet potato infestation by Cylas spp. In East Africa: II. Investigating the role of root characteristics. Int. J. Pest Manage. 49, 141–146. doi: 10.1080/0967087021000043094
Steel, R. G. D., and Torrie, J. A. (1980). Principles and Procedures of Statistics, 2nd Edn. New York, NY: McGraw-Hill, 183–193.
Tumwegamire, S., Kapinga, R., Rubaihayo, P. R., LaBonte, D. R., Gruneberg, W. J., Burgos, G., et al. (2011). Evaluation of dry matter, protein, starch, sucrose, b-carotene, iron, zinc, calcium, and magnesium in East African sweetpotato [Ipomoea batatas (L.) Lam] germplasm. HortScience 46, 348–357. doi: 10.21273/HORTSCI.46.3.348
USDA (2018). National Nutrient Database for Standard Reference, Release 20, 2018. Available online at: http://www.nal.usda.gov/fnic/foodcomp/search
Vaeasey, E. A., Borges, A., Rosa, M. S., Queiroz-Silva, J. R., Bressan, E. A., and Peroni, N. (2008). Genetic diversity in Brazilian sweetpotato (Ipomoea batatas (L.) Lam., Solanales, Convolvulaceae) landraces assessed within microsatellite markers. Genet. Mol. Biol. 31, 725–733. doi: 10.1590/S1415-47572008000400020
Vimala, B., Nambisan, B., and Hariprakash, B. (2011). Retention of carotenoids in orange-fleshed sweet potato during processing. J. Food Sci. Technol. 48, 520–524. doi: 10.1007/s13197-011-0323-2
Woolfe, A. J. (2008). Sweet Potato: An Untapped Food Resource, 2nd Edn. New York, NY: Cambridge University Press.
Yahaya, S. U., Saad, A. M., Mohammed, S. G., and Afuafe, S. O. (2015). Growth and yield components of sweet potato (Ipomoea batatas L.) and their relationships with root yield. Am. J. Exp. Agric. 9, 1–7. doi: 10.9734/AJEA/2015/20078
Yan, W. (2001). GGE biplot: a windows application for graphical analysis of multi-environment trial data and other types of two-way data. Agron. J. 93, 1111–1118. doi: 10.2134/agronj2001.9351111x
Yan, W. (2002). Singular-value partitioning in biplot analysis of multi-environment trial data. Agron. J. 94, 990–996. doi: 10.2134/agronj2002.0990
Yan, W., and Kang, M. S. (2003). GGE Biplot Analysis: A Graphical Tool for Breeders, Geneticists, and Agronomists. Boca Raton, FL: CRC Press.
Yan, W., and Ma, B. L. (2006). Model Diagnosis and GGE Biplot Analysis. Eastern Cereal and Oilseed Research Centre, Agriculture and Agri-food Canada.
Keywords: sweet potato, yield, environment, GGE biplot, genotypes
Citation: Ebem EC, Afuape SO, Chukwu SC and Ubi BE (2021) Genotype × Environment Interaction and Stability Analysis for Root Yield in Sweet Potato [Ipomoea batatas (L.) Lam]. Front. Agron. 3:665564. doi: 10.3389/fagro.2021.665564
Received: 12 February 2021; Accepted: 21 April 2021;
Published: 04 June 2021.
Edited by:
Stephan Haefele, Rothamsted Research, United KingdomReviewed by:
Adnan Noor Shah, Anhui Agricultural University, ChinaAnket Sharma, University of Maryland, College Park, United States
Copyright © 2021 Ebem, Afuape, Chukwu and Ubi. This is an open-access article distributed under the terms of the Creative Commons Attribution License (CC BY). The use, distribution or reproduction in other forums is permitted, provided the original author(s) and the copyright owner(s) are credited and that the original publication in this journal is cited, in accordance with accepted academic practice. No use, distribution or reproduction is permitted which does not comply with these terms.
*Correspondence: Benjamin E. Ubi, ben.ubi@ebsu.edu.ng