Model-based climate change adaptational potential and productivity of some cowpea genotypes and its sensitivity to bias adjustment
 Grace Adusei
 Moses Kwame Aidoo3
  Amit Kumar Srivastava
 Thomas Gaiser
- 1West African Science Service Centre on Climate Change and Adapted Land Use (WASCAL), Council for Scientific and Industrial Research (CSIR) Office Complex, Cantonments Accra, Ghana
- 2Institute of Crop Science and Resource Conservation, University of Bonn, Bonn, Germany
- 3Physiology and Biochemistry Division, Cocoa Research Institute of Ghana, New Tafo-Akim, Ghana
- 4Council for Scientific and Industrial Research, Crop Research Institute, Kumasi, Ghana
Grain legumes are essential for the protein supply to an ever-growing population in Africa. However, little is known about the adaptational potential and thus resilience to abiotic stress of major grain legumes under future climatic change for the evaluation of climate change impact and adaptation. This study assessed the adaptation potential of some cowpea genotypes to future climate change in the moist (Kumasi—Ghana) and dry savanna (Ouagadougou—Burkina Faso) biomes of West Africa based on a validated process-based SIMPLACE model using the output of four global circulation models (GCMs) for two shared socioeconomic pathways (SSPs, i.e., ssp126 and 585). In addition, it assesses the sensitivity of the cowpea model to bias corrections of the GCM outputs. In comparison of future socioeconomic pathways with historic time series, the use of bias-corrected climate model output slightly increased the rate of the phenological development of the genotypes in the future period except in Ouagadougou, in the ssp585 scenario. Without bias correction, this increase of the rate of phenological development in the future scenarios was less pronounced. With bias correction, the total aboveground biomass and yield of all genotypes were reduced in both SSPs. The change in the average water stress and phosphorous stress were genotype specific. Despite a general yield decline in both SSPs, the genotypes Asontem and GH6060 exhibited the adaptational potential to future climate change in the moist and dry savanna biomes. This is by a higher accumulation of total aboveground biomass, higher yield, and tolerance to high temperature as well as high water use and photosynthetic efficiency due to higher atmospheric carbon dioxide concentrations, despite faster phenological development.
1 Introduction
Cowpea has been reported to be an important food legume, particularly in West and Central Africa (Ewansiha and Singh, 2006). The legume is well adapted and thrives well under various abiotic stress conditions such as water deficit, high temperature, and poor soil fertility (Agbicodo et al., 2009; Adusei et al., 2021). This has been attributed to the physiological alteration of the plant in response to such field conditions (Hartmann et al., 2018; Adusei et al., 2021). However, exposing cowpea to future climate change is likely to exceed the crop’s adaptive capacity to drought, high temperatures, and other environmental stresses (Niang et al., 2014). For instance, there have been several reports that indicated that, under expected future climatic conditions, the frequency of extreme temperatures may lead to an increase in heat stress, evapotranspiration, and water demand, particularly in the Sahel and some parts of the Savannah biomes of Africa (Frimpong and Kerr, 2015). Global climate change is known to impact all sectors of the global economy in the coming decades, and most effects of these impacts will be felt in the agricultural and water sectors, which will result in food insecurity in the developing world (Ringler, 2008; Nelson et al., 2009). Therefore, to mitigate this problem, there is a need to select highly adaptive crops and cultivars with high water use and photosynthetic efficiency, high root growth, and reduced maturity for climate change conditions.
Process-based crop models are mostly employed to estimate the effects of climate change and the robustness of crops. The models use essential physiological plant growth parameters for both operational and seasonal predictions of the growth, development, and yield of crops and their adaptational mechanisms. However, climate model outputs are, in many instances, affected by both systematic and random errors or biases, which prevent them from correctly simulating the occurrence and intensity of extremes such as droughts, high temperature, and high-intensity precipitation events on the growth, development, and yield of crops. Climate model bias can be defined as the systematic difference between a simulated climate statistic and the corresponding real-world climate statistic. A model bias estimated from the climate model and observational data through statistics and calculations are mostly affected by internal variability of the model generated by the GCM (Maraun et al., 2010; Teutschbein and Seibert, 2013). In most cases, it is necessary to employ some form of bias correction, sometimes referred to as bias adjustment, because many crop-related processes are non-linear or are limited by absolute threshold values. If climate conditions exceed such threshold values, the rates of the processes may be strongly reduced or zero, and, in the worst case, this is lethal to the crop. Part of the origins of bias correction is model output statistics in numerical weather prediction, which complements the widely used perfect diagnostic statistical downscaling methods (Maraun, 2016). Bias correction can be relatively simple or complex and may require low or very expensive computational demand and thus depend strongly on the bias correction method employed (Laux et al., 2021). Moreover, growing databases of global and regional climate model simulations have become more and more accessible and popular in climate impact research. In recent years, different methods have been developed (Maraun et al., 2010; Teutschbein and Seibert, 2012) and widely used in postprocessing climate projections (Hempel et al., 2013; Harding et al., 2014; Maurer et al., 2014).
Delta change, direct methods, quantile mapping (QM), and the simple parametric methods (MA—adjust only the mean and MVA—adjust the mean and variance) are some of the methods that have been developed and used for model bias correction (Maraun, 2016). QM and two other methods, MA and MVA, were employed by Iturbide et al. (2020) to assess the effect of bias adjustment on the projected changes in temperature extremes, and they concluded that bias adjustment amplifies the magnitude of the climate change trend in achieving a more plausible representation of future heat threshold–based indices. Casanueva et al. (2020) showed how to better preserve raw signals of climate models for the different indices and variables considered (not all preserved by construction) using eight standard and state-of-the-art bias adjustment methods for a case study in the Iberian Peninsula. However, any of these methods overlooked the sensitivity to observational reference and the effect of resolution mismatch between model and observations and this has made the modeling of climate change difficult since there is no clear understanding of how these methods may affect key magnitudes such as climate change signals and different sources of ambiguity. The objective of this study, therefore, is to (1) assess the adaptation potential of some cowpea genotypes to future climate change in the moist and dry savanna biomes of West Africa based on a validated process-based cowpea crop model using the output of four GCMs for two shared socioeconomic pathways (SSPs) and (2) to identify the sensitivity of the cowpea model and the adaptation potential of the cowpea genotypes to the bias correction of the climate model output. This study complements the measures in stabilizing the internal variability of crop models and handles some problems associated with absolute threshold values in modeling cowpea and other leguminous plants for adaptation. The study also addresses the sensitivity to the observation reference and mismatch between the model and observations.
2 Materials and methods
2.1 Experimental design and planting materials
In 2017/18 and 2018/19, two field experiments with 10 different cowpea genotypes and contrasting water and P-supply were carried out in Kumasi. The two field trials were conducted in a split-plot design with three factors (P fertilizer application levels, water regimes, and cowpea genotypes) with three replicates. Physical and chemical soil analyses were performed on soil sampled from four different soil depths before the beginning of the field experiments. The cowpea genotypes used for the first and second experiments were planted on 23rd December 2017 and 29th December 2018, respectively. The seeds of the cowpea genotype were surface-sterilized before planting. Cowpea genotypes constituted the main plot, while P fertilizer and water constituted the subplot. The experimental units comprised a total of four combinations of P fertilizer and water treatments (60P + non water stress (NSW), 60P + water stress (WS), 0P + NWS, and 0P + WS). Harvesting was done manually in both experiments 60 days after planting onward depending on the physiological maturity of the genotypes. The details of the treatments and their agronomic management have been fully described by Adusei et al. (2021). In this study, four cowpea genotypes were selected from 10 genotypes reported by Adusei et al. (2021) based on their performance (best: Asontem and GH6060, worst: Hans adua and Nketewade). The selection criterion was phenology (days to anthesis and maturity), aboveground biomass, and the yield of 10 cowpea genotypes. The data were bias-corrected to eliminate the potential of bias that is mainly associated to climate model output through the differences in the mode formation, internal model variability generated by the RCM or GCM.
2.2 Method of bias correction
Global climate models have systematic errors (biases) in their output. For example, an overestimation of rainy days in climate models mostly tends to underrate the rainfall extremes (Maraun et al., 2010). There can be errors in the timing of the monsoon or the amount of seasonal rainfall, or temperatures can be consistently too high or too low. To overcome the large biases in climate models, a range of bias correction methods have been developed. However, in the current study, we used QM since this method extends the correction from means (local intensity scaling, LOCI) to the entire distribution of the data. QM corrects for errors in the shape of the distribution and is therefore capable to correct the errors in variability as well. This quantile-based approach originates from the empirical transformation of Panofsky and Brier (1968) and was successfully implemented in hydrological applications (Dettinger et al., 2004; Wood et al., 2004; Boe et al., 2007) but recently also for the error correction of RCMs (Dobler and Ahrens, 2008; Piani et al., 2010). As this purely empirical QM only maps modeled values to observed values, no new extremes (outside the observed range) can be obtained. This is a suitable approach for our study since we apply the correction to a historical hindcast simulation. For applications to future climate simulations, however, some kind of extrapolation beyond the range of observations has to be added to allow for ‘new extremes’ (e.g., Boe et al., 2007).
2.3 Crop model configuration and boundary conditions for the simulations
2.3.1 Model description
The Scientific Impact Assessment and Modeling Platform for Advanced Crop and Ecosystem Management (SIMPLACE) crop model was developed by a consortium of European research organizations and institutions led by the University of Bonn, Germany. The consortium includes the Institute of Crop Science and Resource Conservation–Germany, the Research Centre Jülich–Germany, the Thünen Institute of Climate-Smart Agriculture, the Leibniz Centre for Agricultural Landscape Research–Germany, and Wageningen University & Research in the Netherlands, among others. The SIMPLACE crop model is capable of simulating a wide range of crops, including cereals (e.g., wheat and barley), oilseed crops (e.g., rapeseed and sunflower), legumes (e.g., soybean, pea, and cowpea), root crops (e.g., sugar beet and potato). The model is designed to simulate the growth and development of crops under different environmental and management conditions, including climate, soil, irrigation, and fertilizer inputs.
Some of the main features of the SIMPLACE model include the ability to simulate plant growth and development, water uptake and transport, nutrient uptake and cycling, and carbon allocation. The model also includes modules for simulating crop responses to environmental stresses such as drought, heat, and nutrient deficiency, as well as crop management practices such as fertilization, irrigation, and tillage. SIMPLACE is designed to be flexible and modular, allowing users to incorporate their data and models into the simulation framework. It automates sensitivity and calibration with XML-based configuration. SIMPLACE has flexible data input and output interfaces including a database, CSV, Excel, and XML. The SIMPLACE model has the ability to simulate the effects of different environmental stressors on crop growth and development, including water and nutrient stress.
The experimental data were bias-corrected, and the model solution SIMPLACE<Penman-Monteith, SlimWater, NPKdemandSlimNP, SoilCN> within the general modeling framework SIMPLACE (Gaiser et al., 2013, www.simplace.net) was used to simulate a continuous cowpea cropping system over the respective periods. The model solution includes (1) Lintul5 routines for simulating biomass, phenology, and plant nutrient uptake, (2) SLIM for simulating soil water and root growth dynamics, as well as the balance of mineral nitrogen and phosphorus (Williams and Izaurralde, 2006); and (3) SoilCN extended by P routines for organic P turnover was used to simulate the dynamics of organic C, N, and P in the soil (Corbeels et al., 2005). Thermal time above a defined base temperature was chosen in simulating crop phenology. Potential evapotranspiration was calculated using the Penman–Monteith method by Food and Agriculture Organisation (FAO) (Allen et al., 1998). Stress indices were estimated daily for water and nutrient limitations and ranged from 0.0 to 1.0; details are described in Adusei et al. (2022).
Two SPPs were used for this work, which are SSP 126 and SSP 585. SSP126 and SSP585 are two of the SSPs developed by the Intergovernmental Panel on Climate Change to explore different scenarios of future socioeconomic development and their potential impact on greenhouse gas emissions and climate change. SSP126 is a pathway that describes a world with low levels of greenhouse gas emissions, where there is a shift toward sustainable development, greater social equality, and reduced material consumption. In this scenario, global population growth slows, and there is a greater focus on renewable energy, energy efficiency, and low-carbon transportation. This pathway aims to limit global warming to 1.6°C above pre-industrial levels by 2100. On the other hand; SSP585 is a pathway that describes a future with high levels of greenhouse gas emissions and limited climate action. It assumes that current trends in economic growth, consumption, and technology continue, resulting in high levels of energy demand and continued reliance on fossil fuels. This scenario projects a global temperature increases of 4.3°C by 2100 above pre-industrial levels. In summary, the key difference between SSP126 and SSP585 is the level of ambition in mitigating greenhouse gas emissions and adapting to the impacts of climate change. SSP126 represents a world where significant climate action is taken to limit global warming, while SSP585 represents a future with little action taken to address climate change, resulting in more severe impacts.
We chose SSP126 and SSP585 since they encapsulate the spectrum of the extreme policy scenarios (i.e., a low level of greenhouse gas emission to a high level of greenhouse gas emission) leading to a different level of radiative forcing representing a low to stronger climate warming effect, giving the opportunity to estimate the impacts on crop yields in contrasting scenarios.
2.3.2 Model parameterizations
Most of the default parameters that are known to characterize cowpea in the Lintul5 model (Wolf, 2012) were used. To the best of our knowledge, there has not been any study or publication with Lintul5 for cowpea simulation. Thus, most of the parameters that were adjusted were based on literature and field measurements of other leguminous plants, and some values were manually adjusted to adapt them to the local conditions and the genotypes tested in this study (Tables 1, 2).
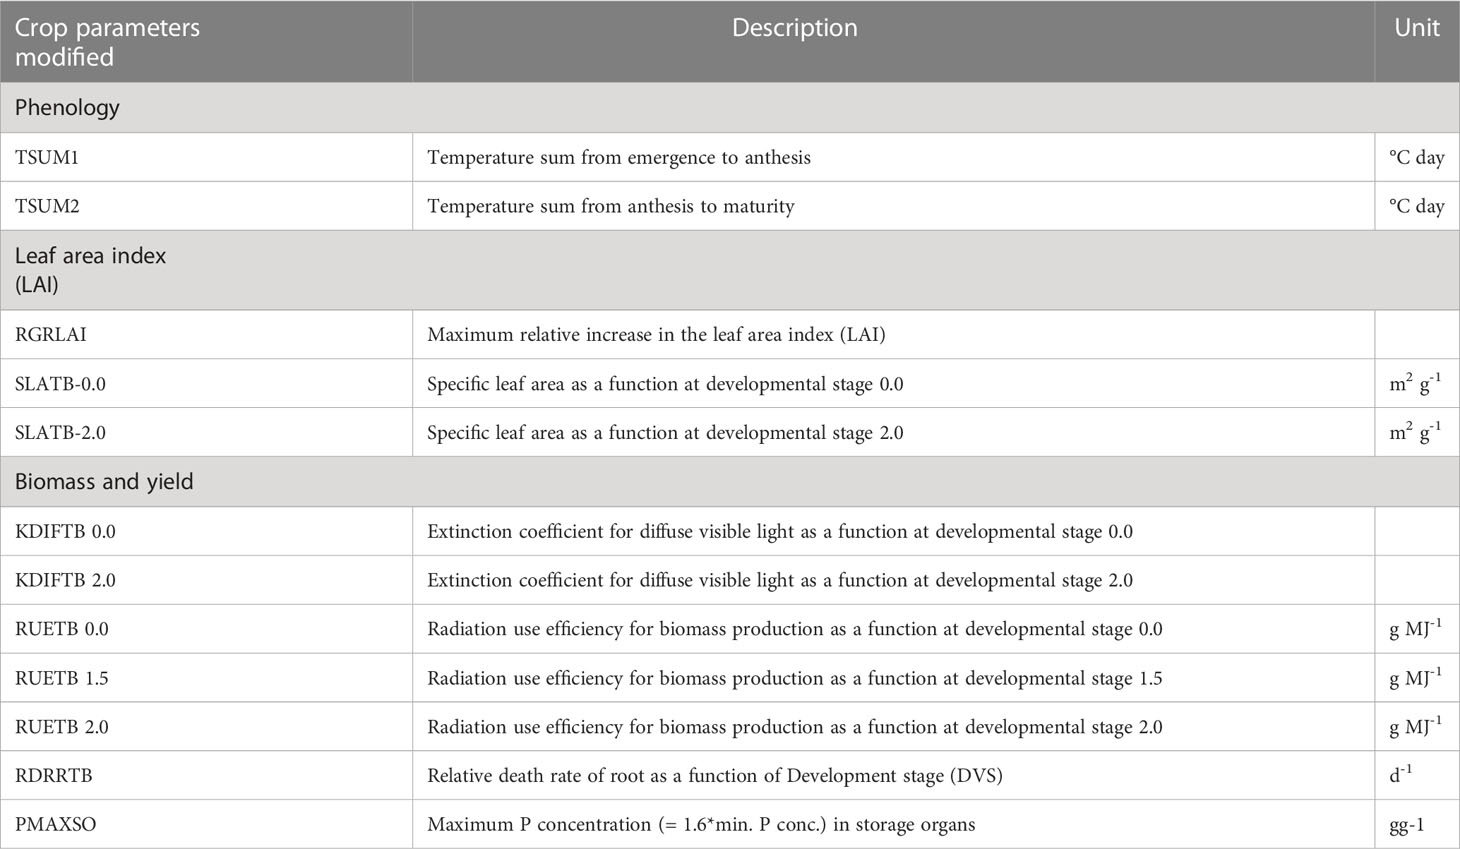
Table 1 Crop parameters modification, description, and units in LINTUL5 for four cowpea genotypes (Adusei et al., 2022).
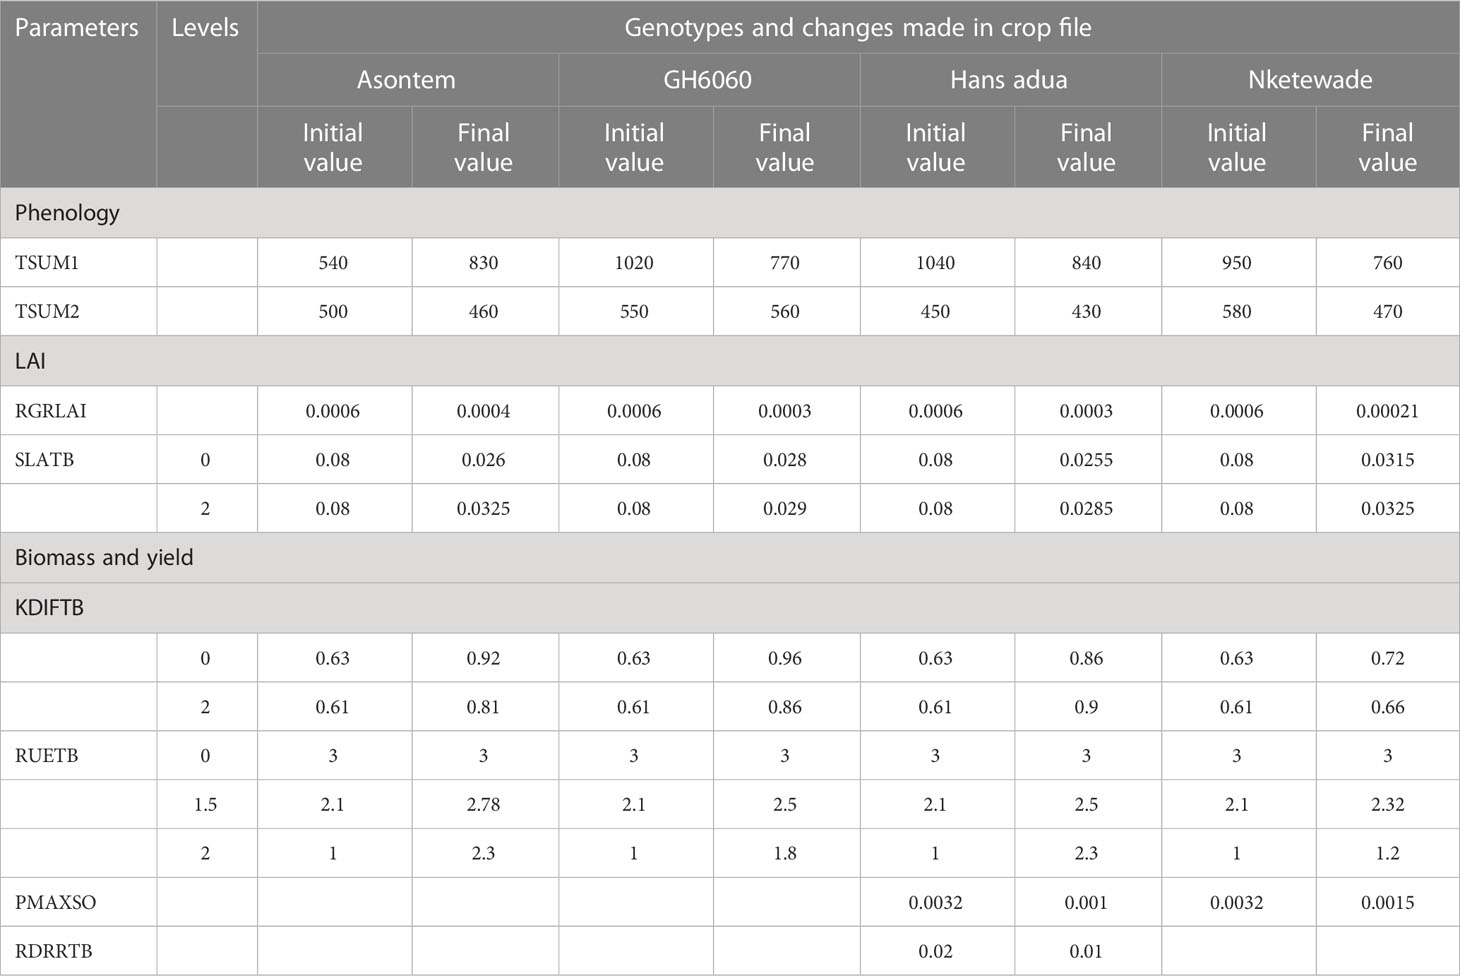
Table 2 Parameters in LINTUL 5 and values used for calibration for four cowpea genotypes.
2.4 Simulation periods and carbon dioxide concentration in the global circulation models
Climate data were obtained for Kumasi and Ouagadougou for the time slices 1981–2000 and 2040–2070 representing the baseline and future climate, respectively. Projections of future climate were obtained using Coupled Model Intercomparison Project Phase 6 (CMIP6) dataset available at 100 km spatial resolution and two shared SSPs, namely, ssp126 and ssp585, for carbon emissions (IPCC, 2014). The future time-scale weather series and the corresponding projected carbon dioxide (CO2) concentration, according to SSPs used in all crop model simulations without bias correction, are 380 as the baseline and 450 and 600 for ssp126 and ssp585, respectively. In the crop model, the radiation use efficiency as a function of the atmospheric CO2 concentration of 40, 380, and 720 ppm with a correction factor of 0, 1, and 1.35, respectively, were used. The four GCMs used are GFDL-ESM4: Geophysical Fluid Science Laboratory-Earth System Modelling (https://www.gfdl.noaa.gov/earth-system-esm4/), IPSL-CM6A: Institute Pierre-Simon Laplace (https://cmc.ipsl.fr/ipsl-climate-models/ipsl-cm6/), MPI-ESM1: Max Planck Institute Earth System Model (https://cera-www.dkrz.de/WDCC/ui/cerasearch/cmip6?input=CMIP6.HighResMIP.MPI-M.MPI-ESM1-2-HR), and UKESM1: U.K. Earth System Model (https://cera-www.dkrz.de/WDCC/ui/cerasearch/cmip6?input=CMIP6.ScenarioMIP.MOHC.UKESM1-0-LL).
3 Results
3.1 Phenological development of cowpea genotypes with and without bias correction of historic and future climate scenarios
The variability of days to anthesis and maturity among the cowpea genotypes using climate model simulations for the historic period (hist, 1981–2010) and SSPs ssp585 (2040–2070) were generally higher in the simulation runs using bias-corrected climate input compared to runs without bias correction and similar in Ouagadougou and Kumasi (Figures 1, 2). In Ouagadougou, the number of days to anthesis using bias correction was reduced in all the genotypes by 2–4 days when the historic. was compared to the socioeconomic pathway ssp585. However, except genotype Asontem where the number of days to anthesis was not changed, all the other genotypes reduced their number of days to anthesis by 1 or 2 days in comparing historic to the socioeconomic pathway ssp126. Without bias correction, days to anthesis were reduced for all the genotypes under the socioeconomic pathways by 1 or 2 days relative to historic (Figures 1, 2). Days to maturity simulated with bias correction were reduced in the socioeconomic pathway ssp126 in genotype Asontem by 1 day. In ssp585, the values recorded for days to maturity reduced in all the genotypes by 4–6 days, relative to historic. Without bias correction, the differences in days to maturity recorded for the socioeconomic pathways compared to historic followed a similar trend in all the genotypes and this reduced between 2 and 5 days (Figures 1, 2).
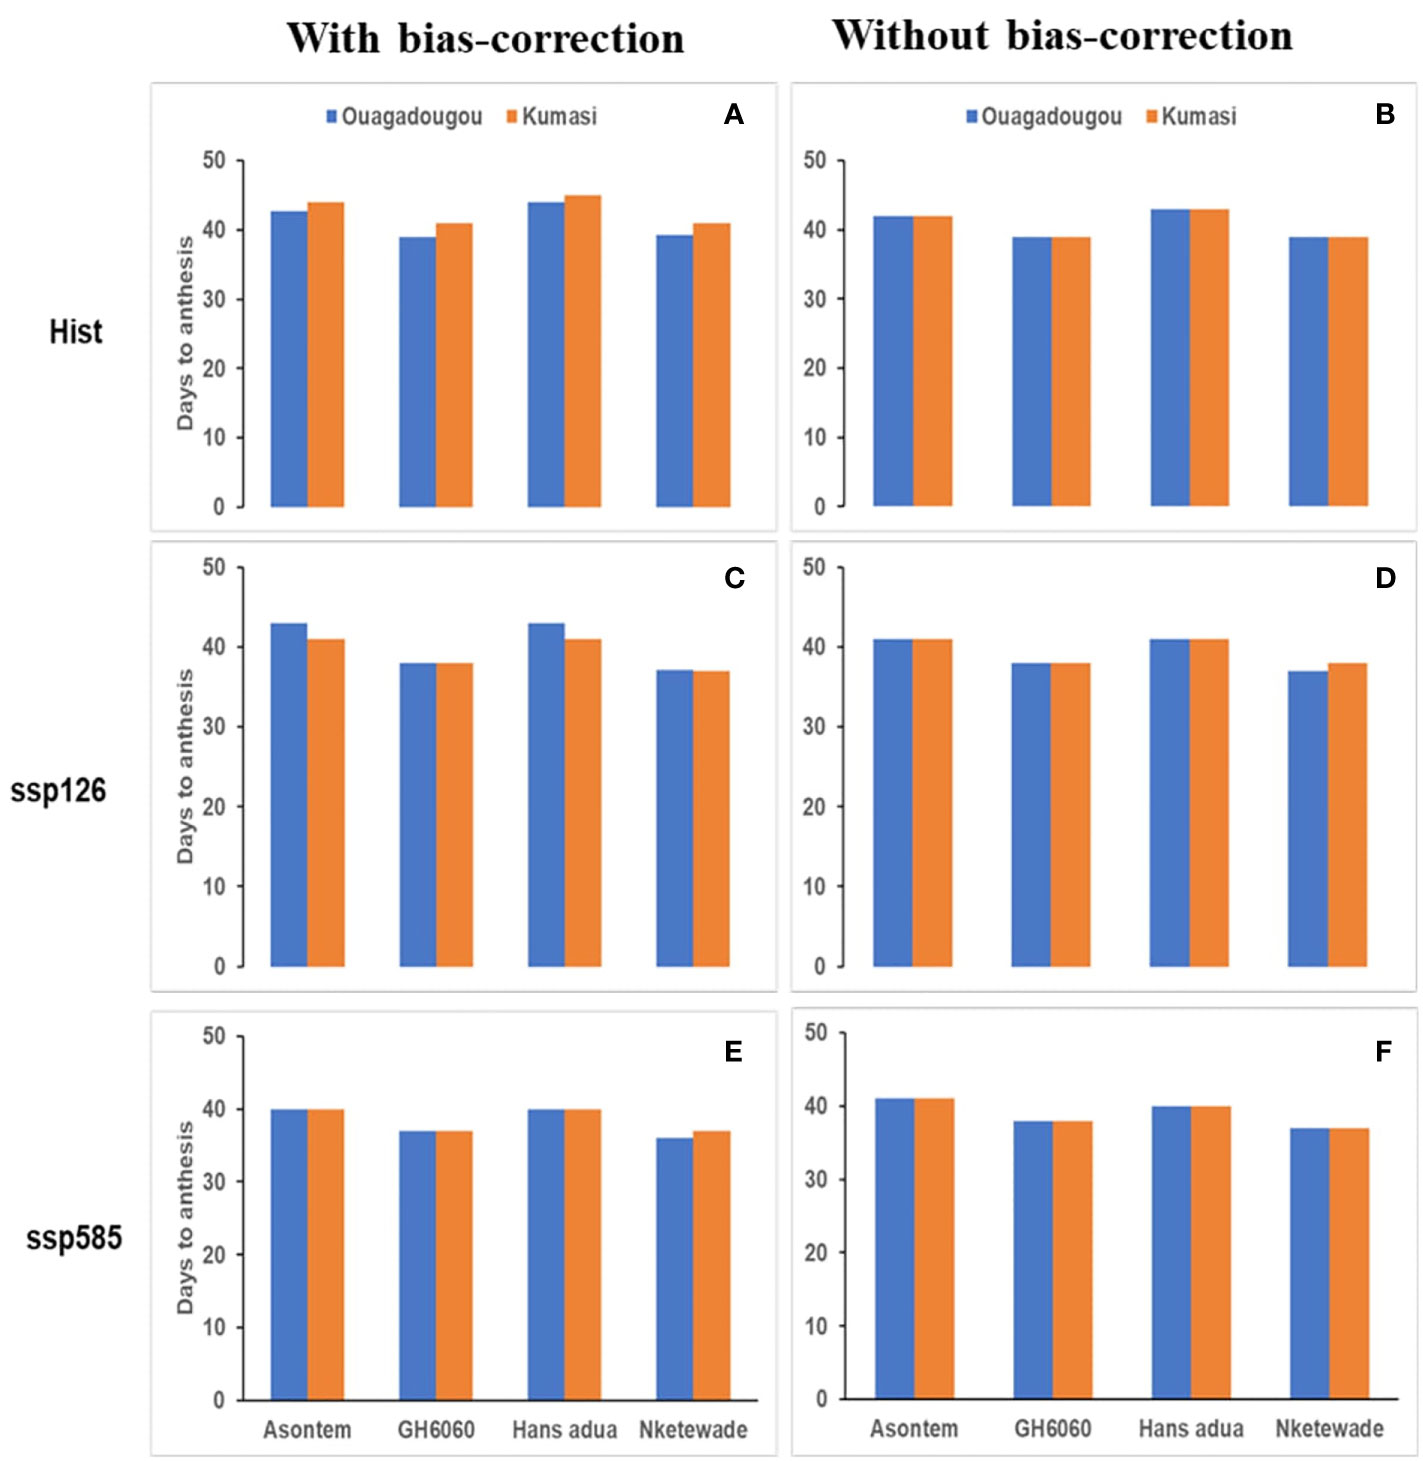
Figure 1 Average number of days to anthesis as affected by bias correction in the historic period [hist—(A, B), 1981–2010, average of 30 years) and future scenario period (2040–2070, average of 30 years) under two shared socioeconomic pathways (SSPs) (ssp126—(C, D); ssp585—(E, F)] under rainfed conditions without fertilizer application.
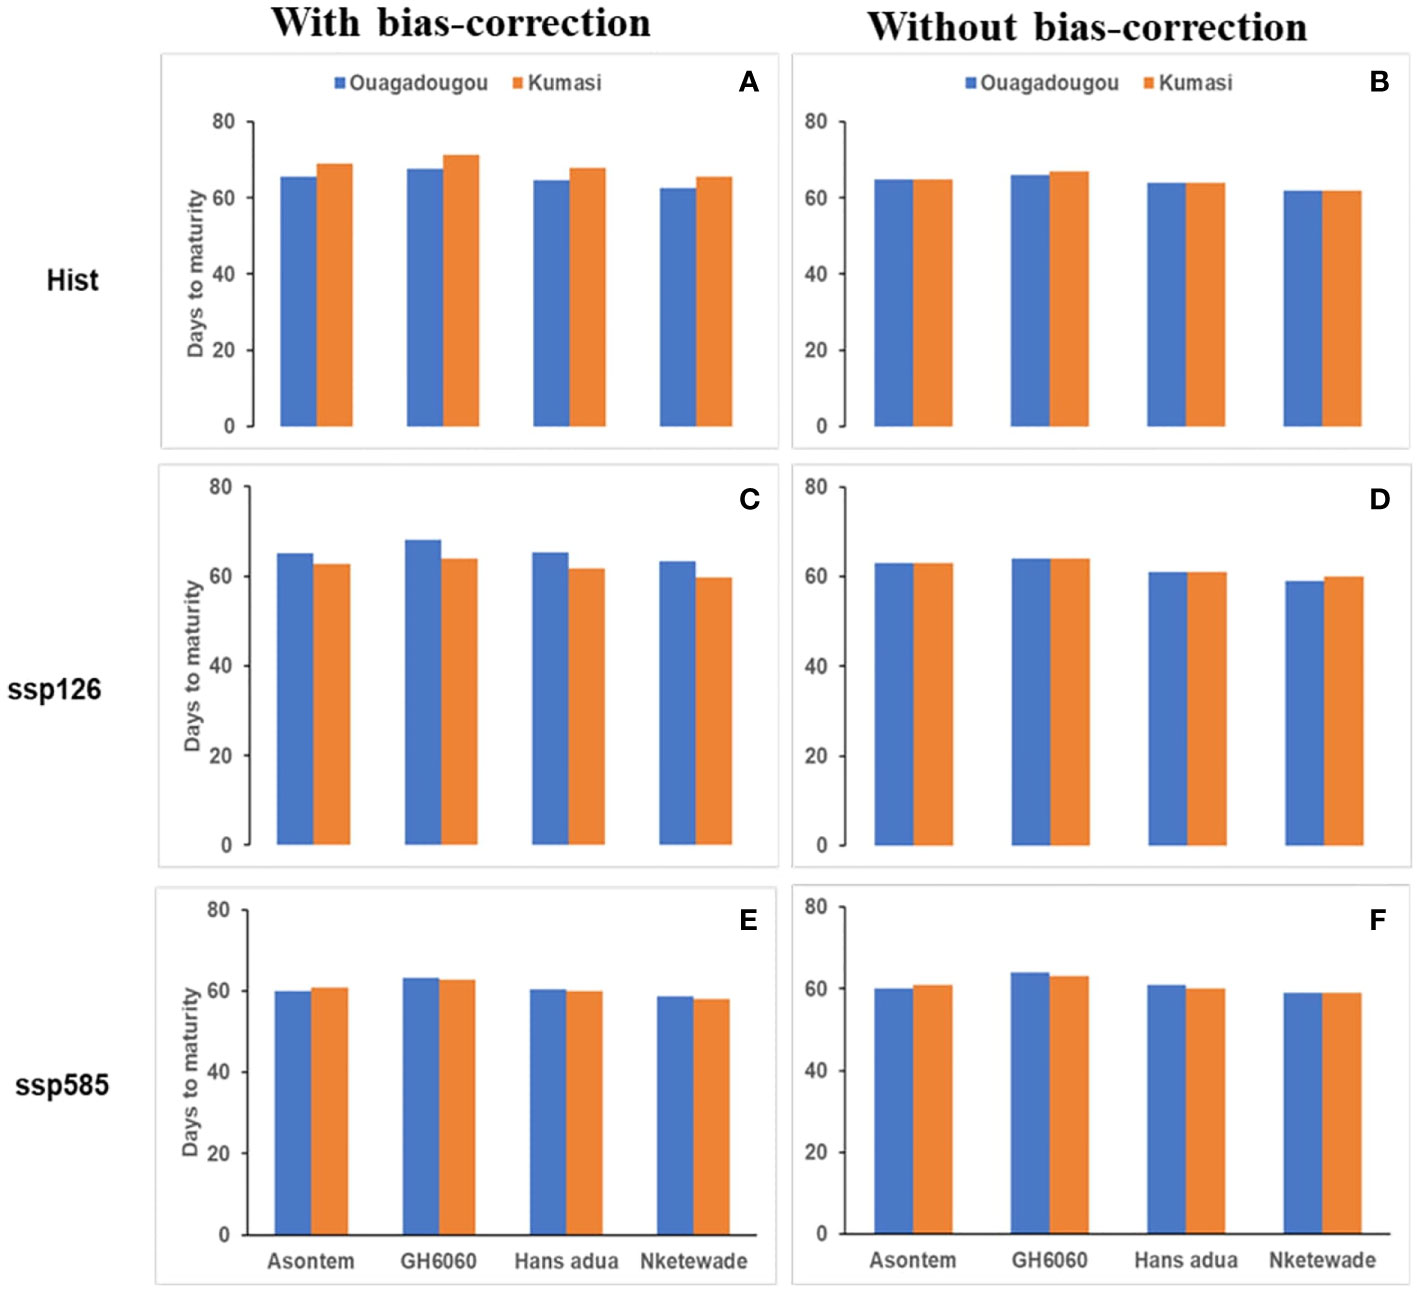
Figure 2 Average number of days to maturity as affected by bias correction in the historic period [hist—(A, B), 1981–2010, average of 30 years) and future scenario period (2040–2070, average of 30 years) under two SSPs (ssp126—(C, D); ssp585—(E, F)] under rainfed conditions without fertilizer application.
In Kumasi, considering days to anthesis and maturity, we observed reductions in all the socioeconomic pathways compared to the historic period independent of bias correction. The differences observed when the socioeconomic pathways were compared to historic ranged from 3 to 4 days to anthesis with bias correction and 1–4 days without bias correction. When considering the days to maturity, the differences between historic and SSPs ranged from 6 to 8 days and 2–4 days with and without bias correction, respectively (Figures 1, 2).
3.2 Changes in cowpea total aboveground biomass and yield with and without bias correction of historic and future climate scenarios
In Ouagadougou and with bias correction, the simulated total aboveground biomass of the genotypes during the historic period ranged from 6.61 to 8.74 t ha-1 while, under the socioeconomic pathway, ssp126 ranged from 6.52 to 8.43 t ha-1 and, under ssp585, it ranged from 6.14 to 8.09 t ha-1. The genotypes Nketewade and Asontem always had the lowest and highest simulated aboveground biomass, respectively. Also, without bias-correction, the lowest aboveground biomass of 6.62, 6.55, and 7.48 t ha-1 in the historic, ssp126, and ssp585 respectively was recorded in genotype Nketewade and the highest values of 9.01, 8.82, and 9.81 t ha-1 in the historic, ssp126, and ssp585, respectively, were recorded with the genotype Asontem (Figure 3). In Ouagadougou historic, ssp126 and ssp585 had the lowest values of 2.83, 2.74 and 2.65 t ha-1 yield, respectively, in genotype Nketewade, but the highest values of 4.03 (historic), 3.92 (ssp126), and 3.77 t ha-1 (ssp585) yield were all recorded in genotypes GH6060 with bias correction. Without bias correction, the genotype Nketewade had the lowest yield for historic (2.68 t ha-1), ssp126 (2.77 t ha-1), and ssp585 (2.96 t ha-1) and GH6060 had the highest yield for historic (3.90 t ha-1), ssp126 (3.87 t ha-1), and ssp585 (4.26 t ha-1; Figure 4), however, only slightly different from Asontem. It is important to point out that with bias correction, the simulated total aboveground biomass and yields in Ouagadougou under ssp585 are decreasing in all genotypes; however, without bias correction, the total aboveground biomass and yields are increasing in ssp585 compared to the historic period.
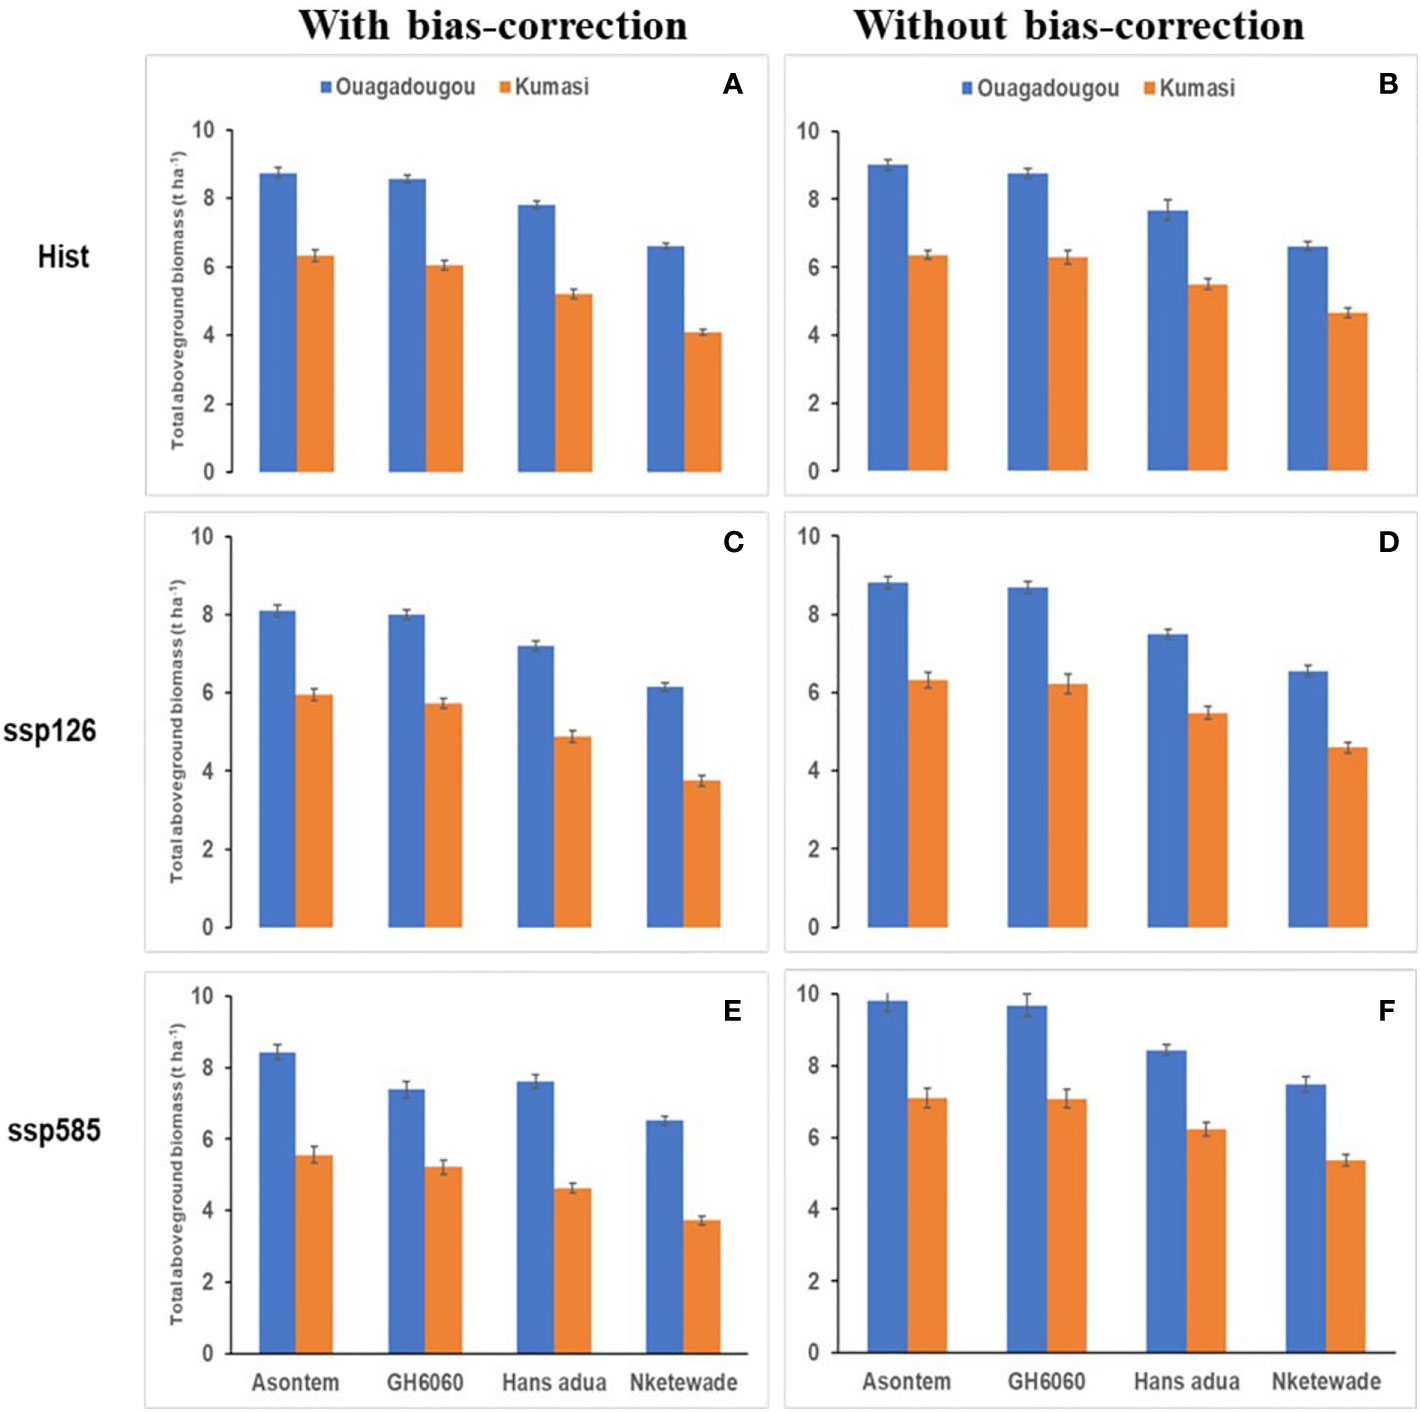
Figure 3 Average simulated total aboveground biomass production of four cowpea genotypes as affected by the bias correction of climate model outputs for historic [hist (A, B), 1981–2010, average of 30 years) and future climate scenario periods (2040–2070, average of 30 years) under two SSPs (ssp126—(C, D); ssp585—(E, F)] in Ouagadougou and Kumasi under rainfed conditions without fertilizer application.
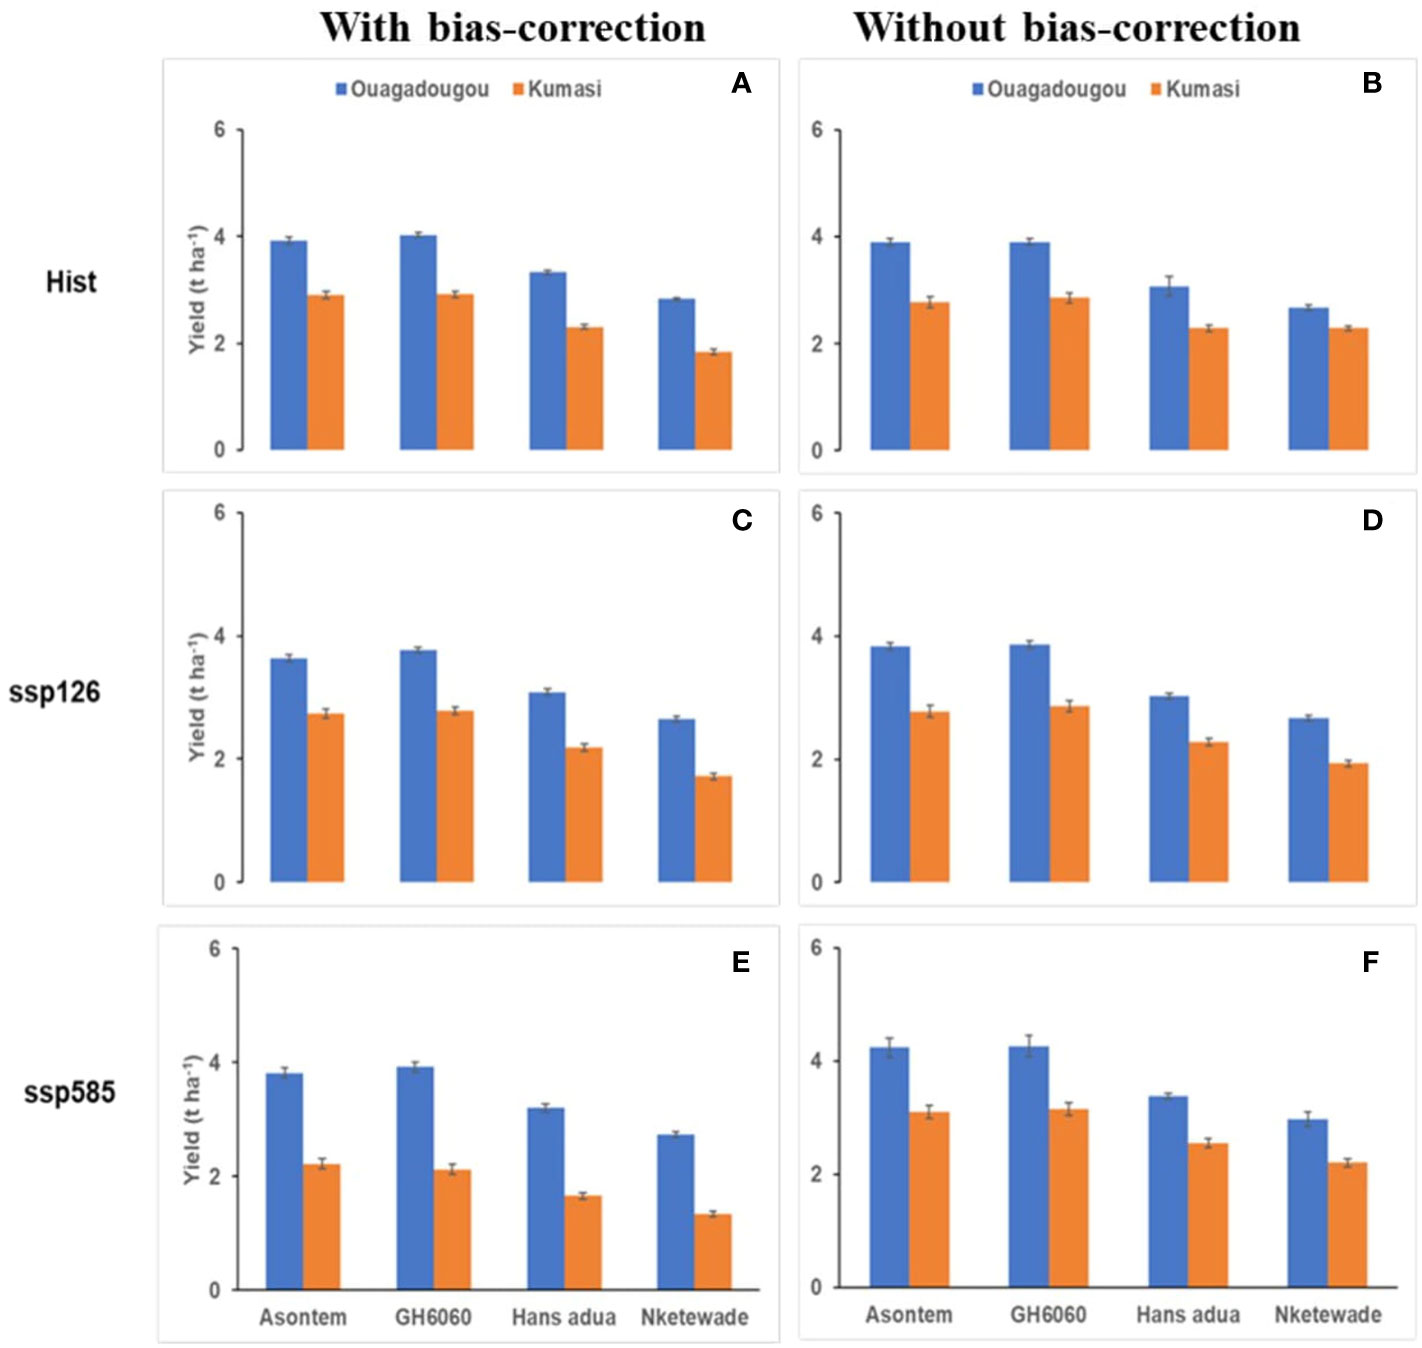
Figure 4 Average simulated total yield of four cowpea genotypes as affected by the bias correction of climate model outputs for historic [hist—(A, B), 1981–2010, average of 30 years) and future climate scenario periods (2040–2070, average of 30 years) under two SSPs (ssp126—(C, D); ssp585—(E, F)] in Ouagadougou and Kumasi under rainfed conditions without fertilizer application.
In Kumasi and with bias correction, the total aboveground biomass was higher in the historic compared to socioeconomic pathways ranging between 4.08 (Nketewade) and 6.32 t ha-1 (Asontem). The rate decrease in aboveground biomass was higher under ssp585 than under ssp126 compared to the historic period. When climate model data were not bias-corrected, the simulated values of aboveground biomass were decreased in ssp126 but increased in ssp585 compared to the historic period. With bias correction, the genotypes Nketewade and Asontem had the lowest and highest simulated aboveground biomass under ssp126, although the difference between GH6060 and Asontem was very low. However, under ssp585, Asontem continued to show the highest aboveground biomass followed by GH6060. Without bias correction, the highest and lowest total aboveground biomass was always observed in genotypes Asontem and Nketewade, respectively (Figure 3). With bias correction, the yields simulated were higher in the historic period ranging from 1.84 to 2.92 t ha-1 in the genotypes Nketewade and GH6060, respectively, compared to the socioeconomic pathways ssp126 and ssp585, which, together, ranged between 1.34 (Nketewade) and 2.78 t ha-1 (GH6060). Without the bias correction of climate input data, the simulated historic yield was very close to the simulated yields in ssp126 except for Nketewade. However, comparing the simulated yield of the historic period to ssp585, yield under ssp585 was higher in all genotypes except for Nketewade. Without bias correction, the genotypes with the lowest and highest yields were Nketewade and GH6060, respectively, regardless of the climate scenario (Figure 4).
3.3 Changes in environmental factors during the growing cycle of four cowpea genotypes with and without bias correction of historic and future climate scenarios
The average temperatures during the growing cycle of the cowpea genotypes increased, while the sum of precipitation and radiation decreased in all future SSPs relative to the historic period in both Ouagadougou and Kumasi. This was observed in climate scenarios with bias correction and without bias correction (Tables 3, 4). With bias correction, historic temperatures in Ouagadougou ranged from 27.15°C to 27.20°C during the growing cycle of GH6060 and Nketewade, respectively. When considering the socioeconomic pathways, the average air temperature during the growing cycles in ssp126 had a range from 28.75°C (GH6060) to 28.81°C (Nketewade), while in ssp585, the range was from 27.19°C (GH6060) to 27.36°C in (Asontem and Nketewade). Without bias correction, the average temperature in Ouagadougou increased in the socioeconomic pathways ranging from 28.39°C to 28.56°C in ssp126 and from 28.45°C to 28.65°C in ssp585 in the genotypes Asontem, Nketewade, Hans adua, and GH6060 relative to historic (Table 3A).
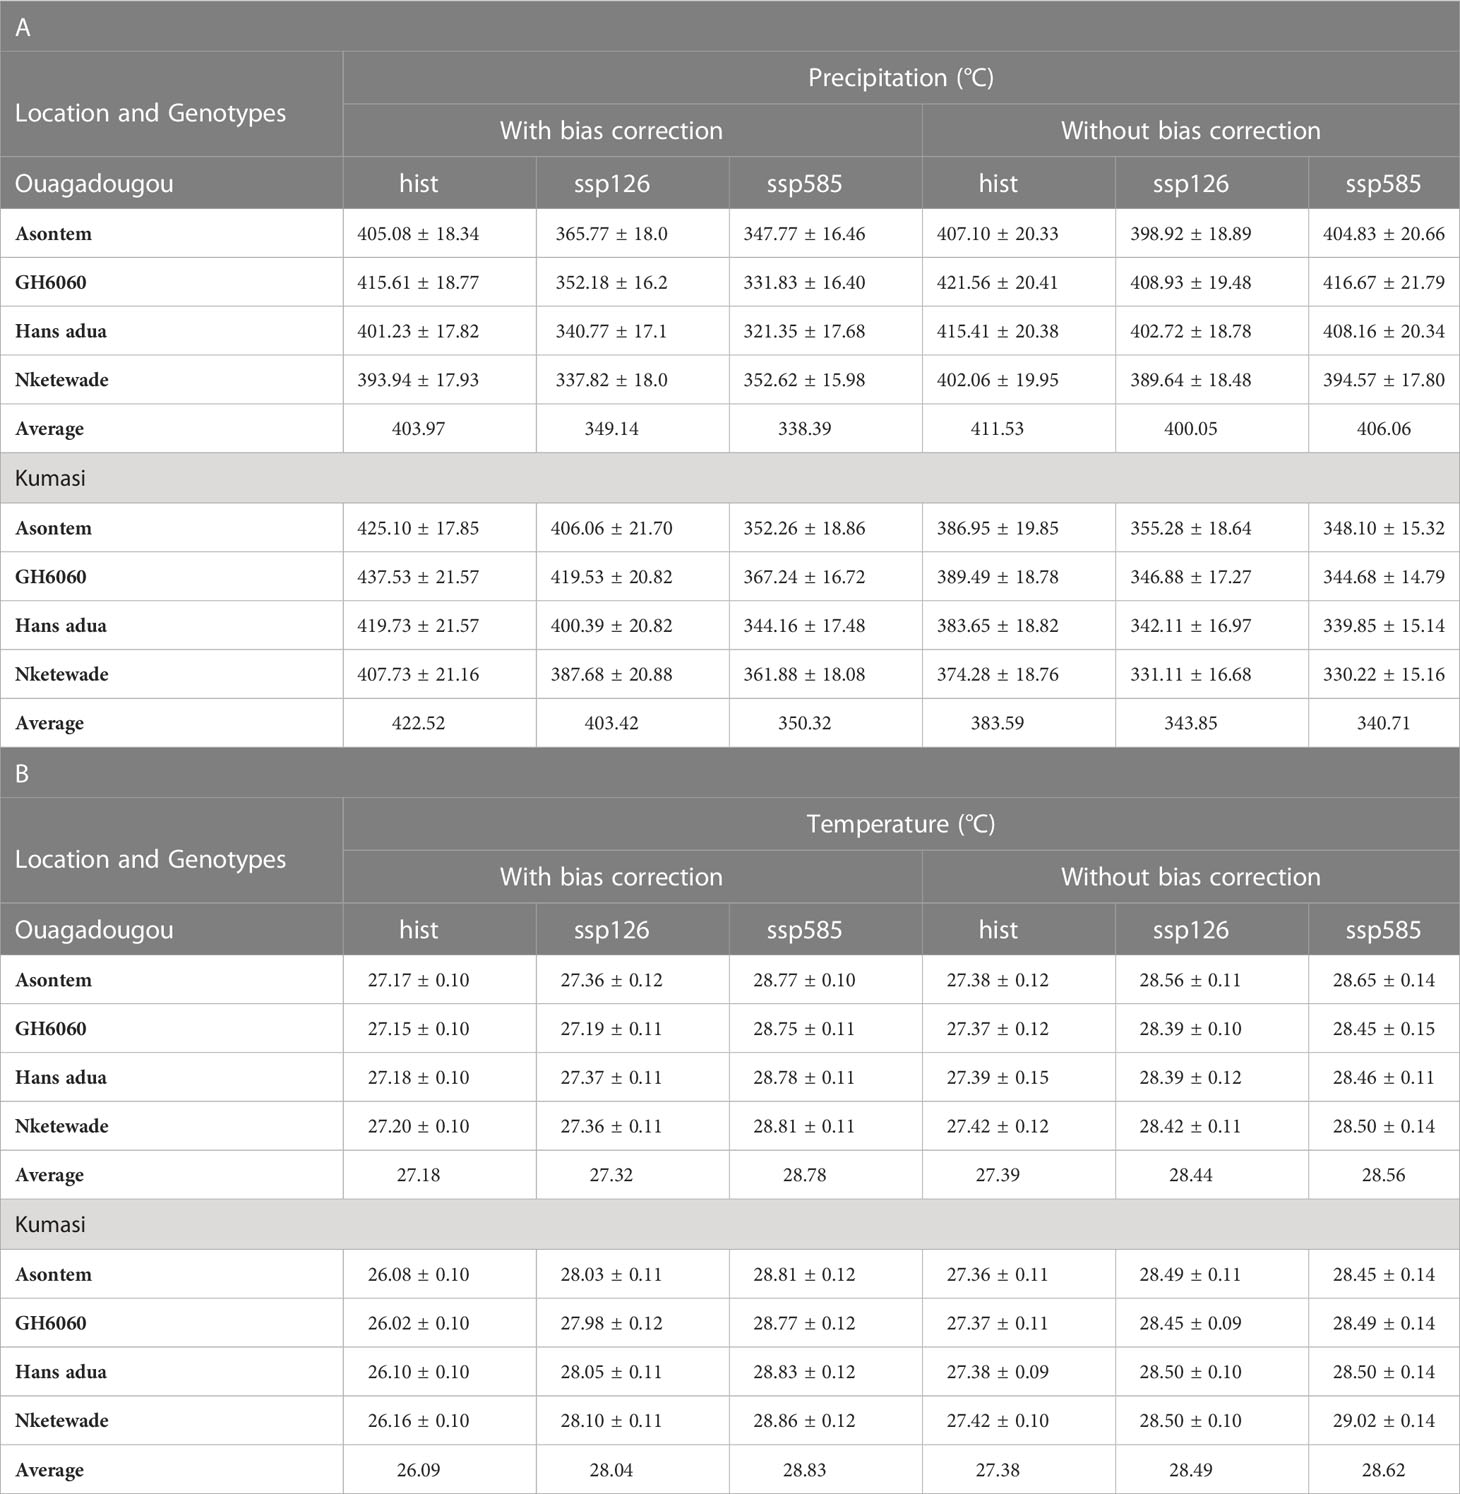
Table 3 Simulated average annual precipitation (mm) (A) and average air temperature (°C) (B) over the growing cycle of four cowpea genotypes as affected by the bias correction of climate model outputs for historic (hist, 1981–2010, average of 30 years) and future climate scenario periods (2040–2070, average of 30 years) under two SSPs (ssp126 and ssp585).
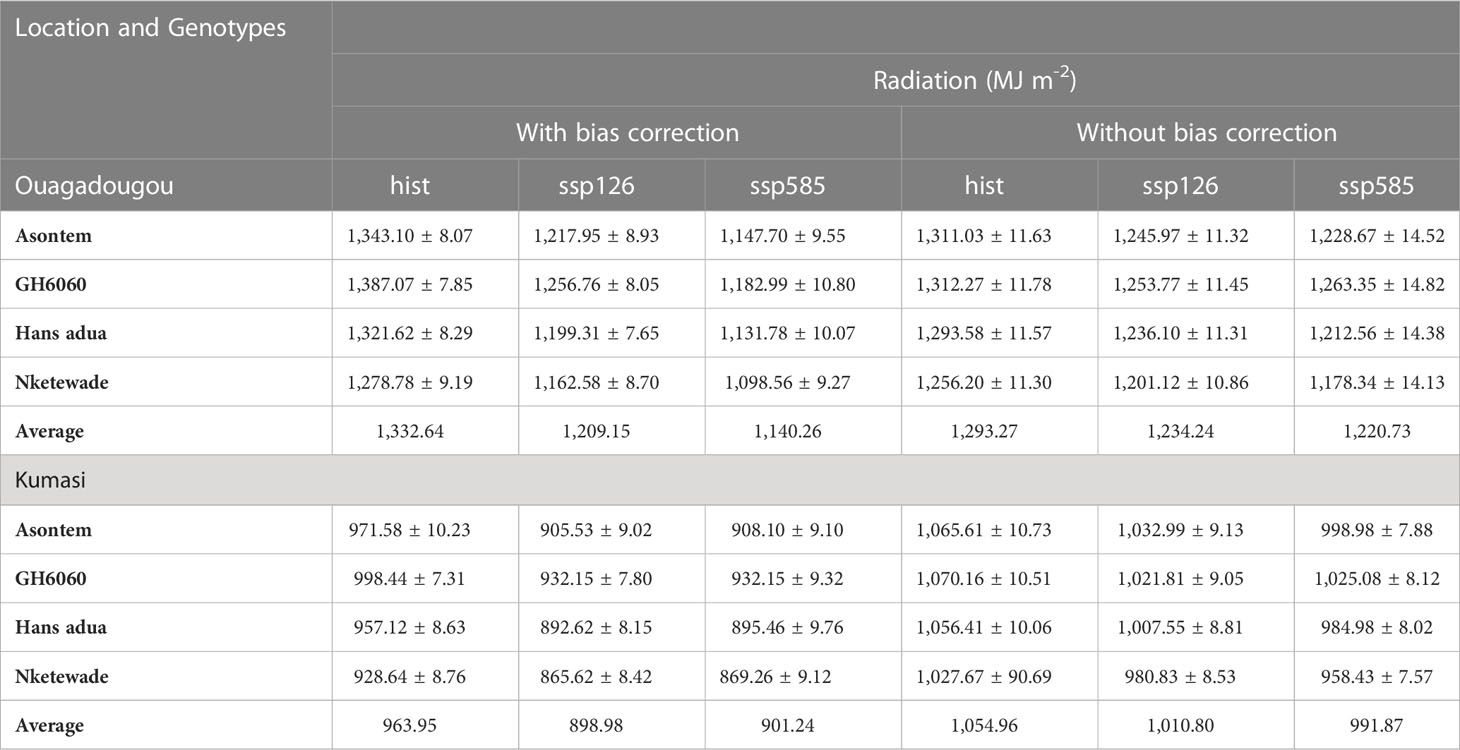
Table 4 Simulated average solar radiation over the growing cycle of four cowpea genotypes as affected by the bias correction of climate model outputs for the historic (hist, 1981–2010, average of 30 years) and future climate scenario periods (2040–2070, average of 30 years) under two SSPs (ssp126 and ssp585) at two different locations in West Africa (Kumasi and Ouagadougou).
The average sum of precipitation during the growing cycles, on the other hand, decreased in Ouagadougou in both socioeconomic pathways compared to historic under both with bias correction and without bias correction. In the socioeconomic pathway ssp126, precipitation ranged from 337.82 to 365.77 mm in genotypes Nketewade and Asontem, while in ssp585, it ranged from 321.35 (Hans adua) to 352.62 mm (Nketewade) with bias correction. Without bias correction, historic precipitations ranged from 402.06 to 421.56 mm, the socioeconomic pathway ssp126 from 389.64 to 408.93 mm, and ssp585 from 394.57 to 416.67 mm all in genotypes Nketewade and GH6060 (Table 3B). The levels of radiation recorded in Ouagadougou were lower in future scenarios compared to historic ones. In the socioeconomic pathway, ssp126 cumulated radiation over the growing cycle ranged between 877.67 and 941.72 MJm-2 and ssp585 ranged from 869.26 to 932.15 MJ m-2 all in genotypes Nketewade and GH6060 in Kumasi with bias correction (Table 4).
The temperatures simulated for the growth and development of the cowpea genotypes for Kumasi were lower in the historic compared to both socioeconomic pathways with bias correction and without bias correction (Table 3A). With bias correction, average temperatures over the growing cycles for the historic period ranged from 26.02°C (GH6060) to 26.16°C (Nketewade), for the socioeconomic pathway ssp126, from 27.99°C (GH6060) to 28.11°C (Hans adua), and for the ssp585, from 28.83°C (GH6060) to 28.93°C (Asontem). Without bias correction, historic temperatures had a range of 27.36°C (Asontem) to 27.42°C (Nketewade), for the socioeconomic pathway ssp126, from 28.45°C (GH6060) to 28.50°C (Hans adua), and for ssp585, from 28.45°C to 29.02°C in genotypes Asontem and Nketewade, respectively (Table 3A). With bias correction, the precipitation sum over the growing cycle in Kumasi was higher in the historic period compared to all the socioeconomic pathways under both bias correction and without bias correction. Genotype Nketewade had a lower precipitation of 407.73 mm, and genotype GH6060 had a higher precipitation of 437.53 mm all under historic with bias correction. Socioeconomic pathway ssp126 precipitation ranged from 387.68 mm in genotype Nketewade to 419.53 mm in genotype GH6060, while ssp585 had a lower precipitation of 344.16 mm for genotype Hans adua and a higher precipitation of 367.24 mm in genotype GH6060, all under corrected bias. Under without bias correction, historic precipitation ranged from 374.28 (Nketewade) to 389.49 mm (GH6060), socioeconomic pathway ssp126 precipitation ranged from 331.11 mm in genotype Nketewade to 355.28 mm in genotype Asontem. The socioeconomic pathway ssp585 had a lower precipitation of 330.22 mm also in genotype Nketewade and a higher precipitation of 348.10 mm in genotype Asontem (Table 3B). The trend of the levels of radiation in Kumasi was similar to the distribution of precipitation under with bias correction. Under both bias correction and without bias correction, the radiation recorded was higher in the historic compared to both socioeconomic pathways. Historic under with bias correction and without bias correction had the least radiation in genotype Nketewade and higher in genotype GH6060. Similar radiation observations were made in the socioeconomic pathways with bias correction and without bias correction except for the socioeconomic pathway ssp126, which had higher radiation in genotype Asontem under without bias correction (Table 4).
3.4 Changes in water and phosphorus stress of four cowpea genotypes with and without bias correction of historic and future climate scenarios
Generally, at both sites (in Ouagadougou and Kumasi), the simulated average water stress factor (TRANRF) and phosphorous nutrition index (PNI) were higher in the historic period compared to the socioeconomic pathways, both with bias-correction and without bias-correction (Table 5). This means that, on average, the crop suffered less from water stress in the historic period on both sites (in Ouagadougou and Kumasi).
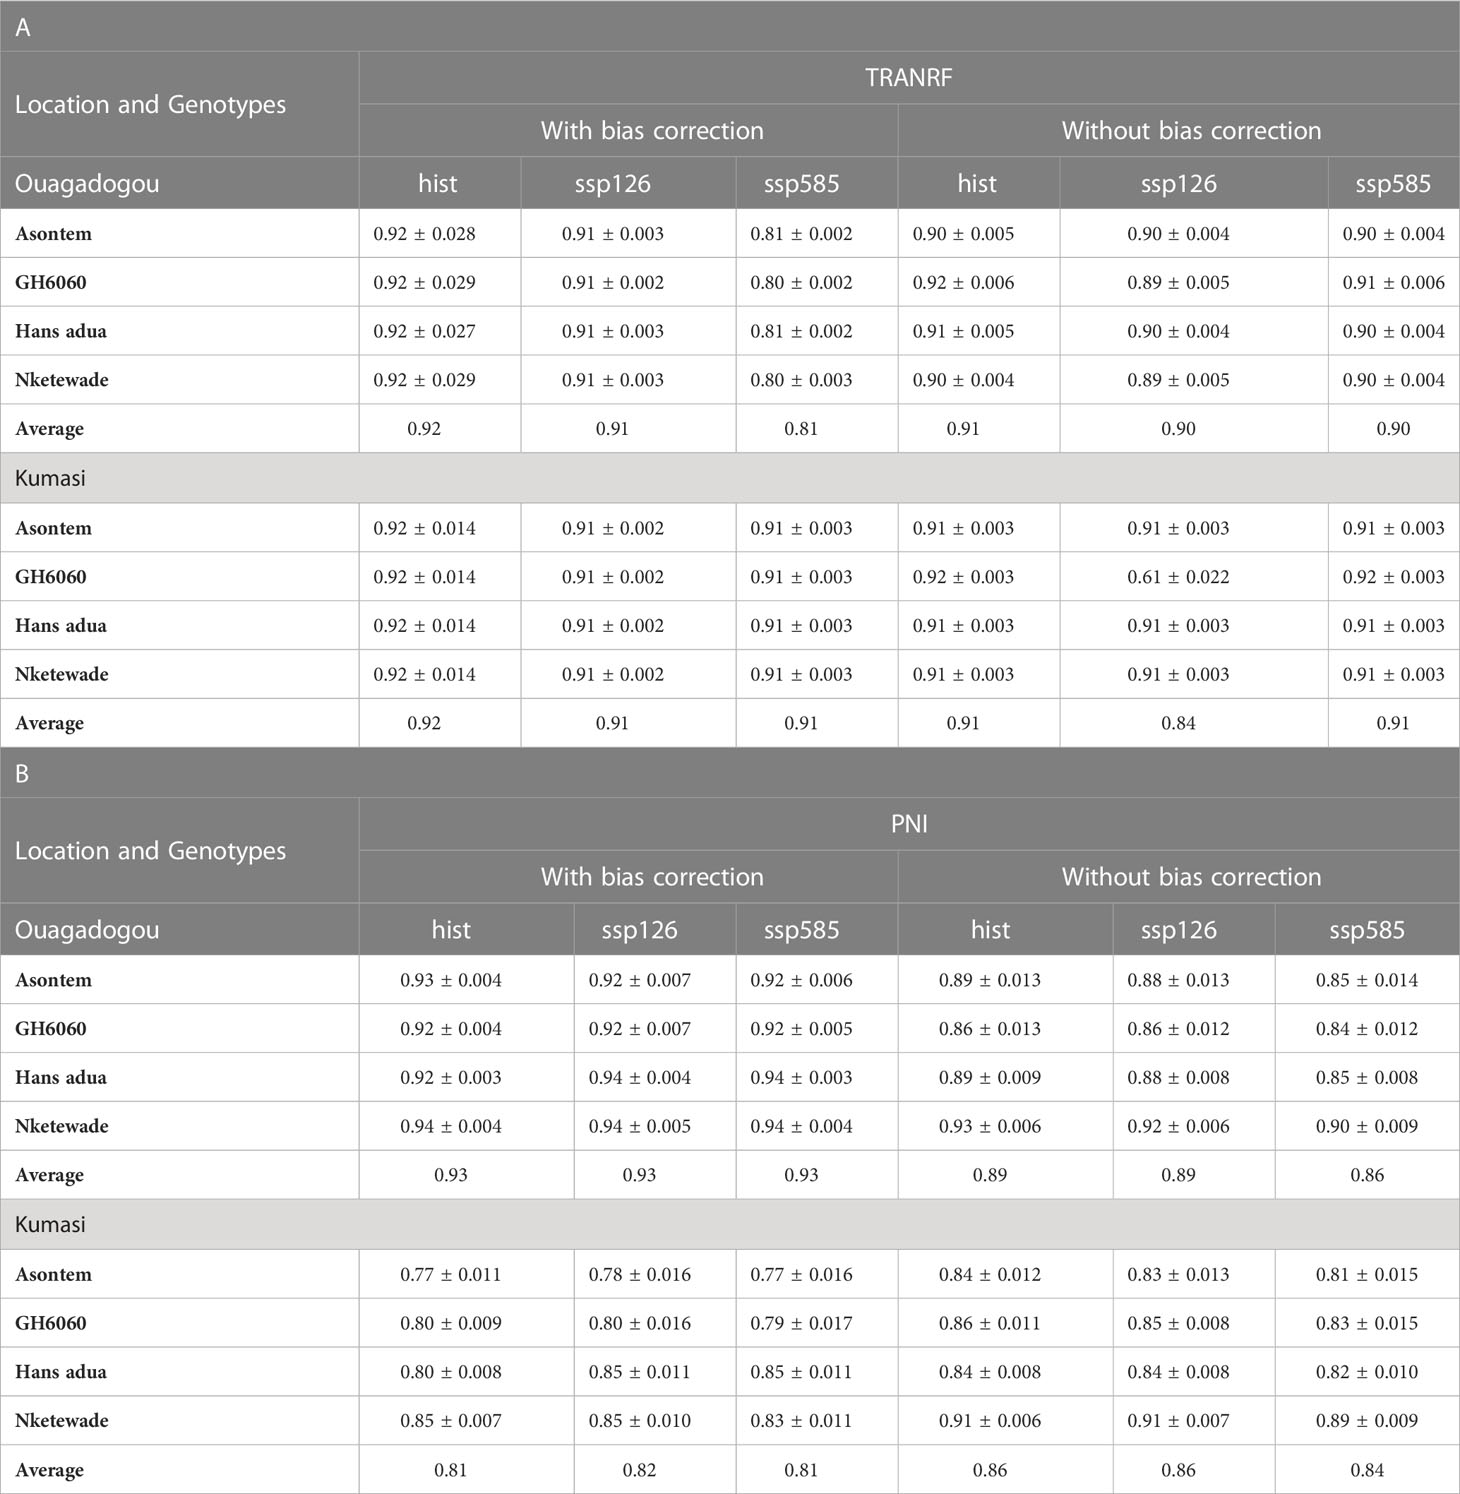
Table 5 Simulated average TRANRF (A) and PNI (B) of four cowpea genotypes during the growing period as affected by bias correction for the historic period (hist, 1981–2010, average of 30 years) and future scenario period (2040–2070, average of 30 years) under two SSPs (ssp126 and ssp585) at two different locations in West Africa (Kumasi and Ouagadougou) under rainfed conditions without fertilizer application.
In Ouagadougou and with bias correction, the differences between the TRANRF in the historic period and the ssp126 scenario were 0.01 in all the genotypes. The differences further increased to 0.12 in genotypes Asontem and Hans adua under ssp585. Without bias correction, the differences in TRANRF between the historic and the socioeconomic pathway ssp126 were similar to the differences with bias correction. However, without bias correction, the differences in TRANRF between historic and ssp585 scenarios were much lower (0 to 0.01) than with bias correction. Apart from genotypes Hans adua and GH6060 that decreased TRANRF by 0.01 each, in comparing ssp585 to historic, the genotypes Asontem and Nketewade remained unchanged (Table 5A).
With bias correction, the average PNI of the genotypes hardly changed when comparing the historic to the socioeconomic scenario in Ouagadougou. With bias correction, the PNI of genotype Asontem was reduced by 0.01 and the average PNI of Hans adua increased by 0.02 in both ssp126 and ssp585 compared to the historic period, but the average PNI of GH6060 and Nketewade remained unchanged. Without bias correction, the PNI of the genotypes behaves differently. The PNI values of the historic period were highest, ranging from 0.86 to 0.93, followed by the PNI value in the socioeconomic pathway ssp126, ranging from 0.86 to 0.92 and then the PNI values in the ssp585 scenario, which ranged from 0.84 to 0.90 all in GH6060 and Nketewade, respectively (Table 5B).
In Kumasi and with bias correction, TRANRF values were 0.01 higher in the historic compared to both socioeconomic pathways (ssp126 and ssp585), but, without bias correction, the trend changed. Three genotypes (Asontem, Hans adua, and Nketewade) had similar values under the historic and the socioeconomic pathways. GH6060 is the only genotype that had a higher TRANRF of 0.92 under historic and ssp585 scenarios and a lower value of 0.61 in ssp126 (Table 5A). The values of PNI under bias correction recorded the lower range in Asontem and the higher range in Nketewade of the historic from 0.77 to 0.85, ssp126 from 0.78 to 0.85, and ssp585 from 0.77 to 0.85. This trend was also observed in without bias correction where the lower and the higher PNI of the historic and the socioeconomic pathways were recorded in Asontem and Nketewade, respectively (Table 5B).
4 Discussion
Bias correction is very crucial for a reliable assessment of the impact of climate change on agricultural productivity and potential adaptation measures through crop models (Glotter et al., 2014; Challinor et al., 2017). The effect of the bias correction of the output of four GCMs on the response of four cowpea genotypes popularly grown in Ouagadougou and Kumasi under two future (2040 and 2070) socioeconomic pathways (ssp126 and ssp585) were assessed.
The bias correction of the climate model outputs revealed a reduced duration of phenological periods on the simulation of the genotypes as a response to differences in average temperatures during the growing cycle between bias-corrected and non-bias-corrected climate inputs. The bias correction of the climate input data may have proven necessary to obtain reliable future changes in the phenological development of the cowpea genotypes (Macadam et al., 2016). The number of days to anthesis using bias correction was reduced by 1 or 2 days in all genotypes except Asontem, which did not change in comparing climate inputs for the historic period and the socioeconomic pathway ssp126. GH6060 was the only genotype that was reduced by 1 day only under the socioeconomic pathway ssp585 at Ouagadougou. A reduction of 2–5 days in the period from emergence to maturity was observed under the socioeconomic pathway ssp585 and all the genotypes in Ouagadougou. A similar pattern was also recorded in Kumasi where days to anthesis were reduced by 6 days in Asontem, Hans adua, and Nketewade and by 5 days in Asontem and 7 in GH6060 under ssp126. Under ssp585, the genotypes Asontem, GH6060, and Nketewade were reduced the days to anthesis by 4 and 5 days by Hans adua. Days to maturity were reduced by 6 days under ssp126 and by 8 days under ssp585 in all genotypes when the data were bias-corrected (Figures 1, 2). These reductions were due to an increase in temperatures (Tables 3A, B) in both locations, which might have accelerated the phenological development of the genotypes. The importance of the simulation of phenological development from anthesis to maturity stages is vital in dynamic crop models (Ceglar and Kajfež-Bogataj, 2012) because this is known to affect the allocation of assimilates that have a significant impact on the tolerance to biomass production and the yield of crops to high temperatures (Aidoo et al., 2016).
The total aboveground biomass and yield were higher in the historic period, especially under bias correction compared to the socioeconomic pathways. In considering the genotype performance under the socioeconomic pathways in both locations, high total aboveground biomass and yield were recorded for genotypes Asontem and GH6060 with bias correction. In Kumasi, the total aboveground biomass and yield of genotypes Nketewade and Hans adua were low when the data were subjected to corrections to eliminate the biases (Figures 3, 4). These alterations of the total aboveground biomass and yield of the genotypes may have resulted from the variability overestimation. Highly improved total aboveground biomass and yield estimated for genotypes Asontem and GH6060 between the historic and socioeconomic pathways might be due to the use of bias-corrected data for the simulation (Ceglar et al., 2011). The biomass accumulation and yield of the genotypes may be an adaptational strategy to water and phosphorus stress (Adusei et al., 2021). The genotypes might have again taken advantage of the increased levels of CO2, especially in the simulation of the future socioeconomic pathways using bias-corrected data on temperatures and precipitation at stress and unstress environmental conditions (Table 3). Elevated CO2 is known to increase the rate of photosynthesis in plants under optimum temperature and an adequate amount of soil moisture (van der Kooi et al., 2016; Adusei et al., 2022), and these might have impacted positively on the growth and yield of genotypes Asontem and GH6060.
The temperature levels in the historic period and the future socioeconomic pathways reduced in both locations after subjecting the data to bias correction (Table 4). The overestimation of temperature without bias correction in this study agrees with the findings by Kjellstrom et al. (2010) on the overestimation of temperatures in the central part of Europe. The optimal temperature levels under which the genotype Asontem developed biomass and improved yield were attained after bias correction, which is an indication that the genotype tolerated high temperatures to a certain degree (Table 4). In contrast to mean temperatures, precipitation seems to be underestimated without bias correction in this study. However, the bias correction of the precipitation output of the climate models resulted in higher percentiles of rainfall, even when the values are still underestimated (Kajfez-Bogataj et al., 2010). This caused higher biomass growth in genotypes GH6060 and Asontem in both locations. The radiation over the growing period provided by the climate models did not change when applying bias correction (Table 4). This is an indication that the rate of radiation in both locations might have an enhanced photosynthetic efficiency of the genotypes when they were subjected to water and phosphorous stress. The high temperature and radiation and relatively moderate precipitation in Ouagadougou compared to Kumasi under bias correction may have increased the probability of producing major positive yield bias by the crop model. The effect of bias correction on simulated biomass production and crop yield was less pronounced, and this might have been influenced by the corrected data on weather conditions (Macadam et al., 2016). The TRANRF did not change when comparing historic and future scenarios in most of the genotypes and SSPs; however, there was a strong reduction of TRANRF in Ouagadougou under ssp585 for all genotypes when climate input was bias-corrected. In contrast, when comparing historic and future periods in both locations, there is hardly a change in the average PNI of all genotypes, except for the genotype Hans adua. The average PNI of this genotype increased in all locations and SSPs (Table 5). This is an indication that phosphorus will not be the limiting factor for cowpea yield but rather water.
5 Conclusion
The bias correction appeared necessary for a more reliable simulation of cowpea phenology, total aboveground biomass, and yields. The cowpea model used in this study was sensitive in adjusting and predicting the adaptational potential of four selected cowpea genotypes. Genotypes Asontem and GH6060 exhibited the highest adaptational potential to future climate change in the moist and dry savanna areas by a slightly reduced period from anthesis and maturity, the highest buildup of total aboveground biomass and yield, tolerance to high temperatures, and high water use and photosynthetic efficiency. The bias correction of climate model outputs improved substantially the seasonal variability of temperature, precipitation, and radiation in the two locations. The change in TRANRF and PNI were genotype specific due to the reduction of the dependent on the initial conditions and natural forced variability through data correction.
Data availability statement
The original contributions presented in the study are included in the article. Further inquiries can be directed to the corresponding author.
Author contributions
GA-Co designed the research, collected and organized the data, statistical analysis, drafted the manuscript. MA-Organized the data, data analysis, reviewed the draft, methodology. AS-Modeling, co-designed the research, statistical analysis, reviewed the draft, methodology JA-Co designed the research and supervised. TG-Co designed the research, supervised the research, advised on the design, reviewed and approved the final manuscript. All authors contributed to the article and approved the submitted version.
Acknowledgments
The authors acknowledge the valuable contributions of Kyere Wilson for his skillful assistance with the field work, Agyenim Boateng Bright, James Kobiah and Victoria Larweh for help with the measurements. We also acknowledge the West African Science Service Centre on Climate Change and Adapted Land Use (WASCAL) and Bundesministerium für Bildung und Forschung, Germany (BMBF) for funding this research.
Conflict of interest
The authors declare that the research was conducted in the absence of any commercial or financial relationships that could be construed as a potential conflict of interest.
Publisher’s note
All claims expressed in this article are solely those of the authors and do not necessarily represent those of their affiliated organizations, or those of the publisher, the editors and the reviewers. Any product that may be evaluated in this article, or claim that may be made by its manufacturer, is not guaranteed or endorsed by the publisher.
References
Adusei G., Aidoo M. K., Srivastava A. K., Asibuo J. Y., Gaiser T. (2021). The variability of grain yield of some cowpea genotypes in response to phosphorus and water stress under field conditions. Agronomy 11, 28. doi: 10.3390/agronomy11010028
Adusei G., Aidoo M. K., Srivastava A. K., Asibuo J. Y., Gaiser T. (2022). The impact of climate change on the productivity of cowpea (Vigna unguiculata) under three different socio-economic pathways. Ital. J. Agron. 17, 2118. doi: 10.4081/ija.2022.2118
Agbicodo E. M., Fatokun C. A., Muranaka S., Visser R. G. F., van der C. G. L. (2009). Breeding drought tolerant cowpea: constraints, accomplishments, and future prospects. Euphytica 167, 353–370. doi: 10.1007/s10681-009-9893-8
Aidoo M. K., Bdolach E., Fait A., Lazarovitch N., Rachmilevitch S. (2016). Tolerance to high soil temperature in foxtail millet (Setaria italica l.) is related to shoot and root growth and metabolism. Plant Physiol. Biochem. 106, 73–81. doi: 10.1016/j.plaphy.2016.04.038
Allen R. G., Pereira L. S., Raes D., Smith M. (1998). Crop evapotranspiration - guidelines for computing crop water requirements (Rome: FAO), 56. FAO-Irrigation and Drainage Paper.
Boe J., Terray L., Habets F., Martin E. (2007). Statistical and dynamical ´ downscaling of the seine basin climate for hydro-meteorological studies. Int. J. Climatology 27, 1643–1655. doi: 10.1002/joc.1602
Casanueva A., Herrera S., Iturbide M., Lange S., Jury M., Dosio A., et al. (2020). Testing bias adjustment methods for regional climate change applications under observational uncertainty and resolution mismatch. R. meteorogical Soc. 21, 7.e978. doi: 10.1002/asl.978
Ceglar A., Kajfež-Bogataj L. (2012). Simulation of maize yield in current and changed climatic conditions: addressing modelling uncertainties and the importance of bias correction in climate model simulations. Eur. J. Agron. 37, 83–95. doi: 10.1016/j.eja.2011.11.005
Challinor A. J., Müller C., Asseng S., Deva C., Nicklin K. J., Wallach D., et al. (2017). Improving the use of crop models for risk assessment and climate change adaptation. Agric. Syst. 159, 296–306. doi: 10.1016/j.agsy.2017.07.010
Corbeels M., McMurtrie R. E., Pepper D. A., O’Connell A. M. (2005). A process-based model of nitrogen cycling in forest plantations. i. structure, calibration and analysis of the decomposition model. Ecol. Modell. 187, 426–448. doi: 10.1016/j.ecolmodel.2004.09.005
Dettinger M. D., Cayan D. R., Meyer M. K., Jeton A. E. (2004). Simulated hydrologic responses to climate variations and change in the merced, Carson, and American river basins, Sierra Nevada, California 1900–2099. Climatic Change 62, 283–317. doi: 10.1023/B:CLIM.0000013683.13346.4f
Dobler A., Ahrens B. (2008). Precipitation by a regional climate model and bias correction in Europe and south Asia. Meteorologische Z. 17, 499–509. doi: 10.1127/0941-2948/2008/0306
Ewansiha S. U., Singh B. B. (2006). Relative drought tolerance of important herbaceous legumes and cereals in the moist and semi-arid regions of West Africa. J. Food Agric. Environ. 4, 188–190.
Frimpong H. N., Kerr R. B. (2015). The relative importance of climate change in the context of multiple stressors in semi-arid Ghana. Glob. Environ. Change 32, 40–56. doi: 10.1016/j.gloenvcha.2015.03.003
Gaiser T., Perkons U., Kupper P. M., Kautz T., Puschmann D. U., Ewert F., et al. (2013). Modeling biopore effects on root growth and biomass production on soils with pronounced sub-soil clay accumulation. Ecol. Model. 256, 6–15. doi: 10.1016/j.ecolmodel.2013.02.016
Glotter M., Elliott J., McInerney D., Best N., Foster I., Moyer E. J. (2014). Evaluating the utility of dynamical downscaling in agricultural impacts projections. Proc. Natl. Acad. Sci. 111, 8776–8781. doi: 10.1073/pnas.1314787111
Harding R. J., Weedon G. P., van Lanen H. A. J., Clark D. B. (2014). The future for global water assessment. J. Hydrology 518, 186–193. doi: 10.1016/j.jhydrol.2014.05.014
Hartmann A., Šimůnek J., Aidoo M. K., Seidel S. J., Lazarovitch N. (2018). Implementation and application of a root growth module in HYDRUS. Vadose Zone J. 17, 1–16. doi: 10.2136/vzj2017.02.0040
Hempel S., Frieler K., Warszawski L., Schewe J., Piontek F. (2013). A trend-preserving bias correction - the ISI-MIP approach. Earth Syst. Dynam. 4, 219–236. doi: 10.5194/esd-4-219-2013
Iturbide M., Casanueva A., Bedia J., Herrera S., Milovac J., Gutiérrez J. M. (2020). On the need of bias adjustment for more plausible climate change projections of extreme heat (Actmospheric Science Letters).
Kajfez-Bogataj L., Pogacar T., Ceglar A., Crepinsek Z. (2010). Trends in agro-climate variables in Slovenia. Acta Agr. Slov. 95, 97–109.
Kjellstrom E., Boberg F., Castro M., Christensen J. H., Nikulin G., Sanchez E. (2010). Daily and monthly temperature and precipitation statistics performance indicators for regional climate models. Climate Res. 44, 135–150. doi: 10.3354/cr00932
Laux P., Rötter R. P., Webber H., Dieng D., Rahimi J., Wei J., et al. (2021). To bias correct or not to bias correct? an agricultural impact modelers’ perspective on regional climate model data. Agric. For. Meteorology 108406, 304–305. doi: 10.1016/j.agrformet.2021.108406
Macadam I., Argüeso D., Evans J. P., De L. L., Pitman A. J. (2016). The effect of bias correction and climate model resolution on wheat simulations forced with a regional climate model ensemble. Int. J. Climatol. 14, 4577–4591. doi: 10.1002/joc.4653
Maraun D. (2016). Bias correcting climate change simulations - a critical review. Curr. Climate Change Rep. 2, 211–220. doi: 10.1007/s40641-016-0050-x
Maraun D., Wetterhall F., Ireson A. M., Chandler R. E., Kendon E. J., Widmann M., et al. (2010). Precipitation downscaling under climate change. recent developments to bridge the gap between dynamical models and the end user. Rev. Geophysics 48. doi: 10.1029/2009RG000314
Maurer E., Brekke L., Pruitt T., Thrasher B., Long J., Duffy P., et al. (2014). An enhanced archive facilitating climate impacts and adaptation analysis. Bull. Am. Meteorological Soc. 95, 1011–1019. doi: 10.1175/BAMS-D-13-00126.1
Nelson G. C., Rosegrant M. W., Koo J., Robertson R. D., Sulser T. B., Zhu T., et al. (2009). Climate change: impact on agriculture and costs of adaptation. (Research report) (Washington DC: International Food Policy Research Institute).
Niang I., Ruppel O. C., Abdrabo M. A., Essel A., Lennard C., Padgham J., et al. (2014). “Africa,” in Climate change 2014: impacts, adaptation, and vulnerability. part b: regional aspects. contribution of working group II to the fifth assessment report of the intergovernmental panel on climate change. Eds. Barros V. R., Field C. B., Dokken D. J., Mastrandrea M. D., Mach K. J., Bilir T. E., Chatterjee M., Ebi K. L., Estrada Y. O., Genova R. C., Girma B., Kissel E. S., Levy A. N., MacCracken S., Mastrandrea P. R., White L. L. (Cambridge, United Kingdom and New York, NY, USA: Cambridge University Press), 1199–1265.
Panofsky H. W., Brier G. W. (1968). Some applications of statistics to meteorology (Philadelphia: The Pennsylvania State University Press).
Piani C., Haerter J. O., Coppola E. (2010). Statistical bias correction for daily precipitation in regional climate models over Europe. Theor. Appl. Climatol. 99, 187–192. doi: 10.1007/s00704-009-0134-9
Ringler C. (2008). Climate variability and change impact on water and food outcomes (Washington DC: International Food Policy Research Institute (IFPRI).
Teutschbein C., Seibert J. (2012). Bias correction of rgional climate model simulations for hydrological climate-change impact studies: review and evaluation of different methods. J. Hydrol. 456, 12–29. doi: 10.1016/j.jhydrol.2012.05.052
Teutschbein C., Seibert J. (2013). Is bias correction of regional climate model (RCM) simulations possible for non-stationary conditions? Hydrol. Earth Syst. Sci. 17, 5061–5077. doi: 10.5194/hess-17-5061-2013
van der Kooi C. J., Reich M., Löw M., De Kok L. J., Tausz M. (2016). Growth and yield stimulation under elevated CO2 and drought: a meta-analysis on crops. Environ. Exp. Bot. 122, 150–157. doi: 10.1016/j.envexpbot.2015.10.004
Williams J. R., Izaurralde R. C. (2006). The APEX model in watershed models. Eds. Singh V. P., Frevert D. K. (Boca Raton FL USA: CRCPress, Taylor & Francis), 437–482.
Wolf J. (2012). User guide for LINTUL5: simple generic model for simulation of crop growth under potential, water limited and nitrogen, phosphorus and potassium limited conditions (Wageningen University).
Keywords: bias-correction, climate change, cowpea productivity, environmental stress, crop model
Citation: Adusei G, Aidoo MK, Srivastava AK, Asibuo JY and Gaiser T (2023) Model-based climate change adaptational potential and productivity of some cowpea genotypes and its sensitivity to bias adjustment. Front. Agron. 5:1144219. doi: 10.3389/fagro.2023.1144219
Received: 13 January 2023; Accepted: 20 April 2023;
Published: 12 May 2023.
Edited by:
Tafadzwanashe Mabhaudhi, University of KwaZulu-Natal, South AfricaReviewed by:
Dengpan Xiao, Hebei Normal University, ChinaAdmire Isaac Shayanowako, University of KwaZulu-Natal, South Africa
Copyright © 2023 Adusei, Aidoo, Srivastava, Asibuo and Gaiser. This is an open-access article distributed under the terms of the Creative Commons Attribution License (CC BY). The use, distribution or reproduction in other forums is permitted, provided the original author(s) and the copyright owner(s) are credited and that the original publication in this journal is cited, in accordance with accepted academic practice. No use, distribution or reproduction is permitted which does not comply with these terms.
*Correspondence: Grace Adusei, aduseigrace@yahoo.com