 Olga Fishkis
 Joern Strassemeyer
 Franz Pöllinger2
 Heinz-Josef Koch
- 1Department of Agronomy, Institute of Sugar Beet Research, Goettingen, Germany
- 2Institute for Strategies and Technology Assessment, Julius Kühn-Institut, Kleinmachnow, Germany
- 3Department of System Analysis, Institute of Sugar Beet Research, Goettingen, Germany
Introduction: The EU Farm to Fork strategy aims to reduce the use of pesticides and associated toxicological risks. However, the risks coming along with currently available alternatives to chemical weed control in sugar beet have not yet been evaluated. Therefore, the aim of this study was to determine the toxicological risks to arthropods, aquatic and soil organisms caused by mechanical-chemical in comparison to conventional chemical weed control in sugar beet.
Materials and methods: The risk assessment was performed using SYNOPS-GIS, a process-based model calculating the environmental fate of pesticides and the exposure risk to arthropods, aquatic and soil organisms.
Results and discussion: Overall, broadcast spraying of conventional herbicides caused low to very low toxicological risks in most regions and years in Germany. Nevertheless, there were considerably higher risks to aquatic and soil organisms from conventional broadcast spraying in northern Germany than in other regions of Germany. With conventional herbicides, mechanical-chemical weed control reduced toxicological risks proportionally to the reduction in application amount. In contrast, band spraying of the new herbicide with the active ingredients foramsulfuron and thiencarbazone-methyl caused an aquatic risk as broadcast spraying with conventional herbicides, although the application rate was 120 times lower. This was due to high toxicity of both active ingredients of the new herbicide to water plants.
Conclusions: Not only the application amount of herbicides but also environmental toxicity should be included in assessment approaches such as the EU “Harmonized Risk Indicator”.
1 Introduction
Weed control in sugar beet is currently carried out on over 90% of all sugar beet fields in Germany by broadcast herbicide spraying (Roß et al., 2018). However, the use of herbicides is criticized due to their adverse effects to human health and the environment (Geiger et al., 2010; Torretta et al., 2018). According to EU’s Farm to Fork strategy, the use of pesticides and the associated toxicological risk must be reduced by 50% by 2030 (European Commission, 2020). To achieve this goal, the European Commission wants to promote alternative weed control techniques like mechanical and mechanical-chemical weeding. In sugar beet, solely mechanical weed control is typically done with tractor hoes between the rows and with hand hoes within the rows. However, hand hoeing is very time consuming and expensive (Fishkis et al., 2024) and is only worthwhile for organic farmers because the selling price of organic sugar beet is three times higher than that of conventional sugar beet (Bundesanstalt für Landwirtschaft und Ernährung (BLE), 2023). For conventional farmers, the hand hoe is therefore not affordable. Solar-driven FarmDroid hoe robots, capable of in-row and interrow hoeing are since recently commercially available and provide a cheaper and efficient alternative to conventional mechanical weed control; however, since weeds in close vicinity of sugar beet must be removed by hand hoeing, this technique is still too expensive for conventional farmers (Kopfinger and Vinzent, 2021; Starck et al., 2021). Combined mechanical-chemical weed control with a tractor hoe between rows and band application of herbicides within rows is financially viable for conventional farmers (Schröllkamp et al., 2015) but has hardly been used in practice in Germany (in 1% of fields in 2020 and 2021, n = 637; Farm survey on sugar beet cultivation, data not published). The reason for this is a low area performance of both tractor hoe and conventional band sprayer (maximal working width of 6 m) compared to the broadcast sprayer (30 m working width). Recently, however, broadcast sprayers capable of in-row herbicide band spraying were launched on the market, making in-row weed control better practicable in future. Additional weed control between rows with a tractor hoe is still required, but the additional labor and machinery costs are more than offset by the lower cost of herbicides, so that the total costs of modern combined mechanical-chemical weed control is about 25% lower than that of chemical weed control (Fishkis et al., 2024). The reduced use of herbicides by combined mechanical-chemical methods suggests a lower toxicological risk of herbicide exposure. However, a quantitative assessment of the toxicological risk associated with different mechanical-chemical weed control methods has not yet been conducted.
Several risk indicators of pesticides use exist at the European level (Reus et al., 2002; Bockstaller et al., 2009). An overview of these indicators, which differ in their objectives, temporal and spatial scales, and evaluation methods, is provided by a survey conducted as part of the OECD “Expert Group on Pesticide Risk Indicators” (OECD, 2016; Pierlot et al., 2017). SYNOPS is a pesticide risk indicator developed in Germany to assess the terrestrial and aquatic environmental risks of pesticide use. It has been used since 2005 as a part of the “National Action Plan for the Sustainable Use of Pesticides (NAP)” for annual reporting on the development of the risk associated with the use of pesticides in Germany (NAP, 2017). The SYNOPS model calculates predicted environmental concentrations (PEC) of each active ingredient (AI) of agrochemicals in soil, surface water and field margin, based on weather, soil, topography, and agronomic data and relates them to toxicity endpoints of various non-target organisms, which are summarized in the pesticide property database (Lewis et al., 2016). The resulting Exposure Toxicity Ratio (ETR) is used as toxicity risk indicator (Gutsche and Strassemeyer, 2007). Environmental risk assessment using the SYNOPS model has been repeatedly applied for pesticide use data of cereals, rapeseed, and sugar beet (Gutsche et al., 2012; Strassemeyer and Golla, 2018). The regional approach of SYNOPS-GIS is to apply the field specific assessments of SYNOPS on all fields in a considered region and aggregate them on regional level. Nause et al. (2021) assessed the risks of broadcast applications of different herbicides using SYNOPS-GIS based on herbicide application data from 2314 randomly selected sugar beet fields. They showed that some combinations of active ingredients, application dates and field-specific environmental conditions provoked higher risks, although in most cases the risks were below the “elevated risk level” of ETR=1. Strassemeyer and Golla (2018) found that among pesticides applied in cereals and rapeseed, herbicides had the highest contribution to the aquatic risk. Gutsche et al. (2012) reported a strong reduction of toxicological risks if using a “Minimal dosage strategy” with a high number of herbicides with reduced application rates against a “Common practice strategy” with a smaller number of herbicides applied at usual application rates. However, the risks associated with the currently available combined mechanical-chemical weed control methods in sugar beet have not yet been assessed.
It remains an open question whether the toxicological risks of techniques with reduced herbicide application (such as band or spot spraying) decrease linearly with the decrease in the amount of herbicide applied. Therefore, the objectives of this study were to calculate the acute and chronic risks for arthropods, soil and aquatic non-target organisms associated with different conventional and new-coming mechanical-chemical and chemical weed control techniques in sugar beets in different soil-climate regions in Germany, using SYNOPS-GIS model. In addition, the exposure risks of herbicides frequently used by German sugar beet farmers in 2011-2018 is compared with the risks of a new herbicide technology, which has been recently registered in Germany.
2 Materials and methods
2.1 Method of spatial risk analysis
The spatial data basis for the risk analyses carried out with the SYNOPS-GIS model were the field blocks with arable crops from ATKIS (AdV, 2008). The geometries of the ATKIS field blocks were intersected with further digital data sets such as the digital soil map BÜK1000N (Richter et al., 2007) and the digital elevation model DGM-10 (DGM, 2016). As a result, field-related soil parameters and the slope gradients of the individual areas were derived. By intersecting the field geometries with ATKIS water bodies, the distance to one or more surface water bodies, and the water body type and width class of the relevant water body was determined. The allocation of the sugar beet crop (as well as other crops) to the ATKIS field blocks was based on data on the cultivation statistics at municipality level (Gocht and Röder, 2014). For each field the suitability for the cultivation of sugar beet and other crops was derived from a combination of field size and Soil Quality Rating (Mueller et al., 2007). The objective function for the distribution of crop types maximizes the sum of the suitability for cultivation across all crops within a municipality, i.e. the crops are preferentially distributed to the fields that have the highest specific suitability for cultivation. The different crops are distributed to the agricultural fields in such a way that the sum of the cultivated areas corresponds to the crops’ area according to the Thünen Agricultural Atlas (Gocht and Röder, 2014).
In addition, spatial allocations to districts, water catchment areas or soil-climate regions (Roßberg et al., 2007) are available to enable later aggregation of the predicted risk indices at field-level for different spatial areas. Daily values for temperature, precipitation, global radiation, and wind from about 280 weather stations and 2800 precipitation stations of the German Weather Service (DWD, 2016) were used as climatic model input variables. These data were interpolated to a 1 km x 1 km grid and then assigned to the individual fields. The information on the active ingredient content and the application conditions of the plant protection products (PPP) used was obtained by linking to the online database of approved plant protection products of the BVL (BVL, 2019). The application requirements with respect to (i) the minimum distances to be maintained from surface water bodies, and (ii) the runoff reduction on areas with slopes > 2% and > 4% were taken from the database and integrated in the risk analysis. The toxicological and physical chemical properties of PPP active ingredients were taken from the online Pesticide Property Database (PPDB) (Lewis et al., 2016). Both databases are updated every three months.
2.2 Derivation of generic application patterns of herbicides used in sugar beet
For the risk assessment performed in this study, generic application patterns of herbicides used in sugar beet were generated based on data from annual farm surveys on sugar beet cultivation in Germany, carried out by the sugar companies, the sugar beet grower associations, and the Institute of Sugar Beet Research (Stockfisch et al., 2013). From this survey, applied PPPs are ascertained and transmitted to Julius Kühn-Institute (JKI), where the data are included in the PAPA dataset (Roßberg et al., 2017). For privacy reasons, it was not possible to precisely assign each collected application pattern to the field to which it was applied. In our study, in order to analyze regional differences in the risk of PPP applications, all survey data were assigned to one of six regions which had been previously identified using a cluster analysis of 50 soil-climate regions in Germany and are referred to as CEPI regions (Clusters for Evaluation of PSM use Intensity, Dachbrodt-Saaydeh et al., 2019). The soil-climate regions were in turn formed by a cluster analysis of municipalities with similar soil properties, temperatures and precipitation (Dachbrodt-Saaydeh et al., 2019). From the survey data, three herbicide application patterns were identified for each CEPI region for each year in the period 2011-2018 using the procedure described below. These three application patterns correspond to three spraying sequences with a high, medium and low herbicide intensity, reflecting the range of chemical weed control practice in sugar beet representative for each CEPI region and year.
The herbicide use intensity was derived from the treatment index (TI), which summarizes the number of PPP applications over the course of a cropping period standardized to the maximum permitted application rate per application pattern (Roßberg, 2013). According to its TI, each herbicide application pattern, recorded in the survey from one specific CEPI region and year, was assigned to one of the three groups: (1) low intensity: TI ≤ 33-percentile, (2) medium intensity 66-percentile > TI > 33-percentile; (3) high intensity TI ≥ 66-percentile. Note that TI is not a toxicological index and was used to reflect the differences in agronomic application intensity caused by differing weed infestation and not the differences in potential ecotoxicological risks.
Further, for each CEPI region, year and intensity level, the herbicide applications in each month were counted and the months with the most frequent applications were defined as application periods. Next, the most frequently applied herbicides or tank mixtures in each CEPI region and intensity level were selected. A similar procedure was used to determine the application dates. First, the most frequent treatment date per year was selected. The next most frequent treatment date with a minimum interval of 7 days was then taken as the subsequent treatment date. The modal value of the application rates of the selected herbicides was used as the most frequent application rate (or the respective application rates of the tank-mix partners). Finally, the TIs of generated herbicide sequences were checked for compliance with the mean TI values of the intensity levels for the CEPI region. If the difference between the mean and the generated TIs was greater than 0.5, then other or additional herbicide applications were selected, and the subsequent steps were run again. The generation of generic application patterns was (semi-)automated by using a JKI-internal web application, thereby increasing the degree of reproducibility. In addition, an integrated plausibility test provided information on overdosage (application rate > 100% of the approved application rate) and too low application rates (< 5% of the approved application rate). Finally, the generic application patterns were checked for plausibility by experts from the Institute of Sugar Beet Research: two experts responsible for the evaluation of data from the Germany-wide farm survey on sugar beet cropping and another one responsible for the analysis of national sugar beet herbicide trials, and further by eight experts from regional sugar beet growers associations and consultants from the sugar industry both responsible for advising beet farmers in their area. Table 1 shows an example of generic application pattern of herbicides for CEPI Region D in 2018.
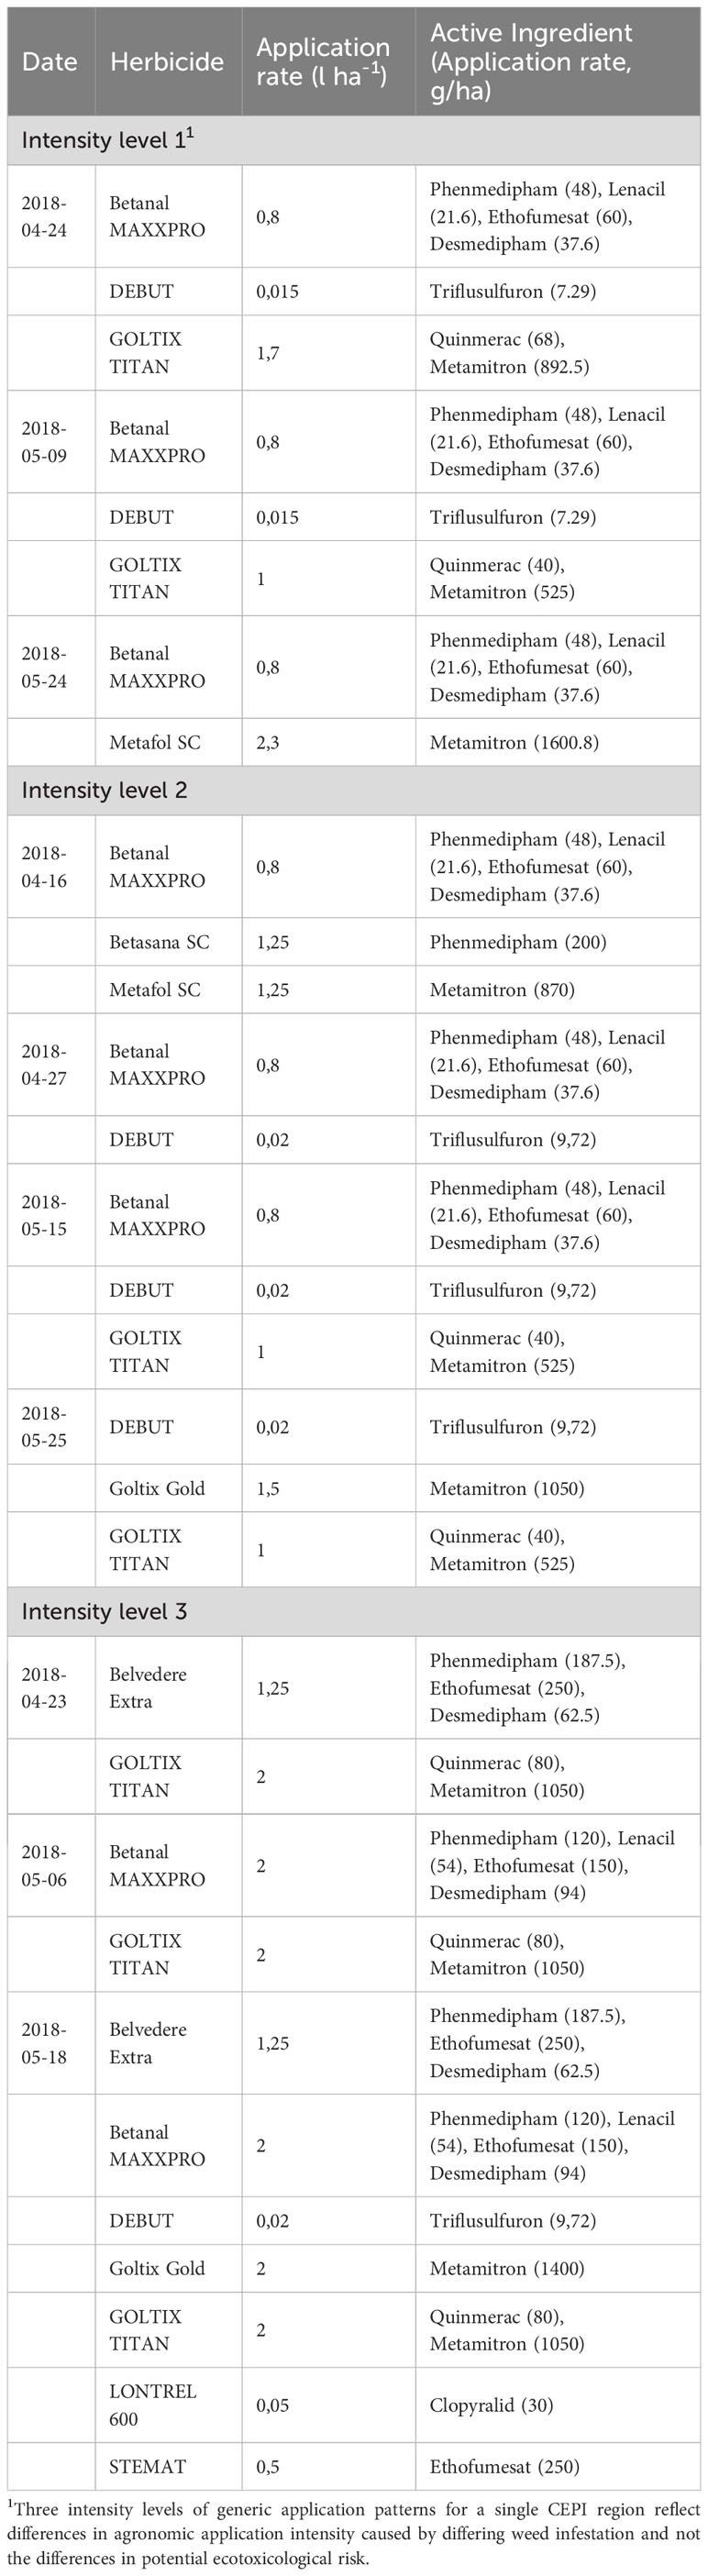
Table 1 Generic application pattern of herbicides for three intensity levels for CEPI region D in 2018.
2.3 Model scenarios for risk assessment with SYNOPS
Risk assessment in SYNOPS-GIS was carried out for conventional broadcast herbicide application and for four combined mechanical-chemical weed control methods (Table 2). Only post-emergent weed control strategies were considered. To simulate conventional herbicide (CH) broadcast spraying, the generic application patterns of herbicides (see 2.2) were applied to 100% area of a sugar beet field (Table 2, No. 1). To evaluate the toxicological risks associated with band spraying (CH-broadcast-band spraying, CH-band spraying; Table 2, No. 2, 3) the application rate of the herbicides listed in the generic application patterns was set at 44%, assuming a row spacing of 45 cm and a width of the sprayed band of 20 cm. The smallest spatial unit in SYNOPS-GIS is a single field, so heterogeneity of input data within the field could not be accounted for. Therefore, application rates had to be adjusted to correspond to the cumulative amount of herbicides applied in a field. In CH-broadcast-band spraying (Table 2; No. 2), since the first application was made to the entire field and subsequent band applications were 44% compared to CH-broadcast spraying, the total amount of herbicide applied over the growing season was equivalent to 63% of the amount by CH-broadcast spraying. For the evaluation of the toxicological risk of CH-spot-spraying, the application rate of the herbicides listed in the generic application patterns was set at 12.5%, assuming that the distance between rows was 45 cm and the spot size was 10 cm x 10 cm (18 cm in-row distance of beet plants). For NHT band spraying (Table 2; No. 5), two applications of 0.011 kg/ha Foramsulfuron and 0.0066 kg/ha Thiencarbazone-methyl were used as model input, which corresponds to 44% of the maximum quantity per application permitted for this herbicide in Germany for broadcast spraying on undrained fields (Oct. 2022). The total amount of applied active ingredients for NHT-band spraying corresponds to 1% from the total sum of active ingredient rates in kg/ha applied in generic application pattern of medium intensity (Table 1). The new herbicide acts both via the leaves and the soil, belongs to ALS-inhibitor mode of action and is applicable in combination with ALS-tolerant sugar beet varieties solely. Only one of the conventional herbicides included in generic application patterns comprises an active ingredient, namely Triflusulfuron-methyl, with the same mode of action as the new one. Other conventional herbicides include active ingredients with other modes of action: lipid biosynthesis inhibitors, plant growth regulators, photosynthesis inhibitors and shoot-growth inhibitors.
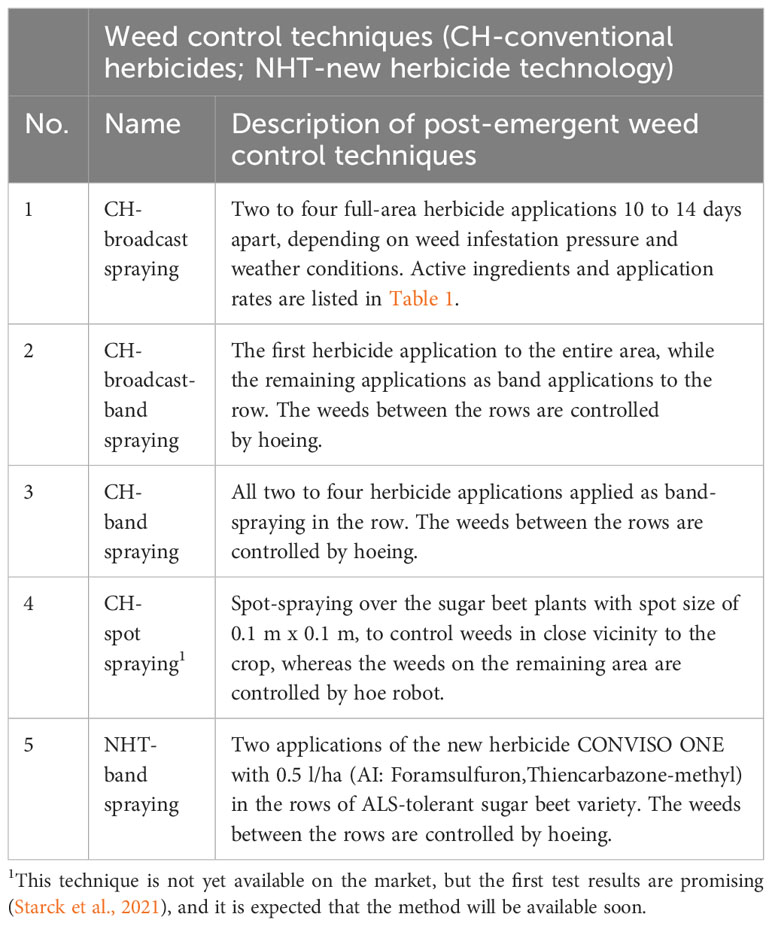
Table 2 Weed control techniques in sugar beet used in SYNOPS GIS to calculate the toxicological risk for soil organisms, arthropods and aquatic organisms.
2.4 Methodology of risk assessment at site level and spatial aggregation of risk indices
In the SYNOPS model, the toxicological risk for non-target arthropods, and aquatic and soil organisms used as reference organisms was expressed by the Exposure Toxicity Ratio (ETR), i.e. the ratio of the exposure of reference organisms to PPP active substances under worst-case conditions and the toxicity of these active substances to these organisms (Equation 1).
The methodology for calculating the toxicological risk was presented in detail by Strassemeyer et al., 2017. Briefly, the predicted environmental concentration (PEC) or the estimated PPP exposure in surface waters is calculated for PPP inputs by considering spray drift, surface runoff and erosion. The concentrations of active ingredients in field margins are calculated via field applications and spray drift, whereas the concentration of an active ingredient in soil is calculated by considering field applications and crop interception. First order degradation of the substances in soil, water and on plants is considered (Strassemeyer et al., 2017).
The half-maximal lethal concentration (LC50), effect concentration (EC50) or lethal rate (LR50), and the no-effect concentration (NOEC) of the individual active ingredients is used to quantify toxicity. In sugar beet, several combinations of active ingredients are typically used on several dates to control weeds with herbicides (Table 1). Active ingredients with identical or different modes of action can interact additively or produce antagonistic or even synergistic effects that are greater than the sum of the individual effects (Knillmann et al., 2021; Dietrich et al., 2022). However, a sufficiently good performance of the additive approach by prediction of mixture toxicity of pesticides has been confirmed for aquatic organisms (Belden et al., 2007). For terrestrial organisms, the possible synergistic or antagonistic effects of most active ingredient combinations are unknown. Therefore, in the present study, the ETRs of the individual active ingredients or applications were aggregated according to the concept of concentration addition (Verro et al., 2009; Vaj et al., 2011; Zhan and Zhang, 2012) to capture the risk across the entire weed control strategy (multiple active ingredients and/or multiple applications) for a specific reference organism. The risk aggregation of an application pattern was performed in three steps. First, for each day, the acute (ETRA(RO))and chronic risk (ETRC(RO)) of a given active ingredient (AI) was calculated for a given reference organism (RO). Second, for each day, the ETR values of multiple AIs were summed up to derive the daily risk caused by all AIs for a given reference organism. Third, the 90th percentile of 365 daily ETRs was derived, representing the acute (Equation 2) and chronic (Equation 3) risk of the entire herbicide application strategy for a given reference organism and field.
where PEC(t, AIi) is the predicted environmental concentration for t-th day and i-th AI. PECTWA is the time weighted average concentration of 7 days. LC50, LR50, LD50 and NOEC refer to specific RO to i-th AI. n represents the number of AIs with additive effect. Acute endpoints are multiplied by a factor of 0.1, resulting in a safety factor of 10 for acute risks, because the acute endpoints represent the higher hazard than the chronic endpoints.
To assess the risk of PPP exposure to surface waters, SYNOPS considers the following five reference organisms: algae (al), aquatic invertebrates (e.g., Daphnia sp., da), fish (fi), aquatic plants (Lemna sp., le), and sediment organisms (Chironomus sp., ch). Risk indices were first calculated separately for each of the reference organisms. Then, the acute (Equation 4) and chronic (Equation 5) aquatic risk was each calculated as the maximum of the risk indices of the aquatic reference organisms.
ETRA(aq) and ETRC(aq) represent acute and chronic risk for aquatic organisms.
For the soil concentration, it was assumed that the AI is distributed in the upper 2.5 cm soil layer. Toxicity data of the reference organisms in soil were available for earthworms (ew) and springtails (Collembolae; co) (Equation 6).
ETRC(soil) represents chronic risk for soil organisms.
For the three reference organisms in field margin (FM) biotopes, honeybees (bi), predatory mites (Typhlodromus pyri; tp), and braconid wasps (Aphidius rhopalosiphi; ar), only acute toxicity values are included under regulatory approval. Therefore, only acute risks were calculated as the maximum of the indices of the three ROs in FM biotopes (Equation 7).
ETRA(FM) represents the risk for organisms in FM. All calculations were performed assuming that the distance requirements to water bodies and terrestrial small structures as well as the runoff requirements were met. The calculated ETR for organisms in surface waters, non-target arthropods (NTA) in field margins, and for soil organisms were assigned to five risk classes:< 0.01 no risk; 0.01 ≤ ETR< 0.1 very low risk; 0.1 ≤ ETR< 1 low risk; 1 ≤ ETR< 10 elevated risk; ETR ≥ 10 high risk (Strassemeyer et al., 2017).
The calculated field- and year-specific risk indices ETRA(aq), ETRC(aq), ETRA(FM) and ETRC(soil) were stored in a database. From this database, the risk indices for different spatial units could be aggregated, analyzed, and presented. In this study, for assessing regional differences in toxicological risk in Germany, the data were aggregated on soil-climate region (SCR) level (Roßberg et al., 2007), as the aggregation of data at the CEPI-region leveled spatial differences and was therefore less informative. For each of the 36 sugar beet growing SCR, the 90th percentile of each risk index from all sugar beet fields within a given SCR in each year was calculated. For visualization, the SCR-specific risk indices were clustered within 6 CEPI-regions, whereby the variance between SCRs within individual CEPI-regions and the variance between CEPI-regions can be illustrated. Since the same herbicide application pattern was used for all SCR within individual CEPI regions, the variance in risk index between SCR within a single CEPI-region is caused solely by differences in environmental characteristics. In addition, the 90th percentile of risk indices from all sugar beet fields in Germany was also calculated to obtain aggregated risk indices for Germany as a whole.
2.5 Statistical evaluation
Statistical analyses were performed with R version 4.1.1 (R Core Team, 2020). Generalized linear mixed models (glmm) with SCR as a fixed effect and year as a random effect, followed by the Sidak method of multiple mean comparison (p<0.05), were applied to assess regional differences in SCR-aggregated ETRs associated with CH-broadcast spraying. The SCRs were further subdivided in two groups with high and low risk respectively. The difference between the two groups with respect to different environmental parameters was tested using Welch`s t-test. Furthermore, the glmm was applied to estimate effects of different environmental parameters on ETR associated with CH-broadcast spraying at the field level. The gamma-distribution of model residuals with log link was considered both for modeling field and SCR-aggregated ETRs. Residual diagnostics was calculated using DHARMA package. The models were build using glmmTMB package.
The ETRs associated with five weed control methods (Table 2) in six selected SCR were statistically evaluated by mixed linear models (nlme package), considering weed control method, SCR and their interaction as fixed effects and the effect of year as a random effect. The response variable was log-transformed to fulfil the model requirements. Residuals of the final models were checked for homoscedasticity by Levene’s test as well as graphically and for normal distribution by the Shapiro–Wilk test as well as graphically. Since F test for fixed effects showed that the interaction between weed control method and SCR was not significant (p>0.05) it was excluded from the final model. Marginal means for each method were then calculated using package emmeans. Sidák’s method was further used to determine confidence intervals for each group mean and statistical significance (p<0.05) of difference. Additionally, the acute aquatic risk, ETRA(aq) associated with NHT-band spraying and CH-broadcast spraying was analyzed in all sugar beet growing SCR using generalized linear mixed models. Weed control method, SCR and their interaction were incorporated as fixed effects and the effect of year as a random effect. The gamma-distribution of model residuals with log link was considered. T-test was applied to evaluate the difference in toxicological risk between both weed control methods within each SCR (p<0.05). Residual diagnostics was calculated using DHARMA package.
3 Results
Acute aquatic (ETRA(aq)) and chronic soil organism (ETRC(soil)) risk from CH-broadcast spraying varied widely among SCR, but also among the 8 study years (2011-2018). In most SCR and years, the 90th percentile of acute aquatic risk was very low at ≤ 0.1, but in SCR 101, 152, 154, 157, and 158 it was 0.2-0.8 in all 8 study years, which was still considered low risk but significantly higher than in most other regions (Figure 1). SCRs with elevated risks had a significantly lower minimal distance to water bodies and a significantly higher share of standing water than the other SCRs (Table 3). The greater the distance to water bodies and the higher the proportion of flowing waters, the lower the log-transformed aquatic risk, as indicated by the negative estimates of the corresponding predictors in the glmm analyses (Table 4). The slope of the field was also significantly lower in the SCRs with elevated aquatic risk, although it had a positive effect on aquatic risk, but the effect of a lower slope was more than offset by the stronger effect of a high proportion of standing water (Tables 3, 4). 90th percentile of chronic risk for soil organisms remained low at 0.1–0.2 in most SCR but significantly (p<0.05) increased to 1.0–1.5 (elevated risk) in individual SCR (105, 151, 153, 156; Figure 1). The SCRs with high risk for soil organisms had a significantly higher organic C content in topsoil compared to other SCRs (Table 3). According glmm, this parameter was one of the strongest positive predictors of ETRC(soil) (Table 4).
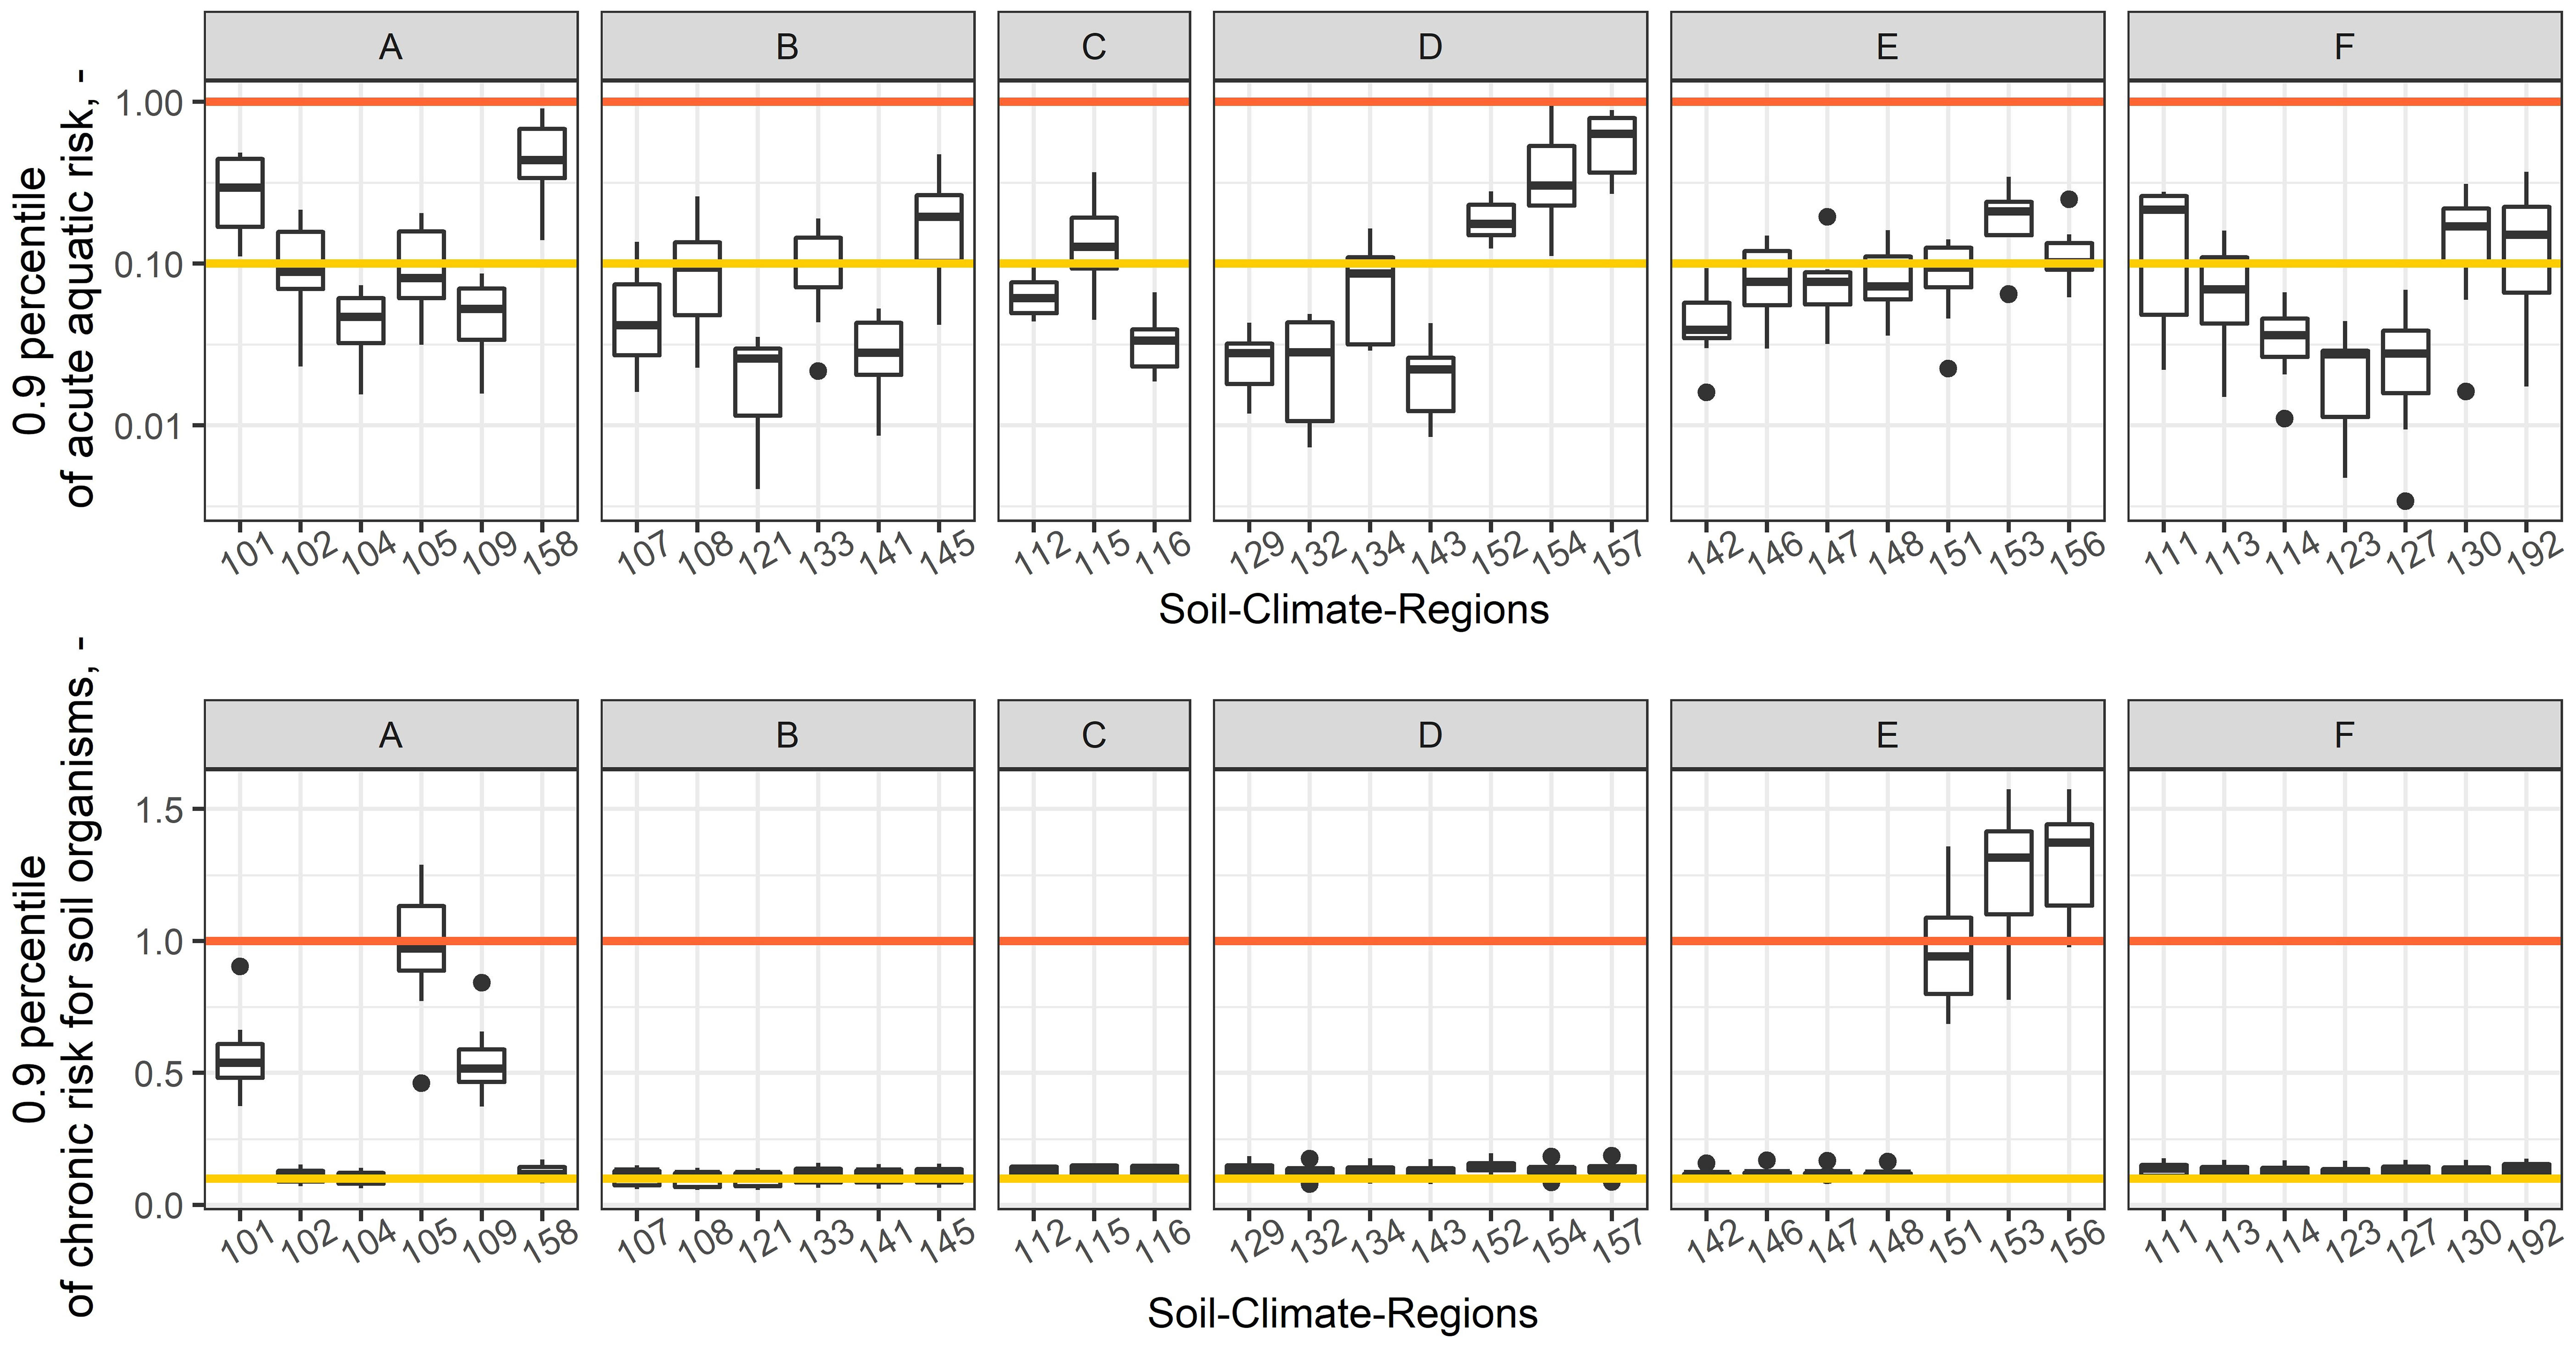
Figure 1 90th percentiles of acute aquatic (ETRA(aq)) and chronic risk for soil organisms(ETRC(soil)) in different soil-climate-regions in 6 CEPI regions (A–F). The location of CEPI regions and soil-climate-regions in Germany are given in Figure 6. Each boxplot includes 8 data points (8 years, 2011-2018). The yellow line shows the transition from very low to low risk, and the orange line from low to elevated risk.
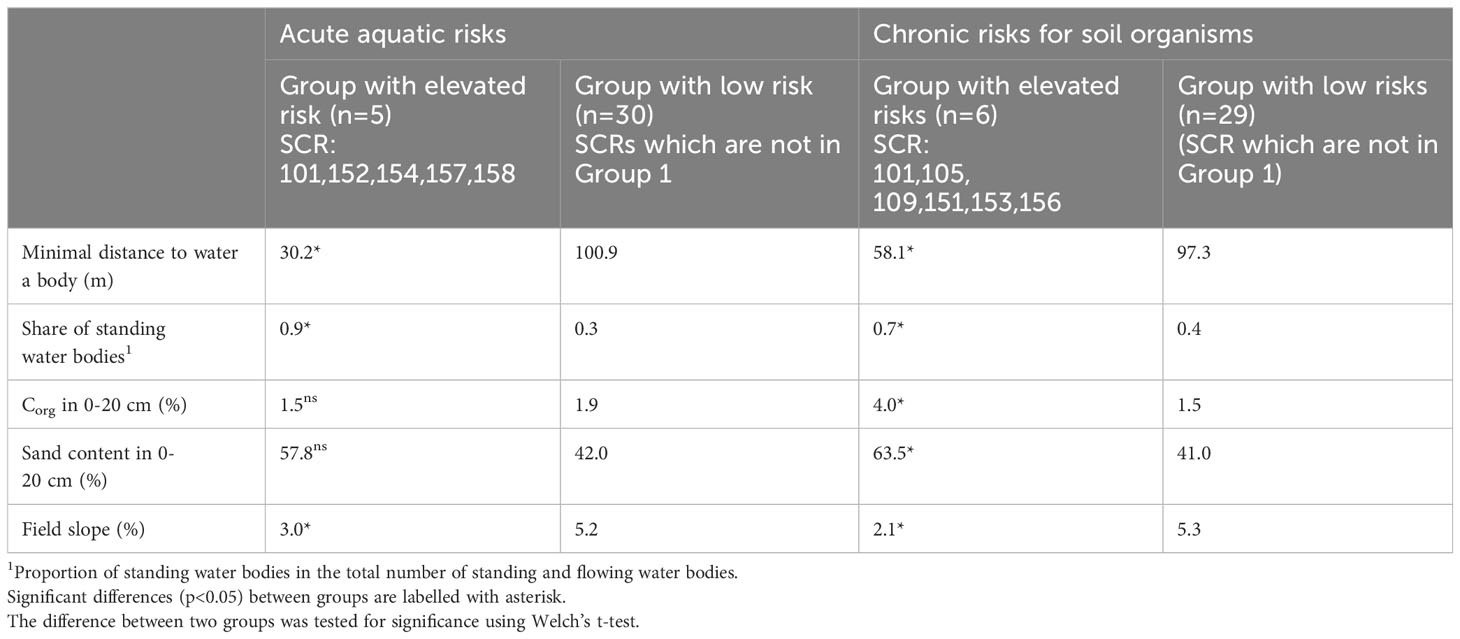
Table 3 Mean environmental parameters in soil-climate regions with elevated and low toxicological risks.

Table 4 Environmental parameters impact on acute aquatic risks (ETRA(aq)) and chronic risk for soil organisms (ETRC(soil)) as analyzed with general linear mixed models.
The chronic aquatic risk (ETRC(aq)) and the acute risk for non-target arthropods (ETRA(FN)) were very low in all SCRs and years and thus, are not shown here. Figure 2A shows the 90th percentile of acute aquatic and chronic risks for soil organisms for combined mechanical-chemical weed control techniques in comparison to CH-broadcast spraying in 6 SCR. For this comparison, one SCR per CEPI region was selected, where the toxicological risk by broadcast spraying was higher than that of the other SCR in the same CEPI region. Both weed control method (n=5) and SCR (n=6) were significant for acute aquatic (F=168, p<0.001; F=33, p<0.001) and chronic risk for soil organisms (F=2552, p<0.001; F=1182, p<0.001) as evaluated by mixed model analysis. For all methods except NTH-band spraying, there was a nearly linear relationship between herbicide application amount and associated toxicological risk (Table 5). However, weed control techniques with reduced herbicide use of 63% and 44% of the full herbicide application amount did not differ significantly in acute aquatic risk and, in some regions, in chronic risk to soil organisms as indicated by pairwise comparison of means (Figures 2A, B). The NTH-band spraying caused as much acute aquatic risk as the CH-broadcast spraying in six selected SCRs (Figure 2A). In contrast, in all regions and years, the chronic risk to soil organisms was much lower with NTH-band spraying compared with CH-broadcast spraying (Figure 2A). The chronic risk to aquatic organisms and acute risk to field margin organisms associated with NHT-band spraying remained negligible (not shown).
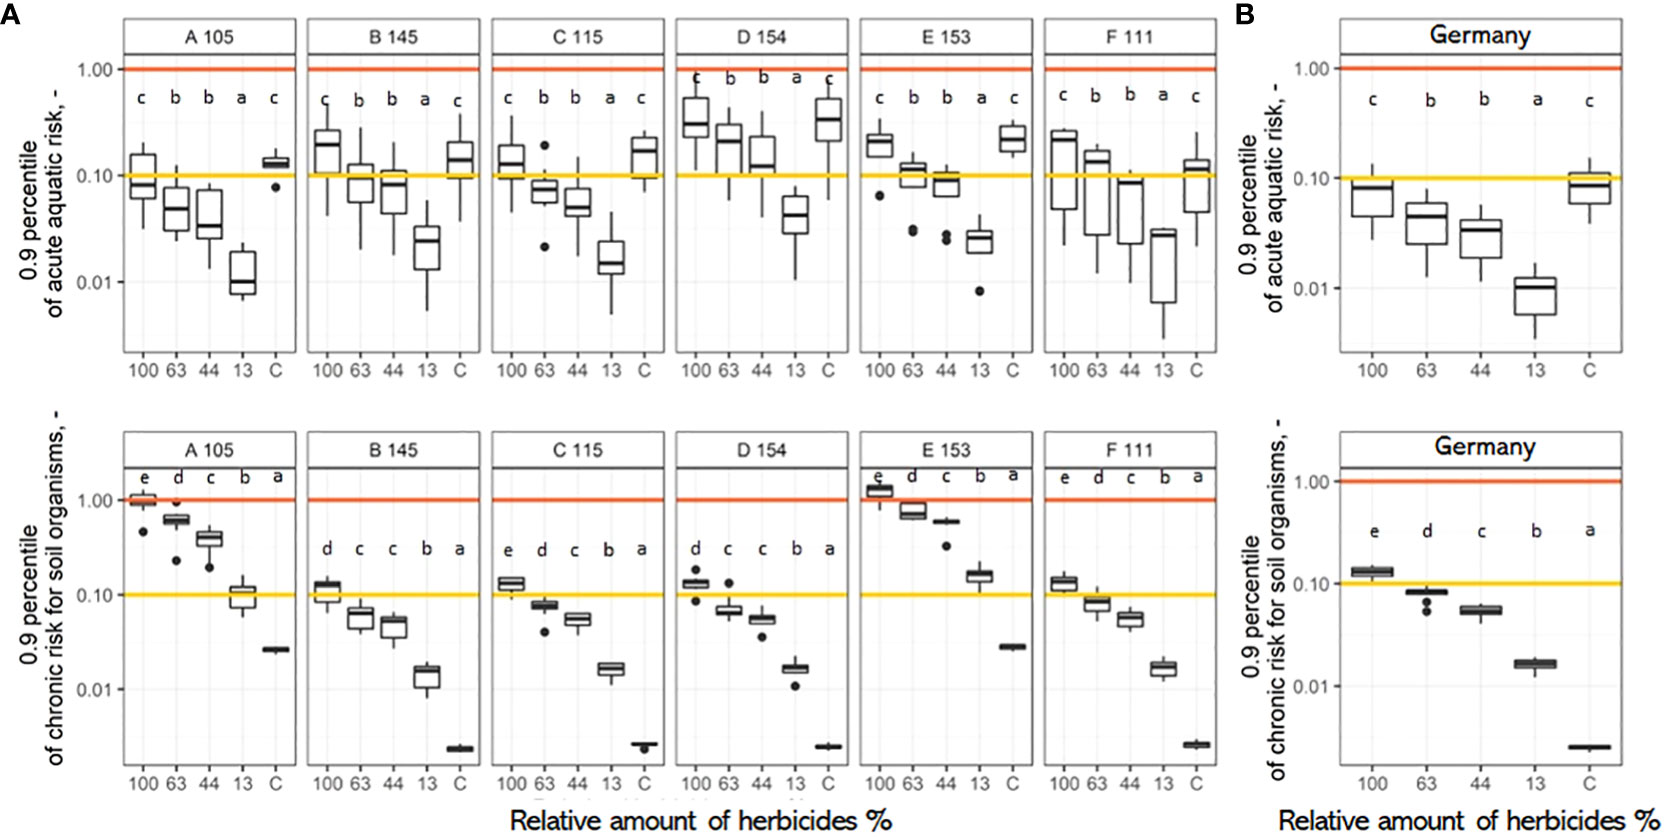
Figure 2 Toxicological risk (ETRA(aq); ETRC(soil)) of reduced-herbicide weed control techniques compared with the risk of conventional broadcast spraying aggregated over selected soil-climate-regions (105, 145, 115, 154, 153, 111) in CEPI regions A-F (A) and aggregated over Germany (B). The location of the soil-climate-regions and CEPI regions is given in Figure 6. Each boxplot includes 8 data points for 8 years (2011-2018). “C” denotes CONVISO ONE Band-spraying method. Significant differences between weed control methods are indicated with different lowercase letters.
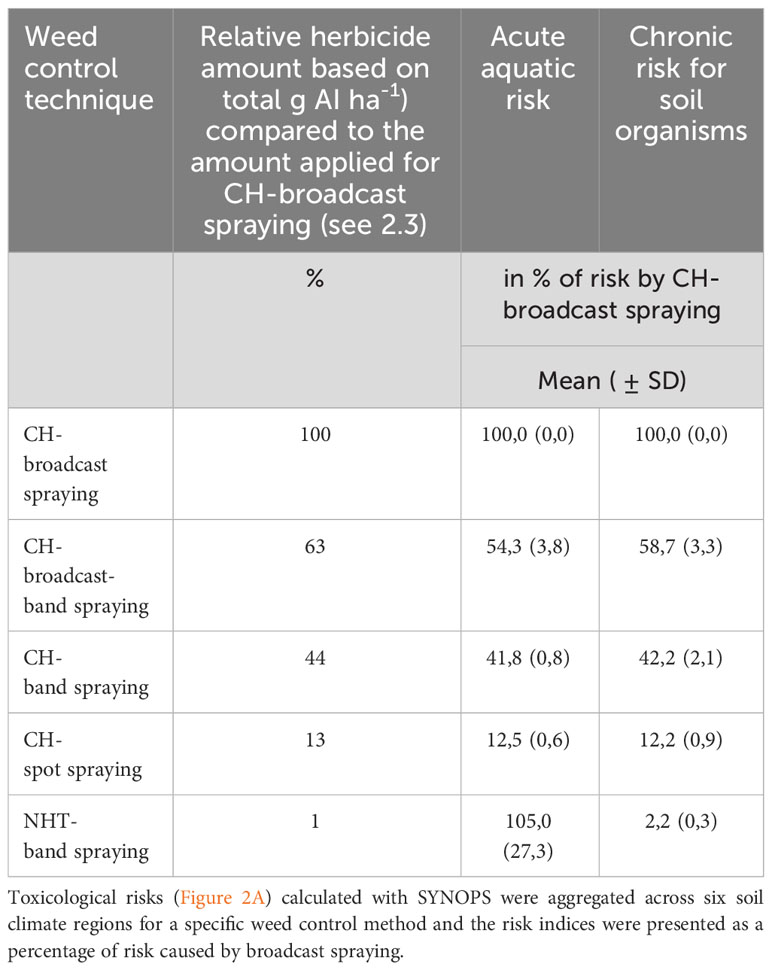
Table 5 Toxicological risks for aquatic (ETRA(aq)) and soil organisms (ETRC(soil)) of mechanical-chemical compared to chemical weed control.
Additionally the acute aquatic risk in all sugar beet growing SCRs was compared between CH-broadcast spraying and NHT-band spraying. GLMM analysis showed that the interaction between SCR and weed control strategy was significant (χ2 = 289, p<0.001). The t-test indicated that in most SCRs the acute aquatic risk did not differ between two methods but was significantly higher (p<0.05) at 10 out of 35 SCRs and significantly lower for 4 out 35 SCRs for NTH-band spraying compared to CH-broadcast spraying (Figure 3). In SCR 152 and 158, the NHT-band spraying caused even an elevated acute aquatic risk (ETR > 1) in some years (Figure 3).
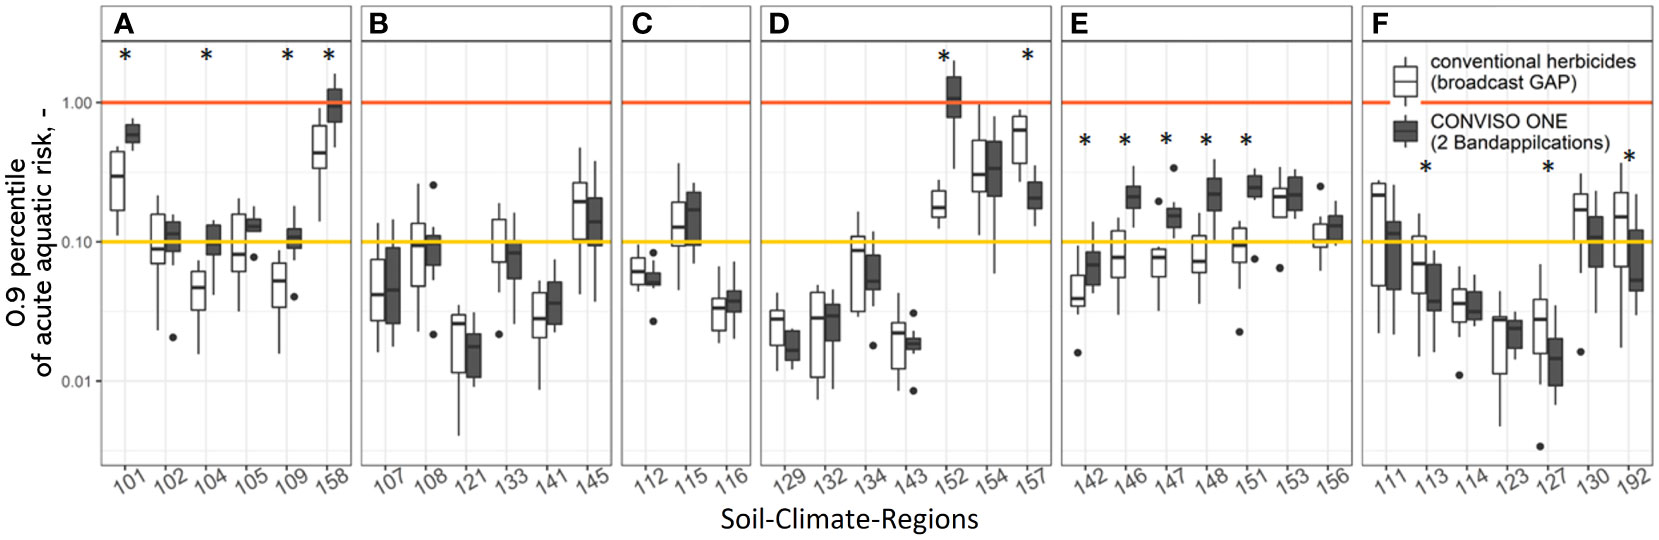
Figure 3 Regional variability in acute aquatic risk (ETRA(aq)) for twofold band application of CONVISO ONE in comparison to broadcast spraying of conventional herbicides in CEPI regions A-F. Each boxplot includes 8 data points for 8 years (2011-2018). Significant differences between weed control methods are indicated with an asterisk.
In the JKI geoportal, the ecotoxicological risks calculated with SYNOPS-GIS are presented in the form of interactive maps (https://sf.julius-kuehn.de/mapviewer/evaherb). This allows the comparison of the toxicological risk for different regions, aggregation levels and weed control techniques for individual years from 2011-2018. For example, Figure 4 shows the 90th percentile of the acute aquatic risk ETRA(aq) maps for CH-broadcast spraying and NHT-band-spraying based on weather data in 2015 at the county level in Germany. In addition, the web application offers the possibility to set the area ratio between CH-broadcast spraying and another weed control method (e.g., mechanical weed control) in Germany (Figure 5). Thus, the risks for different combinations of techniques can be evaluated.
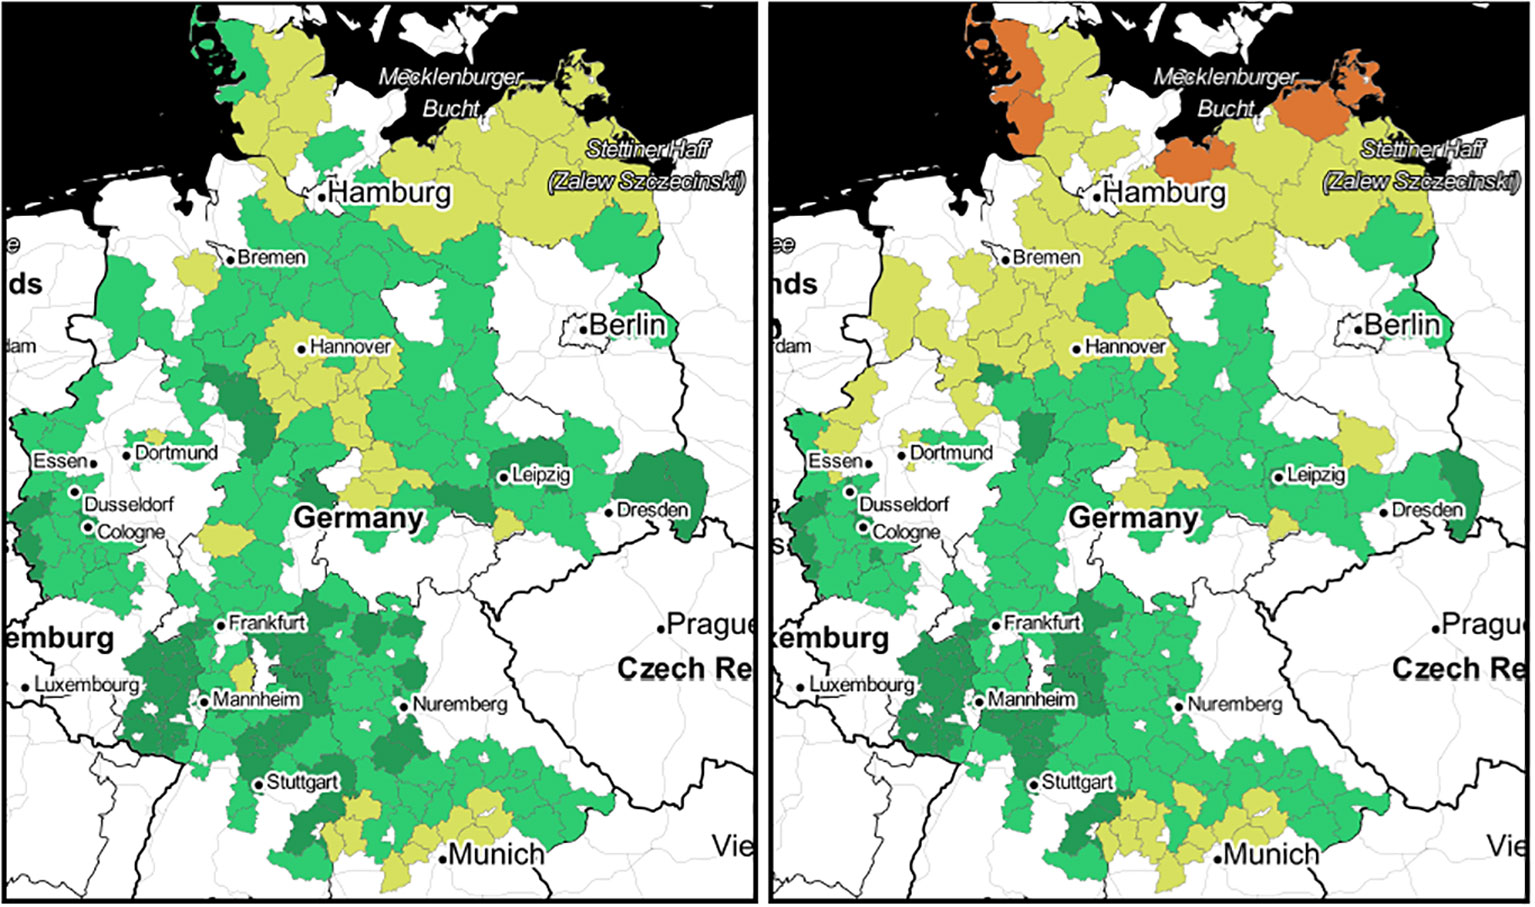
Figure 4 90th percentile of acute aquatic risk ETRA(aq) for conventional broadcast herbicide application (left) and for Conviso-One band spraying (right) in 2015 at county level in Germany. Orange shows elevated risk (1.0-10.0), Yellow - “low risk” (0.1-1), green - “very low risk” (0.01-0.1), dark green - “no risk” (<0.01).
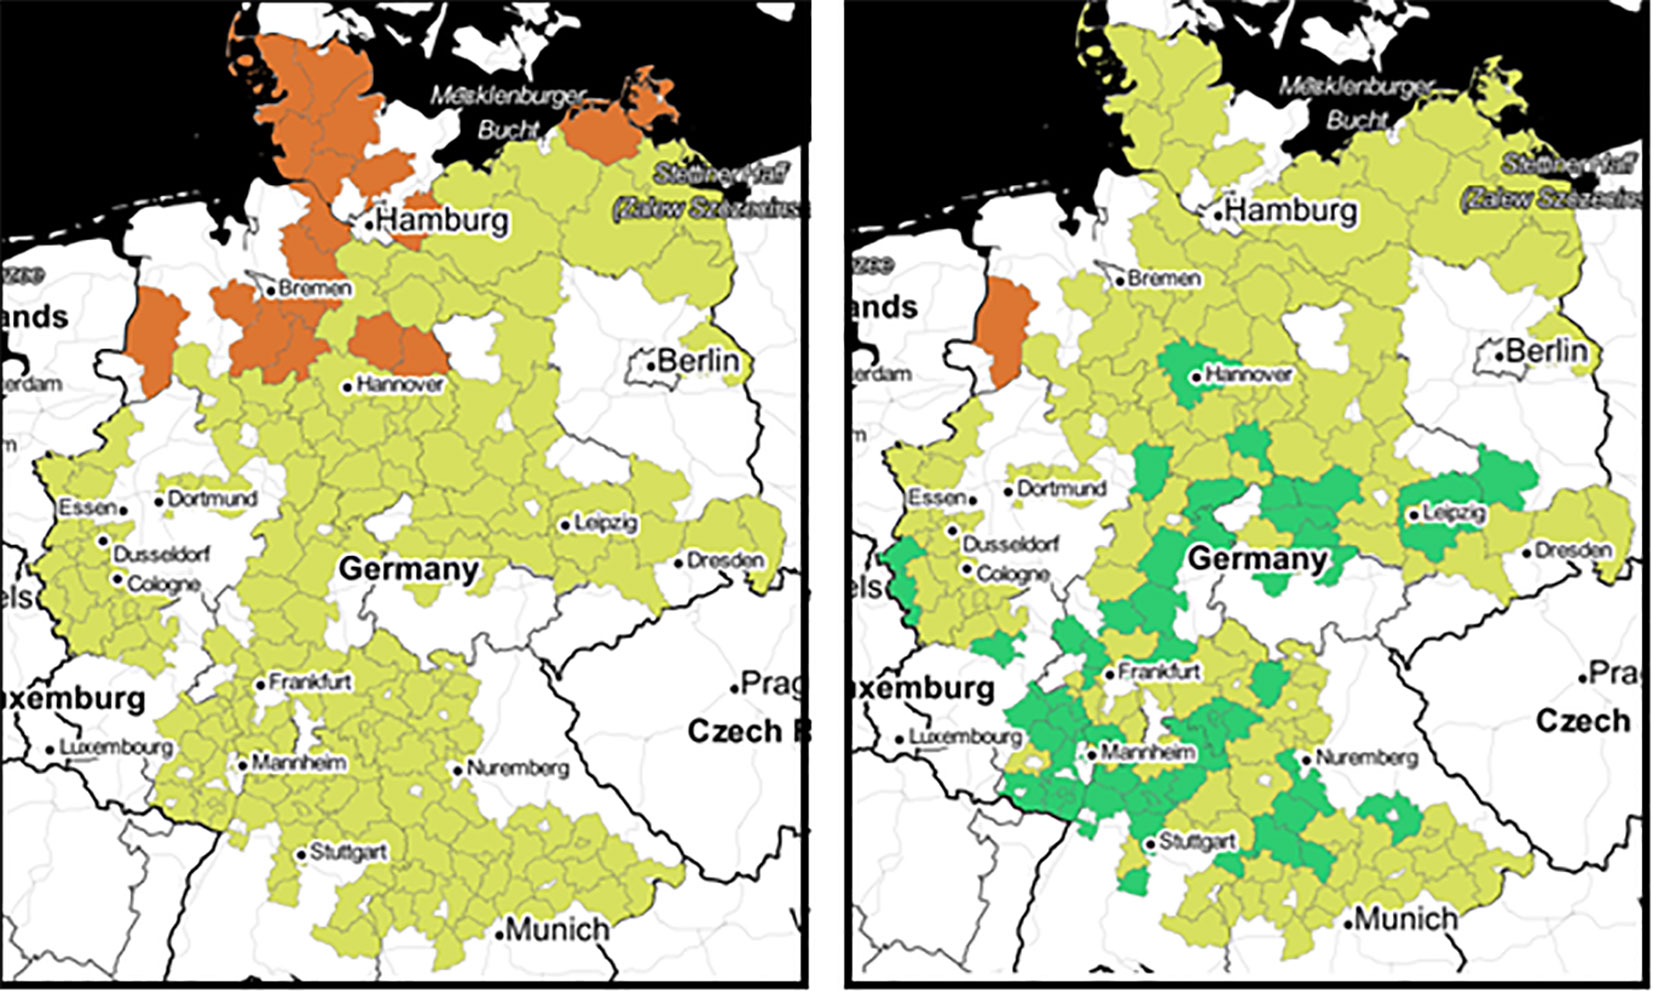
Figure 5 90th percentile of chronic risk for soil organisms ETRC(soil) for conventional broadcast herbicide application (left) and for a combination of 70% fields with mechanical weed control (with a toxicity of zero) and 30% fields with chemical weed control (right) in 2017 at the county level in Germany. Orange shows elevated risk (1.0-10.0), Yellow - “low risk” (0.1-1), green - “very low risk” (0.01-0.1).
4 Discussion
4.1 Regional variability of ecotoxicological risks associated with broadcast spraying of conventional herbicides
Risk to aquatic and soil organisms associated with conventional broadcast herbicide spraying varied significantly between the SCR within a single CEPI region (Figure 1). Since the AI, application rates and the sequence of applied herbicides were identical within a CEPI region (section 2.2), the differences in toxicological risk across SCRs within a CEPI-region could not be referred to the variability in application data but must be due to variability of environmental conditions between the SCR. The SCR with permanently higher acute aquatic risk (> 0.1) or chronic risk for soil organisms (> 0.5) risk were all located in northern Germany (Figure 6). The higher aquatic risk in the northern areas is mainly due to the higher density of water bodies and the higher proportion of standing waters. In standing waters, AI content decreases only due to degradation, whereas in flowing waters, removal by water flow is additionally accounted for by SYNOPS. The high risk to soil organisms is mainly due to the higher Corg content in northern SCRs compared to other SCRs (Tables 3, 4). SYNOPS considers the Corg-dependent distribution coefficient to estimate the fraction of AI that remains in the soil and is not exposed to surface runoff (Strassemeyer et al., 2017). Nause et al. (2021) also reported that sugar beet fields with elevated aquatic risk had shorter distance to water bodies compared to those with lower aquatic risk indices.
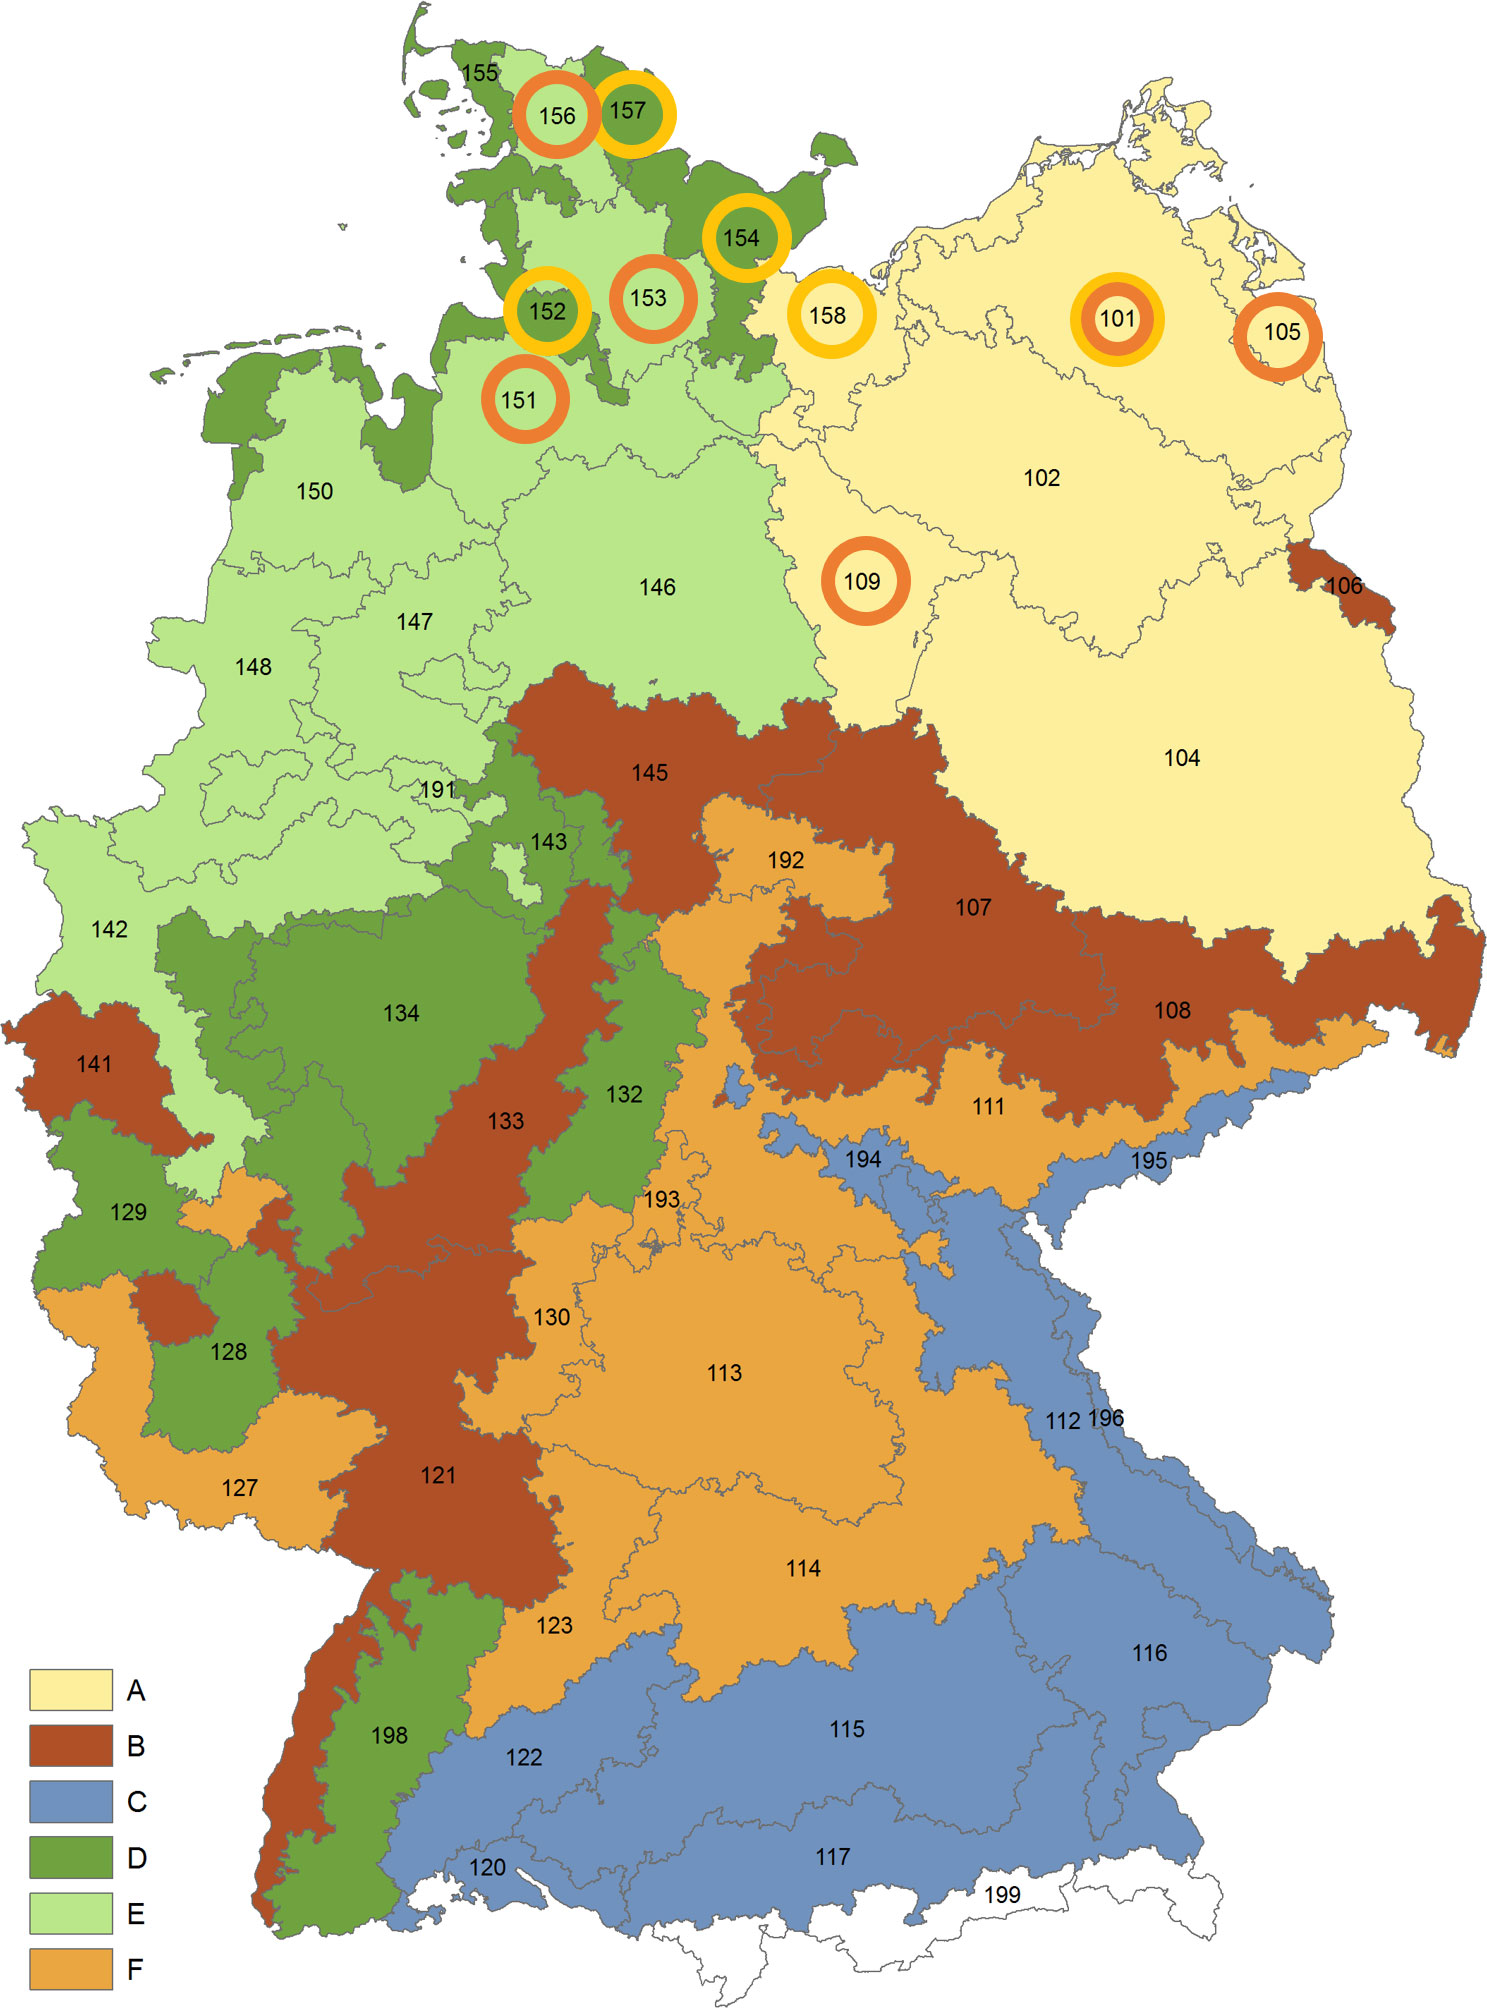
Figure 6 CEPI regions (A–F) and soil-climate-regions (101-198) (Dachbrodt-Saaydeh et al., 2019). Soil climate regions with elevated 90th percentile acute aquatic (> 0.1) and chronic risk for soil organisms (> 0.5) (see Figure 1) were indicated by yellow and orange circles, respectively.
The 90th percentile of chronic aquatic risk (ETRC(aq)) and the 90th percentile of acute risk for non-target organisms in field margins (ETRA(FM)) remained very low in all SCRs and are not shown here. Since the chronic aquatic risk only considers aquatic invertebrates, fish, and sediment organisms (Equation 5) it is expected to give lower values than the acute risk, which also includes algae and higher water plants as reference organisms (Equation 4). The reason for this is that for most AI no chronic endpoints were available. The actual version of PPDB includes also chronic toxicity endpoints (NOEC96 hours) for algae, which could be used in future studies for assessment of chronic aquatic risk.
Nause et al. (2021) calculated toxicological risk indices associated with 2314 pesticide application records from sugar beet farms using SYNOPS. They also found the risk for field margin organisms to be very low even considering insecticide and fungicide applications. The acute aquatic risk tended to be higher in their study, most probably due to the inclusion of insecticides, while the chronic risk to soil organisms was similar to our study. However, in contrast to our study, the 90th percentile of chronic risk to aquatic organisms was as high as the acute aquatic risk. This was most likely because their study included fungicides and insecticides, which have a greater impact on the three chronic reference organisms: fish, aquatic invertebrates, and sediment organisms.
Overall, it is important to note that using the identical application patterns of herbicides within CEPI-regions in our study is a simplification and thus, has limitations. The application pattern of PPPs in sugar beet cultivation is specifically adapted to the conditions of the respective field (farm survey sugar beet cultivation 2010 - 2021). The generalized application pattern of a CEPI region, however, considers only an average of used applications, while the strategies used especially in challenging fields with water proximity or erosion risk are not taken into account. The spectrum and frequency of active ingredients used for weed control in sugar beet was reviewed by Roßberg et al. (2017) and Nause et al. (2021). Nause et al. (2021) quantified the aquatic risk associated with the application of individual active ingredients and found that increased aquatic risk was not due to application of individual active ingredients or their application rate, but rather due to combinations of active ingredients, application dates and field-specific environmental conditions. Our study showed significant differences between the different soil-climate regions in toxicological risk to both aquatic and soil organisms. Additionally, our results indicate that the variance in aquatic toxicological risk between CEPI-regions is not as high as the variance within some CEPI-regions, thus either the aquatic toxicological risk is not affected by application patterns or CEPI regions do not capture the difference in herbicide application patterns for sugar beet. Thus, the aggregation of toxicological risks associated with herbicide applications by CEPI-region does not appear to be meaningful for sugar beet.
4.2 Risks of weed control techniques with reduced vs. full herbicide input
While reduced input of conventional herbicides resulted in a linear decrease in risk values, NHT-band spraying caused the same acute aquatic risk as the CH-broadcast spraying (Figure 2; Table 5). The reason for the higher aquatic toxicity of NHT-band spraying was a strong sensitivity of duckweed (Lemna minor) to the two active ingredients of a new herbicide (EC50< 0.001 mg L-1 for Thiencarbazone-methyl and Foramsulfuron). The highest acute aquatic risk of NHT-band spraying was observed in the same SCRs as by broadcast spraying (101,158, 152,154, Figure 3) and was mainly due to the low average distance to surface waters and the higher proportion of standing waters in these SCRs (Tables 3, 4). The chronic toxicity to aquatic organisms remained low, however, as no NOEC values (chronic toxicity endpoints) were available for duckweed and algae and these species were therefore excluded from the chronic toxicity calculation (Eq.5). The chronic toxicity endpoints of Thiencarbazone-methyl with NOEC= 3.54mg L-1 for aquatic invertebrates and NOEC=4.8 mg L-1 for fish (Lewis et al., 2016) are much higher compared with EC50 for duckweed (see above), resulting in low chronic aquatic risk from NHT-band spraying (data not shown). In this study, the SYNOPS GIS risk assessment was not performed for NHT-broadcast spraying. However, since there is a linear relationship between application rate and risk scores for conventional herbicides (Table 5), it can be assumed that an increase in application rate by a factor of 2.3 in the case of broadcast application of the same herbicide will increase the risk score accordingly. It could be seen from Figure 3 that the acute aquatic risk in this case would increase to ≥ 1 for some SCR and would have to be classified as an elevated risk for the respective SCR.
4.3 Data interpretation and limitations of the study
It is important to note that the magnitude of the calculated risk depends on the level of aggregation. For example, the 90th percentile acute aquatic risk of broadcast spraying was< 1 in all SCR (Figure 1) but was > 1 for 1759 fields in Germany (0.5% of all fields, data not shown). The calculation of the 90th percentile of the field-level ETR for Germany (Figure 2B) yields lower values than the calculation at the SCR level (Figure 2A). However, although the risk is low at the SCR level and very low for Germany it may be elevated at individual fields. This must be considered to avoid misinterpretation of our results.
In the present study random distribution of sugar beet on arable fields conditioned by field size and soil quality is a source of high uncertainty. In future assessment crop categorizations from satellite data could be used (Tetteh et al., 2021) to reduce the uncertainty of random crop distributions as conducted in this study.
The results presented here are pure model calculations. The validation of SYNOPS model has been previously conducted based on measured concentrations of selected pesticides in surface water in Mexico on papaya plantations (Hernández-Hernández et al., 2007), for one catchment in Germany (Strassemeyer et al., 2017), and for several sites in France (Pierlot et al., 2017) and showed in general satisfactory results. However, it is important to note that the environmental conditions at these monitoring sites and the measured substances only represent a small excerpt of the potential model parameterizations (De Baan, 2020) and, therefore, are only a first step in the model evaluation process. Currently, there has not been a comparison between the predicted and measured concentrations in soil and on non-target plants. Thus, further studies are needed to validate the exposure and potential effects on soil organisms and non-target arthropods. In addition, this study did not report risks for non-target plants, because at the time when the assessments were conducted the toxicity endpoints for non-target plants and degradation rates were available (in the pesticide property database) only for 44% and 6% of all herbicides respectively. Thus, toxicological risks for non-target plants associated with different weed control techniques must be determined in future.
5 Conclusions
In this study, toxicological risks of mechanical-chemical and chemical weed control techniques were calculated for 360,848 beet fields over 8 years (2011 - 2018) in Germany using SYNOPS-GIS. The acute and chronic risks for aquatic organisms, chronic risks for soil organisms and acute risks for non-target arthropods were aggregated as 90th percentiles at the level of soil-climate regions and for whole Germany. Additional information is provided by interactive maps available on JKI geoportal for open access. Using this web-application the toxicological risks for different weeding strategies, different regions, aggregation area and aggregation levels can be compared.
Our results indicated that the toxicological risk of conventional broadcast spraying was low for most soil-climate regions and was mostly due to risk for soil and aquatic organisms, whereas the risk for non-target arthropods was negligible. The elevated aquatic risk was mostly caused on fields with close distance to standing water bodies, whereas elevated chronic risk for soil organisms was mostly due to elevated organic carbon content in topsoil, promoting retention of AI in upper soil. The reduced application amounts of conventional herbicides due to mechanical-chemical weed control caused a linear reduction in toxicological risk for aquatic and soil organisms. Since elevated risks for soil and aquatic organisms by broadcast spraying were estimated for northern Germany, the advancement of mechanical-chemical and mechanical weed control methods appears to be especially important in northern Germany but also for the fields with short distance to water bodies or with elevated organic carbon content. However, the mechanical-chemical weed control with a new herbicide, containing two ALS-inhibiting active ingredients (Thiencarbazone-methyl and Foramsulfuron) did not reduce the risk to aquatic organisms compared to the broadcast application of conventional herbicides with other modes of action. This was due to the high toxicity of the two active ingredients in the new herbicide to common duckweed (Lemna minor). Therefore, the application of combination of Thiencarbazone-methyl and Foramsulfuron must be limited to fields that are at a sufficient distance from water bodies. Since ALS-inhibiting herbicides are needed in much lower quantities compared to conventional herbicides with other modes of action, their use has a strong reducing effect on the quantity-based EU Harmonized Risk Indicator. This was introduced to measure success in reducing the environmental risks associated with pesticide use. Thus, the results of the present study highlight the limitations of the EU Harmonized Risk Indicator and the need to consider not only quantity but also toxicological risk in future risk assessment approaches.
Data availability statement
The original contributions presented in the study are included in the article/supplementary material. Further inquiries can be directed to the corresponding author.
Author contributions
OF: Conceptualization, Investigation, Visualization, Writing – original draft, Writing – review & editing. JS: Conceptualization, Data curation, Methodology, Software, Writing – review & editing. FP: Software, Visualization, Investigation, Writing – review & editing. CR: Data curation, Resources, Writing – review & editing. H-JK: Supervision, Writing – review & editing.
Funding
The author(s) declare financial support was received for the research, authorship, and/or publication of this article. The project was supported by funds of the Federal Ministry of Food and Agriculture (BMEL) based on a decision of the parliament of the Federal Republic of Germany via the Federal Office for Agriculture and Food (BLE) under the Federal Programme for Ecological Farming.
Acknowledgments
We thank experts from the Institute of Sugar Beet Research and the sugar companies and grower associations for their valuable contribution to the development of generic application patterns of pesticides in sugar beet.
Conflict of interest
The authors declare that the research was conducted in the absence of any commercial or financial relationships that could be construed as a potential conflict of interest.
Publisher’s note
All claims expressed in this article are solely those of the authors and do not necessarily represent those of their affiliated organizations, or those of the publisher, the editors and the reviewers. Any product that may be evaluated in this article, or claim that may be made by its manufacturer, is not guaranteed or endorsed by the publisher.
References
AdV (2008) Dokumentation zur Modellierung der Geoinformationen des amtlichen Vermessungswesens (GeoInfoDok). Available at: http://www.adv-online.de/Ver%C3%B6ffentlichungen/AFIS-ALKIS-ATKIS (Accessed 02.05.2011).
Belden J. B., Gilliom R. J., Lydy M. J. (2007). How well can we predict the toxicity of pesticide mixtures to aquatic life? Integr. Environ. Assess. Manage. 3 (3), 364–372. doi: 10.1002/ieam.5630030307
Bockstaller C., Guichard L., Keichinger O., Girardin P., Galan M., Gaillard G. (2009). Comparison of methods to assess the sustainability of agricultural systems. A review. Agron. Sustain. Dev. 29, 223–235. doi: 10.1051/agro:2008058
Bundesanstalt für Landwirtschaft und Ernährung (BLE) (2023) Bericht zur Markt- und Versorgungslage Zucker 2023. Available at: https://www.ble.de/SharedDocs/Downloads/DE/BZL/Daten-Berichte/Zucker/2023BerichtZucker.html.
BVL. (2019). Online Data Base on Plant Protection Products (Braunschweig: The Federal Office for Consumer Protection and Food Safety).
Dachbrodt-Saaydeh S., Sellmann J., Roßberg D. (2019). Cluster zur regionalen Erhebung und Analyse der Pflanzenschutzintensität (CEPI) im Ackerbau. J. für Kulturpflanzen. 71, 264–270. doi: 10.5073/JfK.2019.10.02
De Baan L. (2020). Sensitivity analysis of the aquatic pesticide fate models in SYNOPS and their parametrization for Switzerland. Sci. Total Environ. 715, 136881. doi: 10.1016/j.scitotenv.2020.136881
DGM. (2016). Digitales Geländemodell Gitterweite 10m (Leipzig: Bundesamt für Kartographie und Geodäsie).
Dietrich C., Wang M., Ebeling M., Gladbach A. (2022). An efficient and pragmatic approach for regulatory aquatic mixture risk assessment of pesticides. Environ. Sci. Eur. 34 (16), 1–17. doi: 10.1186/s12302-022-00594-3
DWD. (2016) Climate Data Center. Available at: ftp://ftp-cdc.dwd.de/pub/CDC//.
European Commission. (2020). A farm to fork strategy for a fair, healthy and environmentally-friendly food system. (Brussels: European Commission). Available at: https://eur-lex.europa.eu/legal-content/EN/TXT/?uri=CELEX%3A52020DC0381.
Fishkis O., Weller J., Lehmhus J., Pölinger F., Strassemeyer J., Koch H.-J. (2024). Ecological and economic evaluation of conventional and new weed control techniques in row crops. Agric. Ecosyst. Environ. 360, 108786. doi: 10.1016/j.agee.2023.108786
Geiger F., Bengtsson J., Berendse F., Weisser W. W., Emmerson M., Morales M. B., et al. (2010). Persistent negative effects of pesticides on biodiversity and biological control potential on European farmland. Basic Appl. Ecol. 11 (2), 97–105. doi: 10.1016/j.baae.2009.12.001
Gocht A., Röder N. (2014). Using a Bayesian estimator to combine information from a cluster analysis and remote sensing data to estimate high-resolution data for agricultural production in Germany. Internat. J. Geograph. Information. Sci. 28 (9), 1744–1764. doi: 10.1080/13658816.2014.897348
Gutsche V., Strassemeyer J. (2007). SYNOPS–a model to assess the environmental risk potential of pesticides. Nachrichtenbl Deut Pflanzenschutzd. 59, 197–210.
Gutsche V., Strassemeyer J., Ladewig E. (2012). Modellierung des Umwelt-Risikopotenzials von Pflanzenschutzstrategien im Zuckerrübenanbau. Gesunde Pflanz. 64, 11–19. doi: 10.1007/s10343-011-0268-4
Hernández-Hernández C., Valle-Mora J., Santiesteban-Hernández A., Bello-Mendoza R. (2007). Comparative ecological risks of pesticides used in plantation production of papaya: Application of the SYNOPS indicator. Sci. Total Environ. 381 (1–3), 112–125. doi: 10.1016/j.scitotenv.2007.03.014
Knillmann S., Liess M., Scholz-Starke B., Daniels B., Ottermanns R., Schäffer A., et al. (2021). Environmental risks of pesticides between forecast and reality: How reliable are results of the environmental risk assessment for individual products in the light of agricultural practice (tank mixtures, spray series) (Umweltbundesamt). Available at: https://www.umweltbundesamt.de/publikationen/environmental-risks-of-pesticides-between-forecast.
Kopfinger S., Vinzent B. (2021). “Erprobung und Bewertung eines autonomen Feldroboters,” in GIL-Jahrestagung, Informations- und Kommunikationstechnologie in kritischen Zeiten. Bonn: Gesellschaft für Informatik e.V. 175–180.
Lewis K., Tzilivakis J., Warner D., Green A. (2016). An international database for pesticide risk assessments and management. Hum. Ecol. Risk Assess. 22, 1050–1064. doi: 10.1080/10807039.2015.1133242
Mueller L., Schindler U., Behrendt A., Eulenstein F., Dannowski R. (2007). The Muencheberg Soil Quality Rating. Field manual for detecting and assessing properties and limitations of soils for cropping and grazing. Leibniz-Zentrum für Agrarlandschaftsforschung (ZALF) (Müncheberg, Germany). Available at: http://www.zalf.de/de/forschung/institute/lwh/mitarbeiter/lmueller/Documents/field_mueller.pdf.
NAP. (2017). Nationaler Aktionsplan zur nachhaltigen Anwendung von Pflanzenschutzmitteln. Bundesministerium für Ernährung und Landwirtschaft (BMEL). (Bonn, Germany). Available at: https://www.bmel.de/SharedDocs/Downloads/DE/Broschueren/NAP-NationalerAktionsplanPflanzenschutz2017.pdf?__blob=publicationFile&v=3.
Nause N., Strassemeyer J., Mahlein A.-K., Stockfisch N. (2021). Pesticide use in sugar beet cultivation in Germany and assessment of the associated environmental risks using the risk indicator SYNOPS-GIS. Pest Manag Sci. 77, 4614–4626. doi: 10.1002/ps.6501
OECD (2016). Report on the Online Pesticide Risk indicators Database (PRIER), Series on Pesticides and Biocides (Paris: OECD Publishing). doi: 10.1787/378b47ed-en
Pierlot F., Marks-Perreau J., Réal B., Carluer N., Constant T., Lioeddine A., et al. (2017). Predictive quality of 26 pesticide risk indicators and one flow model: A multisite assessment for water contamination. Sci. Total Environ. 605-606, 655–665. doi: 10.1016/j.scitotenv.2017.06.112
R Core Team. (2020). R: A language and environment for statistical computing. (Vienna, Austria: R Foundation for Statistical Computing). Available at: https://www.R-project.org/.
Reus J., Leendertse P., Bockstaller C., Fomsgaard I., Gutsche V., Lewis K., et al. (2002). Comparison and evaluation of eight pesticide environmental risk indicators developed in Europe and recommendations for future use. Agric. Ecosyst. Environ. 90, 177–187. doi: 10.1016/S0167-8809(01)00197-9
Richter A., Adler G., Fahrak M., Eckelmann W. (2007). Erläuterungen zur nutzungsdifferenzierten Bodenübersichtskarte der Bundesrepublik Deutschland BÜK 1000 N (Hannover: Bundesanstalt für Geowissenschaften und Rohstoffe (Hrsg)).
Roß C., Nause N., Stockfisch N. (2018). Bodenschutz und reduzierter Herbizideinsatz (dzz (Die Zuckerrübenzeitung), 30–31. doi: 10.5073/JFK.2013.04.02
Roßberg D., Aeckerle N., Stockfisch N. (2017). Erhebungen zur Anwendung von chemischen Pflanzenschutzmitteln in Zuckerrüben. Ges. Pflanz 69, 59–66. doi: 10.1007/s10343-017-0389-5
Roßberg D., Michel V., Graf R., Neukampf R. (2007). Definition von Boden-Klima-Räumen für die Bundesrepublik Deutschland in Nachrichtenbl. Deut. Pflanzenschutzd. 59 (7), 155–161. Available at: https://www.openagrar.de/receive/openagrar_mods_00056830.
Schröllkamp C., Eßer C., Schulze Lammers P. (2015). Hilft die Hacke gegen Unkräuter? ZuckerrübenJournal 2, 21–23.
Starck T., Steinfort J., Risser P. (2021). Hackroboter in der Unkrautbekämpfung. Zwischen Zukunft und Gegenwart.: Versuchsergebnisse zu Aternativen der Unkrautbekämpfung. dzz 5, 28–29.
Stockfisch N., Gallasch M., Reineke H., Trimpler K., Mielke C., Reiners M., et al. (2013). Betriebsbefragung zur Produktionstechnik im Zuckerrübenanbau: Datenbasis und Basisdaten. Sugar Industry 138, 656–663. doi: 10.36961/si14540
Strassemeyer J., Daehmlow D., Dominic A., Lorenz S., Golla B. (2017). SYNOPS-WEB, an online tool for environmental risk assessment to evaluate pesticide verfahrens on field level. Crop Prot 97, 28–44. doi: 10.1016/j.cropro.2016.11.036
Strassemeyer J., Golla B. (2018). Berechnung des Umweltrisikos der Pflanzenschutzmittelanwendungen in den Vergleichsbetrieben mittels SYNOPS. Gesunde Pflanzen 70, 155–166. doi: 10.1007/s10343-018-0426-z
Tetteh G. O., Gocht A., Erasmi S., Schwieder M., Conrad C. (2021). Evaluation of sentinel-1 and sentinel-2 feature sets for delineating agricultural fields in heterogeneous landscapes. IEEE, 9, 116702–116719. doi: 10.1109/ACCESS.2021.3105903
Torretta V., Katsoyiannis I. A., Viotti P., Rada E. C. (2018). Critical review of the effects of glyphosate exposure to the environment and humans through the food supply chain. Sustainability 10 (4), 950. doi: 10.3390/su10040950
Vaj C., Barmaz S., Sorensen P. B., Spurgeon D., Vighi M. (2011). Assessing, mapping and validating site-specific ecotoxicological risk for pesticide mixtures: a case study for small scale hot spots in aquatic and terrestrial environments. Ecotoxicology Environ. Saf. 74, 2156–2166. doi: 10.1016/j.ecoenv.2011.07.011
Verro R., Finizio A., Otto S., Vighi M. (2009). Predicting pesticide environmental risk in intensive agricultural areas. II: screening level risk assessment of complex mixtures in surface waters. Environ. Sci. Technol. 43, 530–537. doi: 10.1021/es801858h
Keywords: toxicological risk, weed control, sugar beet, SYNOPS, exposure toxicity ratio, CONVISO
Citation: Fishkis O, Strassemeyer J, Pöllinger F, Roß CA and Koch H-J (2024) Toxicological risk assessment of mechanical-chemical vs. chemical weed control techniques in sugar beet in Germany using SYNOPS-GIS. Front. Agron. 5:1274703. doi: 10.3389/fagro.2023.1274703
Received: 08 August 2023; Accepted: 12 December 2023;
Published: 08 January 2024.
Edited by:
Bärbel Gerowitt, University of Rostock, GermanyReviewed by:
Björn Scholz-Starke, Darwin Statistics, GermanyRick Llewellyn, Commonwealth Scientific and Industrial Research Organization (CSIRO), Australia
Copyright © 2024 Fishkis, Strassemeyer, Pöllinger, Roß and Koch. This is an open-access article distributed under the terms of the Creative Commons Attribution License (CC BY). The use, distribution or reproduction in other forums is permitted, provided the original author(s) and the copyright owner(s) are credited and that the original publication in this journal is cited, in accordance with accepted academic practice. No use, distribution or reproduction is permitted which does not comply with these terms.
*Correspondence: Olga Fishkis, b2xnYWZpc2hraXNAZ21haWwuY29t