Leveraging digital agriculture for on-farm testing of technologies
 Laila A. Puntel
 Laura J. Thompson2
 - 1Department of Agronomy and Horticulture, University of Nebraska-Lincoln, Lincoln, NE, United States
- 2University of Nebraska Extension, University of Nebraska-Lincoln, Falls City, NE, United States
- 3Department of Agricultural Economics, University of Nebraska-Lincoln, Lincoln, NE, United States
The Precision Nitrogen Project (PNP) worked with more than 80 corn and winter wheat producers to inexpensively design and implement randomized, replicated field strip trials on whole commercial farm fields, and to provide site-specific testing of current nitrogen (N) technologies. This article proposes a conceptual framework and detailed procedure to select the N technology to be tested; design and implement field trials; generate, process, and manage field trial data; and automatically analyze, report, and share benefits from precision N technology. The selection of the N technology was farmer-driven to ensure a good fit and to increase the likelihood of future technology adoption. The technology selection method was called the “N tiered approach”, which consisted of selecting a technology that progressively increases the level of complexity without exceeding the farmer’s learning process or farm logistic constraints. The N tools were classified into (1) crop model-based, (2) remote sensing-based, (3) enhanced efficiency fertilizers, and (4) biologicals. Field strip trials comparing producers’ traditional management and the selected N technology were combined with site-specific N rate blocks placed in contrasting areas of the fields. Yield data from the N rate blocks was utilized to derive the site-specific optimal N rate. The benefits of current N technologies were quantified by comparing their yield, profit, and N use efficiency (NUE) to growers’ traditional management and to the estimated site-specific optimal N rate. Communication of the trial results back to the growers was crucial to ensure the promotion and adoption of these N technologies farm wide. The framework and overall benefits from N technologies was presented and discussed. The proposed framework allowed researchers, agronomists, and farmers to carry out on-farm precision N experimentation using novel technologies to quantify benefits of digital ag technology and promote adoption.
Highlights
● Development and validation of an on-farm research framework for testing precision nitrogen technologies.
● Determination of site-specific yield response to nitrogen for unbiased technology benchmarking.
● Open-source code for on-farm research data curation, aggregation, and analysis.
● Description of project’s potential value to develop successful cost-share programs for technology adoption.
1 Introduction
Nitrogen (N) is critical for maximizing crop yields and profit. Recommending N at the economic optimum N rate (EONR) remains challenging due to spatial and temporal variability and uncertainty in crop yield, soil N supplying capacity, and N loss dynamics (Mamo et al., 2003; Puntel et al., 2016; Cassman and Dobermann, 2022). Unfortunately, most N recommendation methods largely adopted by producers failed to account for spatial and temporal variability of the EONR, and as such, do not lessen the uncertainties of N management often resulting in N losses and profit losses (Cassman and Dobermann, 2022).
Digital agriculture includes the innovation and application of N technologies. Rapid development of sensing and modeling technology coupled with data processing techniques have provided new opportunities for optimization of N fertilizer management. For example, sensor-, satellite-, and crop model-based systems for site-specific fertilization in crop production can effectively help balance nutrient flows throughout the soil–plant–environmental system (Franzen, 2008; Sela et al., 2016; Bobryk et al., 2018). In addition, crop model-based tools can quantify complex dynamics such as N turnover in the soil and N emissions into the environment (Sela et al., 2018). Other technologies, such as enhanced-efficiency fertilizers (e.g., N stabilizers, N inhibitors and bio-inhibitor) could control transformations in the N cycling reducing N losses. Overall, the aforementioned technologies provide paths for increasing NUE which is needed for more sustainable crop production (Dutta et al., 2023). Despite the increased available N technologies, their adoption remains low (Lowenberg-DeBoer and Erickson, 2019; Thompson et al., 2019; Puntel et al., 2022).
Recently, the advancement of variable-rate application (VRA) and data collection technologies have enabled large-scale on-farm precision experimentation (OFPE; Bullock et al., 2019). Conducting research on-farm and with farmer participation, provides a path for technology transfer and an avenue to increase adoption of technology (Kyveryga, 2019; Thompson et al., 2019; Lacoste et al., 2021). In addition, the OFPE allows researchers and farmers to collect big data efficiently and economically with an improved statistical experimental design (e.g., Latin Square, Randomized Block) on entire fields (Laurent et al., 2019; Licht and Witt, 2019). Consequently, OFPE provides several advantages over small-plot research station data and traditional on-farm strip-trials. For example, knowledge derived from OFPE trials can be used to develop input recommendations at a larger scale, considering spatial variability that isn’t captured in small plot trials. The greater variation in soil and crop characteristics within OFPE allows statistical analysis of site-specific impact of input effect on yield (Barbosa et al., 2020a, Barbosa et al., 2020b; De Lara et al., 2023).
Although OFPE data could be used to determine site-specific yield response functions and ultimately crop optimal N rates, there is no practical or commercial application available for growers to make N management decisions based on this OFPE data. This limits the short-term impact on growers NUE. Thus, on-farm experimentation could be used to promote the use of existing N technologies for more efficient N management while collecting site-specific yield response functions for future data driven recommendation methods. Testing of N technologies and the estimation of site-specific EONR could allow unbiased benchmarking of the technology and grower’s management. Nevertheless, the implementation and the analytical framework for the proposed experimentation has not been yet developed.
The Precision Nitrogen Project (PNP) started in 2020 testing N technologies and promoting adoption by collaborating with farmers to implement randomized agronomic field trials on commercial fields. This work is innovative because it moves beyond the “checkerboard” OFPE design to determine optimal N rates and the traditional strip trials to test N managements. It combined the strengths of both experimental approaches; a side-by-side comparison between a selected N technology and grower’s traditional N management practice, and an unbiased benchmarking using a site-specific EONR derived from targeted N small plots. Characterization of the site-specific EONR is often limited and omitted in on-farm N technology testing (Trevisan et al., 2019; Trevisan et al., 2021). The proposed framework contributes to fill this gap.
The specific objectives of this work were to describe (1) a farmer-centric, iterative, and tiered approach for N technology selection, (2) the use of a novel OFPE to benchmark and evaluate N technologies, (3) an automated OFPE data processing, management, analysis, and reporting system, and (4) the impact on cooperator management from three years of experimentation. Successful N management via DA technologies can optimize crop yields and increase profitability while minimizing N losses to the environment meeting global demands and future standards.
2 Materials and methods
2.1 On-farm precision experimentation design to test N technologies
The N technologies commercially available were grouped as (1) crop model-based, (2) remote sensing-based, (3) enhanced efficiency fertilizers, and (4) biologicals (Figure 1). To reduce the barriers of testing a new technology partnering farmers were provided with financial compensation to negate the cost and risks associated with a new N management plan.
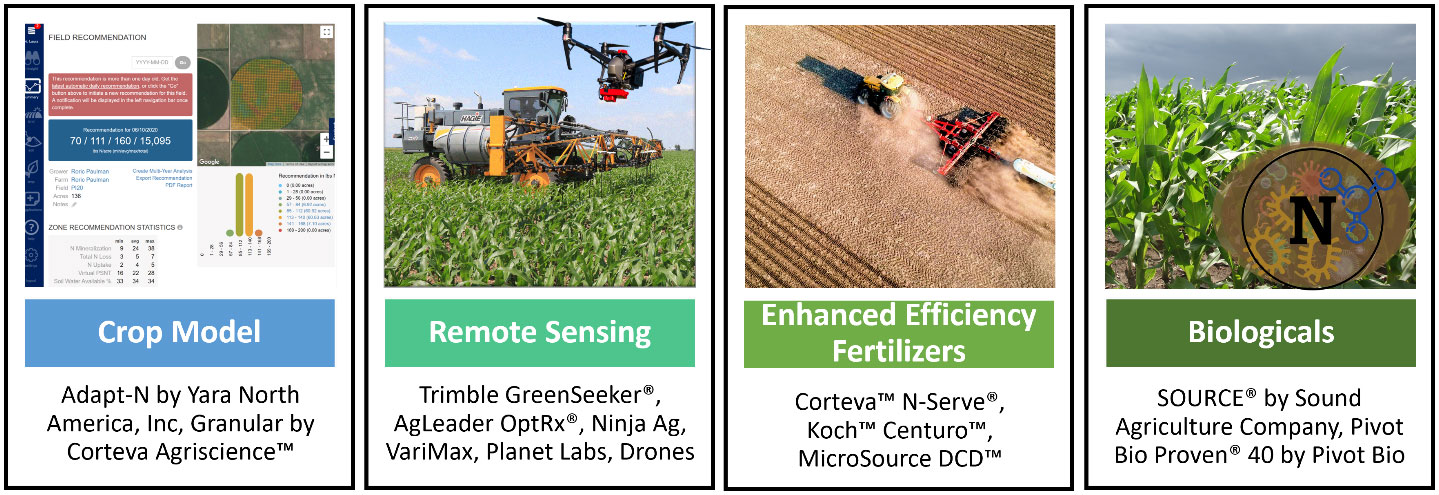
Figure 1 Examples of the nitrogen technology options tested by cooperating farmers for the Precision Nitrogen Project. Technologies included crop model-based, remote sensing-based, enhanced efficiency fertilizers, and biologicals.
A novel OFPE design was used to test the N technologies (Figure 2). The experimental design combined field length strip-trials and site-specific small N rate blocks with at least four repetitions. The strip-trials were used to compare farmers’ traditional management (“business-as-usual” N management) to the N technology they were interested in (“next-level” N management). For corn most of the participating growers applied a flat N rate either in the fall, pre plant or at planting with a proportion of the fertilizer going as sidedress. For winter wheat most of the growers applied the fertilizer at planting or early in the spring.
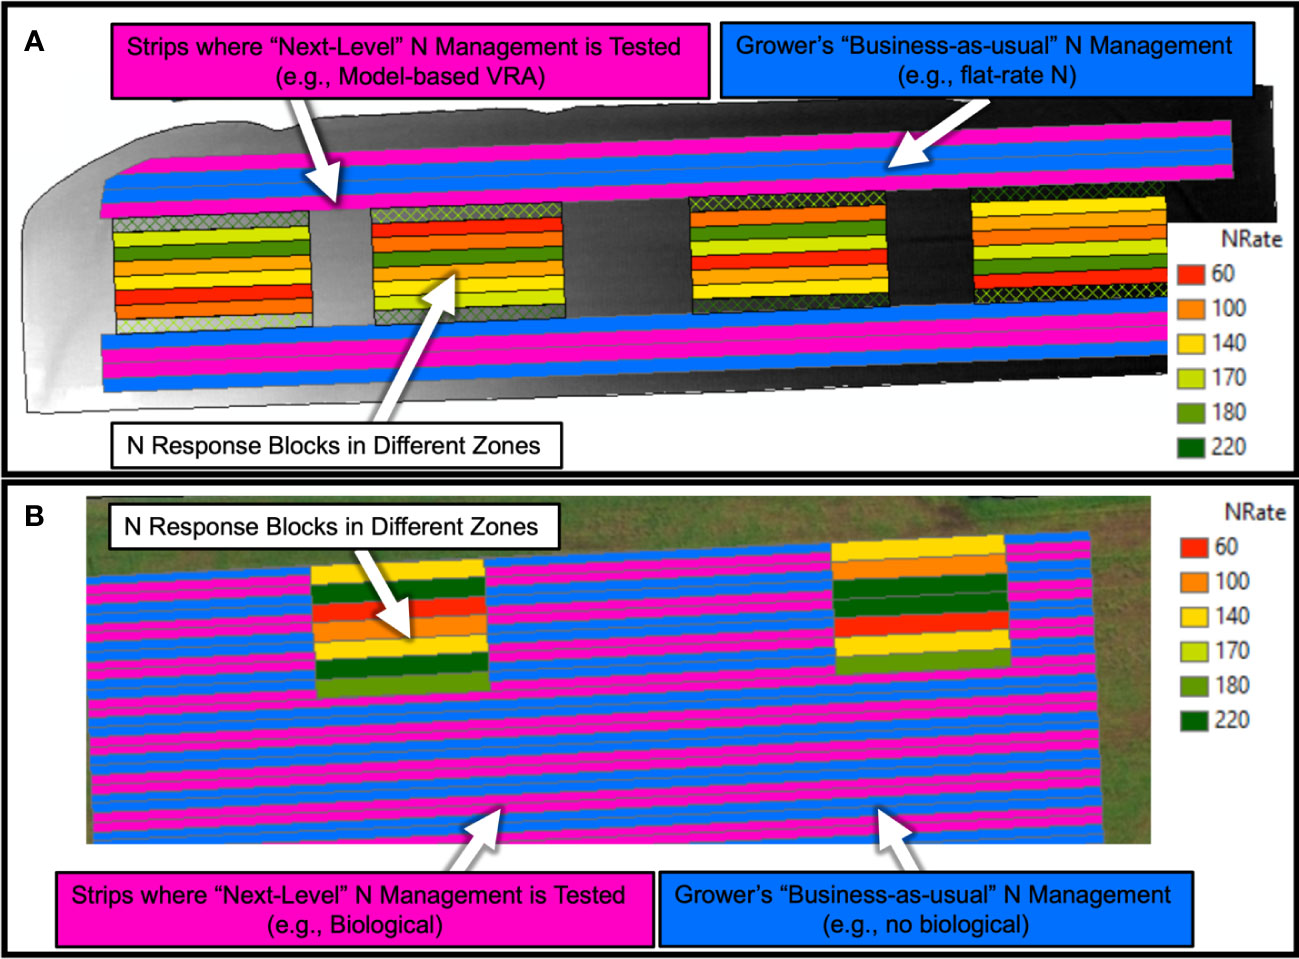
Figure 2 Examples of the on-farm precision experimentation (OFPE) designs utilized to evaluate the performance of nitrogen (N) technologies. Technologies that are used to adjust rate and/or timing (e.g., model-based and sensor-based technologies) are compared against grower and the economic optimal N rate (EONR) derived from N blocks established at different zones within the field (A). Technologies such as enhanced efficiency fertilizers or biologicals are established in a split-plot design with the N block as the main plot and the planting passes with a without the product as the sub-plot (B).
Nitrogen rate blocks were placed in contrasting zones within the field that were expected to have a contrasting yield response to N. For technologies that provided flat or variable rate N recommendations such as model-based and sensor-based N tools, the technology was evaluated in field-length strips and the N blocks were placed near by the strip trials in contrasting management zones (Figures 2A, 3A, B). Recommended N rates for the field-length strips and N blocks were assembled into a VRA that was implemented on-the-go using the farmer’s VRA controller (Figure 3C). Nitrogen rate blocks for the biologicals and enhanced efficiency fertilizers strip-trials were implemented in a split-plot design (Figure 2B). Technologies were changed manually (in the case of enhanced efficiency fertilizers) or applied with a “split planter” approach (in the case of biologicals). Nitrogen rate blocks were implemented as a prescription via the farmers VRA controller.
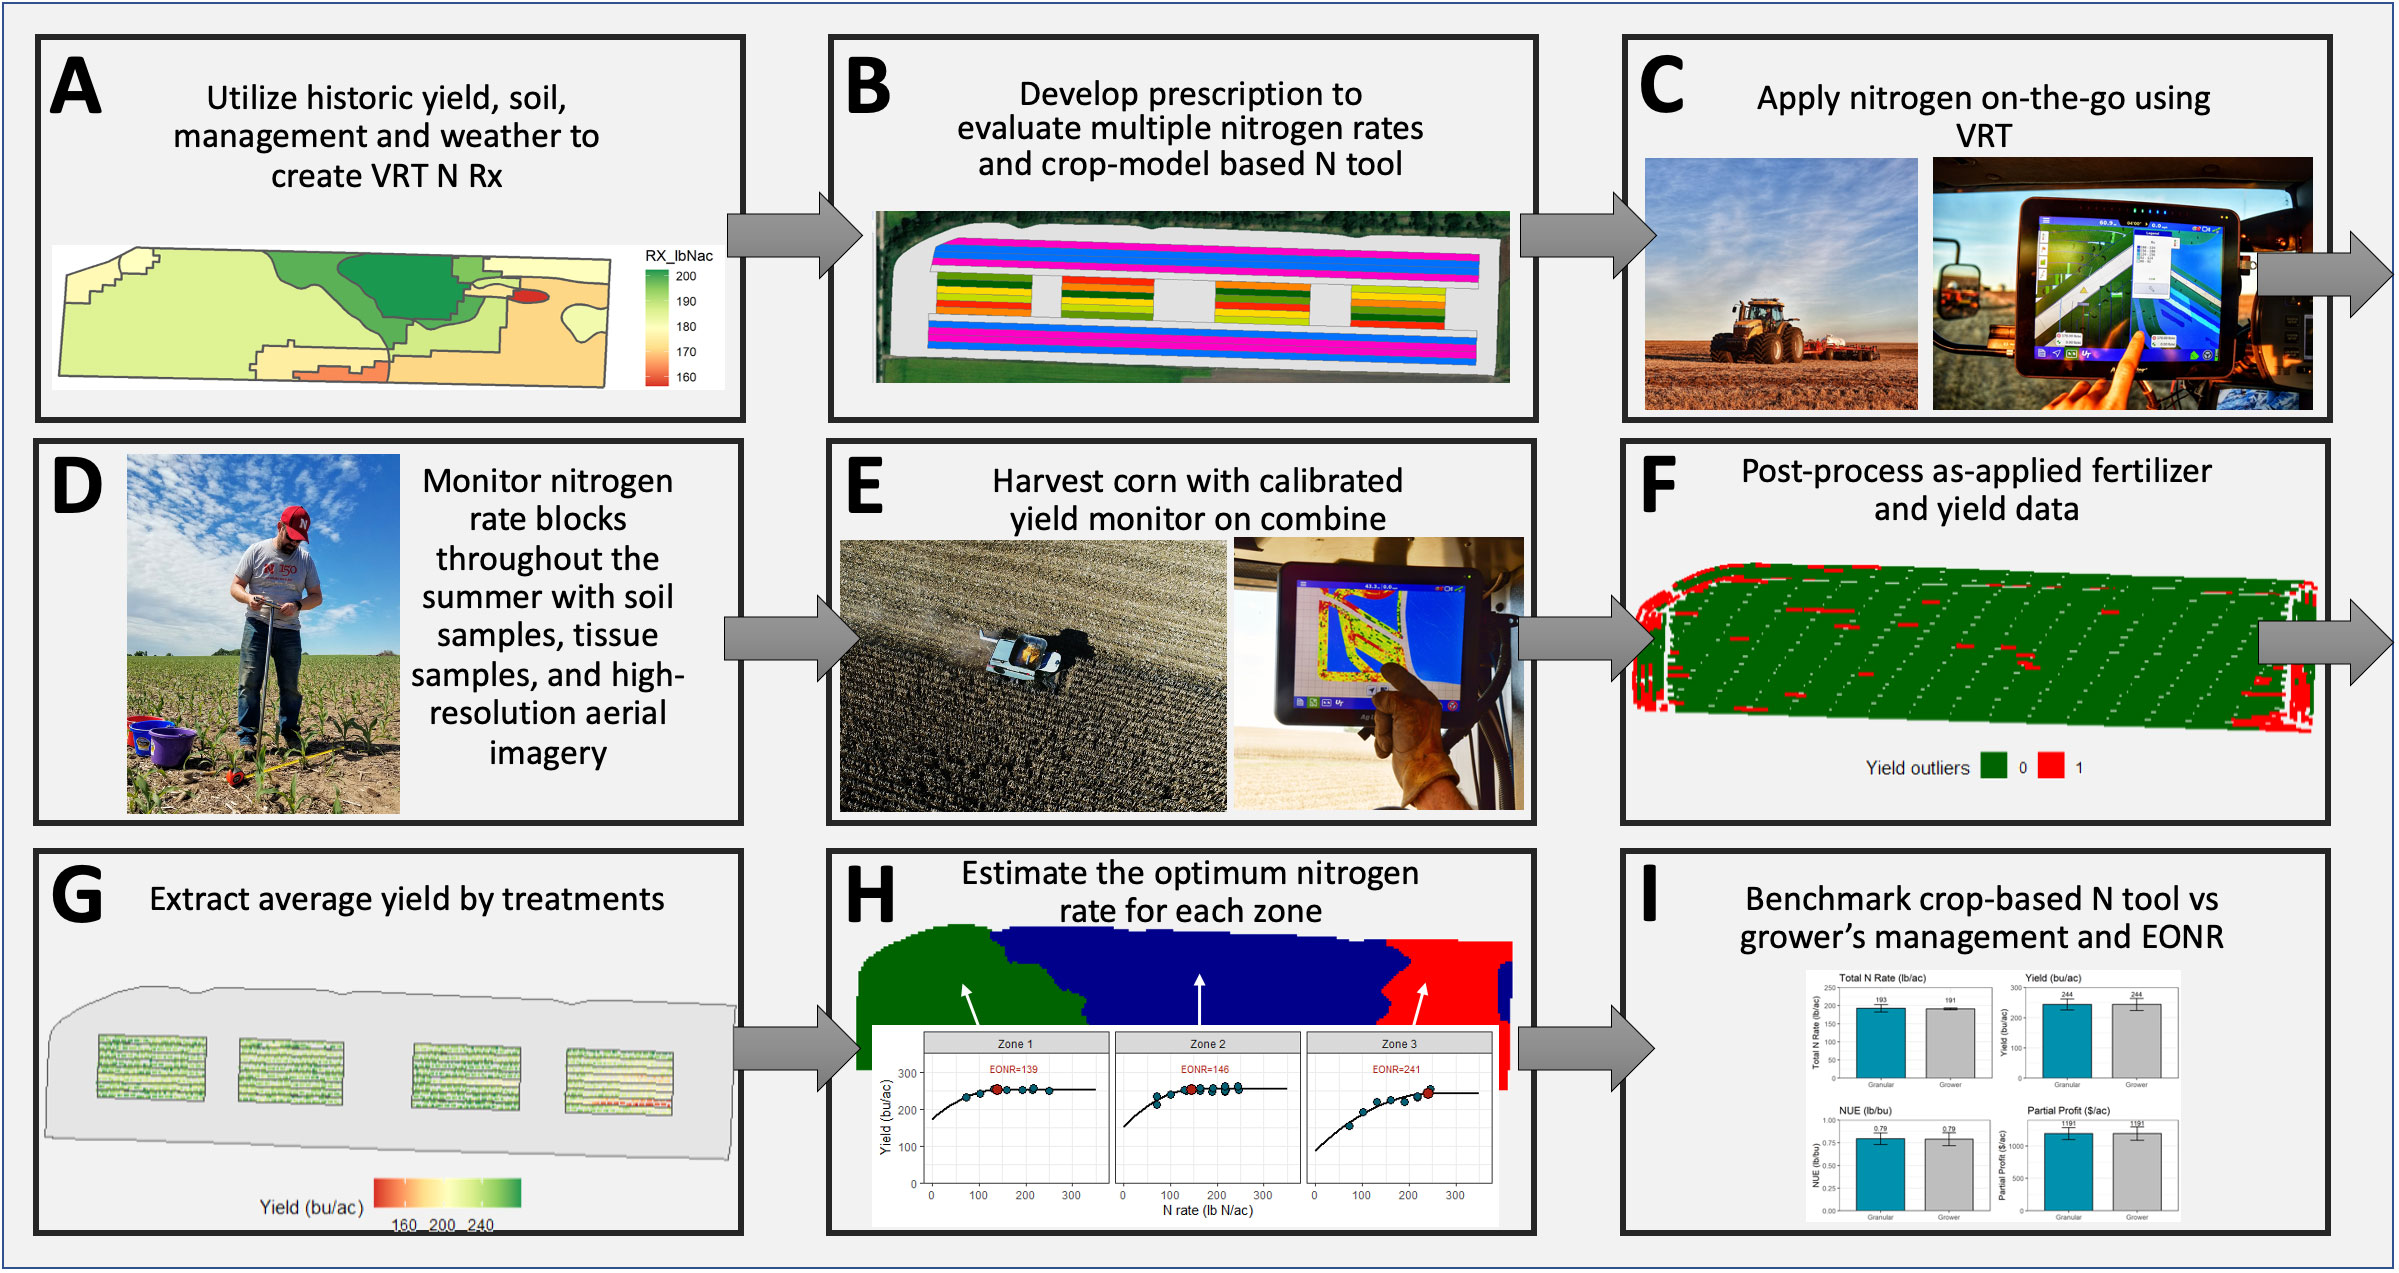
Figure 3 Precision nitrogen trial implementation workflow diagram: (A) variable nitrogen rate prescription is created with the selected technology, (B) trial layout is combined with the output of the technology and the nitrogen ramps, (C) trials are applied on the go while the producers applies fertilizer, (D) in-season data collection, (E) end of season data collection, (F) automatic data processing in R software, (G) data summaries, (H) analysis by zone, and (I) data sharing and reporting.
2.2 Data collection
Before the implementation of the field trial, a soil characterization was performed to measure organic matter (OM) and soil texture stratified by depths at contrasting yielding areas of the field. During the growing season, soil moisture and temperature, soil nitrate, crop phenology, plant biomass, high-resolution imagery, and leaf area index was measured (LAI; Figure 3D). Farmers provided as-applied and yield monitor data for the field-scale trials (Figure 3E).
2.3 Data processing, aggregation, analysis, and reporting system
An automated OFPE data processing, management, analysis, and reporting system was developed to enable robust and quick data processing (Figures 3F–I). This system aggregates data layers from various sources and implements data quality control methods to check for overlapping, misalignment, or outliers within yield and as-applied data. The system does not eliminate yield observation, instead, they get flagged when issues were found. The system was coded in R software (R Core Team, 2022) to enable rapid processing of the on-farm research trials.
3 Results
3.1 A farmer-centric, iterative, and tiered approach for N technology selection
Partnering farmers were engaged throughout the process by first letting them select the technology to test and by providing them with hands-on experience. To guide this process, we utilized in-depth discussions with farmers, their crop advisors, extension educators, graduate students, and specialists to first understand the farmer’s current N management and technology capabilities and then to guide the selection of technology. This customized, farmer-centric approach increased the potential for future adoption of the technology tested and allowed growers to progressively increase the complexity of their N management. For example, 25% of the growers had no in-season N application experience and they were more receptive to test enhanced efficiency fertilizers than in-season N management tools. However, the remaining participants with in-season N application capabilities were open to test remote-sensing or crop model-based tools with their available capabilities and logistics in place.
A total of five public-private partnerships with industry were established to provide growers with access to the N technologies (Figure 1). Partnerships with N technology providers played a critical role in ensuring that technologies were available to the grower and implemented correctly. This facilitated technology transfer with expert input and allowed graduate students to be supported through industry collaborations. In addition, three on-line workshop training sessions were organized to train the PNP team and growers on how to use some of these technologies. Workshops were highly beneficial for the crop model and sensor-based N tools due to their input requirements and complexity compared to for example, enhance fertilizer and biological products.
3.2 Use of OFPE to benchmark and evaluate N technologies
From 2020 to 2022, the PNP project completed 80 trials in corn and winter wheat. Of these trials, technologies selected were 39% crop model-based tools, 34% remote sensing-based, 21% enhanced efficiency fertilizers, and 6% biologicals. Biologicals were offered as an option for the first time in 2022 and is expected to increase in 2023. 98% of the experiments were successfully established.
3.3 Automated OFPE data processing, management, analysis, and reporting system
The automated data processing method developed for N technology testing and benchmarking with the site-specific optimal N rate encompassed yield and as-applied data processing, data aggregation and reporting of results. Each step is described in Sections 3.3.1 to 3.3.4.
The automated data method enabled the PNP team to reduce the data processing time, cost, manpower, and enabled more efficient result sharing with farmers right after harvest (Figures 4–9). 90% of the trials were analyzed using the automatic process and the remaining trials were analyzed manually due to data quality issues. The PNP team was able to analyze site-specific yield response to N curves for winter wheat and corn in more than 70% of the experiments.
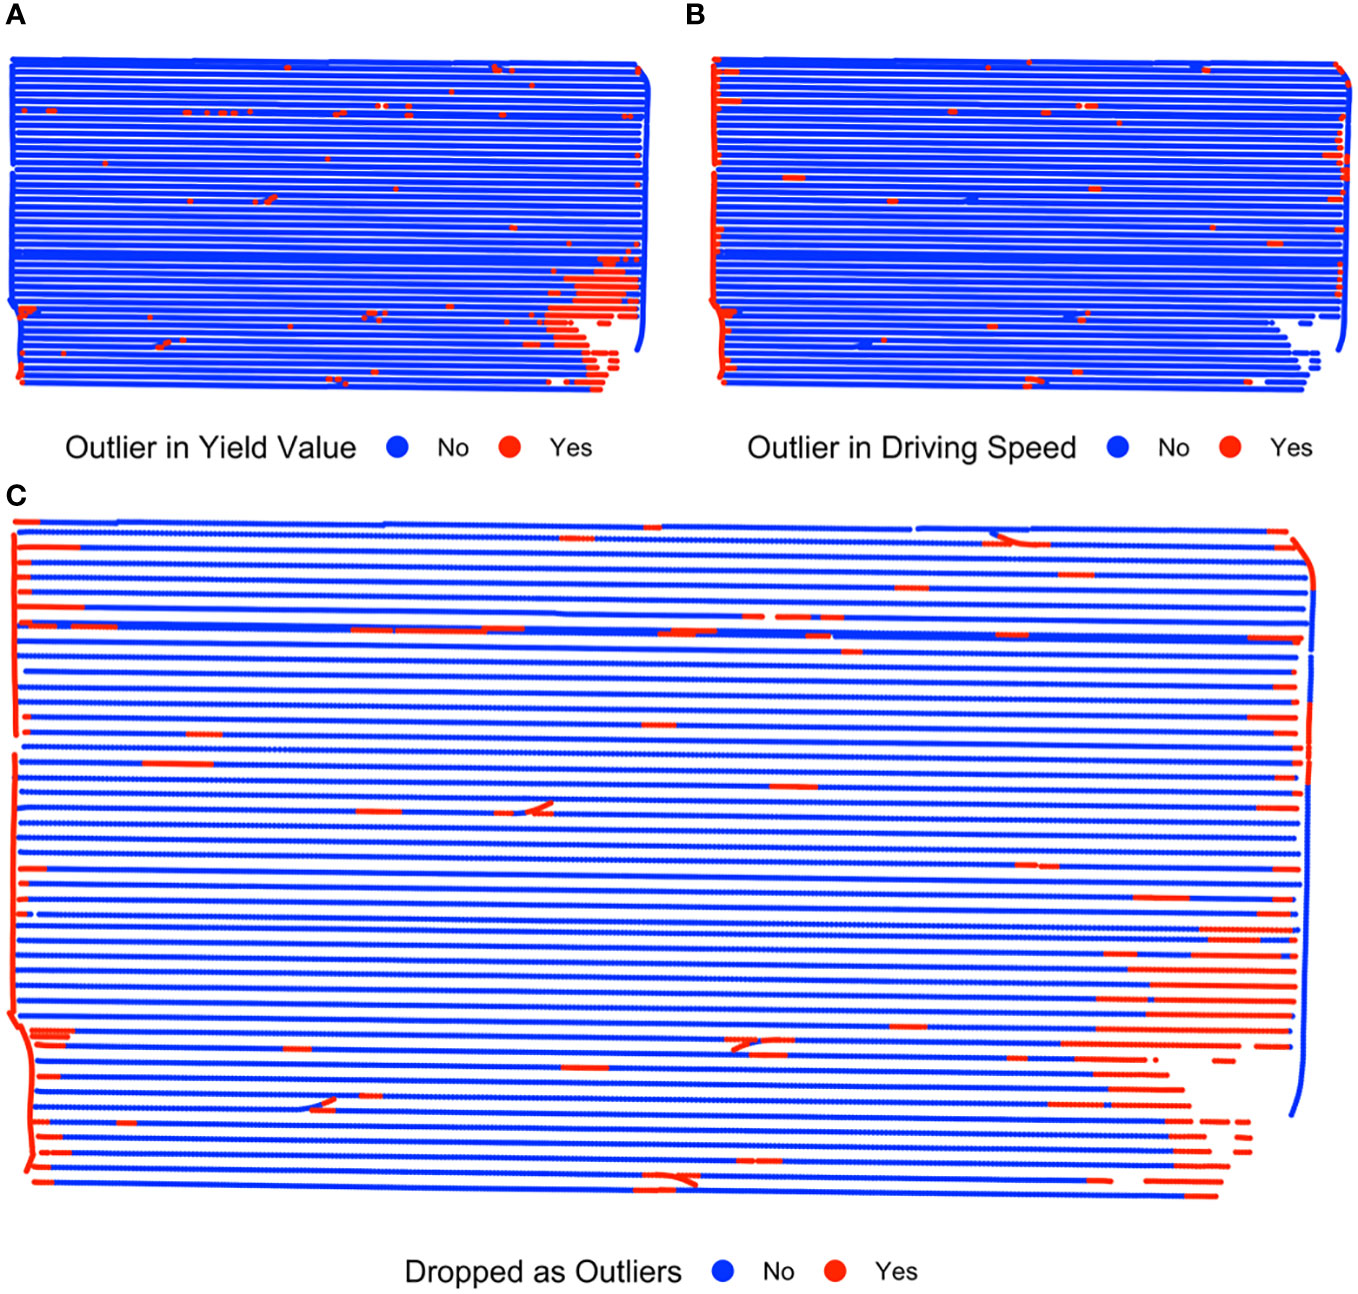
Figure 4 Yield data processing for precision nitrogen on-farm research trials. Yield cleaning detects outliers based on the standard deviation of yield observations (A), speed-based cleaning using the standard deviation and median of the harvester speed (B) and integrates both flags (A, B) into a single variable called “dropped as outliers” (C).
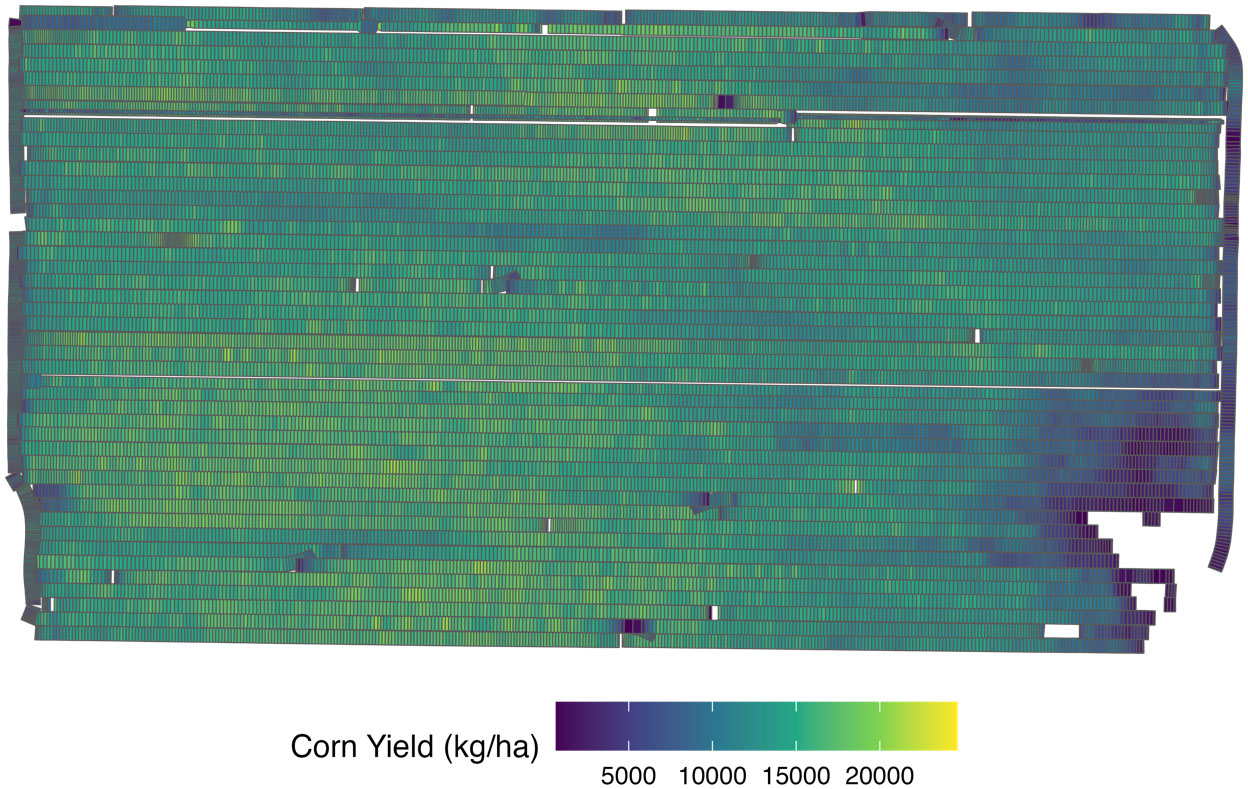
Figure 5 Corn yield data points polygonised based on harvester machine width for one site in Nebraska during the 2021 growing season.
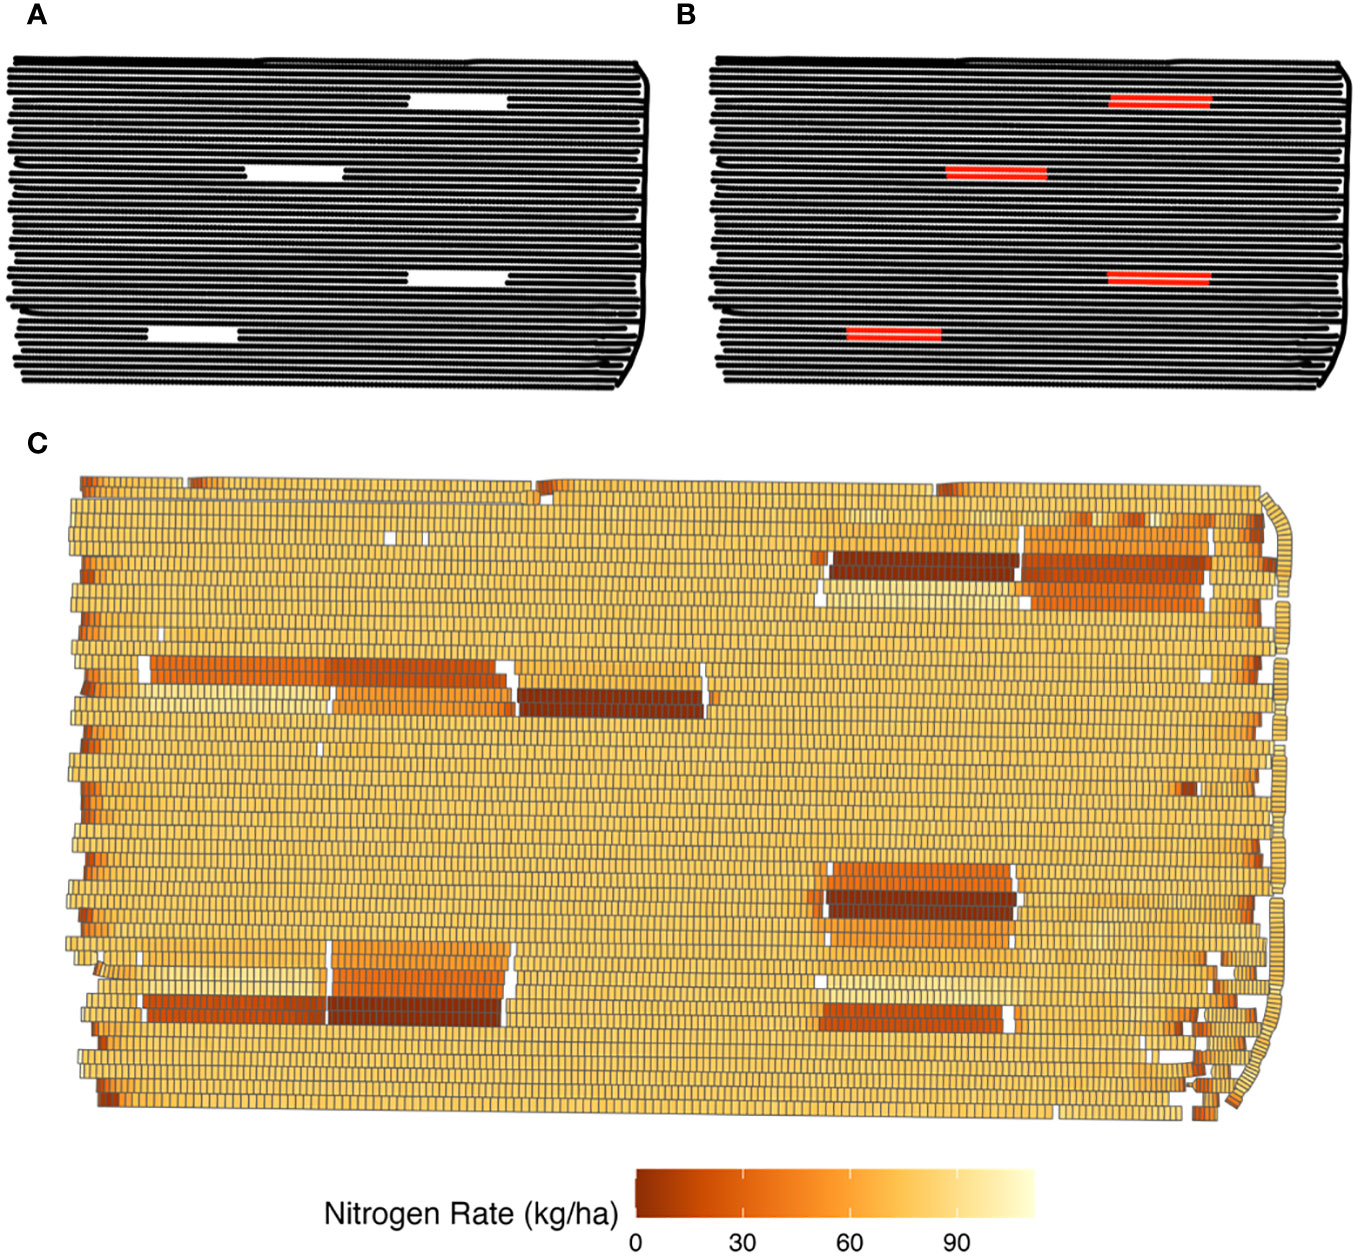
Figure 6 Example of as-applied nitrogen (N) fertilizer data analysis when data is missing due to zero N recommended (A), recreating of as-applied N input data parallel to the adjacent path with zero N (B), and as-applied data polygonised after outlier detection (C).
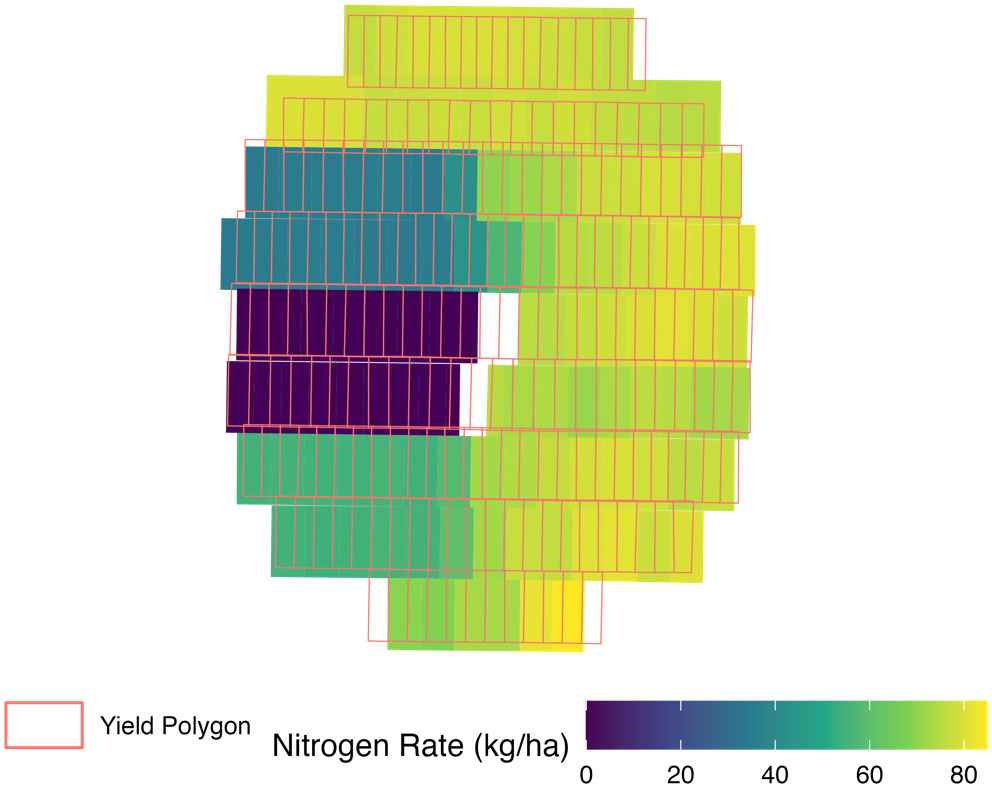
Figure 7 Example of the mixed treatment issue where yield polygons overlapped with multiple distinct input polygons with different nitrogen rates. Red polygons showing yield monitor data points coverage are overlapped on as-applied nitrogen application map.
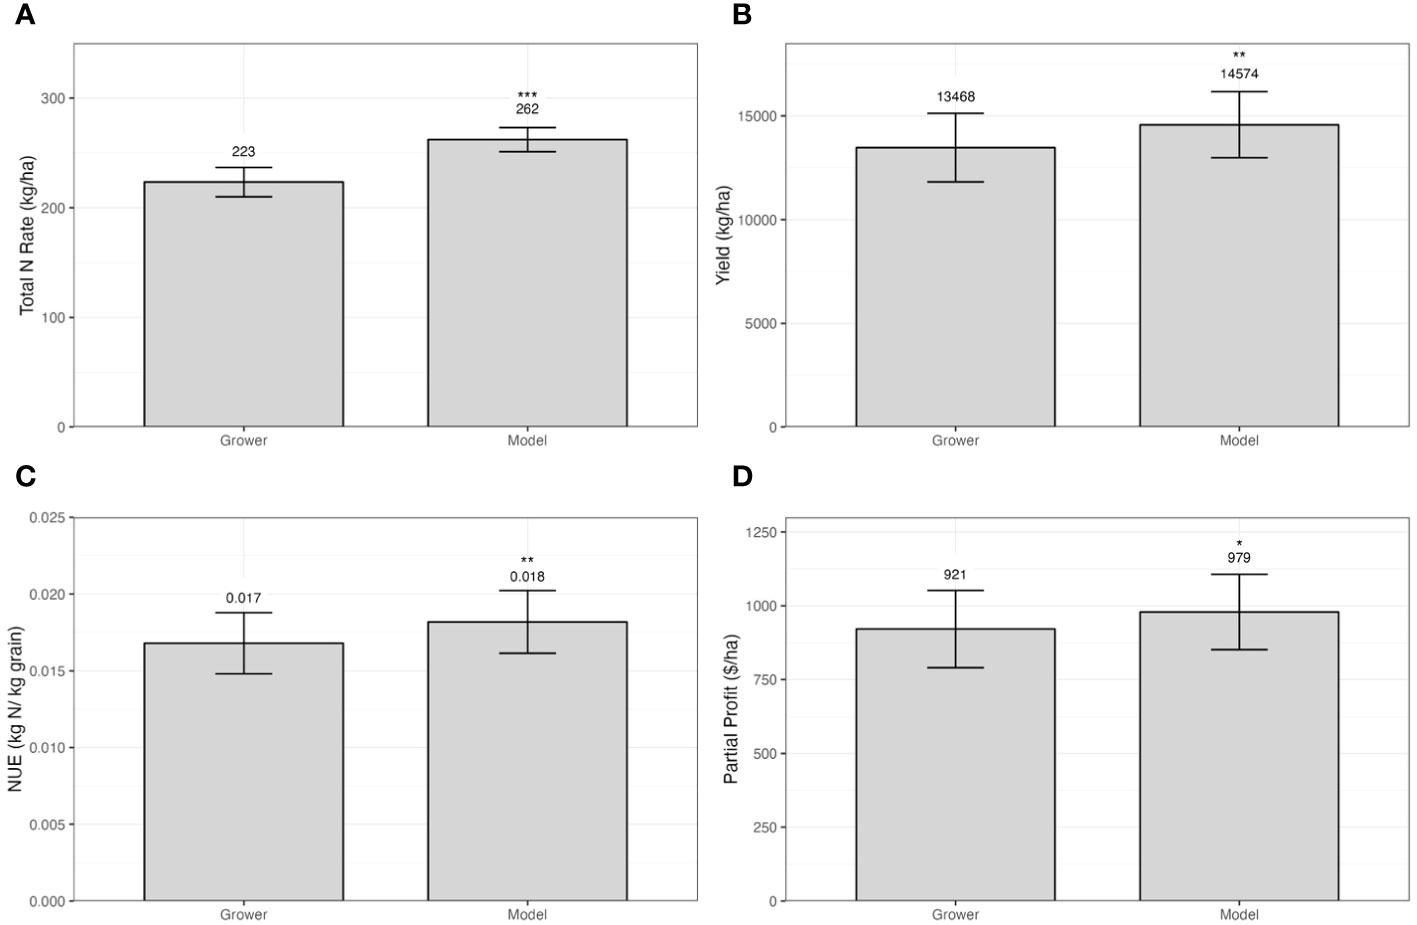
Figure 8 Example of whole field yield (A), total nitrogen [N, (B)], N use efficiency [NUE, (C)] and partial profit (D) summary for grower’s traditional management and crop model-based N tool for corn. Vertical bars indicate the standard deviation of the mean (n= 4). Symbols indicate the following levels of statistical significance: <0.001 ‘***’; 0.001 ‘**’; 0.01 ‘*’; 0.05 ‘.’.
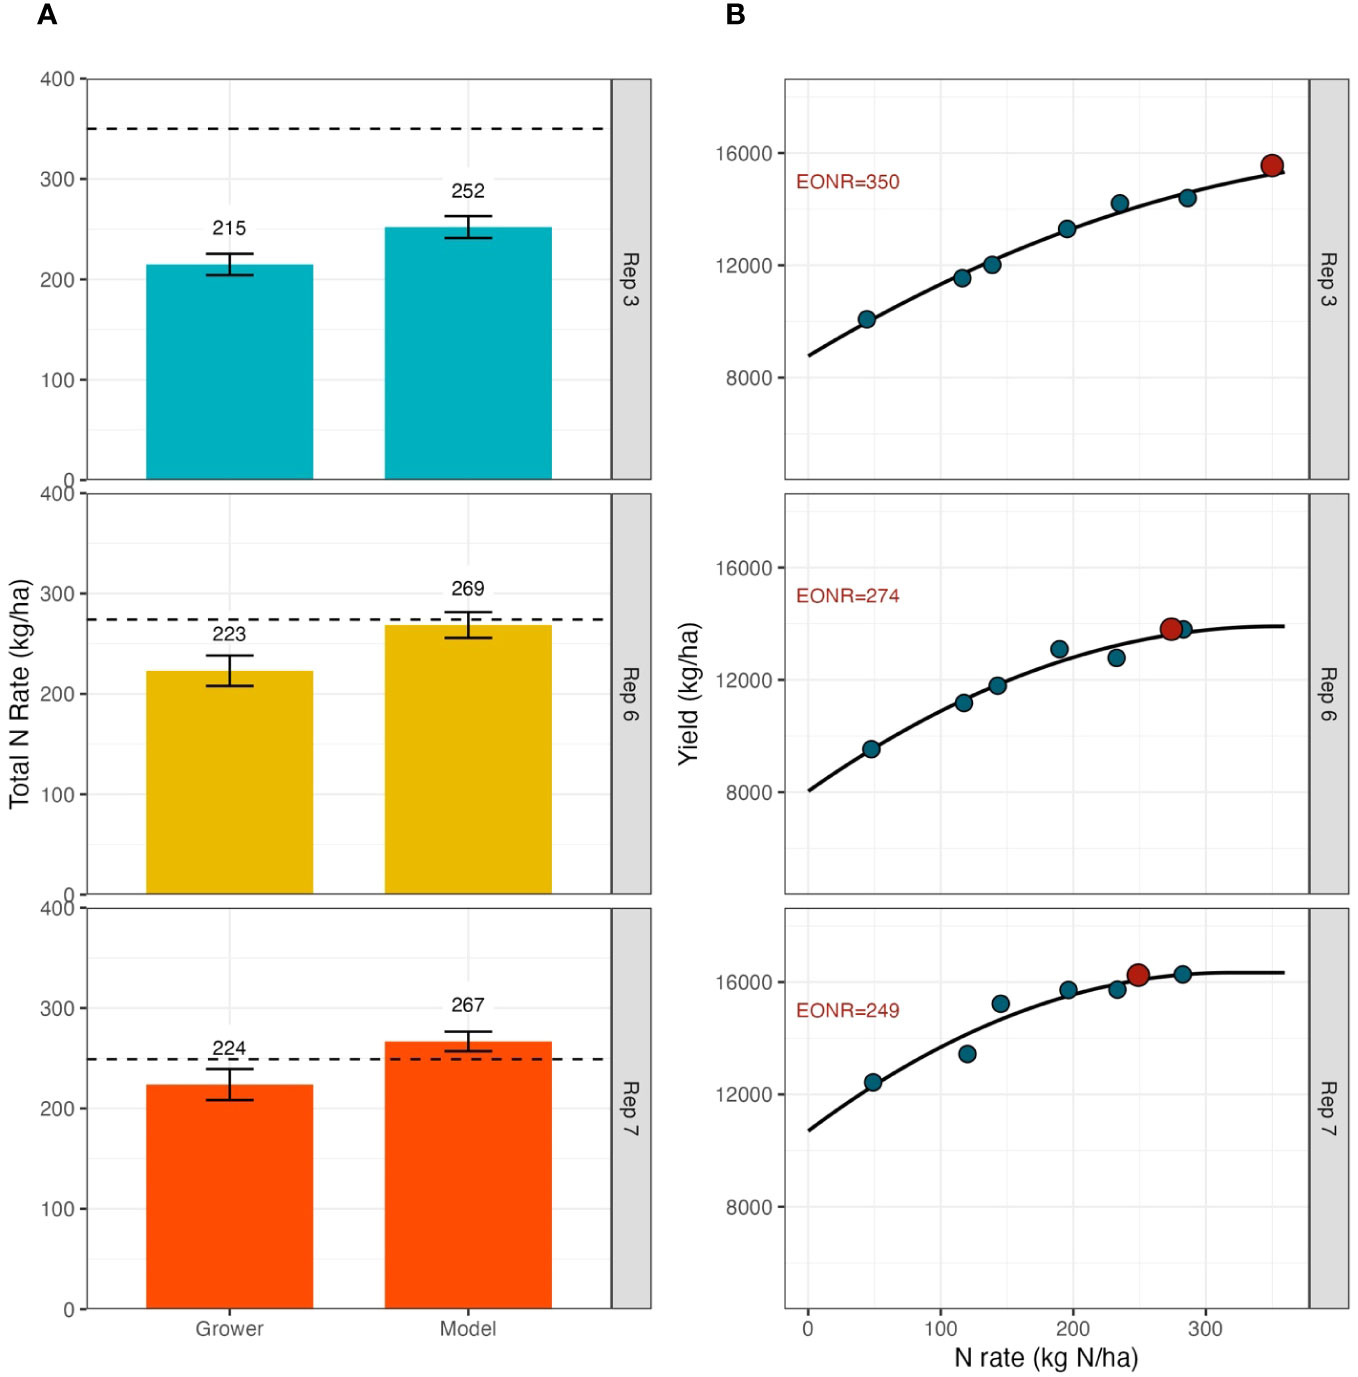
Figure 9 Example of total nitrogen rates for model-based tools and grower’s management (A) and site-specific economic optimal nitrogen rates (EONR, (B) for a subset of site-specific locations within the field. In this example, field length strip repetitions for each treatment (Rep) were compared with the closest EONR. Dashed lines on panel (A) represent the observed EONR.
3.3.1 Yield data processing
The resultant raw yield data processing was based on yield values and harvester speed. Yield-based cleaning occurs by treatment block. By default, the yield observations that were below 5% and above 95% quantiles are removed, and the standard deviation is then calculated for each treatment block. The yield data points that were four standard deviations above or below the median yield were flagged as outliers (Figure 4A). Speed-based cleaning finds the standard deviation and median of the harvester speed for the entire field and any data points that were above or below four standard deviations from median were flagged as outliers (Figure 4B). While four standard deviations from the median is the default metric and value, the computer program was written so that the user can change the method (e.g., for the median absolute deviation) and value. Yield data points that were within 10 meters of the data points that were considered either yield or speed outliers due to spatial misalignment were detected. Outliers were marked and should not be used in the final analysis. All data was flagged and not deleted; the combination of yield flags facilitated the data processing once the final spatial databased is aggregated (Figure 4C).
The yield flag processing was followed by transforming yield data points to polygons (Figure 5). Specifically, polygons were created from the yield observation points where the width of the polygons is determined by the harvester width. This input was either detected from the yield monitor data or provided by the user. This step was crucial in identifying areas with yield overlap during harvest.
3.3.2 Nitrogen fertilizer as-applied maps data processing
The input data (N application data) was processed in a very similar manner as yield data (Section 3.3.1). Outliers were detected using the same criteria (four standard deviation away from the median) by treatment block. However, an additional step was necessary to accommodate when trials prescribed no N, such as a 0 kg ha-1 N rate block. In these areas, the as-applied data would not record data points for the zero rate areas (Figure 6A). To fill in these missing data points, the processing code created input data points parallel to the adjacent input path with as-applied N equal zero (Figure 6B). The creation of these zero rate data points was needed to ensure that these areas are not falsely flagged for underlap. After this step, as with the yield data, input data polygons were created such that the width of the polygons match the N applicator width (Figure 6C). This process would need to be repeated for each fertilizer input as-applied file.
3.3.3 Data aggregation
The resultant yield polygons were superimposed on the input polygons to check for overlap between the two layers and mixed treatment issue (Figure 7). Lack of overlap between yield and input polygons happened when the applicator deviated from the planned path. When overlap happened, parts of the yield polygon area did not receive any N treatment. On the other hand, excessive overlap happened when the applicator went through the same area more than once. The overlap criteria is by default 95% but user can modify this parameter.
For those trials where the lack or excessive overlap was not an issue, was found possible that yield polygons overlapped with multiple input polygons associated with different N rates. For example, a yield polygon is overlapping with two N polygons that share 90% and 10% or the area, respectively. The N polygon with the highest share of the area is the “dominant” polygon. If the share of the dominant polygon is below a threshold (the default is 95%) then, the yield polygon is flag as low-quality. The user can decide the threshold in the program. The proposed method was implemented to also account for the fact that GPS accuracy is not perfect so this way we don’t discard something that isn’t 100% when in reality it probably is 100% aligned but GPS recorded isn’t perfect.
The described issue was called a mixed treatment problem and had a significantly negative impact on the statistical analysis (Edge et al., 2023). These yield polygons were flagged and excluded from the subsequent statistical analysis.
A final data processing step was developed to aggregate the clean yield polygons with additional data such as terrain, soil, or weather (e.g., soil texture, slope, elevation). For a given yield polygon, the area intersecting with the additional data layer was calculated, then the area-weighted average of the values of the data layer was attached to the yield polygon.
3.3.4 Data analysis and reporting
Code for analysis and reporting was implemented after filtering yield and as-applied data that did not meet the criteria within the field-length strips and the N blocks. The user could review the flagging and decide the impact of the detected issues to eliminate or not the flagged observations.
Once the data filtering was in place, the software summarizes the yield and as-applied data points by treatment, repetitions, management zones, and any other variable aggregated as additional data (Figures 3F, G). For all trials, the farmer’s business-as-usual N management was compared to the next-level technology on a whole-field basis. Total N used, yield, profit, and NUE was evaluated (Figures 3I, 8). Then, economic optimum N rate (EONR) was estimated for each N rate block to spatially benchmark the technology tested and the farmer’s traditional N management (Figures 3H, 9). In the example shown in Figure 9, field length strip repetitions of each treatment (Rep) were compared with the closest EONR. Additional data layers could be used to delineate different zones within the field and change the scale of the comparison. Despite that N blocks were located in assumed to be contrasting zones based on available information at the time of the trial design, the data processing is flexible to allow user for additional comparisons.
3.4 Nitrogen technology testing and the impact on growers management
Results were published in the annual on-farm research results extension publications (Thompson et al., 2021; Thompson et al., 2022). Results were shared with over 200 individuals annually through the on-farm research meetings and 12 presentations. Additionally, individual meetings were held at the end of the growing season to share results with the partnering farmers.
Farmer comments and stories revealed they were more comfortable using technology because of participating in this project. One producer noted, “I’ve had crop canopy sensors for years but didn’t feel confident using them. Now that I’ve seen the results, I will use them farm wide.”
Growers also benefitted from seeing the results of the NUE analysis for their management practices. One producer commented, “I’m shocked that our NUE is 1.1 [lb N/bu grain]. I want to push the efficiency below 1 [lb N/bu grain]. I was planning on purchasing some more fertilizer for the upcoming year, but now that I see these results, I think what I have is enough.”
Although the research still on-going and while limited, farmer statements provided evidence that the proposed N technology testing approach was having immediate impact in growers’ NUE and in their willingness to adopt technology. For example, a central Nebraska producer participated in a study looking at sensor-based fertigation technology. Using the responsive sensor-based fertigation approach, the grower was able to reduce N fertilizer rate by nearly 100 kg N/ha compared to his normal management with no impact on yield. Reflecting on his results, the farmer stated, “the project has proved to me that with the sensor-based approach, we can get by with a lot less nitrogen.” In the following year, he adopted this technology across his farm. Quantitative data supporting the impact from the described N technology testing framework will be published future publications.
4 Discussion
4.1 Benefits of the Precision Nitrogen Project testing methodology
The unique OFPE methodology presented here allowed researchers, agronomist, and growers to test a combination of DA technologies to direct N rate applications and/or to enhance the efficiency of the N fertilizer (Figures 1, 2). Compared to small plot N trials (Bullock and Bullock, 1994; Makowski et al., 2002; Kitchen et al., 2017), large-scale N trials (Bullock et al., 2019), and traditional strip trials (Sela et al., 2016; Kyveryga et al., 2018), the PNP framework provided three major novel aspects: on-farm testing of commercially available N technologies, side by side comparison of the N technology with growers’ current N management, and unbiased benchmarking of both N management approaches using site-specific EONR (Figures 8, 9).
Major advances in N management have been made by employing OFPE. For example, the Data-Intensive Farm Management Project (DIFM) (Bullock et al., 2019), enhanced the utilization of small-plot trials at a commercial field level, allowing site-specific determination of the EONR and evaluation of novel modeling strategies (De Lara et al., 2023; Hegedus et al., 2023). While this method allowed growers’ current N management to be benchmarked against the observed EONR, there is no tool available for growers to utilize trial results to direct future site-specific N recommendation. Thus, the applicability for these trials to result in immediate change in growers’ management and adoption of more efficient N management practices is limited. Although the framework presented here is still under evaluation for one more year, grower attitudes following participation revealed an immediate increase in the grower’s knowledge of the technology, willingness to continue using the tested practices beyond the life of the trial, and rapid diagnosis of their current NUE. This supports the hypothesis that solving N related environmental issues in agriculture cropping systems will need to first rely on determining NUE of current N management practices (Tenorio et al., 2020; Cassman and Dobermann, 2022).
Strip trials, on another hand, are often used for testing products (e.g., N inhibitors, N sources), limited numbers of N rates (Kyveryga and Blackmer, 2012) and N tools (Sela et al., 2016) compared to growers’ standard management. However, in most cases these trials do not have sufficient treatment layout and data to determine EONR, thus unbiased benchmarking of the proposed N management is not possible. It is important to note, that the PNP framework took the evaluation of special fertilizers and biologicals to the next level (Figure 2B). First, site-specific performance of the product can be evaluated by aggregating metadata and auxiliary information about soil and crop characteristics (Section 2.2.3). Second, testing N technologies under an array of N rates below and above grower’s traditional N rate, allows to determine impact of these technologies on EONR and under what N level the technology offered the biggest benefits. This is particularly true for the case of biological products that are aimed at reducing total N rate but often applied at excessive N rates, undermining potential benefits. Similarly, N inhibitors aimed at protecting the synthetic N fertilizer source from losses, were beneficial when the N rate is already optimized. The PNP approach enhanced the testing of these technologies on farmer fields, at commercial scales, and across diverse landscapes.
The site-specific EONR determination provides a unique and unbiased capability to evaluate both new technology and growers’ current N practice on a whole-field and site-specific basis (Figure 2). Soil types, management zones, and other crop and soil measurements can be used to derive where the technology performed the best and where the recommended N rates were closer to the observed EONR. For example, in the field shown in Figure 9, we observed EONR values higher than both grower and model-based N management in two of the three replications demonstrating that both approaches were potentially under-recommending N in these areas. This illustrates the potential for the insights derived from benchmarking to be utilized for further technology improvements.
This overview of the PNP introduced the main steps for the trial design, data processing, and analysis as part of a novel framework for conducting on-farm experiments to test N technologies and benchmark them with grower’s management practices and the observed EONR. However, in some cases, lack of access to GPS to enable site-specific applicators and planters limited the growers that could participate in this project. Despite this, the future of these testing strategies is promising as national trends suggest that use of GPS and VRT increased steadily since 1990 (McFadden, 2023).
4.2 Importance of automated data processing, aggregation, analysis, and reporting system
There is a general agreement that requisite data handling, processing, and interpretation are major bottlenecks limiting advancements in digital agriculture (Kutter et al., 2011; Wolfert et al., 2017; White et al., 2021). Usually, data sets derived from OFPE trials are characterized by unstructured, heterogenous data coming from various sources which requires interaction with skilled data scientists and domain experts. The protocols applied in PNP for data processing, analysis, and reporting (Section 2.2), constitute important steps toward reducing these barriers. In addition, the open-source software has the potential to expand the approach to more users, increasing knowledge of N technologies performance and promoting adoption. The PNP is planning to release the source code for public use by the end of the project in 2024.
4.3 Role of on-farm precision experimentation in adoption of digital N technologies
The PNP developed and validated a successful framework to accelerate adoption of proven and industry available solutions (Scharf et al., 2005; Weber and McCann, 2015; Sela et al., 2016; Morris et al., 2018). The recorded trends in this project indicated that more than 50% of the growers continue to use the N technology tested during this project. Although a more comprehensive assessment is needed to confirm this observation, we conclude that several barriers are eliminated once the technology is explained in detail to growers and their advisers and when agronomic, economic, and environmental benefits from technology are clearly communicated (Figure 8). Access to training, close relationships with industry partners, compensation for participation, and reduced cost of technology are among other factors that support the proposed framework.
Growers are pulled in different directions due to a vast offering of DA tools and often do not have the support to evaluate the effectiveness of a particular N technology in their own operation (Bolfe et al., 2020; Puntel et al., 2022; McFadden, 2023). This is evidenced by the larger proportion of growers testing and/or implementing products compared to other technologies (models and sensors) (Castle et al., 2015; Weber and McCann, 2015). In addition, products such as N inhibitors or biologicals are simpler to utilize than other technologies. Crop models and remote sensing-based technologies require larger data inputs, more knowledge and investment. However, as already presented, the PNP removed some of these limitations. This confirms that incentive programs that provide financial and/or technical support like those existing for other management practices (e.g., cover crops, no-till, etc.) could greatly impact the adoption of N technologies. Incentive programs to increase adoption of N technologies should be considered as: (1) increasing NUE and reducing environmental N impacts while maintaining production remains a major challenge of modern agriculture and (2) most of the commercially available technologies tested by the PNP provided an increase in efficiency compared to typical grower management. Thus, the effectiveness of the PNP model serves as evidence to support incentive programs for DA adoption in agriculture.
In addition to the immediate benefit to the growers of testing N technologies in their own fields, this state-wide method is building a substantial dataset for future technology testing with a standardized protocol. This confirmed that public-private partnerships could lead to major contributions to develop or validate N fertilizer management practices (Kitchen et al., 2017; Ransom et al., 2021). Similar public-industry partnerships should be encouraged. Although this research was conducted in the U.S., the methodology and research outcomes will be applicable to agronomic studies across larger regions throughout the world. Further, the framework presented here can be expanded to other practices such as sensor- and model-based irrigation management or chemical use.
5 Conclusion
The presented framework described a unique approach to test and benchmark N technologies and current N management practices in an unbiased and site-specific manner to support producer technology adoption. The following items were recognized as the main conclusions from implementing this framework:
1. The unique aspects of the PNP framework including data processing and interpretation, reimbursement of technology cost, and technical support to evaluate and utilize these technologies allowed us to overcome common barriers to technology adoption as evidenced by increased grower adoption.
2. The validated framework and quantification of the success of the various N technologies tested in the PNP can provide valuable guidance regarding the anticipated level of impact from these technologies. This information can be used to inform the development of cost share or incentive programs.
3. The dataset generated in this study encompassed a wide array of weather and soil conditions that can be used to perform a comprehensive, multi-environment evaluation of current N technologies. Additionally, this and analysis can facilitate the optimal placement for existing technologies and support post-hoc testing of future technologies.
4. The integrated research-extension and public-private collaborations utilized in this project are critical for increasing adoption of management practices that improve productivity and sustainability goals.
5. The model and experiences described in this paper have potential to be expanded to other DA technologies thereby accelerating the adoption of technologies that can improve crop productivity and sustainability.
The potential impact derived from massive adoption of DA technologies remains largely untapped. Effective and long-term adoption of these technologies could help effectively attain the productivity and sustainability goals in future cropping systems.
Data availability statement
The raw data supporting the conclusions of this article will be made available by the authors, without undue reservation.
Author contributions
LP and LT designed the framework and implemented the experiments. LP, LT, and TM developed the code to process experimental data. LP created the first draft of the manuscript. All authors contributed to the article and approved the submitted version.
Funding
The author(s) declare financial support was received for the research, authorship, and/or publication of this article. This work was supported in part by an award from the USDA-NRCS Conservation Innovation Grants, On-Farm Conservation Innovation Trials, award number NR203A750013G014.
Acknowledgments
We are grateful for the collaborations with numerous farmers, extension educators, graduate students, and technologists without whom this work would not be possible.
Conflict of interest
The authors declare that the research was conducted in the absence of any commercial or financial relationships that could be construed as a potential conflict of interest.
Publisher’s note
All claims expressed in this article are solely those of the authors and do not necessarily represent those of their affiliated organizations, or those of the publisher, the editors and the reviewers. Any product that may be evaluated in this article, or claim that may be made by its manufacturer, is not guaranteed or endorsed by the publisher.
References
Barbosa A., Hovakimyan N., Martin N. F. (2020a). Risk-averse optimization of crop inputs using a deep ensemble of convolutional neural networks. Comput. Electron. Agric. 178, 105785. doi: 10.1016/j.compag.2020.105785
Barbosa A., Trevisan R., Hovakimyan N., Martin N. F. (2020a). Modeling yield response to crop management using convolutional neural networks. Comput. Electron. Agric. 170, 105197. doi: 10.1016/j.compag.2019.105197
Bobryk C. W., Yost M. A., Kitchen N. R. (2018). Field variability and vulnerability index to identify regional precision agriculture opportunity. Precis. Agric. 19, 589–605. doi: 10.1007/s11119-017-9541-6
Bolfe É L., Jorge L. A. D. C., Sanches I. D., Luchiari Júnior A., Da Costa C. C., Victoria D. D. C., et al. (2020). Precision and digital agriculture: adoption of technologies and perception of Brazilian farmers. Agriculture 10, 653. doi: 10.3390/agriculture10120653
Bullock D. G., Bullock D. S. (1994). Quadratic and quadratic-plus-plateau models for predicting optimal nitrogen rate of corn: A comparison. Agron. J. 86, 191–195. doi: 10.2134/agronj1994.00021962008600010033x
Bullock D. S., Boerngen M., Tao H., Maxwell B., Luck J. D., Shiratsuchi L., et al. (2019). The data‐intensive farm management project: changing agronomic research through on‐farm precision experimentation. Agronomy Journal. 111 (6), 2736–2746.
Cassman K. G., Dobermann A. (2022). Nitrogen and the future of agriculture: 20 years on: This article belongs to Ambio’s 50th Anniversary Collection. Theme: Solutions-oriented research. Ambio 51, 17–24. doi: 10.1007/s13280-021-01526-w
Castle M., Lubben D. B., Luck J. (2015). Precision Agriculture Usage and Big Agriculture Data. Cornhusker Econ. 2015, 1–3. 29. U.S. Department of Agriculture Tailored Reports: Precision Agriculture. Available online: https://data.ers.usda.gov/reports.aspx?ID=17883. (Accessed on 15 February 2023).
De Lara A., Mieno T., Luck J. D., Puntel L. A. (2023). Predicting site-specific economic optimal nitrogen rate using machine learning methods and on-farm precision experimentation. Precis. Agric., 1–21. doi: 10.1007/s11119-023-10018-8
Dutta S. K., Laing A., Kumar S., Shambhavi S., Kumar S., Kumar B., et al. (2023). Sustainability, productivity, profitability and nutritional diversity of six cropping systems under conservation agriculture: A long term study in eastern India. Agricultural Systems. 207, 103641.
Edge B., Mieno T., Bullock D. S. (2023). Impact of Machinery Misalignment on Economic Results through Jensen’s Inequality in On-Farm Precision Experiments (Urbana Champaign Illinois: Open Science Framework). doi: 10.31219/osf.io/j5zg8
Franzen D. (2008). Site-specific farming-number 1: What is site-specific farming (Fargo, North Dakota: North Dakota State University Extension Bulletin). Available at: https://www.ndsu.edu/agriculture/extension/publications/site-specific-farming-what-site-specific-farming.
Hegedus P. B., Maxwell B. D., Mieno T. (2023). Assessing performance of empirical models for forecasting crop responses to variable fertilizer rates using on-farm precision experimentation. Precis. Agric. 24, 677–704. doi: 10.1007/s11119-022-09968-2
Kitchen N. R., Shanahan J. F., Ransom C. J., Bandura C. J., Bean G. M., Camberato J. J., et al. (2017). A public–industry partnership for enhancing corn nitrogen research and datasets: project description, methodology, and outcomes. Agron. J. 109, 2371–2389. doi: 10.2134/agronj2017.04.0207
Kutter T., Tiemann S., Siebert R., Fountas S. (2011). The role of communication and co-operation in the adoption of precision farming. Precis. Agric. 12, 2–17. doi: 10.1007/s11119-009-9150-0
Kyveryga P. M. (2019). On-farm research: experimental approaches, analytical frameworks, case studies, and impact. Agron. J. 111, 2633–2635. doi: 10.2134/agronj2019.11.0001
Kyveryga P. M., Mueller T. A., Mueller D. S. (2018). On‐farm replicated strip trials. Precision Agriculture Basics., 189–207.
Kyveryga P. M., Blackmer T. M. (2012). On-farm evaluations to calibrate tools for estimating late-season nitrogen status of corn. Agron. J. 104, 1284–1294. doi: 10.2134/agronj2011.0403
Lacoste M., Cook S., McNee M., Gale D., Ingram J., Bellon-Maurel V., et al. (2021). On-Farm Experimentation to transform global agriculture. Nat. Food 3, 11–18. doi: 10.1038/s43016-021-00424-4
Laurent A., Kyveryga P., Makowski D., Miguez F. (2019). A framework for visualization and analysis of agronomic field trials from on-farm research networks. Agron. J. 111, 2712–2723. doi: 10.2134/agronj2019.02.0135
Licht M., Witt M. (2019). Conducting On-Farm Trials. Available at: https://crops.extension.iastate.edu/cropnews/2019/03/conducting-farm-trials.
Lowenberg-DeBoer J., Erickson B. (2019). Setting the record straight on precision agriculture adoption. Agron. J. 111, 1552–1569. doi: 10.2134/agronj2018.12.0779
Makowski D., Wallach D., Tremblay M. (2002). Using a Bayesian approach to parameter estimation; comparison of the GLUE and MCMC methods. Agronomie 22, 191–203. doi: 10.1051/agro:2002007
Mamo M., Malzer G. L., Mulla D. J., Huggins D. R., Strock J. (2003). Spatial and temporal variation in economically optimum nitrogen rate for corn. Agron. J. 95, 958–964. doi: 10.2134/agronj2003.9580
McFadden J., Njuki E., Griffin T. (2023). Precision Agriculture in the Digital Era: Recent Adoption on U.S. Farms, EIB-248, U.S. Department of Agriculture, Economic Research Service. Available at: https://www.ers.usda.gov/publications/pub-details/?pubid=105893.
Morris T. F., Murrell T. S., Beegle D. B., Camberato J. J., Ferguson R. B., Grove J., et al. (2018). Strengths and limitations of nitrogen rate recommendations for corn and opportunities for improvement. Agron. J. 110, 1–37. doi: 10.2134/agronj2017.02.0112
Puntel L. A., Bolfe É.L., Melchiori R. J. M., Ortega R., Tiscornia G., Roel A., et al. (2022). How digital is agriculture in a subset of countries from South America? Adoption and limitations. Crop Pasture Sci. 74, 555–572. doi: 10.1071/CP21759
Puntel L. A., Sawyer J. E., Barker D. W., Dietzel R., Poffenbarger H., Castellano M. J., et al. (2016). Modeling long-term corn yield response to nitrogen rate and crop rotation. Front. Plant Sci. 7. doi: 10.3389/fpls.2016.01630
Ransom C. J., Clark J., Bean G. M., Bandura C., Shafer M. E., Kitchen N. R., et al. (2021). Data from a public–industry partnership for enhancing corn nitrogen research. Agron. J. 113, 4429–4436. doi: 10.1002/agj2.20812
R Core Team (2023). R: A Language and Environment for Statistical Computing, Vienna, Austria. Available at: https://www.R-project.org/.
Scharf P. C., Kitchen N. R., Sudduth K. A., Davis J. G., Hubbard V. C., Lory J. A. (2005). Field-scale variability in optimal nitrogen fertilizer rate for corn. Agron. J. 97, 452–461. doi: 10.2134/agronj2005.0452
Sela S., Es H. M., Moebius-Clune B. N., Marjerison R., Melkonian J., Moebius-Clune D., et al. (2016). Adapt-N outperforms grower-selected nitrogen rates in northeast and midwestern United States strip trials. Agron. J. 108, 1726–1734. doi: 10.2134/agronj2015.0606
Sela S., Woodbury P. B., Van Es H. M. (2018). Dynamic model-based N management reduces surplus nitrogen and improves the environmental performance of corn production. Environ. Res. Lett. 13, 054010. doi: 10.1088/1748-9326/aab908
Tenorio F. A. M., McLellan E. L., Eagle A. J., Cassman K. G., Andersen D., Krausnick M., et al. (2020). Benchmarking impact of nitrogen inputs on grain yield and environmental performance of producer fields in the western US Corn Belt. Agricult. Ecosyst. Environ. 294, 106865. doi: 10.1016/j.agee.2020.106865
Thompson N. M., Bir C., Widmar D. A., Mintert J. R. (2019). Farmer perceptions of precision agriculture technology benefits. J. Agric. Appl. Econ. 51, 142–163. doi: 10.1017/aae.2018.27
Thompson L., Glewen K., Bartels M., Broderick K., Burr C., Ingram T., et al. (2021). 2020 Nebraska On-Farm Research Results, EC3054 (Lincoln, Nebraska: Institute of Agriculture and Natural Resources, Nebraska Extension), 201. Available at: https://cropwatch.unl.edu/OnFarmResearch/2020_NEOnFarmResearchBook_WebEdition.pdf.
Thompson L., Lexow T., Burr C., Dorsey N., Lena B., Lesoing G., et al. (2022). 2022 Nebraska On-Farm Research Results, EC3030 (Lincoln, Nebraska: Institute of Agriculture and Natural Resources, Nebraska Extension), 185. Available at: https://onfarmresearch.unl.edu/pdfs/research/result-publications/2022research-results.pdf.
Trevisan R. G., Bullock D. S., Martin N. F. (2021). Spatial variability of crop responses to agronomic inputs in on-farm precision experimentation. Precis. Agric. 22, 342–363. doi: 10.1007/s11119-020-09720-8
Trevisan R. G., Shiratsuchi L. S., Bullock D. S., Martin N. F. (2019). Improving yield mapping accuracy using remote sensing. BIOLOGY. doi: 10.20944/preprints201901.0287.v1
Weber C., McCann L. (2015). Adoption of nitrogen-efficient technologies by U.S. Corn farmers. J. Environ. Qual. 44, 391–401. doi: 10.2134/jeq2014.02.0089
White E. L., Thomasson J. A., Auvermann B., Kitchen N. R., Pierson L. S., Porter D., et al. (2021). Report from the conference, ‘identifying obstacles to applying big data in agriculture.’. Precis. Agric. 22, 306–315. doi: 10.1007/s11119-020-09738-y
Keywords: on-farm, nitrogen, digital technology, trial design, data driven
Citation: Puntel LA, Thompson LJ and Mieno T (2024) Leveraging digital agriculture for on-farm testing of technologies. Front. Agron. 6:1234232. doi: 10.3389/fagro.2024.1234232
Received: 03 June 2023; Accepted: 08 February 2024;
Published: 15 March 2024.
Edited by:
Jonathan Jesus Ojeda, Regrow Ag, AustraliaReviewed by:
Evans Asenso, University of Ghana, GhanaLucia Bortolini, University of Padua, Italy
Dengpan Xiao, Hebei Normal University, China
Copyright © 2024 Puntel, Thompson and Mieno. This is an open-access article distributed under the terms of the Creative Commons Attribution License (CC BY). The use, distribution or reproduction in other forums is permitted, provided the original author(s) and the copyright owner(s) are credited and that the original publication in this journal is cited, in accordance with accepted academic practice. No use, distribution or reproduction is permitted which does not comply with these terms.
*Correspondence: Laila A. Puntel, lpuntel2@unl.edu