An efficient method for the extraction and the quantitative determination of callose from HLB-affected and healthy citrus
 Chiara Bernardini1,2†
  Alessandro Franco1†
  Riccardo Russo1,3
  Taylor Livingston1
  Frederick G. Gmitter Jr.1
  Amit Levy1,4*
  Tripti Vashisth1*
- 1Citrus Research and Education Center (CREC), Institute of Food and Agricultural Sciences (IFAS), University of Florida, Lake Alfred, FL, United States
- 2Department of Agriculture, Food, Animal and Environment, Università degli Studi di Udine, Udine, Italy
- 3Department of Agriculture, Food, and Environment, University of Catania, Catania, Italy
- 4Department of Plant Pathology, University of Florida, Gainesville, FL, United States
Callose is a 1,3-β glucan responsible for several processes in planta such as cell division, ripening of pollen mother cells, maintaining the plasmodesmata opening, and providing structure to the sieve plates. Besides the physiological roles, callose is deposited during pathogen attacks, forming papillae to prevent pathogen entrance into the tissue or plugging the sieve pores to limit the spread of phloem pathogens. Candidatus Liberibacter asiaticus (CLas), the putative causal agent of Huanglongbing (HLB), is a phloem-restricted pathogen whose infection leads to the production of callose in the phloem. Characterizing the dynamics of callose plugging during HLB is important for understanding the disease, but no published protocols are available for the extraction and quantification of the callose in citrus trees, and quantitative data are limited. Detection of callose by microscopy is time-consuming and expensive and does not give information about the distribution of callose in the entire plant. Here, we present a short protocol for the efficient extraction and quantification of the total callose from citrus plants. We compared different tissues from healthy and CLas-infected plants and identified an increase in callose levels in the midribs, the stems, and the fruit peduncles of infected plants. Callose levels were highest in leaves, especially midribs, compared to stems, roots, and fruit peduncles. This method could be applied to other woody plant species.
1 Introduction
Callose is a heterogeneous 1,3- glucan involved in a wide variety of plant developmental processes and synthesized by the callose synthase complex (Kauss, 1996; Verma and Hong, 2001); it is anatomically located at the plasmodesmata and the sieve plates, where it ensures the symplastic movement of compounds from cell to cell, and it maintains the structure and the stability of the sieve pores (Ellinger and Voigt, 2014). Callose is ubiquitous in plants: in the model plant Arabidopsis, callose represents ~0.3% of the total sugar content (Falter et al., 2015).
Besides its physiological roles, callose functions as a first response against a broad assortment of pathogens and stresses (Chen and Kim, 2009). Callose can be involved in the formation of papillae (Kauss, 1996; Maor and Shirasu, 2005), in plugging the xylem (Rapicavoli et al., 2018; Kashyap et al., 2021), and in the constriction of the sieve pores together with the sieve element occlusion-related proteins (SEOR) (Bernardini et al., 2020, 2022a; Pagliari et al., 2017; van Bel, 2019). Thus, callose quantification and evaluation in plants can have several merits in understanding physiological responses, as well as plant defense in plants.
Several studies reported the use of strong acids or basic solutions for callose extraction (Kessler, 1958; Kauss et al., 1989; Kohler et al., 2000). Indeed, in concentrated acids, saline solutions, and 15% caustic soda, it shows unlimited solubilization; however, a considerable percentage of the callose cannot be readily solubilized in dilute alkali (Kauss et al., 1989). Kessler (1958) showed that callose could be solubilized in organic solvents, and it is water-insoluble in acids and 10% NaOH. Solubilization also occurs when callose is converted into a derivative by substitution of the hydroxyl groups. Köhle et al. (1985) showed that callose from soybean was completely solubilized in 1 N NaOH while Hildebrandt (1987) reported that callose in tobacco leaf is partly alkali-insoluble. The problems related to the solubility of callose may be overcome by partial acid hydrolysis with 2N H2SO4 or 80% formic acid, which presumably results in a decrease in the degree of polymerization (Kauss et al., 1989). Alternatively, dimethylsulfoxide (DMSO) might be used as a solvent (Kohler et al., 2000). However, the extraction with NaOH remains the most widely used method for the quantitative determination of callose in various plants (Hirano et al., 2004; Hirano and Brunner, 2006).
The evaluation of callose deposition by direct observation with transmission electron microscopy (TEM) or with the use of confocal/fluorescent microscopy is a technique widely used to evaluate the callose content in tissues (Zavaliev and Epel, 2015; Welker et al., 2021; Welker and Levy, 2022) as it gives a precise localization of the callose deposits in tissues; however, representing only a thin section of plant tissue; it is a descriptive rather than a quantitative method and does not provide an absolute measure of the callose content in the tissues. Conversely, spectrofluorometric protocols are available for the extraction and quantification of callose from Arabidopsis (Kohler et al., 2000), Castanea sativa, and Picea abies (Hirano and Brunner, 2006). However, these protocols are not efficient for citrus or other woody plants due to the different composition of the tissue and the detection limit: citrus has a strong background autofluorescence from the xylem (this study), thus a more sensitive method (compared to the ones previously utilized) is needed. Currently, there are no specific protocols established for citrus able to detect small differences in callose concentration and to overcome the xylem autofluorescence.
The citrus industry is well-established and economically relevant in several countries worldwide with a total production of 144,000 thousand tons (FAO, 2021). Several pathogens and stresses affect the health status of citrus orchards. In many of the biotic and abiotic stresses, one of the first lines of defense is the synthesis of callose. Phytophthora spp. are soil and water-borne pathogens responsible for root rot and foot rot in citrus. Citrus fights the pathogen by surrounding the hyphae with callose, especially in Phytopthora-resistant plants (Gaikwad et al., 2023). After the induction of the defense system with hexanoic acid, lesions caused by Alternaria alternata are reduced, and the callose content increases (Dalio et al., 2017).
Among the bacterial pathogens, Xanthomonas citri is counted as one of the most dangerous pathogens of citrus, causing citrus canker. Plants transformed with the gene encoding for the copper and zinc superoxide dismutase showed increased callose and decreased lesions caused by X. citri (Docema et al., 2023).
Even more devastating than X. citri, Candidatus Liberibacter asiaticus (CLas) is the causal agent of Huanglongbing (aka HLB or citrus greening disease), is a vector-borne disease of citrus. After CLas colonization, a high accumulation of callose inside the sieve element, the site of infection of the pathogen, has been reported (Koh et al., 2012). Infected sieve elements were previously reported to contain high levels of callose at the sieve plates when analyzed by microscopy (Achor et al., 2010, 2020; Granato et al., 2019; Bernardini et al., 2022b). Thus, callose was shown to increase in midribs from infected leaves (Achor et al., 2020, 2010; Granato et al., 2019; Bernardini et al., 2022b) and infected stems (Achor et al., 2020). However, besides the starch accumulation, no callose deposition has been reported in the palisade and spongy parenchyma of the leaf laminae and similarly, no substantial callose deposition was observed in roots after infection (Achor et al., 2020). We compared midribs and fruit peduncles (enriched in sieve elements), leaf laminae (enriched in palisade and spongy parenchyma), and roots from healthy and infected citrus to prove that the protocol is sensitive to differences that were previously demonstrated with microscopic methods.
Considering the above-reported examples, the development of a protocol to describe the callose response is important; having a way to quantify the amount of callose inside the citrus plant will enable a better understanding of the plant response to the pathogen and the mechanisms the plant uses to limit the spread and the impact of the pathogen. Based on these considerations, here, we present a short protocol for the efficient extraction and quantitative determination of callose from leaves, stems, fruit peduncles, and roots of Citrus sinensis (sweet orange). This protocol was validated by comparing the results from this protocol with the light microscopy analysis.
In the study of citrus, an effective protocol that allows us to analyze a great number of samples and to provide a comprehensive overview of the plant is still needed: microscopy techniques have unquestionable precision as they show the exact location of the callose deposits, but they are highly time-consuming, and they do not give a general overview of the total callose distribution and content. The following protocol is divided into two parts: extraction followed by staining, and the consequent evaluation of the fluorescence using a fluorospectrophotometer. The extraction involves the removal of the chlorophyll in EtOH and the consequent extraction of the total callose with 1M NaOH. After the extraction, the samples can be stored at 4°C for up to 6 months without any negative effects on the subsequent evaluation of callose content. This protocol provides a faster and more reliable method to process a larger number of samples than microscopy, and it allows assessments representative of the entire plant and not only of small areas or the site of infection.
2 Materials and equipment
1. Liquid nitrogen;
2. Mortars and pestles;
3. Screw-cap 2 mL tubes (cat. 3463PK, Thermo Fisher Scientific, Waltham, Massachusetts, USA);
4. Flat-top snap-capped 2 mL tubes (cat. 05-408-138, Thermo Fisher Scientific, Waltham, Massachusetts, USA);
5. Chrome steel beads (3.2mm diameter, cat. 11079132c, Biospec Products, Bartlesville, OK, USA);
6. Ethyl alcohol 96% (EtOH, molecular biology grade, CAS #64-17-5, Thermo Scientific Chemicals, Waltham, Massachusetts, USA);
7. Sodium hydroxide, white pellets (NaOH, CAS #1310-73-2, Thermo Scientific Chemicals, Waltham, Massachusetts, USA);
8. Liquid hydrochloric acid, solution 6N (HCl, CAS #7647-01-0, Thermo Scientific Chemicals, Waltham, Massachusetts, USA);
9. Aniline blue, water-soluble powder (CAS #28631-66-5, Electron Microscope Science, Hatfield, PA, USA);
10. Glycine, powder (CAS #56-40-6, Thermo Fisher Scientific, Waltham, Massachusetts, USA);
11. TissueLyser II (cat 85300, Qiagen, Hilden, Germany);
12. Ultrasonicator (2510 Branson, Marshall Scientific, Hampton, NH, USA);
13. Digital heat block (Thermo Fisher Scientific, Waltham, Massachusetts, USA), water bath can be used as well;
14. P1000;
15. P100;
16. Tips 1000 μL;
17. Tips 100 μL;
18. 96-well plates (clear or black), (cat. 3355, Thermofisher Scientific, Waltham, Massachusetts, USA)
19. BioTek Fluorescence Microplate Readers FLx800 (Biotek Instruments INC, Vermont, USA);
20. CM-Pachyman, Carboxymethylated, (DS ~ 0.3) highly purified Pachyman, powder, for the assay of endo-1,3-β-D-glucanase (Carboxymethyl Pachyman, Megazyme Standard, Wicklow, Ireland)
Solutions needed:
Aniline blue staining: Dissolve 0.1 mg of aniline blue in 100 mL of distilled water to have a 0.1 w/v stock solution. Before use, dilute the solution to 0.01 v/w. Keep both working and stock solutions under foil to avoid light exposure.
NaOH 1M: Dissolve 4.0 g of NaOH in 100 mL of distilled water.
HCl 1M: dilute 16.6 mL of 6N HCl in 83.4 mL of ddH2O;
NaOH-Glycine 1M: Dissolve 4.0 g of NaOH and 7.5 g of glycine in 80 mL of distilled water. Add HCl to adjust the pH of the solution to 9.5. Adjust the volume to 100 mL.
3 Methods
3.1 Tissue collection
Ten 7-year-old ‘Valencia’ orange trees (C. sinensis (L.) Osbeck) budded on Swingle citrumelo (C. paradisi Macf. x Poncirus trifoliata) rootstock potted (pot dimensions: 10.2 × 10.2 × 35.6 cm) in a commercial growing medium (mixture of peat/perlite/vermiculite at 3:1:1 by volume) were used in this study. Five of them were previously infected with CLas through exposure to infected vector insects Diaphorina citri (Kuwayama) (Hall et al., 2013). Throughout the experiment, the plants (healthy and infected) were grown under natural light conditions in the greenhouse; the temperature and relative humidity of the greenhouse fluctuated between 22 and 25°C and 60% to 80%, respectively. Before the sample collection, five leaves randomly taken from each plant were tested by qPCR to confirm the presence of the bacterium following a commonly used protocol (Li et al., 2006). From those plants, entire leaves, midribs, stems, and roots were collected for callose extraction and quantification. For the fruit peduncle, due to the impossibility of obtaining a reasonable amount of healthy and infected fruit in the greenhouse condition, HLB-symptomatic lopsided and asymptomatic nonlopsided fruits were collected from an HLB-affected ‘Valencia’ orchard in Lake Alfred, FL, in March 2023.
For validation of the callose quantification protocol, eight 5-year-old ‘Duncan’ grapefruit plants (C. paradisi Macf.) potted (pot dimensions: 10.2 × 10.2 × 35.6 cm) in a commercial growing medium (mixture of peat/perlite/vermiculite at 3:1:1 by volume) were used. Four of them were exposed to the vector insects and tested by qPCR as reported above. From those plants, four midribs were collected from fully expanded leaves. Each midrib was divided in half: half midrib was used for the light microscopy callose analysis and in the other half callose was quantified using the proposed protocol.
3.2 Callose extraction
The time required to carry out the extraction step is 7 days for chlorophyll clearing and 5 h for effective extraction of the callose. Figure 1 reports in detail the procedure to extract and stain the callose.
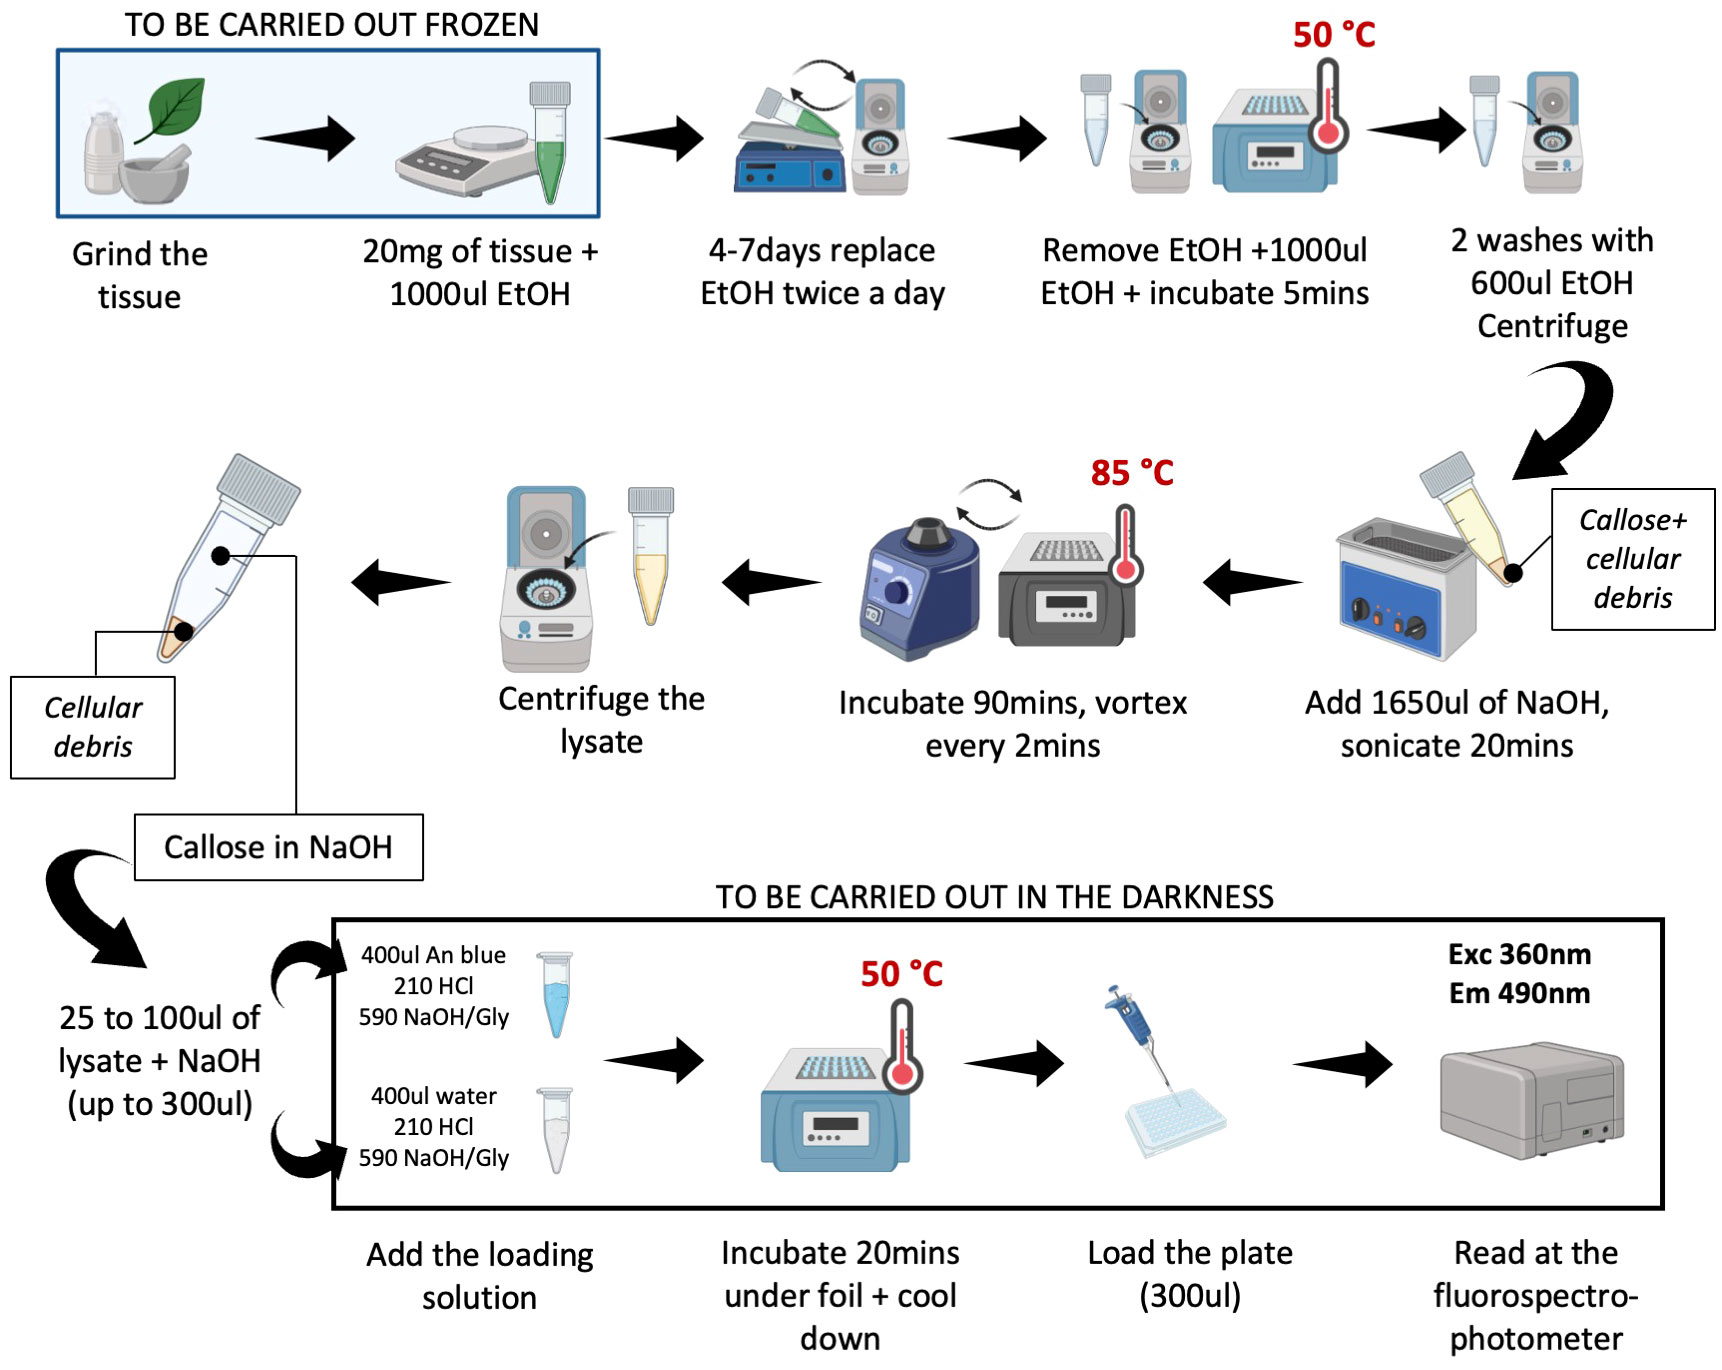
Figure 1 User-friendly protocol for callose extraction. The picture reports step-by-step the protocol followed for the extraction and the quantification of the callose. Before adding the EtOH all the steps should be carried out in frozen conditions. After the addition of aniline blue, the samples may be kept under the foil, to prevent the degradation of the fluorescence. The protocol can be stopped after the extraction of the callose and before the staining. Picture realized with Biorender.
Harvest the tissue and freeze it immediately in liquid nitrogen. Grind the samples with a mortar and pestle using liquid nitrogen then weigh (20 mg) and transfer to 2.0 mL screw-cap tubes suitable for use with TissueLyser (cat 85300, Qiagen, Hilden, Germany). Grind the sample a second time with steel beads using TissueLyser (30 s up to 8 times). Keep the powder frozen. Add 1.0 mL of 100% EtOH to the sample. To avoid the formation of clumps, quickly mix the samples (15–20 sec) with TissueLyser. Remove the beads. Incubate the samples at RT and remove the chlorophyll by incubating the samples for seven days on an orbital shaker with several changes of ethanol until all chlorophyll is gone.
After 7 days of washing, centrifuge the samples for 5 min at 10000g, and discard the EtOH. Soak the tissue for 5 min in 1.2 mL ethanol at 50°C in a heat block and mix. Centrifuge for 5 min at 10000g at room temperature. Discard the EtOH. After this step, wash the pellet in 600 μL ethanol and vortex, and centrifuge for 5 min at 4000g at room temperature; repeat this step twice. Dissolve the sample in 1650 μL of 1M NaOH. Sonicate for 20 min and mix regularly to allow the disruption of the cells. Incubate the samples for 90 min at 85°C in a heat block and shake frequently (every 2–3 min). Cool down to room temperature (~10 min), and centrifuge for 10 min at 10000g. Transfer the supernatant to a fresh snap-capped tube. The supernatant can be stored at 4°C for up to 6 months.
For the quantitative determination of extracted callose, supplement 25–100 μL of supernatant with 200–275 μL of NaOH 1M (add NaOH to the sample up to 300 μL) and 1.2 mL loading mixture [400 μL 0.01 (w/v) aniline blue in water; 210 μL 1M HCL; 590 μL 1M glycine/NaOH buffer pH 9.5]. For accurate callose determination, run a parallel assay to evaluate the autofluorescence of the sample: supplement 25–100 μL of supernatant with 275–200 μL of NaOH 1M (up to 300 μL) and 1.2 mL blank loading mixture [400 μL distilled water; 210 μL 1 M HCL; 590 μL 1M glycine/NaOH buffer pH 9.5]. To have a blank of the assay (autofluorescence of the aniline blue), supplement 300 μL of 1M NaOH with the loading mixture [400 μL 0.01 (w/v) aniline blue in water; 210 μL 1M HCL; 590 μL 1M glycine/NaOH buffer pH 9.5] and 300 μL of 1M NaOH with the blank loading mixture [400 μL distilled water; 210 μL 1M HCL; 590 μL 1M glycine/NaOH buffer pH 9.5]. After 20 min incubation at 50°C under aluminum foil, cool down the samples under the foil to room temperature for about 10 min. Load a 96-well plate. Four technical readings should be performed for the stained samples and four for the autofluorescence of the samples. The total fluorescence of the samples, representing both autofluorescence and fluorescence of the callose/sirofluor complex is determined with a fluorescence spectrophotometer (BioTek Fluorescence Microplate Readers FLx800) at 360-nm excitation wavelength, a 460-nm emission wavelength. The signal of the sample treated with the loading mixture containing aniline blue is the total fluorescence of the sample, and the signal of the sample treated with the blank loading mixture is autofluorescence.
3.3 Interpolation of the data with the standard curve
Because of the chemical heterogeneity of callose, quantifications were based on a comparison with the fluorescence of known amounts of the commercial β-1,3-glucan CM-Pachyman. To obtain the standard curve, 60 μg, 30 μg, 15 μg, 7.5 μg, 3.75 μg, 1.875 μg, 0.93 μg, 0.47 μg and 0.23 μg from a stock solution of 5 mg/mL were diluted in 1M NaOH, in a final volume of 300μL. The dilutions were supplemented with the loading mixture (see above). To evaluate the autofluorescence of the standard, a parallel assay was carried out and the standards were supplemented with the blank loading mixture (see above). 300 μL of 1M NaOH supplemented with the loading mixture and 300 μL of NaOH supplemented with the blank loading mixture were used respectively as point 0 fluorescence and point 0 autofluorescence of the standard curve. The standard curve was obtained by subtracting the autofluorescence of the standard and the net fluorescence of point 0 from the total fluorescence of the standard. The obtained curve correlates the intensity of fluorescence with the amount of standard stained. The net fluorescence of point 0 was calculated by subtracting the autofluorescence from the total fluorescence of the aniline blue.
Here we provide the formula used to normalize the data. At the numerator, we interpolate the data with the standard curve to obtain the µg of callose in the volume supplemented by the staining solution (generally between 25–100 µL). At the denominator, we reported the amount of mg that is present in the volume supplemented by the staining solution. In the formula, the net fluorescence is the total fluorescence of the sample – the autofluorescence of the sample – the net fluorescence value of the point 0 measure. The “mg FW” is the mg of fresh tissue (typically ~20 mg) collected to perform the assay. For µL of the solution, we mean the amount of clarified extract used in the assay. The µL loaded is the amount of solution loaded in the plate (usually 300 μL).
3.4 Light microscopy callose analysis and experimental time evaluation
Four midribs for each plant were analyzed. The samples were stained with aniline blue solution as previously reported (Welker et al., 2021). Samples were visualized with a Leica SP8 LSCM (Leica Microsystems Inc., Buffalo Grove, IL, USA). Aniline blue fluorescence was excited with a 405nm diode laser and emission was detected at 475-525nm. For each replicate, at least 14 pictures were collected. To obtain the 3D picture, we collected 300z-stack pictures for the phloem area. The stacks were managed with the software LASX to build the 3D reconstruction (Leica Microsystems Inc., Buffalo Grove, IL, USA).
Imaging analysis was performed to evaluate the callose deposits. The number, the total fluorescent area, and the area of each callose deposit were evaluated as previously reported (Zavaliev and Epel, 2015) using FIJI software (Schindelin et al., 2012) and the algorithm Bernsen with radius = 5. The callose particles were distinguished from the autofluorescence by size and shape. We filtered the particles of the mask from the algorithm with a maximum size of 100 µm2 and a circularity of 0.5–1.0 (where 1.0 is considered the maximum circularity).
For those samples, the total time of extraction and the total time of the microscopy analysis was measured.
3.5 Data analysis
Statistical analyses were performed using R with RStudio software Version 1.1.456 (RStudio Team, 2020). RStudio: Integrated Development for R. RStudio, PBC, Boston, MA). Conformity to the normal distribution and homogeneity of variances were checked with Shapiro-Wilk’s test and Bartlett’s test respectively. Where necessary, data were normalized with a Box-Cox transformation. For each analysis, a Student’s t-test was used to determine significant differences among the treatment group means (healthy or infected) with p < 0.05.
4 Results
We presented a short protocol for the efficient extraction of callose from C. sinensis cv Valencia, in which callose deposition is a general response to many pathogens. We collected samples from different tissues: leaf blades, midribs, stems, fruit peduncles, and roots. We observed a substantial accumulation of callose in the peduncle, midrib, and stem tissue of HLB-affected trees, while root and leaf blades did not show significant differences between healthy and HLB-affected plants.
4.1 Considerations
Table 1 lists possible problems that may arise during the entire process that require attention. Accurate weights of the tissue from which the callose is extracted are critically important, to avoid exponential errors in the results.
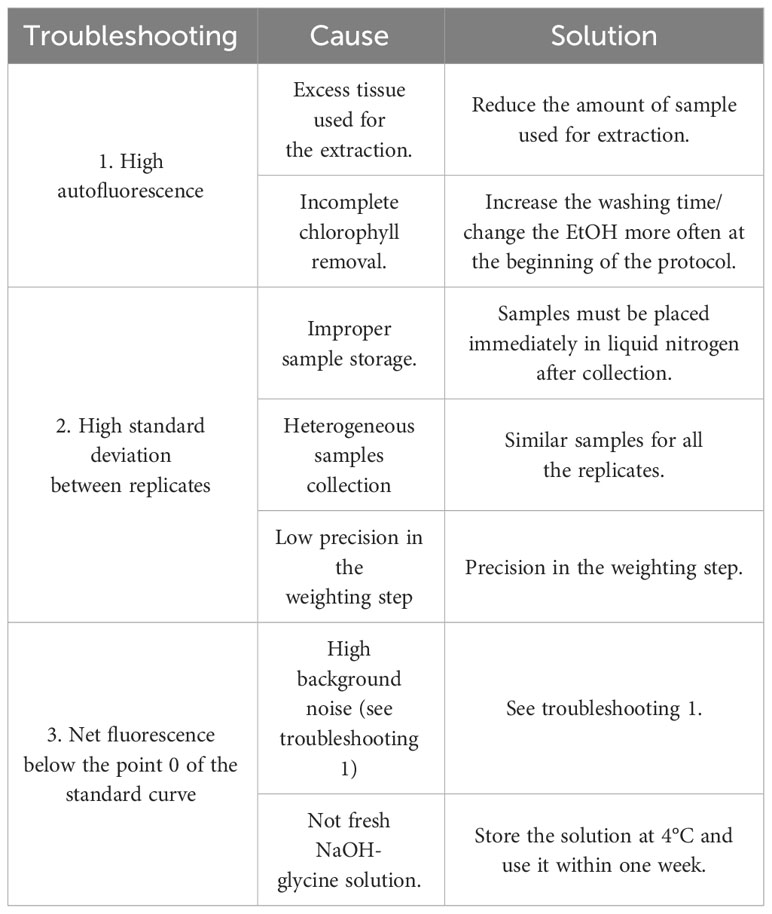
Table 1 Possible problems during the extraction and quantification of callose fluorescence.
In the first part of the protocol, the samples must be flash-frozen in liquid nitrogen as quickly as possible once they have been collected. In this way, the risk of callose production in the harvested tissue is reduced. The production of callose can happen in a relatively short time. Mullendore et al. (2010) demonstrated that callose formation occurs within minutes from the injury. Thus, we need to underline that the sampling time has a pivotal role in the effectiveness of the entire procedure. Moreover, it is crucial to use tubes that can withstand several cycles in the Tissuelyser so it will be possible to grind as much as possible. We noticed that perfect grinding greatly improves the callose extraction. To prevent callose synthesis during the grinding and weighing process the tissue must be frozen.
The daily change of ethanol is essential for the removal of all the chlorophyll contained in the tissue from which the callose is being extracted. The incomplete removal of chlorophyll could have negative effects in the extraction phase with NaOH and the consequent aberrant measurement of autofluorescence with the fluorospectrophotometer. The autofluorescence, in fact, highly affects the final value of the quantified callose. Other serious problems arise when soluble autofluorescent substances are present or are formed during the treatment of the plant material with NaOH (Kauss et al., 1989). This problem may be avoided by several changes of ethanol before the extraction of callose with NaOH. The clearing process must be done on the roots as well, to remove compounds that can interfere with the readings.
The central phase of the callose extraction is the exposure of the sample to 90°C with NaOH 1M, and the sample must be vortexed as often as possible. We notice that shaking the samples every two minutes greatly increases the amount of callose extracted.
Finally, in the preparation of the sample for reading with the fluorospectrophotometer, it is suggested to use stocks of fresh reagents and not expose the sample and the aniline blue staining to the light.
4.2 The standard curve using the CM-Pachyman
A standard curve of the fluorescence of CM-Pachyman was obtained by the analysis of three independent curves, each obtained with fresh reagents (Figure 2), Table 2 reports the value of net fluorescence for each point of the standard curve.
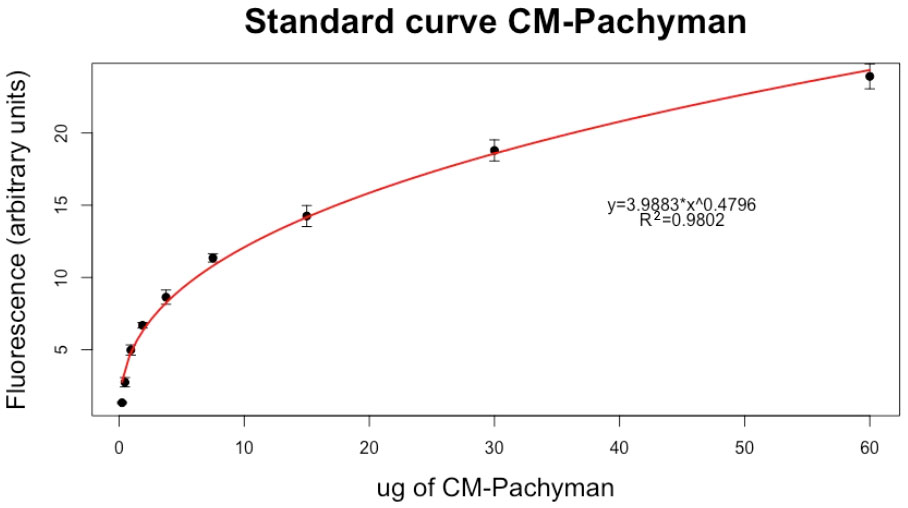
Figure 2 Standard curve for the calculation of the amount of callose. Each point is an average value of three technical replicates ± SE of the mean.

Table 2 Value of fluorescence for each point of the standard curve.
4.3 Comparisons of callose amounts in healthy and infected citrus tissues
The amount of callose obtained strongly depends on the type of tissue analyzed. Generally, roots have shown a lower concentration of callose in the healthy plants (6.77 µg/mg FW, ± 1.47) compared with the HLB-affected (11.45 µg/mg FW, ± 3.85), but without significant differences (Figure 3A).
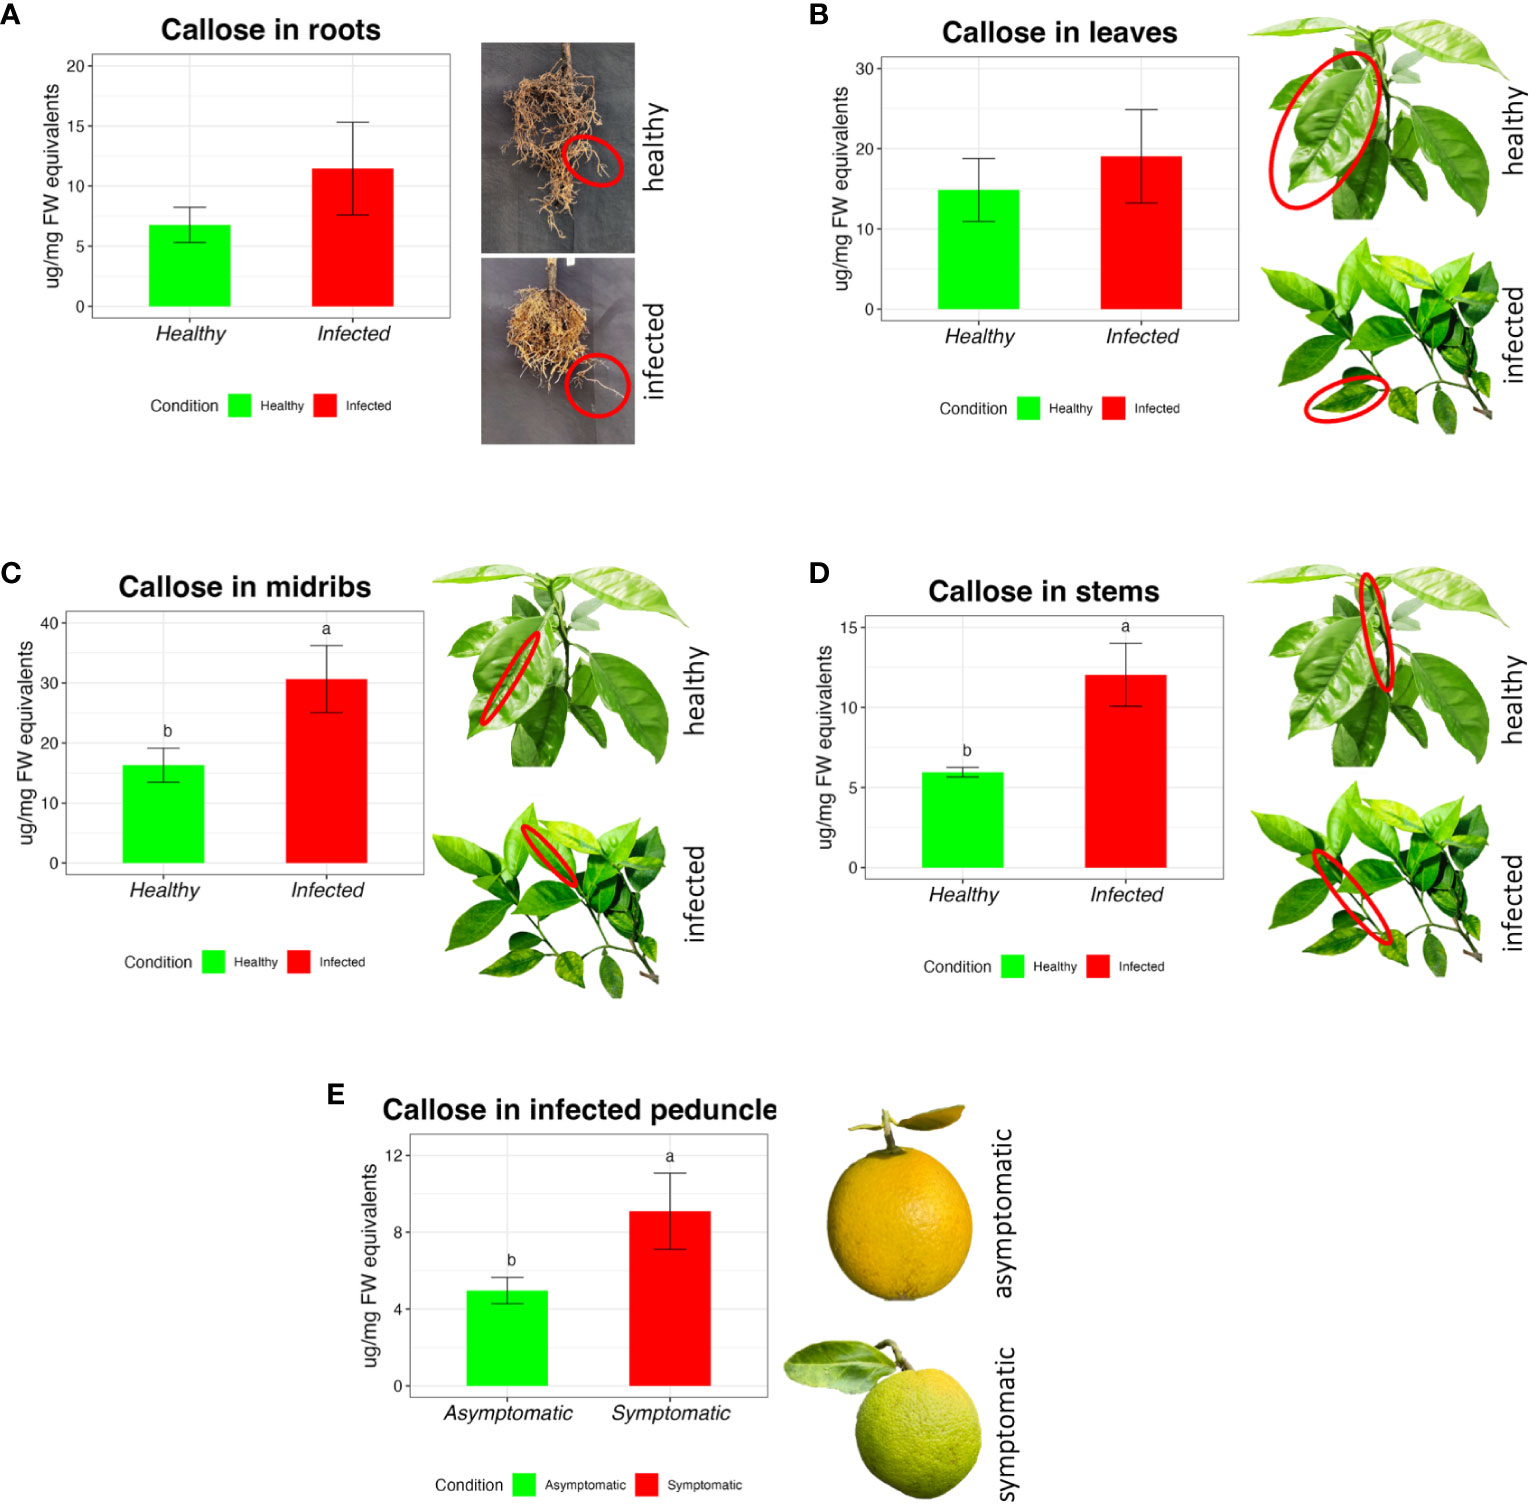
Figure 3 Callose measurement in sweet orange through the extraction and quantification of different tissues in Citrus sinensis cv Valencia. Barplots report the callose concentration in healthy and CLas infected roots (A), leaves (B), stems (C), and midribs (D). Bar plot (E) reports the concentration of callose in the asymptomatic and symptomatic peduncle of ‘Valencia’. The data are expressed as average value ± SE of the mean. Different letters express significant differences among the means, evaluated with T-test (p<0.05).
There were no significant differences between healthy and infected leaf blades (Figure 3B) (respectively 14.85 ± 3.91 and 19.05 ± 5.82 µg/mg FW). In the midribs, healthy trees showed lower content of callose (Figure 3C) (16.29 µg/mg FW, ± 2.85), which is nearly half the content in the infected plants (30.64 µg/mg FW, ± 5.58). In the stem tissue (Figure 3D), infected citrus plants showed an increase in callose amount (12.05±1.97 µg/mg FW), which was more than 50 % higher compared with healthy trees (5.95±0.30 µg/mg FW). Peduncles from asymptomatic fruit had a concentration of callose of 4.96±0.69µg/mg FW, which was significantly lower compared with 9.08±1.98µg/mg FW in symptomatic fruit peduncles (Figure 3E).
Precision: Based on the sequential dilution of the standard CM-Pachyman, we can assume that the lower detection limit is 0.23 µg of CM-Pachyman equivalents. In fact, for dilutions under that value, the fluorescence of the standard stained with aniline blue was equal to point 0 (data not shown). However, CM-Pachyman equivalents higher than 60 µg saturated the staining solution reaching a plateau of the standard curve. Therefore, whenever the samples show a value greater than the last point of the standard curve, using a dilution of the sample is required.
4.4 Comparison with the microscopy method, and evaluation of protocol length
To validate this protocol, we collected healthy and infected midribs of ‘Duncan’ grapefruit and we tested them using the protocol presented here and with the light microscopy method. Figure 4 shows the results of the comparison. In the 3D microscopic reconstruction, healthy samples show a strong autofluorescence in the xylem (Figure 4A, inset i) and few callose deposits, while CLas infection causes an increase of callose deposits (Figure 4A, inset ii). The imaging analysis shows an increased amount of callose deposits and increased total area occupied by the fluorescent dots (Figures 4B, C), with an average of 71 ± 4.00 and 233 ± 16 for the count and 468.15 ± 24.03 and 1545.91± 103.78 µm2 for the total area in healthy and infected samples respectively. The average size of the fluorescent dots was not affected by the presence of the pathogen (Figure 4D). The same samples, analyzed with the protocol presented here, showed an average content of callose of 11.49 ± 3.18 and 198.76 ± 59.44 µg/mg FW for healthy and infected respectively (Figure 4E). We then compared the time needed for running this protocol and the microscopy protocol (Figure 4F). To process the grapefruit samples with the protocol presented here, 580 min were needed. The same number of samples was analyzed in 990 min with the microscopy protocol.
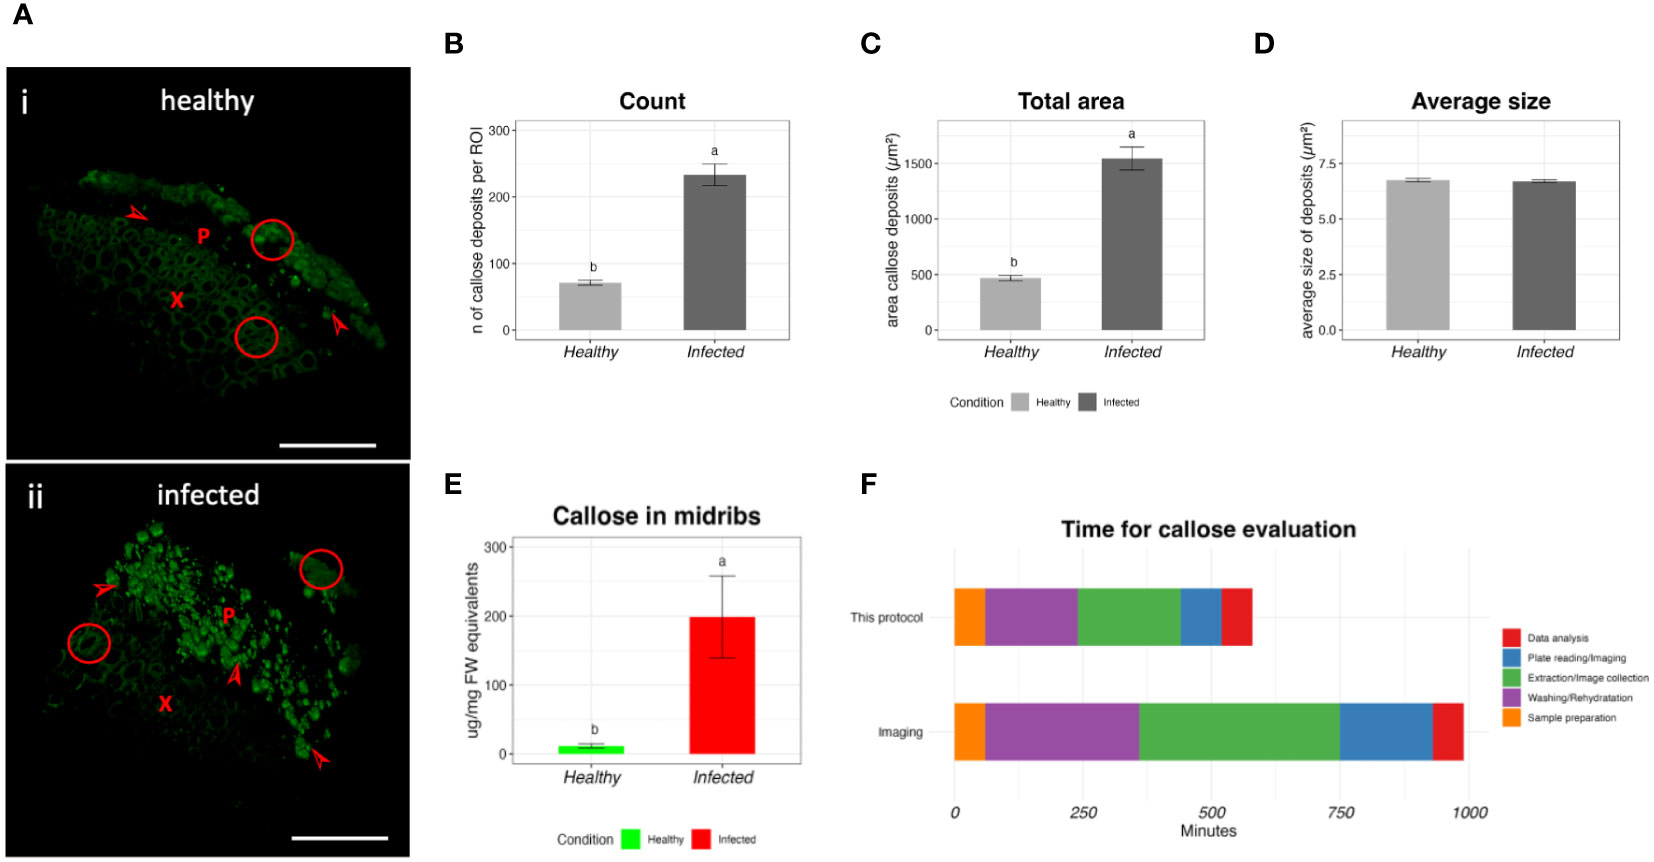
Figure 4 Validation of the protocol by comparison with the microscopy method. (A) Representative 3D micrographs of healthy (i) and infected (ii) ‘Duncan’ grapefruit midribs after callose labeling with aniline-blue. X= xylem, P = phloem, arrowhead=callose deposits, circles= autofluorescence of the tissue. Bar= 100um. (B–D) values of count (B), total area (C) and average size of the particles (D) of the callose deposits by the microscopy method. (E) Callose concentration in ‘Duncan’ midribs, extracted with the protocol developed in this study. In the bar plots, the data are expressed as average value ± SE of the mean. Different letters express significant differences among the means, evaluated with T-test (p<0.05). (F) Time required for the extraction of the callose and the evaluation with the confocal microscopy.
5 Discussion
Here, we presented a short protocol for the efficient extraction and quantification of callose from different citrus tissues. We collected and processed samples from different tissues of healthy and HLB-affected trees: leaf blades, midribs, stems, fruit peduncles, and roots. As we expected, we observed a substantial accumulation of callose in the fruit peduncles, midribs, and stem tissues of HLB-affected trees, while root and whole leaf blades did not show significant differences.
In Figure 5 we present a heatmap of the callose content in each tissue (Figures 5A, B). The tissue with the highest concentration of callose was the infected midrib, while the tissue with the lowest concentration was the asymptomatic peduncle (Figures 5A, B). From previous studies, it was shown that HLB causes a massive constriction of the sieve pores by callose (Etxeberria et al., 2009; Kim et al., 2009; Achor et al., 2010; Koh et al., 2012; Deng et al., 2019; Welker et al., 2021; Bernardini et al., 2022b). Surprisingly, in our study there was no difference in callose content between healthy and infected leaf blades and roots (Figure 5). To explain this behavior, we should consider that the pathogen inhabits the phloem, and it mostly causes alterations in the phloem tissue (Folimonova and Achor, 2010). No callose accumulation was observed in the palisade and spongy parenchyma, the main components of the leaf lamina (Achor et al., 2010). Therefore, the callose content would be greater in the phloem cells. Given this, tissues like midribs, peduncles, and stems have a higher percentage of phloem cells than the whole leaves, thus they will have more callose. In a previous study, roots of sweet orange and grapefruit showed milder symptoms compared to other organs of the infected plants with apparently no altered callose deposition (Achor et al., 2020). With this protocol, we also show that there is no difference in callose content between healthy and infected roots (Figure 3A).
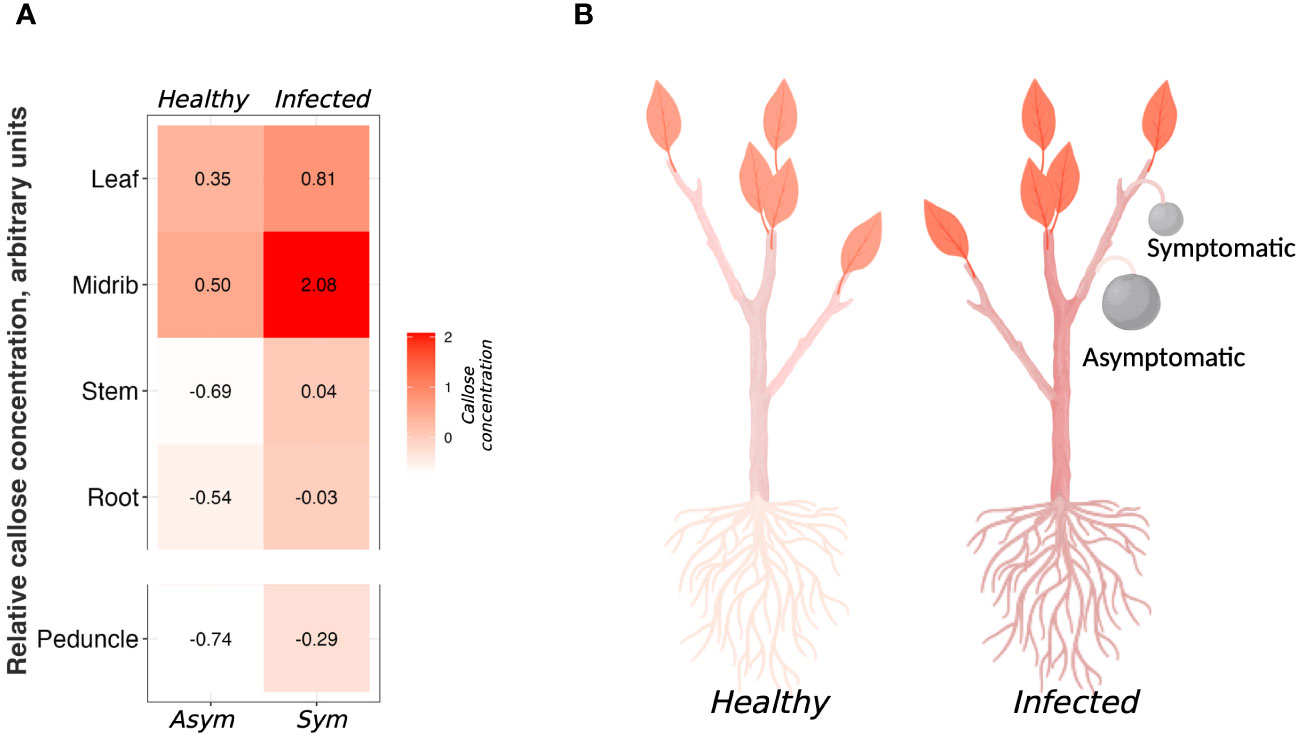
Figure 5 Summary of the callose concentration among the analyzed tissues. (A) Heatmap of the standardized value of callose concentration among the tissue. (B) Representative diagram of the callose distribution in healthy and infected citrus tissues. Picture realized with Biorender.
Having an efficient method for the evaluation of the callose content is pivotal for the study of HLB. First, evaluating the callose concentration provides an indirect measure of the phloem blockage, and it could describe all the implications that the blockage may have. Secondly, callose quantification could be an objective and indirect measure of symptoms caused by the presence of the pathogen in the tissues: the accumulation of callose causes the loss of functionality of the tissue and in several cases leads to the appearance of symptoms. Thus, in combination with other techniques (microscopy or molecular biology), this protocol can provide more information on citrus response. The future application of this protocol would be in the study of tolerant varieties, providing more information about the mechanism on which the tolerance is laid and whether this is related to decreased phloem blockage. Moreover, in the study of citrus we often encountered difficulty in describing the severity of the disease: considering the callose as the main reason for the symptom appearance, the callose concentration could become a more objective measure of the disease incidence rather than the commonly used subjective visual score.
5.1 An indirect measure of the phloem blockage
In the case of HLB, the relation between callose accumulation with the phloem plugging and collapse, the narrowing of the peduncle, and the formation of asymmetric small fruit are well documented (Etxeberria et al., 2009; Kim et al., 2009; Deng et al., 2019). Callose constriction correlates with reduced translocation within the phloem tissue; increases in callose deposits highly decrease the translocation rate along the phloem (Welker et al., 2021). This directly acts on the quality and the quantity of the fruits produced. Reduced translocation leads to an inefficient photosynthetic apparatus: sugars accumulated in the leaves are stored as starch inside the thylakoid system with a consequent reduced photosynthetic activity (Albrecht and Bowman, 2012), and are not as readily translocated to fruit. Together with this, a lower translocation rate has been shown to affect many metabolic pathways and negatively impact sugar movement and allocation (Bernardini et al., 2022a).
Reduced photosynthetic activity and a different metabolic pathway could be the main reasons for the quality losses observed after CLas infection (Dagulo et al., 2010). The second effect of the reduced translocation could be the yield loss: the observation of sucrose and callose accumulation and the phloem plugging and collapse in HLB-affected trees (Etxeberria et al., 2009; Kim et al., 2009; Deng et al., 2019) have given the hypothesis that HLB increases the tendency of fruit to abscise and drop. However, Tang and Vashisth (2020), provided evidence that carbohydrate shortage is not the predominant cause of HLB-associated mature fruit drop. How the disease exacerbates fruit abscission still awaits determination. Nonetheless, fruit size reduction has been well documented as a HLB symptom. Fruit size is well known to be regulated by carbohydrate and water availability in stage 1 and 2 of fruit development (Goldschmidt, 1999).
5.2 Worsening the symptoms
The role of the callose in isolating damaged tissues is well-established (German et al., 2023). The citrus plant responds to CLas colonization with the deposition of callose at the sieve plates to limit the movement of the pathogen (Granato et al., 2019; Bernardini et al, 2022b). This response has been shown to exacerbate the HLB symptoms such as corky veins and yellowing (Folimonova and Achor, 2010). Knowing if callose is the only one factor responsible for the symptom appearance is controversial: the root system undergoes severe damage in the architecture after CLas infection and this scenario may impact the symptoms as well (Johnson et al., 2014). Thus, the symptom appearance is more likely related to a sum of the two factors: damaged root system and huge callose accumulation. In any case, having a measure of the callose could be a good objective indicator of the symptom severity.
Data availability statement
The raw data supporting the conclusions of this article will be made available by the authors, without undue reservation.
Author contributions
CB: Data curation, Formal analysis, Investigation, Methodology, Validation, Writing – original draft. AF: Data curation, Formal analysis, Investigation, Methodology, Validation, Writing – original draft. RR: Formal analysis, Investigation, Methodology, Validation, Writing – review & editing. TL: Investigation, Writing – review & editing. FG: Supervision, Writing – review & editing. AL: Funding acquisition, Project administration, Supervision, Writing – review & editing, Conceptualization. TV: Conceptualization, Funding acquisition, Project administration, Supervision, Writing – review & editing.
Funding
The author(s) declare financial support was received for the research, authorship, and/or publication of this article. This research was funded by the National Institute of Food and Agriculture, grant number 2020-70029-33197 to AL and TV.
Conflict of interest
The authors declare that the research was conducted in the absence of any commercial or financial relationships that could be construed as a potential conflict of interest.
Publisher’s note
All claims expressed in this article are solely those of the authors and do not necessarily represent those of their affiliated organizations, or those of the publisher, the editors and the reviewers. Any product that may be evaluated in this article, or claim that may be made by its manufacturer, is not guaranteed or endorsed by the publisher.
References
Achor D., Etxeberria E., Wang N., Folimonova S., Chung K., Albrigo L. (2010). Sequence of anatomical symptom observations in citrus affected with huanglongbing disease. Plant Pathol. J. 9, 56–64. doi: 10.3923/ppj.2010.56.64
Achor D., Welker S., Ben-Mahmoud S., Wang C., Folimonova S. Y., Dutt M., et al. (2020). Dynamics of Candidatus liberibacter asiaticus movement and sieve-pore plugging in citrus sink cells. Plant Physiol. 182, 882–891. doi: 10.1104/pp.19.01391
Albrecht U., Bowman K. D. (2012). Transcriptional response of susceptible and tolerant citrus to infection with Candidatus Liberibacter asiaticus. Plant Sci. 185–186, 118–130. doi: 10.1016/j.plantsci.2011.09.008
Bernardini C., Pagliari L., De Rosa V., Almeida-Trapp M., Santi S., Martini M., et al. (2020). Pre-symptomatic modified phytohormone profile is associated with lower phytoplasma titres in an Arabidopsis seor1ko line. Sci. Rep. 10, 14770. doi: 10.1038/s41598-020-71660-0
Bernardini C., Santi S., Mian G., Levy A., Buoso S., Suh J. H., et al. (2022a). Increased susceptibility to Chrysanthemum Yellows phytoplasma infection in Atcals7ko plants is accompanied by enhanced expression of carbohydrate transporters. Planta 256, 43. doi: 10.1007/s00425-022-03954-8
Bernardini C., Turner D., Wang C., Welker S., Achor D., Artiga Y. A., et al. (2022b). Candidatus Liberibacter asiaticus accumulation in the phloem inhibits callose and reactive oxygen species. Plant Physiol. 190(2), 1090–1094. doi: 10.1093/plphys/kiac346
Chen X.-Y., Kim J.-Y. (2009). Callose synthesis in higher plants. Plant Signaling Behav. 4, 489–492. doi: 10.4161/psb.4.6.8359
Dagulo L., Danyluk M. D., Spann T. M., Valim M. F., Goodrich-Schneider R., Sims C., et al. (2010). Chemical characterization of orange juice from trees infected with citrus greening (Huanglongbing). J. Food Sci. 75, C199–C207. doi: 10.1111/j.1750-3841.2009.01495.x
Dalio R. J. D., Magalhães D. M., Rodrigues C. M., Arena G. D., Oliveira T. S., Souza-Neto R. R., et al. (2017). PAMPs, PRRs, effectors and R-genes associated with citrus–pathogen interactions. Ann. Bot. 119(5), 749–774. doi: 10.1093/aob/mcw238
Deng H., Achor D., Exteberria E., Yu Q., Du D., Stanton D., et al. (2019). Phloem regeneration is a mechanism for huanglongbing-tolerance of “Bearss” Lemon and “LB8-9” Sugar Belle® Mandarin. Front. Plant Sci. 10. doi: 10.3389/fpls.2019.00277
Docema M. L., Moraes T., de S., Attílio L. B., Marques J. P. R., Stipp L. C. L., et al. (2023). Transgenic ‘Hamlin’ sweet orange expressing csd1 or d4e1 genes exhibits decreased susceptibility to citrus canker disease. Plant Cell Tiss Organ Cult 152, 471–489. doi: 10.1007/s11240-022-02420-3
Ellinger D., Voigt C. A. (2014). Callose biosynthesis in arabidopsis with a focus on pathogen response: what we have learned within the last decade. Ann. Bot. 114, 1349–1358. doi: 10.1093/aob/mcu120
Etxeberria E., Gonzalez P., Achor D., Albrigo G. (2009). Anatomical distribution of abnormally high levels of starch in HLB-affected Valencia orange trees. Physiol. Mol. Plant Pathol. 74, 76–83. doi: 10.1016/j.pmpp.2009.09.004
Falter C., Zwikowics C., Eggert D., Blümke A., Naumann M., Wolff K., et al. (2015). Glucanocellulosic ethanol: the undiscovered biofuel potential in energy crops and marine biomass. Sci. Rep. 5, 13722. doi: 10.1038/srep13722
Folimonova S. Y., Achor D. S. (2010). Early events of citrus greening (Huanglongbing) disease development at the ultrastructural level. Phytopathology® 100, 949–958. doi: 10.1094/PHYTO-100-9-0949
Gaikwad P. N., Sharma V., Singh J., Sidhu G. S., Singh H., Omar A. A. (2023). Biotechnological advancements in Phytophthora disease diagnosis, interaction and management in citrus. Scientia Hortic. 310, 111739. doi: 10.1016/j.scienta.2022.111739
German L., Yeshvekar R., Benitez-Alfonso Y. (2023). Callose metabolism and the regulation of cell walls and plasmodesmata during plant mutualistic and pathogenic interactions. Plant Cell Environ. 46, 391–404. doi: 10.1111/pce.14510
Goldschmidt E. E. (1999). Carbohydrate supply as a critical factor for citrus fruit development and productivity. HortScience 34, 1020. doi: 10.21273/HORTSCI.34.6.1020
Granato L. M., Galdeano D. M., D’Alessandre N. D. R., Breton M. C., MaChado M. A. (2019). Callose synthase family genes plays an important role in the Citrus defense response to Candidatus Liberibacter asiaticus. Eur. J. Plant Pathol. 155, 25–38. doi: 10.1007/s10658-019-01747-6
Hall D. G., Richardson M. L., Ammar E. D., Halbert S. E. (2013). Asian citrus psyllid, Diaphorina citri, vector of citrus huanglongbing disease. Entomologia Experimentalis Applicata 146, 207–223. doi: 10.1111/eea.12025
Hildebrandt E. (1987). Untersuchungen zur Callosebildung während der Läsionsentwicklung bei der Tabaksorte N. tabacum var. Samsun NN nach der Infektion mit Tabakmosaikvirus. PhD Thesis. Verlag nicht ermittelbar.
Hirano Y., Brunner I. (2006). Quantitative determination of callose in tree roots. J. Plant Physiol. 163, 1333–1336. doi: 10.1016/j.jplph.2005.10.005
Hirano Y., Pannatier E. G., Zimmermann S., Brunner I. (2004). Induction of callose in roots of Norway spruce seedlings after short-term exposure to aluminum. Tree Physiol. 24, 1279–1283. doi: 10.1093/treephys/24.11.1279
Johnson E. G., Wu J., Bright D. B., Graham J. H. (2014). Association of ‘C andidatus L iberibacter asiaticus’ root infection, but not phloem plugging with root loss on huanglongbing‐affected trees prior to appearance of foliar symptoms. Plant pathology 63 (2), 290–298.
Kashyap A., Planas-Marquès M., Capellades M., Valls M., Coll N. S. (2021). Blocking intruders: inducible physico-chemical barriers against plant vascular wilt pathogens. J. Exp. Bot. 72, 184–198. doi: 10.1093/jxb/eraa444
Kauss H. (1996). Callose synthesis. Membranes: specialized functions in plants. Eds. Smallwood M., Knox J. P., Bowles D. J.. Oxford, UK: BIOS Scientific Publishers.
Kauss H., Jeblick W., Domard A. (1989). The degrees of polymerization and N-acetylation of chitosan determine its ability to elicit callose formation in suspension cells and protoplasts of Catharanthus roseus. Planta 178, 385–392. doi: 10.1007/BF00391866
Kessler G. (1958). Zur charakterisierung der siebröhrenkallose. Zurich, Switzerland: PhD thesis, ETH.
Kim J.-S., Sagaram U. S., Burns J. K., Li J.-L., Wang N. (2009). Response of sweet orange (Citrus sinensis) to ‘Candidatus Liberibacter asiaticus’ infection: microscopy and microarray analyses. Phytopathology 99(1), 50–57. doi: 10.1094/PHYTO-99-1-0050
Koh E.-J., Zhou L., Williams D. S., Park J., Ding N., Duan Y.-P., et al. (2012). Callose deposition in the phloem plasmodesmata and inhibition of phloem transport in citrus leaves infected with “Candidatus Liberibacter asiaticus.” Protoplasma 249, 687–697. doi: 10.1007/s00709-011-0312-3
Köhle H., Jeblick W., Poten F., Blaschek W., Kauss H. (1985). Chitosan-elicited callose synthesis in soybean cells as a Ca 2+ -dependent process. Plant Physiol. 77, 544–551. doi: 10.1104/pp.77.3.544
Kohler A., Schwindling S., Conrath U. (2000). Extraction and quantitative determination of callose from Arabidopsis leaves. BioTechniques 28, 1084–1086. doi: 10.2144/00286bm06
Li W., Hartung J. S., Levy L. (2006). Quantitative real-time PCR for detection and identification of Candidatus Liberibacter species associated with citrus huanglongbing. J. Microbiological Methods 66, 104–115. doi: 10.1016/j.mimet.2005.10.018
Maor R., Shirasu K. (2005). The arms race continues: battle strategies between plants and fungal pathogens. Curr. Opin. Microbiol. 8, 399–404. doi: 10.1016/j.mib.2005.06.008
Mullendore D. L., Windt C. W., Van As H., Knoblauch M. (2010). Sieve tube geometry in relation to phloem flow. Plant Cell 22, 579–593. doi: 10.1105/tpc.109.070094
Pagliari L., Buoso S., Santi S., Furch A. C. U., Martini M., Degola F., et al. (2017). Filamentous sieve element proteins are able to limit phloem mass flow, but not phytoplasma spread. J. Exp. Bot. 68, 3673–3688. doi: 10.1093/jxb/erx199
Rapicavoli J. N., Blanco-Ulate B., Muszyński A., Figueroa-Balderas R., Morales-Cruz A., Azadi P., et al. (2018). Lipopolysaccharide O-antigen delays plant innate immune recognition of Xylella fastidiosa. Nat. Commun. 9, 390. doi: 10.1038/s41467-018-02861-5
Tang L., Vashisth T. (2020). New insight in Huanglongbing-associated mature fruit drop in citrus and its link to oxidative stress. Scientia Hortic. 265, 109246. doi: 10.1016/j.scienta.2020.109246
Schindelin J., Arganda-Carreras I., Frise E., Kaynig V., Longair M., Pietzsch T., et al (2012). Fiji: an open-source platform for biological-image analysis. Nat Methods, 9, 676–682. doi: 10.1038/nmeth.2019
van Bel A. J. (2019). Sieve Elements: The Favourite Habitat of Phytoplasmas. In: Musetti R., Pagliari L. (eds) Phytoplasmas. Methods in Molecular Biology, (New York, NY: Humana Press). doi: 10.1007/978-1-4939-8837-2_19
Verma D. P. S., Hong Z. (2001). Plant callose synthase complexes. Plant molecular biology, 47, 693–701. doi: 10.1023/A:1013679111111
Welker S., Levy A. (2022). Comparing machine learning and binary thresholding methods for quantification of callose deposits in the citrus phloem. Plants 11, 624. doi: 10.3390/plants11050624
Welker S., Pierre M., Santiago J. P., Dutt M., Vincent C., Levy A. (2021). Phloem transport limitation in Huanglongbing-affected sweet orange is dependent on phloem-limited bacteria and callose. Tree Physiol. 42, 379–390. doi: 10.1093/treephys/tpab134
Keywords: callose, citrus greening, Candidatus Liberibacter asiaticus, grapefruit, sweet orange
Citation: Bernardini C, Franco A, Russo R, Livingston T, Gmitter FG Jr., Levy A and Vashisth T (2024) An efficient method for the extraction and the quantitative determination of callose from HLB-affected and healthy citrus. Front. Agron. 6:1307566. doi: 10.3389/fagro.2024.1307566
Received: 24 October 2023; Accepted: 08 March 2024;
Published: 03 April 2024.
Edited by:
David Ezra, Agricultural Research Organization (ARO), IsraelReviewed by:
Xiao-Ren Chen, Yangzhou University, ChinaGaetano Magnano Di San Lio, Mediterranea University of Reggio Calabria, Italy
Copyright © 2024 Bernardini, Franco, Russo, Livingston, Gmitter, Levy and Vashisth. This is an open-access article distributed under the terms of the Creative Commons Attribution License (CC BY). The use, distribution or reproduction in other forums is permitted, provided the original author(s) and the copyright owner(s) are credited and that the original publication in this journal is cited, in accordance with accepted academic practice. No use, distribution or reproduction is permitted which does not comply with these terms.
*Correspondence: Amit Levy, amitlevy@ufl.edu; Tripti Vashisth, tvashisth@ufl.edu
†These authors have contributed equally to this work