Genetic composition of green sea turtles (Chelonia mydas) at coastal feeding areas of Uruguay
 Laura Prosdocimi1,2*
  Sibelle Torres Vilaca3,4,5
  Eugenia Naro-Maciel6 Maria N. Caraccio2 Angela Formia7,8
  Gabriela M. Vélez-Rubio2,9,10
- 1Laboratorio de Ecología, Comportamiento y Mamíferos Marinos (LECyMM), Museo Argentino de Ciencias Naturales (MACN-CONICET), Buenos Aires, Argentina
- 2Karumbé, Montevideo, Uruguay
- 3Department of Evolutionary Genetics, Leibniz Institute for Zoo and Wildlife Research, Berlin, Germany
- 4Berlin Center for Genomics in Biodiversity Research, Berlin, Germany
- 5Environmental Genomics, Vale Institute of Technology, Belém, Brazil
- 6Liberal Studies, New York University, New York, NY, United States
- 7Department of Biology, University of Florence, Sesto Fiorentino, FI, Italy
- 8Sea Turtle Program, African Aquatic Conservation Fund, Chilmark MA, United States
- 9Sección de Oceanografía y Ecología Marina, Instituto de Ecología y Ciencias Ambientales, Facultad de Ciencias, Universidad de la República, Montevideo, Uruguay
- 10Departamento de Modelización Estadística de Datos e Inteligencia Artificial, Centro Universitario Regional del Este, Universidad de la República, Rocha, Uruguay
The highly migratory and marine nature of species such as green sea turtles (Chelonia mydas) may hinder understanding of basic life history and impact ensuing management and conservation applications across their full range. To elucidate the linkages between juvenile green turtles foraging in coastal waters of Uruguay in the Southwestern Atlantic Ocean to their future nesting or feeding grounds, this study investigated their genetic composition . A total of 201 tissue samples were collected from turtles that had stranded or were intentionally captured for scientific research along the Uruguayan coast (ca. 33°–35°S) during two sampling periods (2003–2005 and 2009–2014). Samples were pooled for analysis. Twelve mitochondrial control region haplotypes and ten subhaplotypes were identified, all of which had been previously detected at Atlantic or Caribbean nesting beaches. Mixed Stock Analysis revealed that most turtles traced to the Ascension Island rookery, representing a substantial connection to the remote mid-Atlantic island thousands of kilometers distant. Other nesting areas, such as Guinea Bissau in Africa and Trindade Island in Brazil, represented less significant sources. There was no significant temporal or spatial genetic structure within Uruguayan waters, suggesting dispersion along this coast. Despite the geographic distance from the nesting beach, the significant connection to the Ascension Island rookery underscores the importance of considering rookery population size and ocean current influences in understanding source contributions. These findings emphasize the need for conservation efforts, including the maintenance of existing protected areas and the creation of new ones, to ensure the long-term conservation of green turtles connected to various nesting colonies and feeding grounds.
Introduction
Despite an evolutionary history dating back ~100 million years (Hirayama, 1998), the seven extant marine turtle species are currently threatened at global or population levels (Seminoff et al., 2015). Of these, the primarily herbivorous green turtle, Chelonia mydas (Linnaeus, 1758), is circumglobally distributed in tropical, subtropical and temperate waters (Hirth, 1997). In this highly migratory species, mating typically takes place offshore of nesting beaches and/or during reproductive migrations (FitzSimmons et al., 1997a, FitzSimmons et al., 1997b). Green turtles exhibit remarkable natal homing behavior, or philopatry, in which most females return to nest at their birthplace (Carr, 1987). Following hatching from eggs laid on these beaches, green sea turtles disperse into the ocean (Hirth, 1997). In the subsequent pelagic or open ocean phase, post-hatchlings may drift or swim with currents, and aggregate where food is available until, years later as juveniles, they transition to often distant coastal feeding grounds containing algal or sea grass pastures (Hirth, 1997; Putman and Naro-Maciel, 2013; Mansfield et al., 2021). At these areas, which may either include a mix of juveniles, subadults, and adults or be limited to one stage, individuals from various and often distant rookeries tend to form mixed aggregations (Bass et al., 1998; Lahanas et al., 1998; Bass and Witzell, 2000; Luke et al., 2004; Bass, 2006; Bowen and Karl, 2007). The constitution of these mixed stocks sourced from different nesting areas is hypothesized to be governed by a combination of factors, including ocean currents, rookery size, and geographic distance. Juvenile natal homing, whereby smaller turtles move closer to their eventual reproductive sites as they mature, has been well documented in regional green turtles (Bowen and Karl, 2007; Naro-Maciel et al., 2007; 2012). Upon reproductive maturity at ~30–35 years of age, the life cycle begins anew with migrations to distinct breeding areas that may be thousands of kilometers away (Hirth, 1997; Wallace et al., 2010; Wallace et al., 2023).
In the Southwestern Atlantic Ocean, the distribution limit for green turtles is ~40°S along the Argentinean coastline (González-Carman et al., 2011). Small juveniles, whose size supports the hypothesis of their recent recruitment to the coast from the oceanic zone, are found throughout Uruguayan coastal waters (33-35°S) and those of neighboring countries (Figures 1, 2). Containing no large juveniles or adults, Uruguay is considered a strictly developmental foraging habitat encompassing sandy beaches and rocky coastal outcrops (López-Mendilaharsu et al., 2006; Vélez-Rubio et al., 2013, 2016). One of the most important foraging areas there in terms of green turtle numbers is the Coastal-Marine Protected Area (CMPA) of “Cerro Verde e Islas de La Coronilla” (López-Mendilaharsu et al., 2016), genetically characterized for the first time in this study.
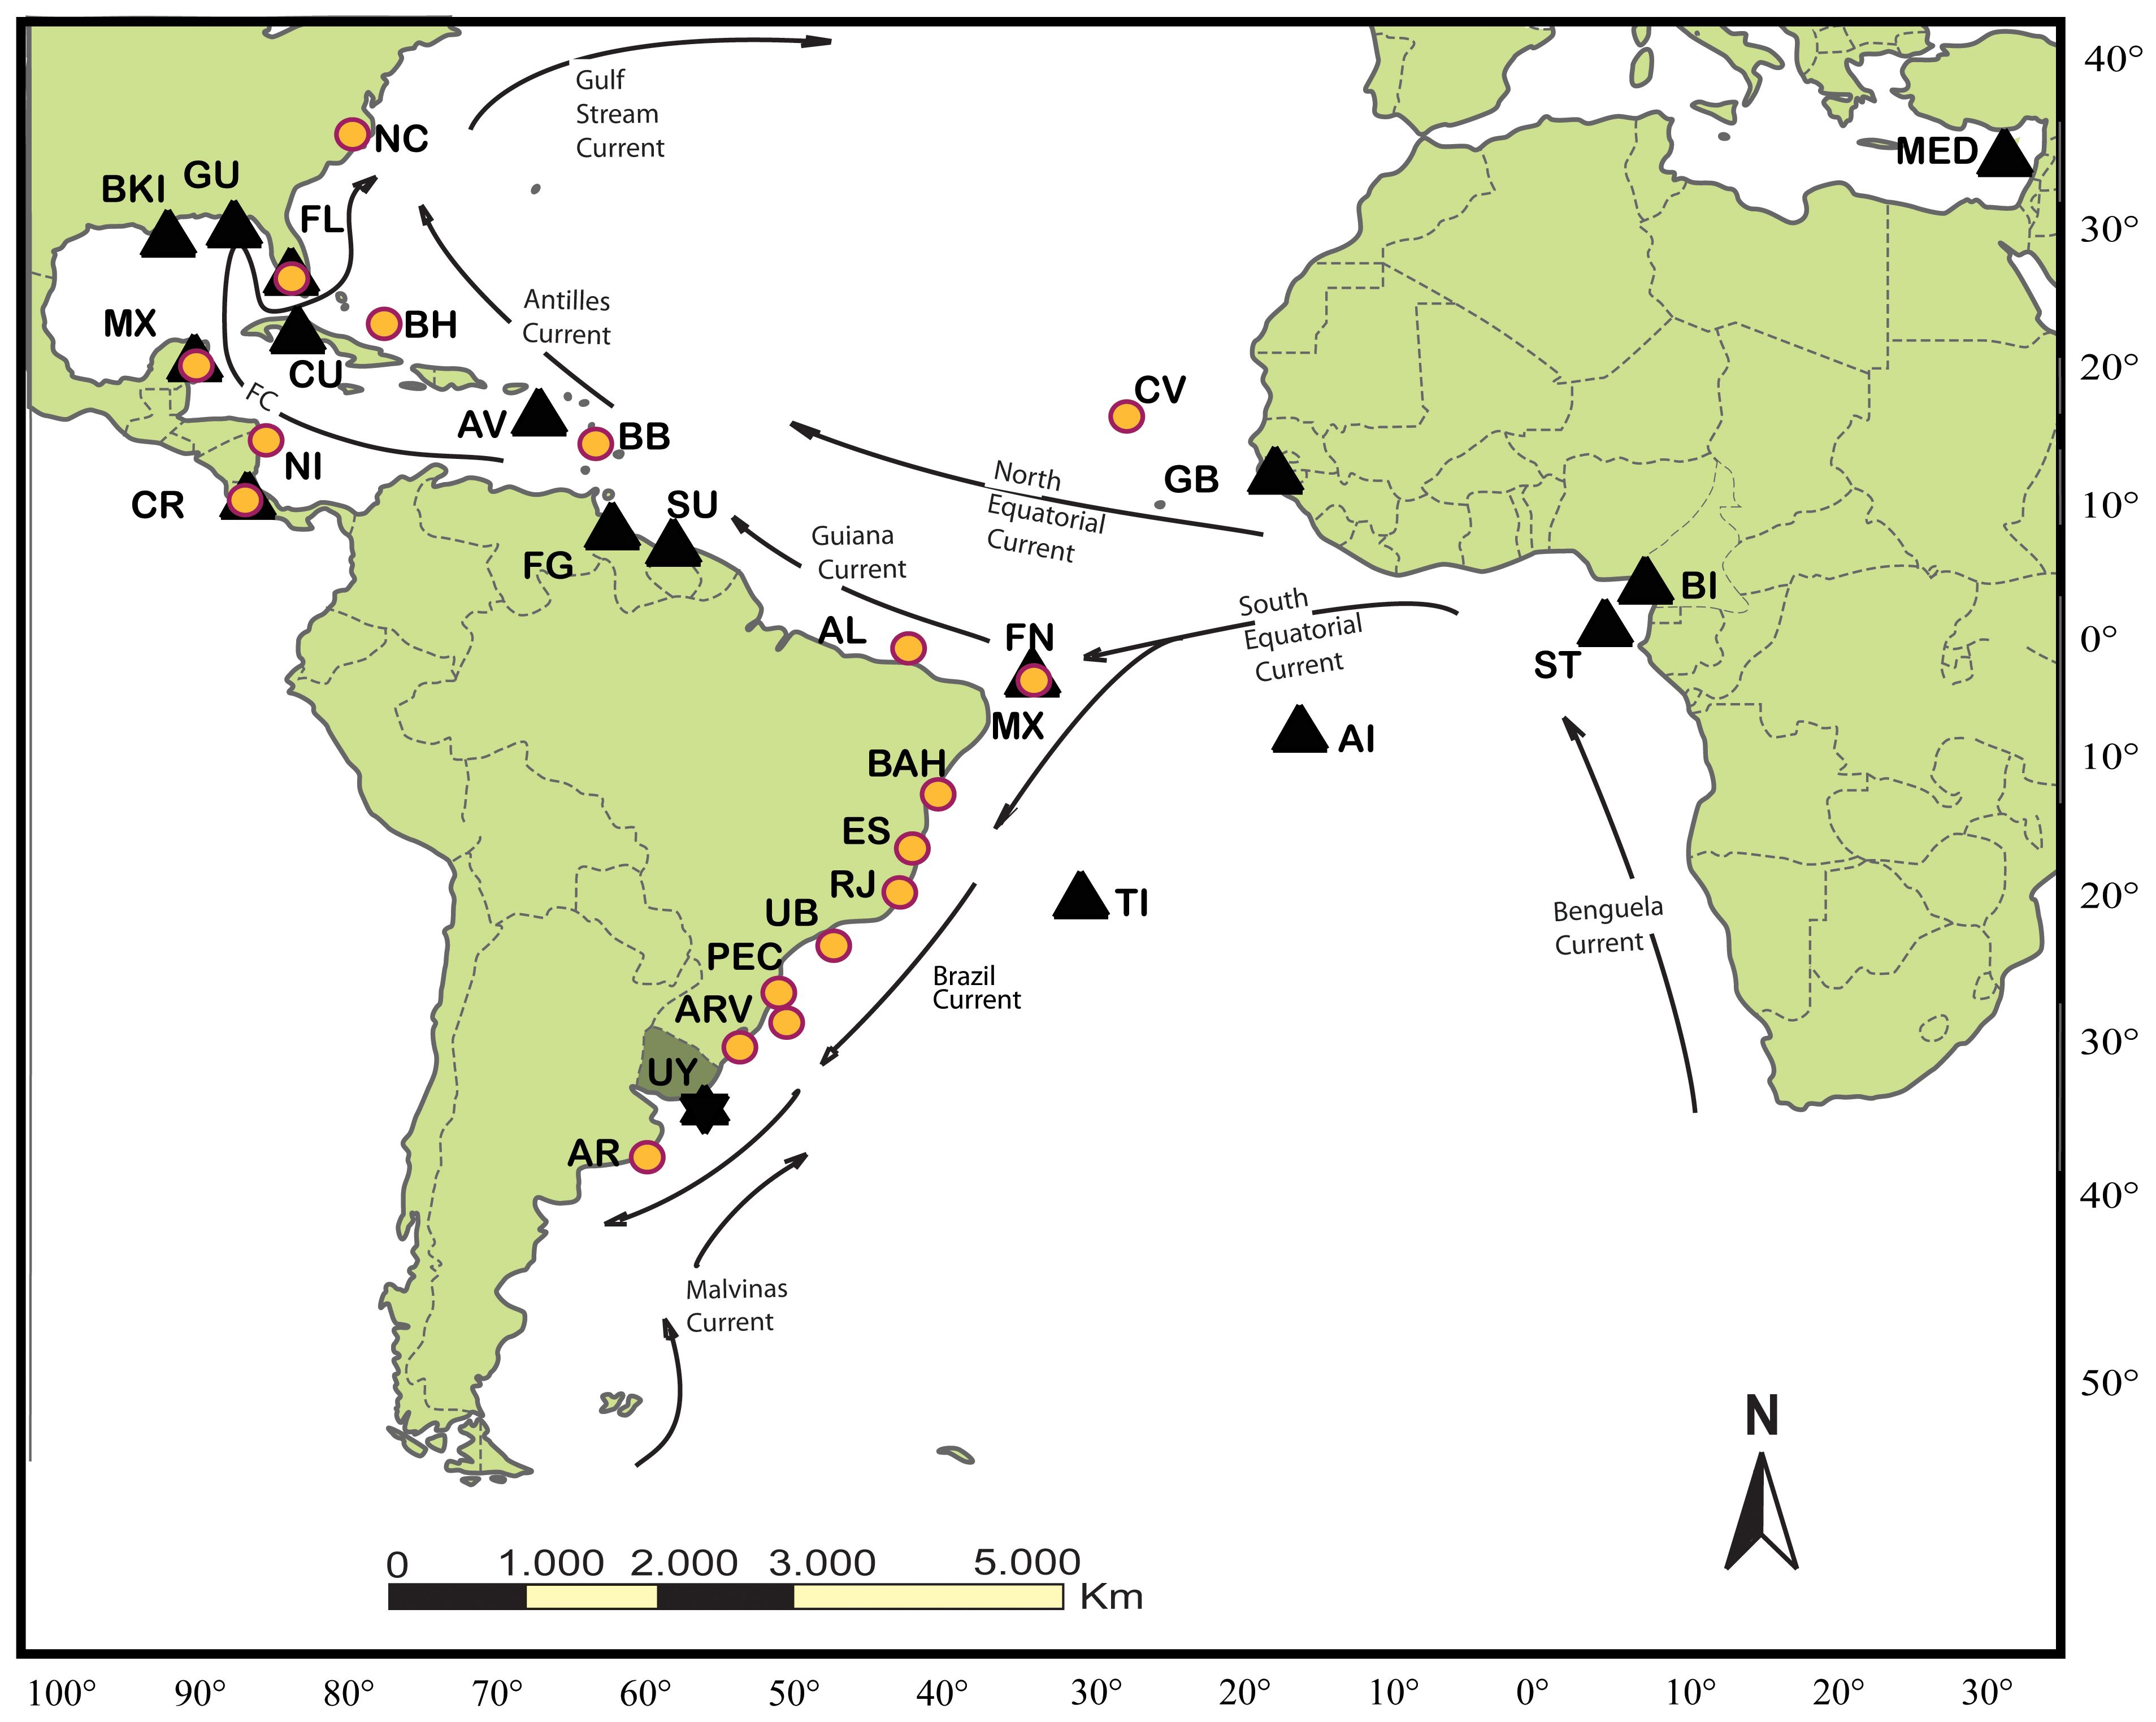
Figure 1 Atlantic green turtle nesting and feeding grounds. The study feeding ground in Uruguay (UY) is symbolized by a star. Other western Atlantic feeding grounds (indicated by circles) and nesting colonies considered possible sources of turtles feeding in Uruguay (indicated by triangles), with References, are as follows: Bahamas (BH; Lahanas et al., 1998, Bolker et al., 2007), Florida (FL; Bass and Witzell, 2000; Bagley, 2003; Foley et al., 2007; Naro‐Maciel et al., 2017), North Carolina (NC; Bass, 2006), Barbados (BB; Luke et al., 2004), Nicaragua (N; Bass et al., 1998), Cabo Verde (CV; Monzón-Argüello et al., 2010), Almofala (AL; Naro-Maciel et al., 2007), Atol das Rocas and Fernando de Noronha (FN; Bjorndal et al., 2006; Naro-Maciel et al., 2012), Bahia (BAH; Naro-Maciel et al., 2012), Rio de Janeiro (RJ; Jordão et al., 2015), Espírito Santo (ESP; Torezani et al., 2010; Naro-Maciel et al., 2012) Ubatuba (UB; Naro-Maciel et al., 2007), Paranaguá (PEC; Jordão et al., 2015; Coelho et al., 2018; Savada et al., 2021), Arvoredo (ARV; Proietti et al., 2012), Casino (CB; Proietti et al., 2012), and Argentina (AR; Prosdocimi et al., 2012). Nesting areas from Encalada et al. (1996) and others include Rocas Atoll (Bjorndal et al., 2006), Aves Island, Venezuela (AV), Matapica, Suriname (SU; Jordão et al., 2015), Quintana Roo, México (MX), Lara Bay, Cyprus (MED; Kaska, 2000), Florida (FL; Encalada et al., 1996; Bass and Witzell, 2000; Shamblin et al., 2014), Tortuguero, Costa Rica (CR; Bjorndal et al., 2005), Ascension Island, UK (AI), and Poilaõ, Guinea Bissau (GB; Formia et al., 2007). Additional rookeries shown are Bioko Island, Equatorial Guinea (BI; Formia et al., 2006), São Tomé (ST; Formia et al., 2006), Trindade Island, Brazil (TI; Bjorndal et al., 2006), Cuba (CU; Ruíz-Urquiola et al., 2010), Buck Island (BKI; Shamblin et al., 2012), French Guiana (FG; Jordão et al., 2015), and Guadeloupe (GU; Jordão et al., 2015). Eastern Atlantic and Mediterranean feeding grounds are not shown. Arrows represent major oceanic currents.
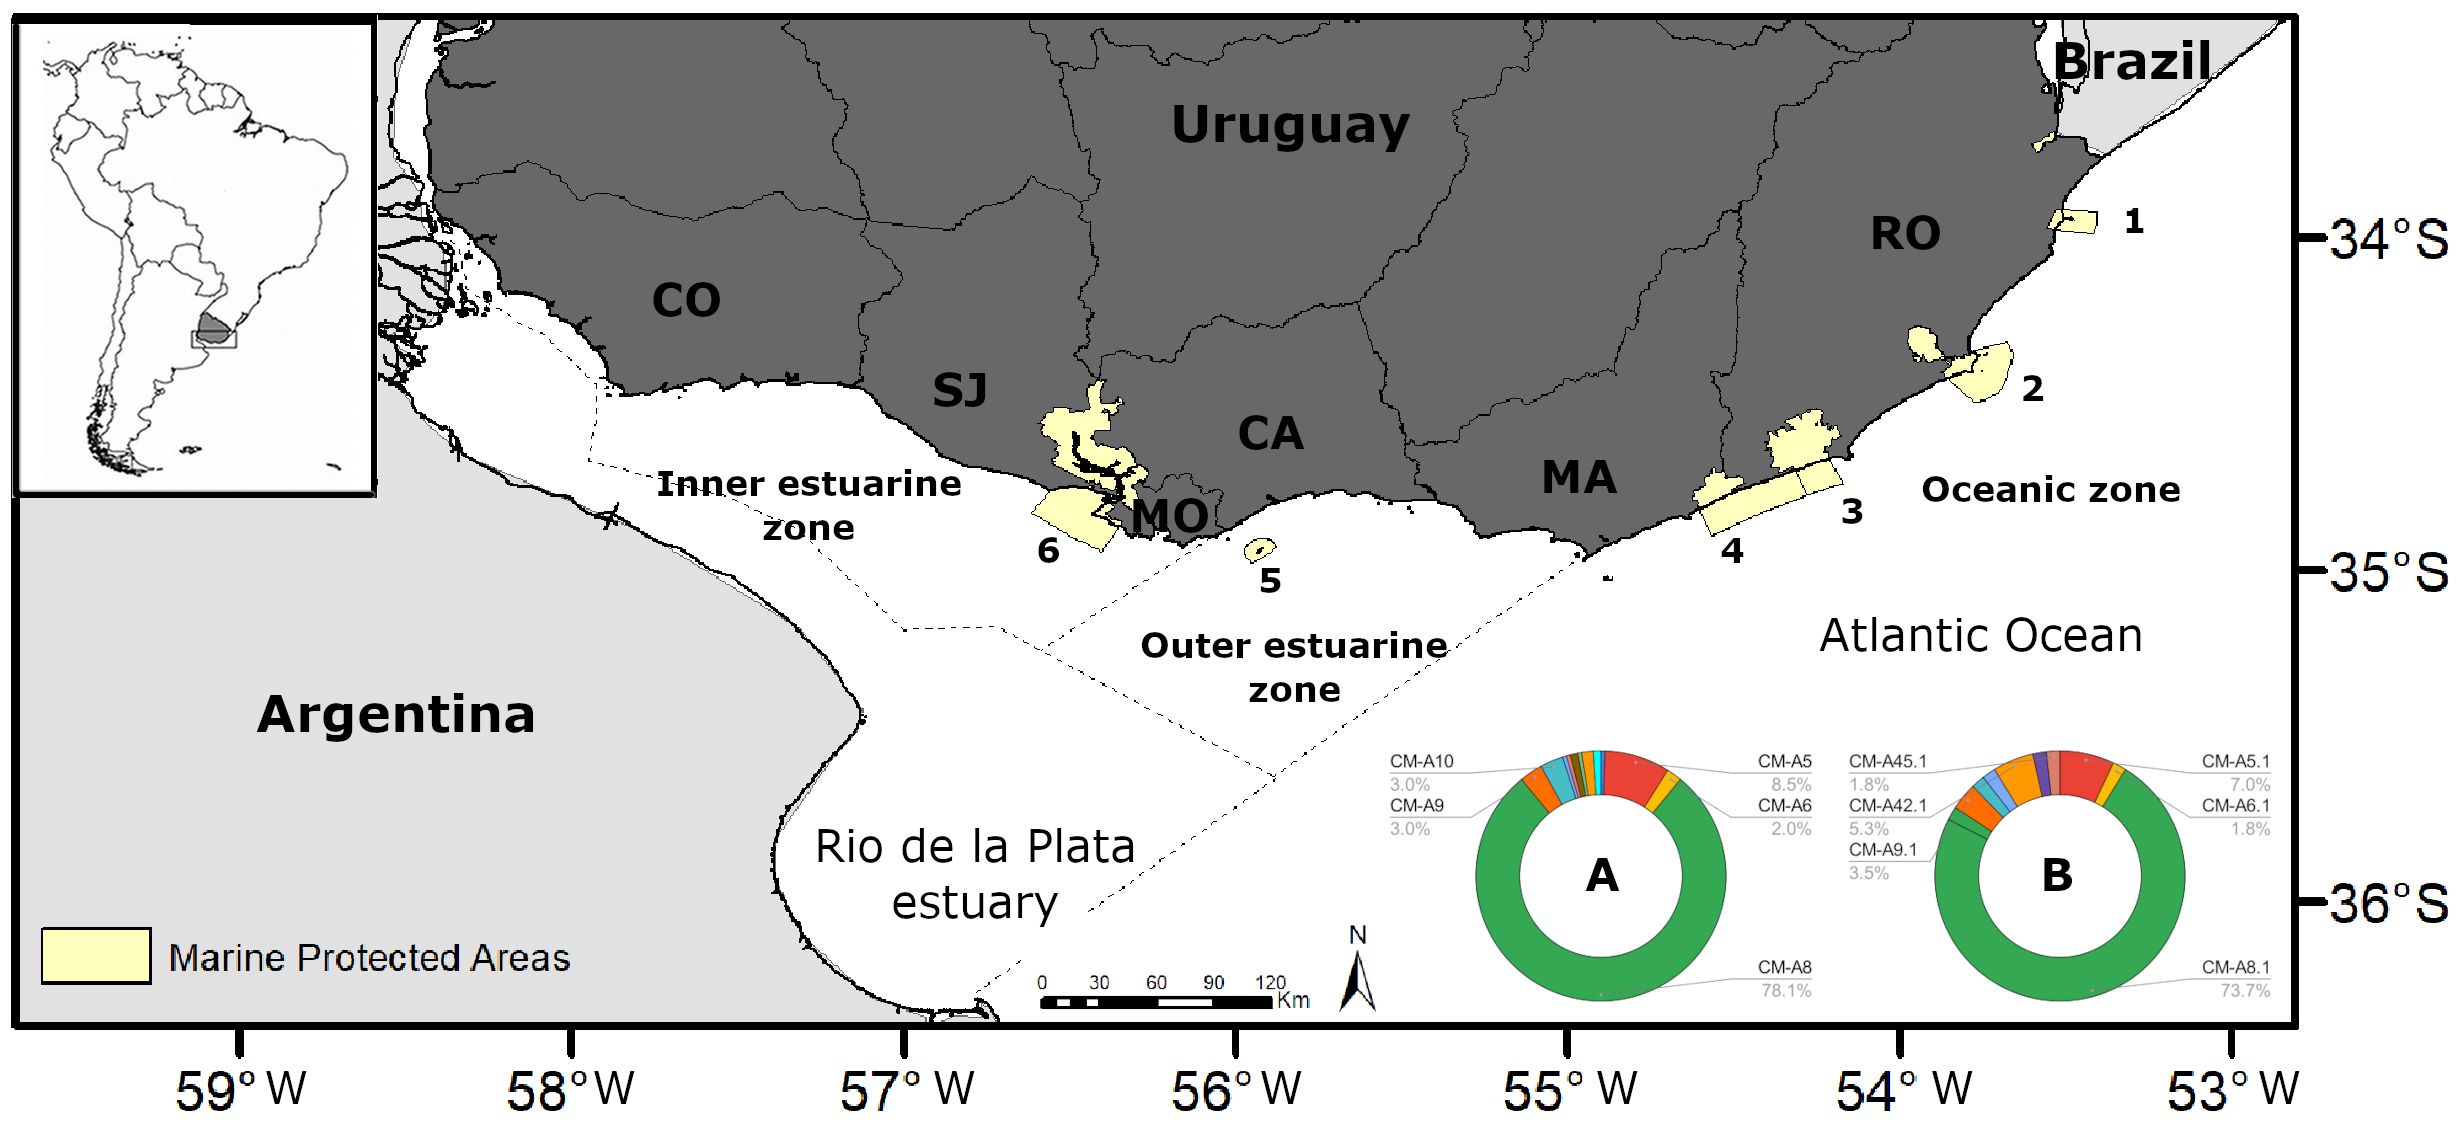
Figure 2 Detailed map of the study area, spanning the entire Uruguayan coast along the Atlantic Ocean and the Rio de la Plata estuary. The study area was divided into three zones based on hydrological characteristics: an inner estuarine zone, an outer estuarine zone and an oceanic zone. The yellow areas represent Coastal-Marine Protected Areas of Uruguay, with numbers corresponding to: [1] “Cerro Verde e Islas de La Coronilla”, [2] Cabo Polonio, [3] Laguna de Rocha, [4] Laguna Garzon, [5] Isla de Flores, [6] Humedales del Santa Lucia. Coastal Departments are as follows: Colonia (CO), San José (SJ), Montevideo (MO), Canelones (CA), Maldonado (MA), Rocha (RO). The pie charts indicate mitochondrial control region A) haplotype (~481 bp, n=201) and B) subhaplotype (~780 bp, n=57) frequencies of turtles foraging in these waters. The nomenclature of haplotypes (481 bp segments, e.g., CM-A5) and subhaplotypes (780 bp segments, e.g., CM-A5.1) follows designations standardized by the Archie Carr Center for Sea Turtle Research (ACCSTR; http://accstr.ufl.edu/genetics.html). While only the most common haplotypes are labeled, their frequencies are shown in Table 1.
Little is known about the linkages between these juveniles and their future nesting or feeding grounds, representing a significant gap in understanding of basic life history, which hinders management and conservation efforts across the population’s full range. Genetic analysis, satellite tracking, and mark-recapture studies represent the main complementary methods for illuminating population connectivity in highly migratory species like green turtles. However, satellite tracking has not been used to elucidate the natal origins of these small juveniles as they are decades too young to depart on trackable breeding migrations (Hirth, 1997; López-Mendilaharsu et al., 2006; Vélez-Rubio et al., 2013, 2016). Mark-recapture using traditional uniquely- numbered tags can reveal migratory movements, although the vast majority of tagged turtles fails to be recaptured due to insufficient monitoring or tag loss (Limpus, 1992; Henwood, 1986; Bjorndal et al., 1996). Tag returns show recurrent seasonal migrations to and from Uruguay and neighboring southern states of Brazil and to a lesser degree Argentina, and that Uruguayan waters are used throughout the year (Gallo et al., 2006; González Carman et al., 2012; Vélez-Rubio et al., 2018a), albeit in greater numbers during the warmer months (López-Mendilaharsu et al., 2016; Buteler et al., 2022). Molecular techniques utilizing DNA sequences in rapidly mutating regions are valuable for understanding current and evolutionary patterns. The mitochondrial control region is a widely-used tool for addressing feeding ground connectivity, including of regional green turtle populations, with Ascension Island tending to be the main natal source (Naro-Maciel et al., 2007; Caraccio, 2008; Monzón-Argüello et al., 2010; Naro-Maciel et al., 2012; Proietti et al., 2012; Prosdocimi et al., 2012; Jordão et al., 2015). Natal homing leads to genetic differentiation among rookeries, which in turn enables tracing of foraging ground natal origins (Bowen and Karl, 2007) through Mixed Stock Analysis (MSA, Chapman, 1996). The connectivity of feeding grounds to each other and their genetic diversity patterns can be assessed, providing insights on gene flow and priority areas for conservation.
Green turtles are categorized as Globally Endangered in the Red List of the International Union for Conservation of Nature (IUCN) (Seminoff, 2023). The main current regional threats are incidental capture in fisheries and entanglement in or ingestion of marine debris, and in Uruguay turtles do not escape these threats (Domingo et al., 2006; Lezama, 2009; Laporta et al., 2012; Vélez-Rubio et al., 2013; Santos et al., 2015; Vélez-Rubio et al., 2018b). These threats can also affect current and future connected populations, underscoring the importance of determining the origins of mixed stocks, as well as their genetic diversity and linkages to other foraging grounds, to implement conservation plans integrated with the entire sea turtle life cycle. Foraging green turtle connectivity and structure as revealed by mtDNA have thus been investigated in the Southwestern Atlantic Ocean (Naro-Maciel et al., 2007; Caraccio, 2008; Monzón-Argüello et al., 2010; Naro-Maciel et al., 2012; Proietti et al., 2012; Prosdocimi et al., 2012), albeit with the significant exception of Uruguay. The objective of this work was therefore to characterize genetic diversity and connectivity of juvenile green turtles foraging in Uruguayan coastal waters. Specifically, the study investigated: 1) the genetic makeup of the mitochondrial control region; 2) spatial and temporal genetic structuring within Uruguay; and 3) connections to other feeding and nesting areas.
Materials and methods
Study area
The 710-kilometer-long Uruguayan coast is part of a complex hydrological system comprising the frontal zone of the Río de la Plata estuary and the Atlantic Ocean (Figure 2). The Malvinas/Falkland current prevails during the austral winter and the Brazilian current dominates during the austral summer (Figure 1) (Garcia, 1998; Ortega and Martínez, 2007). This causes variations of >15°C in sea surface temperature (range 10–27°C) throughout the year (Acha et al., 2004). The study area also includes the coastal waters between Colonia (34° 28’ S, 57° 49’ O) and “Barra del Chuy” in the Department of Rocha (33° 44’ S, 53° 22’ W). The site comprises six coastal marine protected areas (Humedales de Santa Lucia, Isla de Flores, Laguna Garzón, Laguna de Rocha, Cabo Polonio, and Cerro Verde e Islas de La Coronilla (Figure 2), all of which are important marine turtle feeding grounds. Cerro Verde is one of the most significant in terms of green turtle numbers (López-Mendilaharsu et al., 2016). The coastline is characterized by a succession of sandy beaches separated by rocky outcrops rich in macroalgae, a prominent part of the green turtle diet, and mussels (Borthagaray and Carranza, 2007; Scarabino et al., 2015; Vélez-Rubio et al., 2021).
The study area, based on differences in hydrological characteristics, was divided into three zones: 1) an inner estuarine zone (IEZ, ca. 350 km) from Nueva Palmira to Montevideo, characterized by a fluvial-marine salinity regime (salinity <12 psu) influenced mainly by the Rio de la Plata discharge; 2) an outer estuarine zone (OEZ, ca. 130 km) from Montevideo to Punta del Este, representing a transition between oceanic and estuarine characteristics with an intermediate salinity range (13–25 psu); and 3) an oceanic zone (OZ, ca. 230 km) from Punta del Este to Barra del Chuy (salinity >26 psu) (Figure 2).
Sample collection
Turtle tissue was sampled according to permitting requirements by professionally trained technicians of the Karumbé Non-Government Organization using two methodologies, recovery of stranded turtles and scientific captures. In total, 201 green turtle tissue samples were collected in two sampling periods: 2003–2005 and 2009-2014. Muscle and epidermis samples were preserved in 70% ethanol, using standard protocols following Dutton (1996). All sampled turtles were juveniles well under the minimum size of nesting females from the closest nesting colonies (Curved Carapace Length=90 cm in Ascension Island; Weber et al., 2014). Following standard methods (Dutton, 1996), green turtles were caught alive over rocky bottoms in shallow waters. Set nets (nylon monofilament, 50 m length × 3 m depth, 30 cm stretched mesh size) were deployed perpendicular to wave direction and monitored constantly to ensure turtle well-being. A standard epidermal biopsy was collected, and Curved Carapace Length (CCL, notch to tip) was measured for each turtle using flexible tape (± 0.1 cm). All turtles were tagged with inconel flipper tags (Style # 681, National Band and Tag, Kentucky, USA) before release at the capture site (López-Mendilaharsu et al., 2016; Vélez-Rubio et al., 2018b). Alternately, stranded turtles were registered by the Uruguayan Sea Turtle Stranding Network and muscle tissue was sampled from fresh carcasses by Karumbé members (Vélez-Rubio et al., 2013).
Laboratory procedures
DNA extractions were conducted following protocols outlined by Allen et al. (1998) with modifications. Two sets of PCR reactions were performed using overlapping primers. For samples collected between 2003 and 2005, primers LTCM2 and HDCM2 (Lahanas et al., 1994) were used to amplify and sequence ~481 bp of the mtDNA control region using standard conditions and negative controls. These are referred to here as shorter segments or haplotypes. For samples collected between 2009 and 2014, to expand coverage, a ~780 bp mtDNA control region fragment containing the original ~481 bp segment was amplified using the primers LCM15382 and H950 (Abreu-Grobois et al., 2006), referred to here as longer segments or subhaplotypes. The polymerase chain reaction (PCR) cocktail consisted of ~90 ng of DNA, 1X Phusion HF Buffer, 400 mM of dNTPs, 0.5 uM of each primer, and 0.5 U of Phusion High Fidelity DNA polymerase (New England Biolabs) in a total volume of 40 µL. The amplification cycle followed Vilaça et al. (2013). PCR products were sequenced using a 3730 xl DNA analyzer (Applied Biosystems) by the Macrogen sequencing service (Macrogen Europe, Netherlands). All samples were sequenced in both directions.
Genetic diversity and differentiation
Sequences were edited and aligned using Bioedit V 7.0 (Hall, 1999). Mitochondrial haplotypes were classified according to the widely-utilized standardized designation provided by the Marine Turtle Sequences website, maintained by the Archie Carr Center for Sea Turtle Research at the University of Florida (ACCSTR; http://accstr.ufl.edu/genetics.html). In this system, a standardized haplotype designation, such as CM-A8, is used for the shorter ~481 bp segments, with CM standing for Chelonia mydas, A for Atlantic, and 8 for a unique identifier of that haplotype. The subhaplotype designation for the longer ~780 bp fragment, which overlaps with and extends the shorter ~481 section, addresses any additional variation beyond the overlapping part with a decimal point followed by a unique number, such as CM-A8.1 or CM-A8.2.
Variability among the three sampling areas within Uruguay (inner estuarine zone (IEZ), outer estuarine zone (OEZ) and oceanic zone (OZ), Figure 2), as well as between years and sampling periods, was evaluated. The statistical analysis was done with RStudio 2023.06.0 + 421 (RStudio Team, 2020). As no significant differences were found (see Results for details), these data were pooled into one single Uruguay sample for subsequent analyses. The sequence data were also included in a broader analysis of western Atlantic feeding grounds studied to date (Savada et al., 2021).
Haplotype (h) and nucleotide diversity (π) (Nei, 1987) were calculated using Arlequín (version 3.5; Excoffier and Lischer, 2010). The haplotype network was executed in PopART 1.7 (Leigh and Bryant, 2015). Analysis of molecular variance (AMOVA) and pairwise comparisons with ΦST (using Kimura 2P genetic distances; Kimura, 1980) were carried out using the ARLEQUIN v3.5 program (Excoffier and Lischer, 2010) to investigate genetic structuring within and among feeding grounds. The AMOVA considered three groups: North Atlantic rookeries, South Atlantic rookeries, and Uruguay. Genetic differentiation between all western Atlantic feeding grounds was further investigated using pairwise comparisons. Statistical significance was tested using 1,000 permutations.
Natal origins of turtles foraging in Uruguay
Contributions of nesting colonies to the Uruguayan feeding grounds (UY) were assessed through Mixed Stock Analysis (MSA) using Bayesian methods implemented in the program BAYES (Pella and Masuda, 2001). The 16 previously described Atlantic or Mediterranean nesting colonies were explored as sources in the MSA (Figure 1; Supplementary Table S1; Savada et al., 2021). The BAYES program integrates information from the observed data (nesting colonies and feeding grounds) and is not biased by small sample size or rare haplotypes (Pella and Masuda, 2001). Three MSAs were performed as follows: 1) with equal prior probability assigned to each rookery, 2) considering contribution weighted by nesting population size, and 3) taking into account distance from the nesting ground. The straight-line distance estimates are conservative, as sea turtles do not move in straight lines. Size estimates of the nesting populations were taken from: Bellini (1996), Bellini et al. (1996), Seminoff et al. (2002, 2015), and Formia et al. (2006). The analyses were carried out using about 7,500 iterations until Gelman and Rubin diagnostics confirmed convergence of the chains to the desired posterior density, with most shrink factors near 1.0 and below 1.2. The first halves of the chains were discarded as “burn-in” and estimates were based on the second halves only as recommended (Pella and Masuda, 2001).
Results
Genetic diversity
A ~481-bp-long fragment was successfully amplified in 201 samples collected from 2003–2005 (n=144) and 2009–2014 (n=57) (Table 1). In total 12 haplotypes (GenBank: PP378115–PP378126), defined by 14 variable sites and a 4 bp insertion/deletion, or indel, were detected (Table 1; Figure 3A). The most frequent haplotype was CM-A8, occurring in 78% of Uruguay samples (n=157; Figures 2, 3A). CM-A5, the second-most common sequence, was found in 9% of samples (n=17). The remaining haplotypes, including CM-A6, CM-A9, CM-A10, CM-A44, CM-A45, and CM-A33 were observed at low frequencies (≤ 5%). Haplotype CM-A33 was confirmed in one Uruguayan individual for the first time. This haplotype, although previously described (Bjorndal et al., 2006), had been reported erroneously on Trindade Island, Brazil (Shamblin et al., 2015) and withdrawn from consideration.
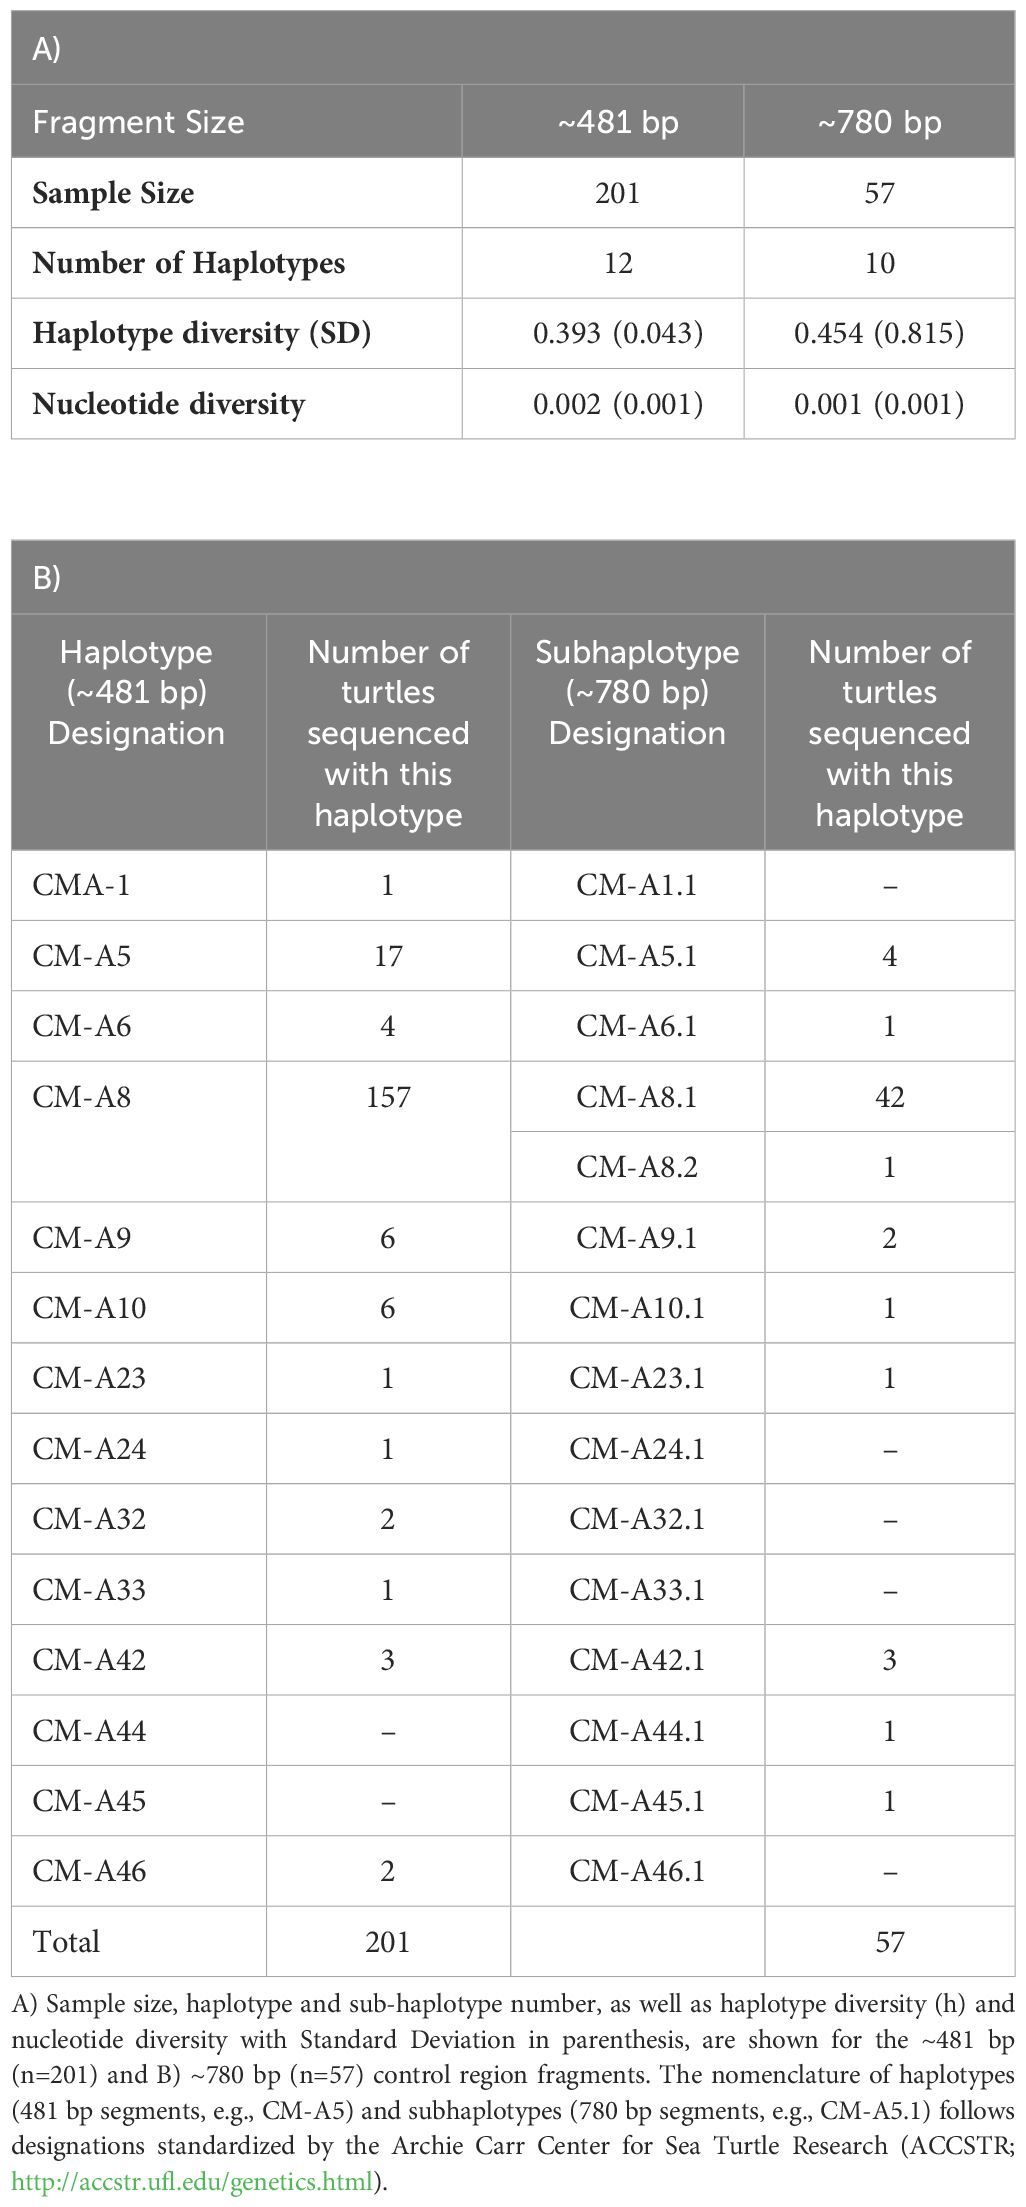
Table 1 Mitochondrial control region diversity of green turtles in Uruguayan feeding grounds.
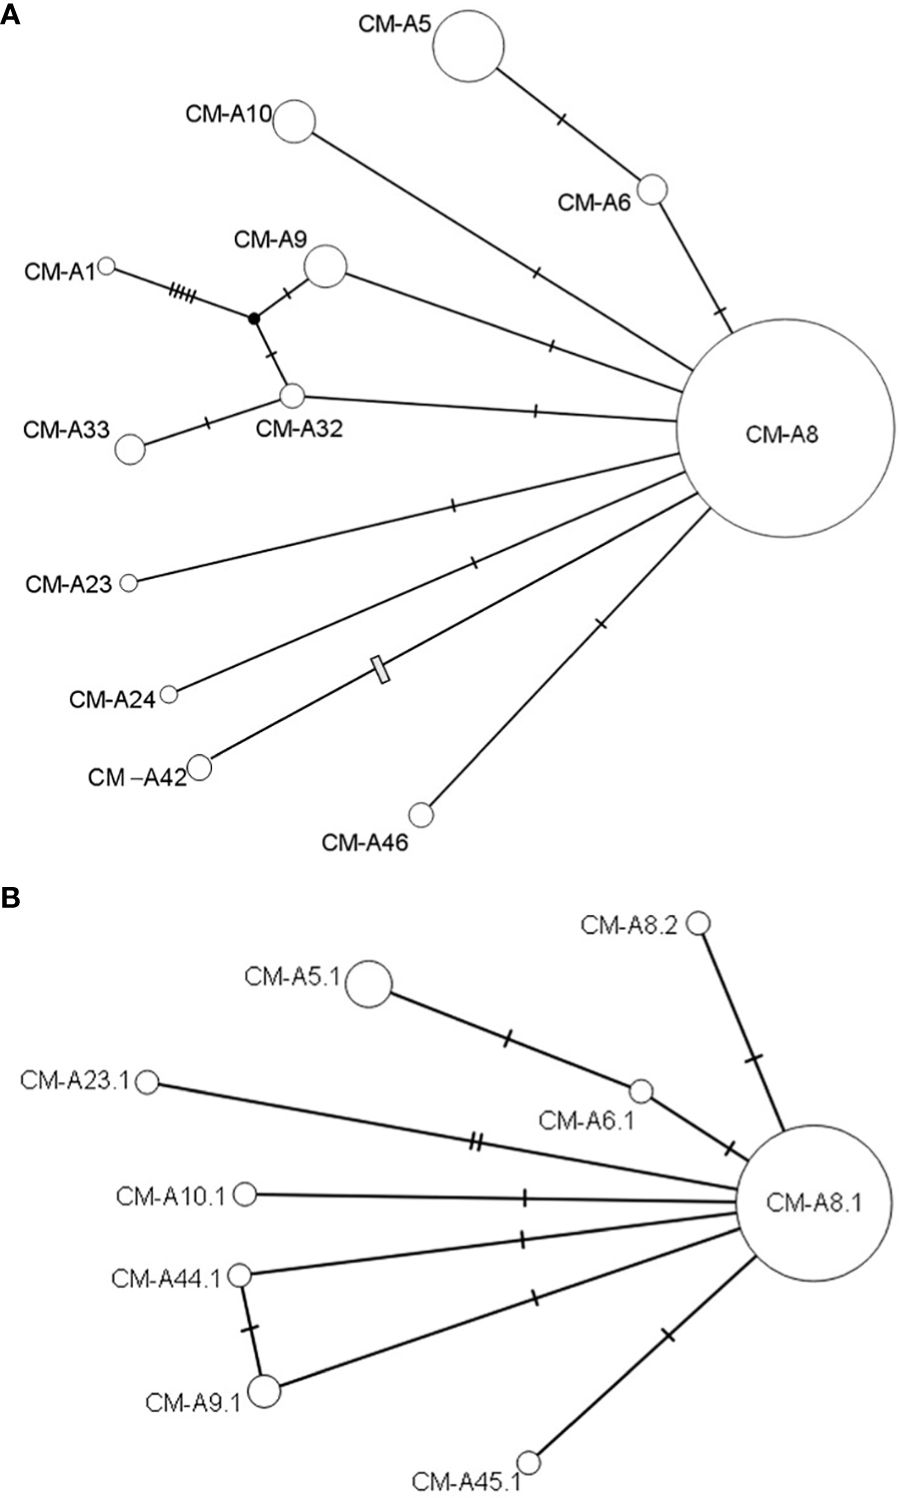
Figure 3 Haplotype and Subhaplotype Network. Genealogical relationships inferred among green turtle mtDNA haplotypes from the Uruguay feeding ground. (A) ~481 bp (n=201) and (B) ~780 bp (n=57) control region fragments. The diameter of each circle corresponds to the haplotype frequency, with solid bars indicating single nucleotide substitutions and an open bar representing a 4 bp insertion/deletion. The nomenclature of haplotypes (481 bp segments, e.g., CM-A5) and subhaplotypes (780 bp segments, e.g., CM-A5.1) follows designations standardized by the Archie Carr Center for Sea Turtle Research (ACCSTR; http://accstr.ufl.edu/genetics.html).
The longer fragment (~780 bp) obtained from the same 57 samples collected between 2009–2014 revealed additional polymorphism in the extended segments. A total of 10 subhaplotypes was found (GenBank: PP425333-PP425342), the most frequent being CM-A8.1 (74%), followed by CM-A5.1 (7%), CM-A42.1 (5%) and CM-A9.1 (4%). CM-A8.2, CM-A6.1, CM-A10.1, CM-A44.1, and CM-A45.1 were found at frequencies of 2% (Table 1, Figure 3B). The only haplotype that split into two subhaplotypes was CMA-8, divided into CMA-8.1 and CMA-8.2 (Table 1B).
As no significant differences were found when comparing haplotype frequencies between the different sampling areas in Uruguay (inner estuarine, outer estuarine, and oceanic zones; Figure 2; X2 (11, n = 201) = 13.686, p = 0.251) or among sampling years or periods there (X2 (22, n = 201) = 14.523, p = 0.002), data from various coastal locations and time periods were pooled into one single Uruguay sample.
For comparison to other areas, the shorter sequences were used, as corresponding longer sequences remain unpublished. For these 201 samples, haplotype diversity (h) was 0.392 +/− 0.043 and nucleotide diversity (π) was 0.002 +/− 0.001.
Genetic differentiation among feeding grounds
Analysis of Molecular Variance (AMOVA) based on divergence between haplotypes revealed significant overall differentiation among western Atlantic feeding grounds (ΦST = 0.730, P < 0.001). A gradient was observed, where the North Atlantic populations presented differences from the South American feeding areas. Pairwise comparisons revealed significant differentiation between Uruguay and most other western Atlantic feeding grounds, with the exception of Cassino, Paranagua and Ubatuba located relatively nearby in southern Brazil (Figure 1, Table 2).
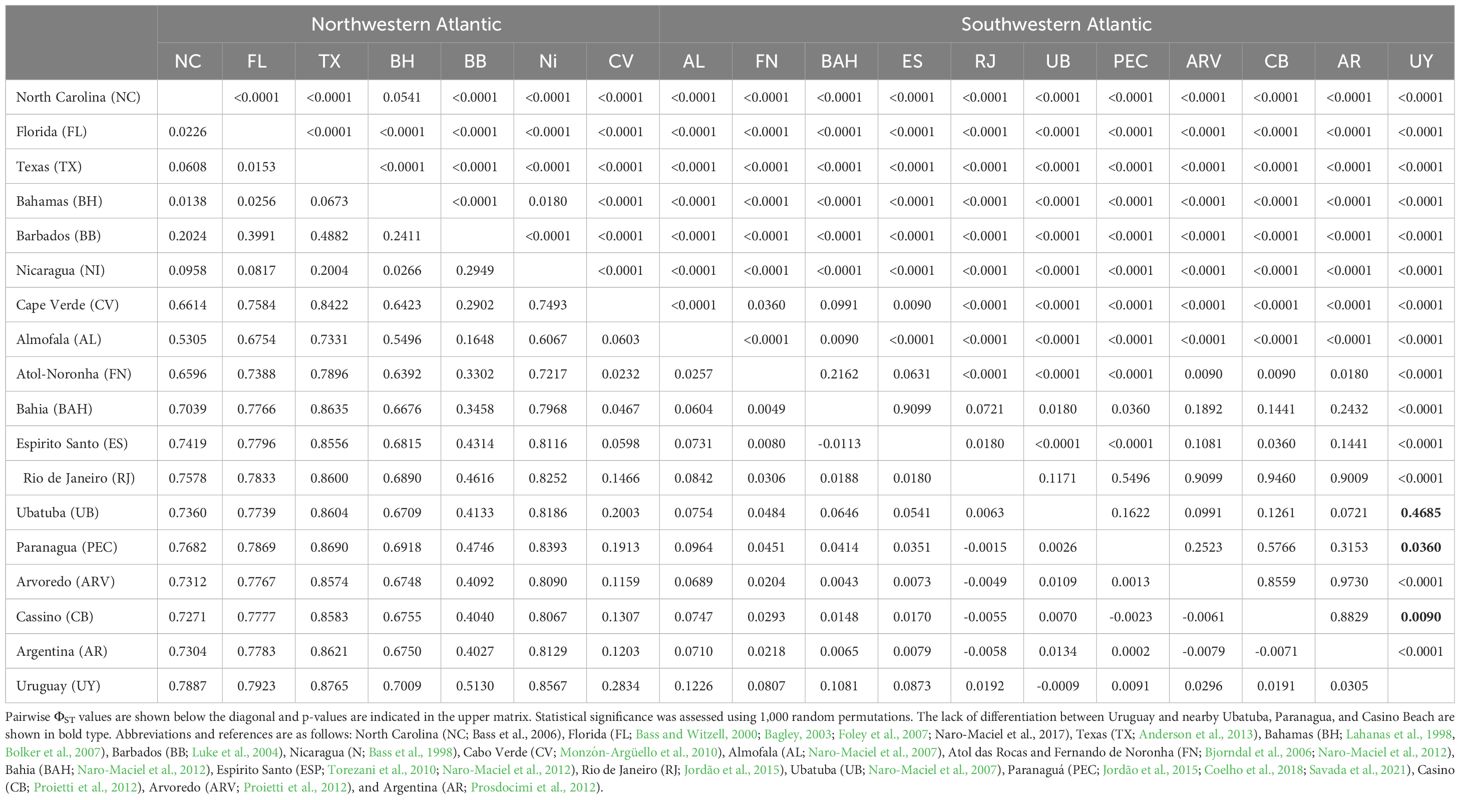
Table 2 Genetic differentiation among western Atlantic green turtle feeding grounds.
Correspondingly, mitochondrial D-loop sequences from Uruguay, such as the dominant CM-A8, had been previously reported in other foraging areas along the South American coast, and CM-A5 is common in the Caribbean (Supplementary Table S3). The rare haplotype CM-A42 detected in Uruguay had been previously reported among turtles foraging in Argentina and Brazil (GenBank: JF308481.1). Further, sub-haplotypes CM-A8.2 (GenBank: JF308473.1), CM-A42.1 (GenBank: JF308481.1), CM-A44.1 (GenBank: PP379906), and CM-A45.1 (PP429908) have been described in foraging areas in Brazil and Africa and/or African rookeries.
Natal origins of turtles foraging in Uruguay
The juvenile green turtle developmental feeding area of Uruguay was significantly differentiated from each regional nesting beach, rejecting the hypothesis of single rookery origins and qualifying the site for Mixed Stock Analysis. The three MSAs analyzed (1: with equal prior probability assigned to each colony, 2: considering the contribution weighted by the size of the nesting population, and 3: taking into account the geographic distance from the nesting site), demonstrated that Ascension Island is the main source of the Uruguay feeding grounds (43–47%), followed by Guinea Bissau (36–37%), and Trindade Island, Brazil, (6–9%), and with lesser contributions from the Guadeloupe, Suriname and French Guiana rookeries (Figure 4; Supplementary Table S4). The 95% confidence intervals were fairly broad, as previously reported in the literature. The results of the Gelman and Rubin diagnosis were between 1.0 and 1.02, indicating chain convergence.
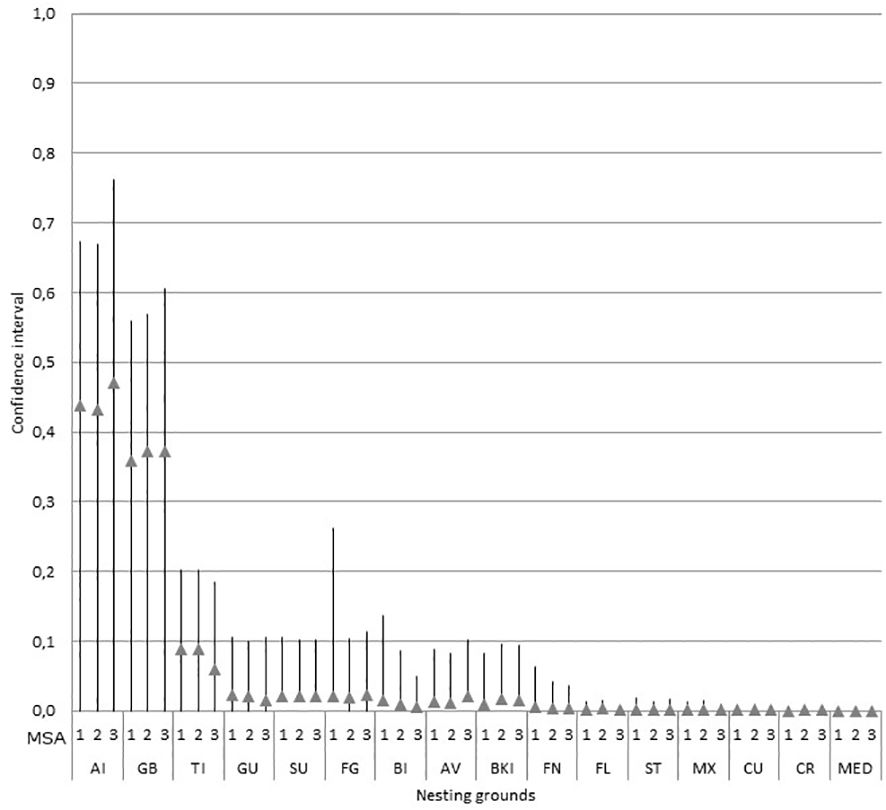
Figure 4 Mean estimated stock contributions Atlantic nesting grounds to the Uruguay foraging ground based on control region haplotypes (~481 bp). The Bayesian Mixed Stock Analysis (MSA) used equal priors (MSA1) and priors weighted to reflect nester abundance (MSA2) or geographic distance (MSA3). Mean values (triangle) are shown with standard deviation (SD), and the 2.5 and 97.5% values indicate the upper and lower bounds of the 95% probability interval. Abbreviations correspond to nesting areas as follows, with references in Figure 1: Ascension Island, UK (AI), Poilaõ, Guinea Bissau (GB), Trindade Island, Brazil (TI), Guadeloupe (GU), Matapica, Suriname (SU), French Guiana (FG), Bioko Island, Equatorial Guinea (BI), Aves Island, Venezuela (AV), Buck Island, USA (BKI), Fernando de Noronha and Atol das Rocas, Brazil (FN), Florida, USA (FL), São Tomé (ST), Quintana Roo, México (MX), Cuba (CU), Tortuguero, Costa Rica (CR), and the Mediterranean (MED).
The Mixed Stock Analysis findings were generally consistent with haplotype and subhaplotype geographic patterns. The CM-A8 haplotype (and corresponding CM-A8.1 subhaplotype) dominant in the Uruguay feeding ground is a common sequence dominant throughout the South Atlantic at varying frequencies including at African (Guinea Bissau, Sao Tome e Principe, and Bioko) and Brazilian (Trindade and Atol das Rocas/Fernando de Noronha) rookeries, as well as Ascension Island (Supplementary Table S1). Among nesting colonies, the second most common sequence, CM-A5 (and corresponding CM-A5.1 subhaplotype), has been reported most frequently in northern hemisphere rookeries of Costa Rica, Aves Island in Venezuela, and Suriname. The remaining rare haplotypes were previously detected among rookeries in Ascension Island, Brazil, and Africa, in addition to Mexico, Costa Rica, Cuba, Block Island, French Guiana, Guyana, and Suriname (Figure 1). In particular, the rare haplotype CM-A42, unique among rookeries to Guinea Bissau (Patrício et al., 2017), was revealed in Uruguay.
Discussion
This research filled an important regional gap by genetically characterizing the juvenile green turtles foraging in Uruguay, revealing connections to wide-spread nesting areas and regional feeding grounds, and emphasizing the importance of conserving this unique mixed stock. The study results complemented those of Brazil and Argentina (Bjorndal et al., 2006; Naro-Maciel et al., 2007; Jordão et al., 2015; Coelho et al., 2018; 2012; Torezani et al., 2010; Proietti et al., 2012; Prosdocimi et al., 2012; Savada et al., 2021). The absence of notable temporal or spatial genetic patterns within Uruguayan waters indicates that turtles disperse widely along this coastline and to and from neighboring areas such as southern Brazil and Argentina. Similar lack of internal structure was noted elsewhere, such as in Brazil (Naro-Maciel et al., 2007, 2012). Genetic diversity measures in Uruguay were lower than some feeding grounds in Argentina and southern Brazil, and similar to other southwestern Atlantic feeding grounds (Rio de Janeiro, Ubatuba, and Paranaguá; Table 1; Supplementary Table S2). Their differentiation from more distant feeding areas underscores the distinctiveness of this aggregation. These discoveries hold significant conservation implications by demonstrating the likelihood that threats in this region are impacting connected sites and vice versa. In light of the species’ conservation status, these linkages highlight the need for environmental regulations across their habitats, including protected areas. It is also clear that the possession of such areas constitutes a great responsibility for the countries that receive turtles from different parts of the planet on their coasts.
Natal origins of turtles foraging in Uruguay
The Mixed Stock Analysis indicated that these juvenile green turtles migrate from multiple areas of the Atlantic Ocean, mostly from a combination of Ascension Island, Guinea Bissau, and Trindade Island, Brazil. The reproductive connection to distant Ascension Island on the Mid-Atlantic Ridge (Figure 1) requires impressive island-finding and navigation abilities. These are known to depend upon navigation using the Earth’s magnetic field, as well as olfactory and chemical cues (Lohmann and Lohmann, 1996). This migration, supported by satellite tracking and tag returns of adults departing Ascension Island to the coast of South America, is celebrated as one of the most remarkable of marine vertebrate voyages (Luschi et al., 1996).
These natal origins are based on analysis of the shorter segments (~481bp) for comparison to other sites, and are consistent with findings from newly characterized longer (~780bp) sequences. The CM-A8.1 subhaplotype that dominates Uruguay is widespread in the South Atlantic, supporting those linkages. Further, the rarer CM-A42.1, CM-A44.1, and CM-A45.1 subhaplotypes link Uruguay to Ascension Island and/or African nesting and feeding areas (GenBank JF308473, JF308481; Patrício et al., 2017 respectively; Supplementary Table S3). Similar connections between South Atlantic foraging groups in Brazil and Argentina and rookeries of Ascension Island, Trindade Island (Brazil), and West Africa have been previously reported from genetic and mark-recapture studies (Naro-Maciel et al., 2007; 2012; Torezani et al., 2010; Proietti et al., 2012; Prosdocimi et al., 2012; Jordão et al., 2015; Coelho et al., 2018; Savada et al., 2021).
However, the confidence intervals in all of these Mixed Stock Analysis studies are high. This is primarily attributed to the recent population expansions out of glacial refugia after the Last Glacial Maximum approximately 20,000 years ago, as reflected in the shallow haplotype network and prevalence of common shared haplotypes like CM-A8 (Figure 3) (Naro-Maciel et al., 2014; Reid et al., 2019). Guinea Bissau, for instance, consists of 99.6% CM-A8 in addition to 0.4% CMA-42 (Supplementary Table S1), and its source contribution to Uruguay could range from 0 to about 60% with 95% confidence (Figure 3). This lack of resolution highlights the need for further geographic sampling, particularly of uncharacterized African foraging areas to determine their connectivity, as well as genomic sampling to narrow down confidence intervals if possible. Testing alternative methods such as stable isotope analysis of dietary composition, as well as expanding traditional tagging and satellite telemetry studies, are recommended to determine connectivity in the context of oceanographic studies like particle modeling that predict hatching movements. Undoubtedly, success in the management of these areas requires multidisciplinary studies that allow understanding of their dynamics.
The results of our study do not support the hypothesis that geographic distance is the main factor determining rookery contributions to the Uruguayan foraging ground, although population size and ocean currents may play important roles. The Mixed Stock Analyses confirm that the two nesting beaches that contribute around 80% of individuals to Uruguay, are Ascension Island and Poilão, Guinea Bissau, the largest in the South Atlantic. These areas are located 5,000 - 6,000 km away from Uruguay and have almost 4,000 nesting females each per year (Seminoff et al., 2015). Ascension Island is an important regional source and is also the largest contributor to the other Southwestern Atlantic Ocean feeding areas (Figure 1) (Naro-Maciel et al., 2007; Proietti et al., 2012; Prosdocimi et al., 2012; Jordão et al., 2015; Coelho et al., 2018; Savada et al., 2021). This island contributes more individuals to the Southwestern Atlantic coasts than Trindade Island in Brazil, which is 2,000 km closer but is also a much smaller rookery. Although the closest rookeries are clearly not the largest contributors to Uruguay, geographic distance has been implicated in juvenile natal homing, whereby green turtles progressively move closer to their source rookeries to forage as they get older, as hypothesized for Brazil (Naro-Maciel et al., 2007, 2012). On average the green turtles foraging further north, closer to Ascension Island for example, are much larger and closer to reproductive age than the small juveniles developing in Uruguay. As noted above, the latter are likely recent recruits from the pelagic area given their size, and are probably not old enough to start the juvenile natal homing process.
Especially for hatchlings and small pelagic turtles, oceanic circulation patterns likely play a significant role in dispersal. Currents can contribute to determining the representation of different rookeries, such as Ascension Island, at various feeding and development regions. For instance, advanced particle modeling research suggests that the South Equatorial Current and its branches, including the Brazil Current, are likely to disperse small turtles (represented by particles) from Ascension and Trindade toward Uruguay and other South American coastal foraging grounds (Putman and Naro-Maciel, 2013).
Genetic differentiation among feeding grounds
Within the Southwestern Atlantic, differences among feeding grounds were less significant in comparison to ocean-basin-wide differentiation, suggesting the movement of turtles among populations along the coast. Even so, there is an increased prevalence of haplotype CM-A5 further north in Brazil, reflecting the turtles coming from Suriname and other sites where this primarily northern hemisphere lineage occurs. Thus, although turtles mix along the South American coast, there is still some structure derived from the different source rookeries. This further supports the hypothesis of juvenile natal homing discussed above (Naro-Maciel et al., 2007; 2012).
These patterns were confirmed by other methodologies (e.g. satellite telemetry, mark-recapture) indicating that foraging grounds in the Southwestern Atlantic are shared. Small juveniles recruit from the pelagic then start to move south or north along the coast (Gallo et al., 2006; Santos et al., 2015; Jardim et al., 2016; Vélez-Rubio et al., 2018b), presenting different individual preferences to feeding areas that include seasonal migrations and high fidelity in the region (González Carman et al., 2012; Santos et al., 2015; Vélez-Rubio et al., 2016; Campos and Cardona, 2019). Their occurrence is determined by the seasonal distribution and abundance of prey as well as oceanographic conditions (González Carman et al., 2012; López-Mendilaharsu et al., 2016; Vélez-Rubio et al., 2018b). Most green turtles leave Uruguayan waters by the colder months, performing seasonal migrations, but others remain year round as noted above (Vélez-Rubio et al., 2018a; Velez-Rubio et al., 2022). Additional studies integrating multiple approaches and considering ecological parameters, such as oceanographic data on currents and distribution of food resources, would be valuable for understanding the demographic dynamics in the region. These different sources of information would help determine if the changes in the proportion of recruits are related to intrinsic complex behaviors or transient responses to ecological factors.
Implications for conservation
The study results support the inclusion, currently being considered, of new Marine Protected Areas spanning green turtle habitats in the National System of Protected Areas in Uruguay, as well as legislative and other measures. Not only will these protect this distinctive group of juvenile green turtles, but also maintain their related ecosystems and food webs. According to Crouse et al. (1987) and Chevallier et al. (2020), the key to improving the prognosis of threatened sea turtle populations lies fundamentally in reducing the mortality of immature stages like juveniles, the stages to which population growth is most sensitive. By increasing the survival of young turtles in their developmental feeding areas such as in Uruguay through protective measures, the future of adult males and females that contribute to the maintenance of the different nesting colonies can also be enhanced. International cooperation is required given the transboundary nature of green turtle populations connected by dispersal and migration. Many of the sites in this study are contained within protected areas, where effectiveness must be maintained. Threats that occur outside of these sites, such as fishery interactions or habitat alteration along reproductive or developmental migrations, must be addressed such as through effective regulation and establishment of new protected areas. In conclusion, this study emphasizes the necessity of implementing protected zones and regulatory measures that encompass the diverse transboundary habitats where these endangered species thrive, with the overarching goal of securing the conservation, and that of their ecosystems, for the long term.
Data availability statement
The data presented in the study are deposited in the NCBI GenBank repository, accession numbers PP378115–PP378126 and PP425333–PP425342.
Ethics statement
The animal study was approved by Fauna Department-Ministry of Cattle, Agriculture and Fishing of Uruguay. The study was conducted in accordance with the local legislation and institutional requirements.
Author contributions
LP: Conceptualization, Formal analysis, Investigation, Methodology, Project administration, Supervision, Visualization, Writing – original draft, Writing – review & editing. SV: Formal analysis, Funding acquisition, Investigation, Methodology, Writing – original draft, Writing – review & editing. EN-M: Funding acquisition, Investigation, Visualization, Writing – original draft, Writing – review & editing. MC: Conceptualization, Methodology, Writing – original draft. AF: Formal analysis, Funding acquisition, Investigation, Methodology, Writing – original draft. GV-R: Conceptualization, Formal analysis, Funding acquisition, Investigation, Methodology, Project administration, Supervision, Visualization, Writing – original draft, Writing – review & editing.
Funding
The author(s) declare financial support was received for the research, authorship, and/or publication of this article. The project was supported by the Conservation Leadership Program (Future Conservationist, Follow-up, and Leadership Awards) under grant no. 001404F; the National Fish and Wildlife Foundation (2003/04 to Karumbe); Peoples Trust for Endangered Species; Rufford Small Grants (GV-R; 17651-1 and 17651-2); Idea Wild (grant no. VELEURUG0515); PADI Foundation; International Fund for Animal Welfare; Green Grants; and Project Aware Foundation. Genetic analysis was funded by the British Embassy in Montevideo to MC. GV-R is supported by Sistema Nacional de Investigadores-Agencia Nacional de Investigación e Innovación and PEDECIBA-Biología.
Acknowledgments
We would like to thank the Karumbé volunteers and members for their assistance in the present study. The authors express gratitude to all the persons and institutions that collaborated with Karumbé through the Uruguay marine turtle stranding network: local fishermen, government institutions (DINARA and DINAMA), especially the Sistema Nacional de Áreas Protegidas (SNAP), Prefectura Nacional Naval, lifeguard service, rangers, civil organizations (particularly SOCOBIOMA), citizens, tourists, and Faculty of Science and Centro Universitario Regional del Este (CURE) of the Universidad de la República (UdelaR, Uruguay). This research was conducted under licenses (No. 200/04, 073/08, 323/11 and 12/14) from the Fauna Department-Ministry of Cattle, Agriculture and Fishing of Uruguay. CITES permits for export and import of the samples were obtained.
Conflict of interest
The authors declare that the research was conducted in the absence of any commercial or financial relationships that could be construed as a potential conflict of interest.
Publisher’s note
All claims expressed in this article are solely those of the authors and do not necessarily represent those of their affiliated organizations, or those of the publisher, the editors and the reviewers. Any product that may be evaluated in this article, or claim that may be made by its manufacturer, is not guaranteed or endorsed by the publisher.
Supplementary material
The Supplementary Material for this article can be found online at: https://www.frontiersin.org/articles/10.3389/famrs.2024.1351226/full#supplementary-material
References
Abreu-Grobois F. A., Horrocks J. A., Formia A., Dutton P. H., LeRoux R. A., Velez-Zuazo X., et al. (2006). “New mtDNA dloop 503 primers which work for a variety of marine turtle species may increase the resolution of mixed 504 stock analyses,” in Twenty Sixth Annual Symposium on Sea Turtle Biology and Conservation, 505 ed. Eds. Frick M. P. A., Rees A. F., Williams K. (International Sea Turtle Society), 179.
Acha E. M., Mianzan H. W., Guerrero R. A., Favero M., Bava J. (2004). Marine fronts at the continental shelves of austral South America: Physical and ecological processes. J. Mar. Sys. 44, 83–105. doi: 10.1016/j.jmarsys.2003.09.005
Allen M., Engström A. S., Meyers S., Handt O., Saldeen T., von Haeseler A., et al. (1998). Mitochondrial DNA sequencing of shed hairs and saliva on robbery caps: sensitivity and matching probabilities. J. Forensic Sci. 43, 453–464. doi: 10.1520/JFS16169J
Anderson J. D., Shaver D. J., Karel W. J. (2013). Genetic diversity and natal origins of green turtles (Chelonia mydas) in the Western Gulf of Mexico. J. Herpetology 47 (2), 251–257. doi: 10.1670/12-031
Bagley D. A. (2003). Characterizing juvenile green turtles, (Chelonia mydas), from three east central Florida developmental habitats (Orlando, Florida: Masters thesis. University of Central Florida).
Bass A. L. (2006). Green turtle (Chelonia mydas) foraging and nesting aggregations in the Caribbean and Atlantic: Impact of currents and behavior on dispersal. J. Heredity 97, 346–354. doi: 10.1093/jhered/esl004
Bass A. L., Lagueux C. J., Bowen B. W. (1998). Origin of green turtles, Chelonia mydas, at.”Sleeping Rocks” off the Northeast Coast of Nicaragua. Copeia 1998, 1064–1069. doi: 10.2307/1447360
Bass A. L., Witzell W. N. (2000). Demographic composition of immature green turtles (Chelonia mydas) from the East Central Florida coast: evidence from mtDNA markers. Herpetologica 56, 357–367.
Bellini C. (1996). Reproduction and feeding of marine turtles in the Fernando de Noronha archipelago, Brazil. Mar. Turtle News. 74, 12–13.
Bellini C., Marcovaldi M., Sanches T. M., Grossman A., Sales G. (1996). Atol das Rocas biological reserve: second largest Chelonia rookery in Brazil. Mar. Turtle News. 72, 1–2.
Bjorndal K. A., Bolten A. B., Lagueux C. J., Chaves A. (1996). Probability of tag loss in green turtles nesting at tortuguero, Costa Rica. J. Herpetol. 30, 566–571. doi: 10.2307/1565709
Bjorndal K. A., Bolten A. B., Troëng S. (2005). Population structure and genetic diversity in green turtles nesting at Tortuguero, Costa Rica, based on mitochondrial DNA control region sequences. Mar. Biol. 147 (6), 1449–1457. doi: 10.1007/s00227-005-0045-y
Bjorndal K. A., Bolten A. B., Moreira L., Bellini C., Marcovaldi M. A. (2006). Population structure and diversity of Brazilian green turtle rookeries based on mitochondrial DNA sequences. Chel. Cons. Biol. 5, 262–268. doi: 10.2744/1071-8443(2006)5[262:PSADOB]2.0.CO;2
Bolker B., Okuyama T., Bjorndal K., Bolten A. (2007). Incorporating multiple mixed stocks in mixed stock analysis: ‘many-to-many’ analyses. Mol. Ecol. 16, 685–695.
Borthagaray A. I., Carranza A. (2007). Mussels as ecosystem engineers: Their contribution to species richness in a rocky littoral community. Acta Oecologica 31, 243–250. doi: 10.1016/j.actao.2006.10.008
Bowen B. W., Karl S. A. (2007). Population genetics and phylogeography of sea turtles. Mol. Ecol. 16, 4886–4907. doi: 10.1111/j.1365-294X.2007.03542.x
Buteler C., Bardier C., Cabrera M. R., Gonzalez Y., Vélez-Rubio G. M. (2022). To tag or not to tag: comparative performance of tagging and photo-identification in a long-term mark-recapture of juvenile green turtles (Chelonia mydas). Amphibia-Reptilia 44, 45–58. doi: 10.1163/15685381-bja10119
Campos P., Cardona L. (2019). Individual variability in the settlement of juvenile green turtles in the western South Atlantic Ocean: relevance of currents and somatic growth rate. Mar. Ecol. Prog. Ser. 614, 173–182. doi: 10.3354/meps12909
Caraccio M. N. (2008). Análisis de la composición genética de Chelonia mydas (tortuga verde) en el área de alimentación y desarrollo de Uruguay. Universidad de la República, Uruguay. Master Thesis.
Carr A. (1987). So excellent a fishe: A natural history of sea turtles. Cons. Biol. 1, 103–121. doi: 10.1111/j.1523-1739.1987.tb00020.x
Chapman R. W. (1996). A mixed stock analysis of the green sea turtle: the need for a null hypothesis. US Department of Commerce, NOAA Technical Memorandum. NMFS-SEFSC-396:137-146.
Chevallier D., Mourrain B., Girondot M (2020). Modelling leatherback biphasic indeterminate growth using a modified Gompertz equation. Ecol. Model. 426, 109037. doi: 10.1016/j.ecolmodel.2020.109037
Coelho V. F., Domit C., Broadhurst M. K., Prosdocimi L., Nishizawa H., Almeida F. S. (2018). Intra-specific variation in skull morphology of juvenile Chelonia mydas in the southwestern Atlantic Ocean. Mar. Biol. 165, 1–12. doi: 10.1007/s00227-018-3429-5
Crouse D. T., Crowder L. B., Caswell H. (1987). A stage-based population model for loggerhead sea turtles and implications for conservation. Ecology 68, 1412–1423. doi: 10.2307/1939225
Domingo A., Sales G., Giffoni B., Miller P., Laporta M., Maurutto G. (2006). Captura incidental de tortugas marinas con palangre pelagico en el atlántico sur por las flotas de Brasil y Uruguay. Col. Vol. Sci. Pap. ICCAT 59, 992–1002.
Dutton P. H. (1996). “Methods for collection and preservation of samples for sea turtle genetic studies,” in Proceedings of the international symposium on sea turtle conservation genetics, vol. 396 . Eds. Bowen B. W., Witzell W. N. (NOAA Technical Memorandum NMFS-SEFSC, Miami (FL), 17–24.
Encalada S. E., Lahanas P. N., Bjorndal K. A., Bolten A. B., Miyamoto M. M., Bowen B. W. (1996). Phylogeography and population structure of the Atlantic and Mediterranean green turtle (Chelonia mydas): a mitochondrial DNA control region sequence assessment. Mol. Ecol. 5, 473–483. doi: 10.1111/j.1365-294X.1996.tb00340.x
Excoffier L., Lischer H. E. L. (2010). Arlequin suite ver 3.5: a new series of programs to perform population genetics analyses under Linux and Windows. Mol. Ecol. Res. 10, 564–567. doi: 10.1111/j.1755-0998.2010.02847.x
FitzSimmons N. N., Limpus C. J., Norman J. A., Goldizen A. R., Miller J. D., Moritz C. (1997a). Philopatry of male marine turtles inferred from mitochondrial DNA markers. Proc. Natl. Acad. Sci. 94, 8912–8917. doi: 10.1073/pnas.94.16.8912
FitzSimmons N. N., Moritz C., Limpus C. J., Pope L., Prince R. (1997b). Geographic structure of mitochondrial and nuclear gene polymorphisms in Australian green turtle populations and male-biased gene flow. Genetics 147, 1843–1854. doi: 10.1093/genetics/147.4.1843
Foley A. M., Singel K. E., Dutton P. H., Summers T. M., Redlow A. E., Lessman J. (2007). Characteristics of a Green Turtle (Chelonia mydas) assemblage in Northwestern Florida determined during a hypothermic stunning event. Gulf Mexico Sci. 25 (2). https://aquila.usm.edu/goms/vol25/iss2/4.
Formia A., Broderick A. C., Glen F., Godley B. J., Hays G. C., Bruford M. W. (2007). Genetic composition of the Ascension Island green turtle rookery based on mitochondrial DNA: implications for sampling and diversity. End. Species Res. 3, 145–158. doi: 10.3354/esr003145
Formia A., Godley B. J., Dontaine J. F., Bruford M. W. (2006). Mitochondrial DNA diversity and phylogeography of endangered green turtle (Chelonia mydas) populations in Africa. Cons. Genet. 7, 353–369. doi: 10.1007/s10592-005-9047-z
Gallo B. M. G., Macedo S., De B., Giffoni B., Becker J. H., Barata P. C. R. (2006). Sea turtle conservation in Ubatuba, Southeastern Brazil, a feeding area with incidental capture in coastal fisheries. Chel. Cons. Biol. 5, 93–101. doi: 10.2744/1071-8443(2006)5[93:STCIUS]2.0.CO;2
Garcia C. A. E. (1998). “Oceanografia física,” in Os ecossistemas costeiro e marinho do extremo sul do Brasil. Eds. Seeliger U., Ode-Brecht C., Castello J. P. (Ecoscientia, Rio Grande, Brasil), 104–106.
González-Carman V., Álvarez K., Prosdocimi L., Inchaurraga M. C., Dellacasa R., Faiella A., et al. (2011). Temperate SW Atlantic: a feeding and developmental habitat for endangered sea turtles. Mar. Biol. Res. 7, 500–508. doi: 10.1080/17451000.2010.528772
González Carman V., Falabella V., Maxwell S., Albareda D., Campagna C., Mianzan H. (2012). Revisiting the ontogenetic shift paradigm: The case of juvenile green turtles in the SW Atlantic. J. Exp. Mar. Biol. Ecol. 429, 64–72. doi: 10.1016/j.jembe.2012.06.007
Hall T. A. (1999). BioEdit, a user-friendly biological sequence alignment editor and analysis program for Windows 95/98/NT. Nucleic Acids Symposium Ser. 41, 95–98.
Henwood T. A. (1986). Losses of monel flipper tags from loggerhead sea turtles, Caretta caretta. J. Herpetol. 20, 276–279. doi: 10.2307/1563960
Hirth H. F. (1997). Synopsis of the biological data on the green turtle Chelonia mydas (Linnaeus 1758) Vol. 97 (Washington, DC: US Fish and Wildlife Service, US Department of the Interior).
Jardim A., López-Mendilaharsu M., Barros F. (2016). Demography and foraging ecology of Chelonia mydas on tropical shallow reefs in Bahia, Brazil. J. Mar. Biol. Assoc. U. K. 96, 1295–1304. doi: 10.1017/S0025315415001629
Jordão J. C., Bondioli A. C. V., Guebert F. M., de Thoisy B., Toledo L. F. de A. (2015). Green turtle (Chelonia mydas) genetic diversity at Paranaguá Estuarine Complex feeding grounds in Brazil. Genet. Mol. Biol. 38, 346–352. doi: 10.1590/S1415-475738320140353
Kaska Y. (2000). Genetic structure of Mediterranean sea turtle populations. Turk J. Zool 24, 191–197.
Kimura M. (1980). A simple method for estimating evolutionary rates of base substitutions through comparative studies of nucleotide sequences. J. Mol. Evol. 16, 111–120. doi: 10.1007/BF01731581
Lahanas P. N., Bjorndal K. A., Bolten A. B., Encalada S. E., Miyamoto M. M., Valverde R. A., et al. (1998). Genetic composition of a green turtle (Chelonia mydas) feeding ground population: evidence for multiple origins. Mar. Biol. 130, 345–352. doi: 10.1007/s002270050254
Lahanas P. N., Miyamoto M. M., Bjorndal K. A., Bolten A. B. (1994). Molecular evolution and population genetics of Greater Caribbean green turtles (Chelonia mydas) as inferred from mitochondrial DNA control region sequences. Genetica 94, 57–66. doi: 10.1007/BF01429220
Laporta M., Miller P., Domingo A., Egaña-Callejo A. (2012). “Captura incidental de tortugas marinas en la pesquería de arrastre Uruguaya,” in marine turtles of the North East Atlantic. Contributions for the First Regional Conference. Ed. Zaldua-Mendizabal N. (Munibe Monographs. Nature Series 1. Aranzadi Society of Sciences, San Sebastian), 43–50.
Leigh J. W., Bryant D. (2015). PopArt: full-feature software for haplotype network construction. Methods Ecol. Evol. 6, 1110–1116. doi: 10.1111/2041-210X.12410
Lezama C. (2009). Impacto de la pesquería artesanal sobre tortuga verde (Chelonia mydas) en las costas del Río de la Plata exterior. Facultad de Ciencias, Universidad de la República. Available at: https://www.researchgate.net/publication/378549606_Impacto_de_la_pesqueria_artesanal_sobre_tortuga_verde_Chelonia_mydas_en_las_costas_del_Rio_de_la_Plata_exterior. Tesis de Maestría. Montevideo, Uruguay.
Limpus C. J. (1992). Estimation of tag loss in marine turtle research. Wildl. Res. 19, 457–469. doi: 10.1071/WR9920457
Lohmann K. J., Lohmann C. M. F. (1996). Orientation and open-sea navigation in sea turtles. J. Exp. Biol. 199, 73–81. doi: 10.1242/jeb.199.1.73
López-Mendilaharsu M., Estrades A., Caraccio M. N., Calvo V., Hernández M., Quirici V. (2006). Biología, ecología y etología de las tortugas marinas en la zona costera Uruguaya. In Bases para la conservación y el manejo de la costa Uruguaya. Eds. Menafra R., Rodríguez-Gallego L., Scarabino F., Conde D. (Montevideo), 247–258.
López-Mendilaharsu M., Vélez-Rubio G. M., Lezama C., Aisenberg A., Bauzá A., Berrondo L., et al. (2016). Demographic and tumour prevalence data for juvenile green turtles at the Coastal-Marine Protected Area of Cerro Verde, Uruguay. Mar. Biol. Res. 12, 541–550. doi: 10.1080/17451000.2016.1169294
Luke K., Horrocks J. A., LeRoux R. A., Dutton P. H. (2004). Origins of green turtle (Chelonia mydas) feeding aggregations around Barbados, West Indies. Mar. Biol. 144, 799–805. doi: 10.1007/s00227-003-1241-2
Luschi P., Mencacci R., Hays G. C. (2006). A review of migratory behaviour of sea turtles off Southeastern Africa a review of patterns of multiple paternity across sea turtle rookeries view project innovative methods to track sea turtles view project. S. Afr. J. Sci. 102, 51–58.
Mansfield K. L., Wyneken J., Luo J. (2021). First Atlantic satellite tracks of ‘lost years’ green turtles support the importance of the Sargasso Sea as a sea turtle nursery. Proc. R. Soc B. 288, 20210057. doi: 10.1098/rspb.2021.0057
Monzón-Argüello C., López-Jurado L. F., Rico C., Marco A., López P. A., Hays G. C., et al. (2010). Evidence from genetic and lagrangian drifter data for transatlantic transport of small juvenile green turtles. J. Biog. 37, 1752–1766. doi: 10.1111/j.1365-2699.2010.02326.x
Naro-Maciel E., Becker J. H., Lima E. H. S. M., Marcovaldi M. Â., DeSalle R. (2007). Testing dispersal hypotheses in foraging green sea turtles (Chelonia mydas) of Brazil. J. Her. 98, 29–39. doi: 10.1093/jhered/esl050
Naro-Maciel E., Bondioli A. C., Martin M., de Pádua Almeida A., Baptistotte C., Bellini C., et al. (2012). The interplay of homing and dispersal in green turtles: a focus on the southwestern Atlantic. J. Hered. 103, 792–805. doi: 10.1093/jhered/ess068
Naro-Maciel E., Reid B. N., Alter S. E., Amato G., Bjorndal. K. A., Bolten A. B., et al. (2014). From refugia to rookeries: phylogeography of Atlantic green turtles. J. Exp. Mar. Biol. Ecol. 461, 306–316.
Naro-Maciel E., Hart K. M., Cruciata R., Putman N. F. (2017). DNA and dispersal models highlight constrained connectivity in a migratory marine megavertebrate. Ecography 40 (5), 586–597.
Nei M. (1987). Molecular evolutionary genetics (New York Chichester, West Sussex: Columbia University Press). doi: 10.7312/nei-92038
Ortega L., Martínez A. (2007). Multiannual and seasonal variability of water masses and fronts over the Uruguayan shelf. J. Coast. Res. 233, 618–629. doi: 10.2112/04-0221.1
Patrício A. R., Formia A., Barbosa C., Broderick A. C., Bruford M., Carreras C., et al. (2017). Dispersal of green turtles from Africa’s largest rookery assessed through genetic markers. Mar. Ecol. Prog. Ser. 569, 215–225. doi: 10.3354/meps12078
Pella J. J., Masuda M. (2001). Bayesian methods for analysis of stock mixtures from genetic characters. Fish. Bull. 9, 151–167.
Proietti M., Reisser J., Kinas P., Kerr R., Monteiro D., Marins L., et al. (2012). Green turtle Chelonia mydas mixed stocks in the western South Atlantic, as revealed by mtDNA haplotypes and drifter trajectories. Mar. Ecol. Progr. Ser. 447, 195–209. doi: 10.3354/meps09477
Prosdocimi L., González Carman V., Albareda D. A., Remis M. I. (2012). Genetic composition of green turtle feeding grounds in coastal waters of Argentina based on mitochondrial DNA. J. Exp. Mar. Biol. Ecol. 412, 35–45. doi: 10.1016/j.jembe.2011.10.015
Putman N. F., Naro-Maciel E. (2013). Finding the ‘lost years’ in green turtles: insights from ocean circulation models and genetic analysis. Proc. R. Soc B: Biol. Sci. 280, 20131468. doi: 10.1098/rspb.2013.1468
Reid B. N., Naro-Maciel E., Torres Hahn A., FitzSimmons N. N., Gehara M. (2019). Geography best explains global patterns of genetic diversity and postglacial co-expansion in marine turtles. Mol. Ecol. 28, 3358–3370. doi: 10.1111/mec.15165
RStudio Team. (2020). RStudio: Integrated Development for R (Boston, MA: RStudio, PBC). Available at: http://www.rstudio.com/.
Ruiz-Urquíola A., Riverón-Giró F.-B., Pérez-Bermúdez, Abreu-Grobois F. A., González-Pumariega M., James-Petric B. L., et al. (2010). Population genetic structure of Greater Caribbean green turtles (Chelonia mydas) based on mitochondrial DNA sequences, with an emphasis on rookeries from southwestern Cuba. Rev. Investigaciones Marinas 31, 33–52.
Santos R. G., Andrades R., Boldrini M. A., Martins A. S. (2015). Debris ingestion by juvenile marine turtles: An underestimated problem. Mar. Poll. Bull. 93, 37–43. doi: 10.1016/j.marpolbul.2015.02.022
Savada C. S., Prosdocimi L., Domit C., Almeida F. S. (2021). Multiple haplotypes of Chelonia mydas juveniles in a threatened hotspot area in Southern Brazil. Genet. Mol. Biol. 44, e20200410. doi: 10.1590/1678-4685-gmb-2020-0410
Scarabino F., Zelaya D., Orensanz J. M., Ortega L., Defeo G., Schwindt E., et al. (2015). Cold, warm, temperate and brackish: bivalve biodiversity in a complex oceanographic scenario (Uruguay, Southwestern Atlantic). Am. Malacol. Bull. 33, 284. doi: 10.4003/006.033.0219
Seminoff J. A. (2023)Chelonia mydas (amended version of 2004 assessment). In: The IUCN Red List of Threatened Species 2023. Available online at: https://dx.doi.org/10.2305/IUCN.UK.2023-1.RLTS.T4615A247654386.en (Accessed 12 March 2024).
Seminoff J. A., Allen C. D., Balazs G. H., Dutton P. H., Eguchi T., Haas H. L., et al. (2015) Status review of the green turtle (Chelonia mydas) under the Endangered Species Act. NOAA Tech. Mem., NOAA NMFS-SWFSC-539. Available online at: https://repository.library.noaa.gov/view/noaa/4922.
Seminoff J. A., Resendiz A., Nichols W. J. (2002). Home range of green turtles Chelonia mydas at a coastal foraging area in the Gulf of California, Mexico. Mar. Ecol. Progr. Ser. 242, 253–265. doi: 10.3354/meps242253
Shamblin B. M., Bjorndal K. A., Bolten A. B., Hillis-Starr Z. M., Lundgren I., Naro-Maciel E., et al. (2012). Mitogenomic sequences better resolve stock structure of southern Greater Caribbean green turtle rookeries. Mol. Ecol. 21 (10), 2330–2340. doi: 10.1111/j.1365-294X.2012.05530.x
Shamblin B. M., Shamblin B. M., Bolten A. B., Abreu-Grobois F. A., Bjorndal K. A., Cardona L., et al. (2014). Geographic patterns of genetic variation in a broadly distributed marine vertebrate: New Insights into Loggerhead turtle stock structure from expanded mitochondrial DNA sequences. PloS One 9 (1), e85956. doi: 10.1371/journal.pone.0085956
Shamblin B. M., Dutton P. H., Bjorndal K. A., Bolten A. B., Naro-Maciel E., Santos A. J. B., et al. (2015). Deeper mitochondrial sequencing reveals cryptic diversity and structure in Brazilian green turtle rookeries. Chel. Cons. Biol. 14, 167. doi: 10.2744/CCB-1152.1
Torezani E., Baptistotte C., Mendes S. L., Barata P. C. R. (2010). Juvenile green turtles (Chelonia mydas) in the effluent discharge channel of a steel plant, Espírito Santo, Brazil 2000–2006. J. Mar. Biol. Ass. UK. 90, 233–246. doi: 10.1017/S0025315409990579
Vélez-Rubio G. M., Cardona L., López-Mendilaharsu M., Martinez Souza G., Carranza A., Campos P., et al. (2018a). Pre and post-settlement movements of juvenile green turtles in the Southwestern Atlantic Ocean. J. Exp. Mar. Biol. Ecol. 501, 36–45. doi: 10.1016/j.jembe.2018.01.001
Vélez-Rubio G. M., Cardona L., López-Mendilaharsu M., Martínez Souza G., Carranza A., González-Paredes D., et al. (2016). Ontogenetic dietary changes of green turtles (Chelonia mydas) in the temperate southwestern Atlantic. Mar. Biol. 163, 57. doi: 10.1007/s00227-016-2827-9
Vélez-Rubio G. M., Estrades A., Fallabrino A., Tomás J. (2013). Marine turtle threats in Uruguayan waters: insights from 12 years of stranding data. Mar. Biol. 160, 2797–2811. doi: 10.1007/s00227-013-2272-y
Vélez-Rubio G. M., González-Etchebehere L., Scarabino F., Trinchin R., Manta G., Laporta M, et al. (2021). Macroalgae morpho-functional groups in Southern marine ecosystems: rocky intertidal in the Southwestern Atlantic (33°–35° S). Mar. Biol. 168, 153. doi: 10.1007/s00227-021-03960-6
Velez-Rubio G. M., Reyes M. B., Monteiro D., Paiva da Silva A., Estima S., Scarabino F., et al. (2022). Mass stranding of overwintering green turtles Chelonia mydas in Southern Brazil and Uruguay. Mar. Turtle News. 165, 28.
Vélez-Rubio G. M., Teryda N., Asaroff P. E., Estrades A., Rodriguez D., Tomás J. (2018b). Differential impact of marine debris ingestion during ontogenetic dietary shift of green turtles in Uruguayan waters. Mar. Poll. Bull. 127, 603–611. doi: 10.1016/j.marpolbul.2017.12.053
Vilaça S. T., Lara-Ruiz P., Marcovaldi M. A., Soares L. S., Santos F. R. (2013). Population origin and historical demography in hawksbill (Eretmochelys imbricata) feeding and nesting aggregates from Brazil. J. Exp. Mar. Biol. Ecol. 446, 334–344. doi: 10.1016/j.jembe.2013.06.004
Wallace B. P., DiMatteo A. D., Hurley B. J., Finkbeiner E. M., Bolten A. B., Chaloupka M. Y., et al. (2010). Regional Management Units for marine turtles: A novel framework for prioritizing conservation and research across multiple scales. PloS One 5, 1–11. doi: 10.1371/journal.pone.0015465
Wallace B. P., Posnik Z. A., Hurley B. J., DiMatteo A. D., Bandimere A., Rodriguez I., et al. (2023). Marine turtle regional management units 2.0: an updated framework for conservation and research of wide-ranging megafauna species. End. Species Res. 52, 209–223. doi: 10.3354/esr01243
Keywords: feeding ground, genetic diversity, mitochondrial DNA, control region, population structure, mixed stock
Citation: Prosdocimi L, Vilaca ST, Naro-Maciel E, Caraccio MN, Formia A and Vélez-Rubio GM (2024) Genetic composition of green sea turtles (Chelonia mydas) at coastal feeding areas of Uruguay. Front. Amphib. Reptile Sci. 2:1351226. doi: 10.3389/famrs.2024.1351226
Received: 06 December 2023; Accepted: 18 March 2024;
Published: 09 April 2024.
Edited by:
Dan Cogalniceanu, Ovidius University, RomaniaReviewed by:
Mario Lo Valvo, University of Palermo, ItalyClaude Miaud, Université Paris Sciences et Lettres, France
Copyright © 2024 Prosdocimi, Vilaca, Naro-Maciel, Caraccio, Formia and Vélez-Rubio. This is an open-access article distributed under the terms of the Creative Commons Attribution License (CC BY). The use, distribution or reproduction in other forums is permitted, provided the original author(s) and the copyright owner(s) are credited and that the original publication in this journal is cited, in accordance with accepted academic practice. No use, distribution or reproduction is permitted which does not comply with these terms.
*Correspondence: Laura Prosdocimi, lprosdo@yahoo.com.ar