Examining Differences in Within- and Between-Person Simple Structures of an Engineering Qualification Test Using Multilevel MIMIC Structural Equation Modeling
 Ioannis Tsaousis
 Georgios D. Sideridis2,3
 - 1Department of Psychology, University of Crete, Rethymno, Greece
- 2Boston Children's Hospital, Harvard Medical School, Boston, MA, United States
- 3National and Kapodistrian University of Athens, Athens, Greece
- 4National Center for Assessment in Higher Education, Riyadh, Saudi Arabia
- 5College of Education, Taibah University, Medina, Saudi Arabia
The current study sought to meet three aims: (a) to understand the optimal factor structure of the Professional Engineering (ProfEng) test, a measure aiming to assess competency in engineering, within a multilevel (nested) perspective; (b) to examine the psychometric measurement invariance of the ProfEng test across levels due to nesting and across gender at the person level, and, (c) to examine the internal consistency of the engineering competency measure at both levels in the analysis. Data involved 1,696 individuals across 21 universities who took a national licensure test as part of the professional accreditation process to obtain a work permit and practice the engineering profession in the Kingdom of Saudi Arabia. Data were analyzed by use of Multilevel Structural Equation Modeling (MLSEM). Results indicated that a 2-factor model at both levels of analysis provided the best fit to the data. We also examined violation of measurement invariance across clusters (cluster bias). Results showed that all factor loadings were invariant across levels, suggesting the presence of strong measurement invariance. Last, invariance across gender was tested by use of the MIMIC multilevel model. Results pointed to the existence of significant differences between genders on levels of personal and professional skills with females having higher levels on personal skills and males on professional. Estimates of internal consistency reliability also varied markedly due to nesting. It is concluded that ignoring a multilevel structure is associated with errors and inaccuracies in the measurement of person abilities as both measurement wise and precision wise the multilevel model provides increased accuracy at each level in the analysis.
Introduction
In the field of measurement, one of the most important challenges is to establish proper levels of reliability and validity of a measure. Both psychometric qualities are considered as key elements in psychological assessment, since they are directly linked to the accuracy and the truthfulness of the scores obtained from a test [1] with implications for placement in certain educational environments, entrance to the university, success in the profession, etc. Particularly, the examination of the internal structure of a test or a scale becomes one of the most prominent psychometric processes within a validation procedure [2]. An understanding of a measure's underlying factor structure is necessary for several reasons: first, it is important in terms of content validity and the proper coverage of all content areas within a domain. Second, it is important in terms of its external validity and whether its sub-components (in case of a multidimensional construct) are differentially related to external criterion variables [3]. Third, it is important with regard to the interpretation of the obtained scores, when evaluating the generality vs. domain specificity hypothesis.
A scale's internal structure is also relevant to its reliability, by revealing which items are consistent with the content idea and the remaining items. The most popular index, Cronbach's [4] alpha estimates the extent to which all items measure the same construct. An important limitation of this index, however, is the precondition of tau-equivalency [5], in which all components are assumed to contribute equally to the same latent construct (i.e., equal factor loadings are assumed). This assumption is at times unrealistic and thus, when it is not met, alpha becomes a lower bound estimate of internal consistency reliability. Omega (ω) composite reliability [6, 7] is often advocated as an alternative, since it acknowledges the possibility of heterogeneous item-construct relations [8, 9]. It is computed using the item factor loadings and uniquenesses from a factor analysis whereas coefficient alpha uses the item covariance (or correlation) matrix [4, 10]. As such, coefficient omega is a more general form of reliability, since it conceptualizes reliability as the ratio of true-score variance to total observed score variance.
Another concept which potentially could cause serious implications to the construct validity of a testis fairness. Fairness refers to the extent to which a test is free from any kind of bias. Test bias might have considerable consequences at different levels of an assessment process (e.g., selection or admission), since it can lead to systematic errors that distort the inferences made in the classification and selection of individuals [11]. According to Millsap and Everson [12], test or item bias is associated with a systematic distortion of an instruments' properties due to an extraneous or irrelevant information that results in differential performance for individuals of the same level of the underlined trait but from different groups (e.g., ethnic, sex, cultural, or religious). There are three main methodological approaches in testing for item and test bias: (a) the Multiple-Group CFA (MGCFA), approach in which the relations between observed variables and latent construct(s) are tested for invariance between groups [13], (b) the Multiple-Indicators Multiple-Causes (MIMIC) modeling approach, in which a covariate exerts direct effects on both, the latent variable(s), and the factor indicators [14], and, (c) the Differential Item Functioning (DIF) approach via IRT, which involves matching members of the reference and focal groups on a measure of ability, and then probing for the differential behavior of items after accounting for ability [15].
Recently, the acknowledgement that phenomena are measured at different levels or spheres (e.g., person, neighborhood, county, city, provinces, etc.) has created the need to evaluate our measurement practices on how well they hold at the different levels of the analyses [16]. Particularly, recent advances in multilevel modeling (e.g., Multilevel Structural Equation Modeling—MLSEM) have proposed that patterns of relationships between factor indicators and latent variables may be different when taking into account the hierarchal (nested) nature of the data [17]. For example, when students are nested within classes, the factor structure of a scale might be different across the different levels of the hierarchy (i.e., student level compared to class level). Similarly, when testing for measurement invariance in a multilevel context (e.g., using MGCFA), the process becomes difficult or even unattainable when the levels in a grouping variable are many [18]. One way to overcome this problem is to treat group membership as a random effect (note that in MGCFA group membership is treated as fixed effect), and examine measurement invariance in a multilevel framework [19, 20]. According to Rabe-Hesketh et al. [21], multilevel structural equation modeling (MLSEM) is one of the most suitable methods to test for cluster bias.
The implications for including nesting in the examination of the internal characteristics of an instrument (i.e., factorial structure, internal consistency, and test bias), are tremendous when testing the scientific robustness of a tool. First, the developer tests whether a pre-defined set of relationships among latent variables and specific items is stable across levels [22]. Second, the developer investigates internal characteristics of the measure, and may identify factors that affect the content of the items making them to operate differently at the different levels of the analysis (e.g., scale items are homogeneous only at the between level while there is large heterogeneity at the within level).Third, the developer may identify exogeneous factors (e.g., gender, race, etc.) that are accountable for the operation of different simple structures at the different levels of the analysis. Finally, this statistical perspective helps the developer to examine whether the construct under investigation may have different interpretations at different levels of the analysis, with implications for both the operational definition of the construct and the utility of the obtained scores. For example, the presence of differential factorial structures at different levels in the analysis, has implications on how test scores are composed and interpreted [23]. Such findings have implications not only for theory development and falsification but also for measurement accuracy, with the latter being in the heart of the validation process of an instrument [24].
Important statistical considerations when conducting analyses that reflect a multilevel structure in the data need to be taken into account, as, otherwise, statistical violations can lead to misinterpretations regarding the obtained results [17]. For example, when students are nested within universities, the independence of observations assumption, is likely violated. This violation, has direct implications over the stability of parameter estimates as well as the inflation of the respective standard errors. Furthermore, estimating power when ignoring nesting can result in serious misjudgments (e.g., [25, 26]). In both cases, the consequences may be detrimental in terms of both model selection, stability of obtained solution, and the interpretation of the findings, particularly when different models are operative at different levels in the analysis.
Chan [27], further raised the issue of “isomorphism,” when researches investigate the internal structure of a measure. He argued that in most tests of construct validity using aggregate measures, it is assumed that the construct is structurally isomorphic (i.e., has an identical structure across different levels of the analysis), which is clearly a tentative assumption [28, 29]. This is a critical issue, because if isomorphism is assumed, but not justified by empirical evidence, then any results may reflect nothing more than methodological artifacts, random or systematic error of measurement [30].
The Need to Examine Factor Structures Using Multilevel SEM across Person and University Levels
The examination of a simple factor structure at the person (i.e., student) level of analysis constitutes the standard psychometric procedure in test validation [1]. However, the idea of testing the factor structure at a higher (e.g., university) level of the analysis needs to be justified. Previous studies have shown that a learning environment is directly related to students' performance [31]. Moreover, institutes that offer high quality academic environments in terms of curriculum, budget, infrastructure (e.g., libraries, labs, IT facilities, etc.), quality of academic staff, etc. tend to attract high skilled students, and consequently may have graduates that become more qualified professionals [32]. The emphasis of the present study is on how the psychometric qualities of a scale can be evaluated, when data have been collected through multistage sampling. Using MLSEM the extent to which the internal structure of a measure (i.e., the relationships among latent variables and items) varies at different levels of the analysis will be evaluated. Furthermore, multistage measurement invariance will be examined by use of the cluster invariance model, with the factor loadings being constrained to be equal across levels. At a next step, a ML-MIMIC model will be employed to test for gender invariance at the person level in the analysis. Last, indices of internal consistency reliability will be utilized at both person and university levels using indices applied to congeneric, rather than tau-equivalent, measures, as the former is likely the norm.
Materials and Methods
Participants
The sample comprised 1,696 students from 21 state universities across the country of Saudi Arabia. The mean number of participating students per university was 80.76 (range = 11–279, Median = 62.0, SD = 68.63). There were 1,631 (96.2%) males and 65 (3.8%) females. Among them, 140 (8.3%) were graduates, and 1,511 (89.1%) were senior students, with 45 (2.7%) failing to report that information. In terms of major of study, 70 (4.1%) students were studying architectural engineering, 175 (10.3%) chemical engineering, 423 (24.9%) civil engineering, 129 (7.6%) computer engineering, 402 (23.7%) electrical engineering, 146 (8.6%), industrial engineering, 303 (17.9%) mechanical engineering, while 48 (2.8%) failed to report their major. Last, with regard to the region of residence, 59 (3.5%) came from the Albaha region, 42 (2.5%) from the Aljouf region, 32 (1.9%) from the Almadinah region, 177 (10.4%) from the Alqasim region, 318 (18.8%) from the Asharqiya region, 102 (6.0%) from the Asir region, 66 (3.9%) from the Hail region, 15 (0.9%) from the Jezan region, 248 (14.6%) from the Makah Almokrmah region, 28 (1.7%) from the Najran region, 3 (0.2%) from the Northern Border region, 184 (10.8%) from the Riyadh region, and 73 (4.3%) from the Tabuk region. Again, 349 individuals (20.6%) failed to report residence information and were treated as missing at random.
Measure
The Professional Engineering Test (PrfEng; National Center for Assessment in Higher Education-NCA). This test was developed to examine basic competencies and fundamental engineering knowledge of engineers in Saudi Arabia. Meeting minimum passing levels in the exam is a requirement to be ranked an Associate Engineer and, an important prerequisite to obtain a work permit from the Saudi Council of Engineers for practicing the profession in the Kingdom. The test is composed of two parts: Ae General Engineering exam (containing 105 multiple-choice items) and an Engineering Discipline exam (containing 50 multiple-choice items). The General exam covers general engineering topics as well as relevant scientific skills. It assesses 9 skills: Communication (15 items), computer (8 items), personal (8 items), problem solving (7 items), development of cognitive performance (7 items), basic sciences and engineering fundamentals (42 items), engineering analysis and investigation (5 items), engineering design (6 items), and engineering practice (7 items). Each of the 6 discipline exams consists of 50 items. In the present study, only the general form of the PrfEng test is evaluated. For each item, 4 alternative responses are provided, coded either as 1 (correct) or 0 (incorrect). The study was conducted by the relevant governmental body which conducts National Examinations in Saudi Arabia. Ethical approval was obtained by a State Ethics Committee. All participants were informed that their responses would be utilized as part of a larger study to evaluate the psychometric properties of the measure. Completion of the test comprised their informed consent for their participation.
Data Analyses
Multilevel Structural Equation Modeling (MLSEM) was utilized to test the factor structure of the PrfEng test across person and university levels. MLSEM is particularly useful for testing diverse simple structures at different levels and tests are constructed to examine whether the parameter estimates at both levels of the analysis are consistent with theory and a priori predictions [33].
In MLSEM a population of individuals (e.g., students) is split onto groups (e.g., different universities) based on between person relevance that results in group belonging. Consequently, the total information is decomposed onto a between groups component (∑BETWEEN) and a within groups component (∑WITHIN) or in other words, a between groups covariance matrix SB and a within groups covariance matrix SW. Those matrices are then involved in the estimation of model parameters (e.g., factor loadings, variances and covariances) within and across groups. The main advantage of this method is that both parameter estimates as well as model fit are more accurate since the total sample variance-covariance matrix is decomposed onto a pooled within-group part and a between-group part [34, 35], avoiding potential biases due to the violation of the independence of observations assumption, likely introduced when ignoring clustering (e.g., the effects a university environment exerts on all students-causing a baseline between person correlation that reflects a systematic source of measurement error) [36]. Furthermore, it is possible to compare and contrast measurement and/or structural parameters at different levels of the analysis, such as if a covariance between two latent variables is different across levels. In relation to a CFA model with aggregate data with its variance covariance matrix being expressed as:
With Φ, and Θ the variance covariance matrices of the factor model and the respective errors, the respective matrices for the within and between levels of the analyses are as follows:
Which are a function of individual and cluster level units as follows, as per the basic CFA model:
With the responses of person i who belongs to cluster j being a function of a vector of intercepts ν and a vector of factor loadings on factor η at the within level plus some form of error of measurement ε. Similarly, the responses at the between level are modeled as a function of the between level intercepts, slopes and errors as shown below:
In a typical MLSEM, three steps are likely involved [19]. At a first step, one examines whether there is evidence that a measure should be modeled as a multilevel construct. This evaluation involved evidence from three different evaluative criteria, namely, the ICC, amount of variance in each level and design of effect index. The intraclass correlation coefficient (ICC) conveys the proportion of variance of the dependent variables that is explained by the clustering variable, or in other words the amount of variability that is between clusters. When ICCs are non-zero (e.g., >0.05), a multilevel model is justified [16, 35]. A second type of evidence comes in the form of statistically examining whether the between level variance and covariance estimates deviate significantly from zero [19]. This criterion involves comparing a Null Model (ΣBETWEEN = 0, ΣWITHIN = free) and an Independence Model (ΣBETWEEN = diagonal, ΣWITHIN = free). Poor fit of these two models indicates non-zero between level variance and covariance estimates [37]. A third criterion involves estimating an index termed the “design effect” index [38] which tests the presence of an autocorrelated structure due to clustering.
Besides the above prerequisite analytical tests, step two in the analysis, examines the factor structure of the measure at the within-group level only [17, 35, 37]. In step three, the measurement model established in step two is utilized to investigate its robustness by being present at the between level as well. In other words, the between-level factor structure in a two-level model is examined, with the within-level structure fully specified [16]. Maximum likelihood estimation with robustness to non-normality and non-independence of observations (MLR; [39]) is often the recommended practice and was also the preferred choice in the present paper.
In terms of model fit, several fit indices have been utilized: The chi-square (χ2) statistic and the related degrees of freedom (df), the Comparative Fit Index (CFI), the Tucker-Lewis Index (TLI), the Root Mean Square Error of Approximation (RMSEA), and the Standardized Root Mean Square Residual (SRMR). Generally speaking, CFI and TLI values greater than 0.90 are indicative of acceptable model fit (with values >0.95 being ideal; [16]). Furthermore, RMSEA and SRMR values up to 0.08 indicate a reasonable fit to the data, with values up to.05 pointing to the presence of excellent fit [40], termed “exact fit” based on MacCallum et al. [41]. Traditionally, a Chi-square test is applied to compare nested models, but it is well known that the test is sensitive to large sample sizes [42]1 and is over powered resulting in rejections of even well fitted models. Consequently, we deferred from relying on the chi-square test as the present sample was large. Instead, in the model comparison and evaluation phase information criteria namely, the Akaike Information Criterion (AIC) and the Bayesian Information Criterion (BIC) were also involved. When comparing competing models, AIC and BIC difference values Δi > 10 indicate very strong support for one model over another [43], or else that one model “fails to explain some explainable variation in the data” in relation to another model ([44], p. 71). Values between 0 and 2 show high resemblance between two competing models and difference values between 4 and 7 less so, but still substantial resemblance between tested models [44]. When Δχ2 tests were utilized (i.e., when comparing nested models), the Satorra-Bentler scaling correction was applied, since it provides more accurate estimates (approximates better the chi-square distribution under non-normality), with the use of the MLR estimator [45].
When examining measurement invariance in a multilevel context, invariance takes on different steps (for an extended description and corresponding formulae for each step of the analysis, see [19]). For example, when testing equality of factor loadings across levels, the cluster bias model is evaluated. If this model does not fit the data, then the pattern of factor loadings is considered invariant across clusters. This test is analogous to assessing configural invariance in MGCFA, in the absence of a multilevel context. If the cluster bias model fits the data well, then strong invariance is not met, although weak invariance may still hold. This test is analogous to satisfying metric invariance in MGCFA. Finally, according to Meredith [46] absence of cluster bias in a two-level MLSEM model is similar to strong invariance in MGCFA and is termed cluster invariance model. This latter model constraints factor loadings to be equivalent across levels and assumes no error variance at the clustering level.
To test for cluster bias, one fits the cluster invariance model which tests for the presence of strong invariance across clusters. If strong invariance is not satisfied (i.e., the factor loadings are not equivalent across levels), then the common factors do not have the same interpretation across levels [21, 47]. Evidently, the common factor scores at the clustering level cannot be interpreted as the simple cluster means of the person level common factor scores. Moreover, if the residual variance of a given indicator variable is greater than zero, then the indicator is affected by cluster bias.
The Multiple Indicator Multiple Causes (MIMIC) model [48] represents one alternative to testing for measurement invariance and population heterogeneity (e.g., [49]). The MIMIC model is composed of two parts: a measurement model and a structural model. The first examines the relations between a latent variable and its indicators (observed variables); the latter examines the direct effect of the covariates that represent group membership (e.g., gender) on factor means and/or factor indicators (items). A significant direct effect of the covariate on the factor suggests that factor means across groups are different at different levels of the covariate. Similarly, a significant direct effect of the covariate on an item of a scale indicates that the item mean is different at the different levels of the covariate, after controlling for the latent factor. The MIMIC model can easily be extended to a multilevel framework (MLMIMIC), where the effect of any independent variable is tested at the level of analysis that this variable belongs to. For example, in the present study, invariance across gender was of interest, consequently, gender was added as a covariate at the within level model2 [51]. Compared to the multi-group approach to testing invariance, the MIMIC model offers some advantages, assuming several strict prerequisite conditions are met. For example, by utilizing a full variance-covariance matrix rather than two separate matrices per group, power is enhanced [52]. However, the MIMIC model does not model intercepts and slopes of the measured parameters, as well as the residual variances, and consequently those are assumed to be equal across groups, which is equivalent to satisfying strict invariance. Only then should one introduce a covariate defining group membership to test the equivalence between groups on factor means and/or item intercepts. Data are modeled as above using within and between matrices with the addition of a vector Γ which includes covariates, and in the present case, with the covariate being at the within level in the analysis suggests that for example at the latent variable level, covariate X exerts direct effects included in the vector Γ plus some form of error ζ as shown below:
To test internal consistency across the different levels of the analysis, omega composite reliability has been implemented. Omega is conceptually similar to alpha, in that it represents the ratio of a scale's estimated true score variance relative to its total variance. Unlike alpha, however, omega acknowledges the possibility of heterogeneous item-construct relations and estimates true score variance as a function of item factor loadings (λi) in vectorΛ. Although there are many variations of omega index in the literature, the most popular formula for estimating it is the following [7]:
where,
λi = an item's factor loading (standardized)
θii = an item's error variance (standardized)
θij = the covariance between two error terms (if need to be modeled).
The estimation of empirically derived asymmetric confidence intervals of omega internal consistency reliability was implemented to enrich the point estimates of reliability for the following reasons: (a) estimated standard errors may be less informative [8, 53], and, (b) the distribution of omega values is not known and can probably be approximated using asymmetric confidence intervals [54, 55]. The present estimation utilized the logit transformation in order to normalize the distribution of point estimates of internal consistency using ẑ [8]. Initially omega is transformed onto a normal deviate estimate ẑin order to estimate a confidence interval of the form ([56–58]):
With the logit transformation of omega being:
And its estimate of standard error:
With za/2 being the two-sided level of significance for a given alpha level.
Finally, the level of significance for all analyses was set to a = 0.01, to be cognizant of the excessive power associated with the present sample size3.
Results
Descriptive statistics and inter-correlations among the subscales of the PrfEng are shown in Table 1. It is evident from these results, that there is no deviation from normality for any of the nine sub-scales of the PrfEng test. It should also be noted, that the unit of analysis in this study is not the item response, but rather the subscale score. We decided to work at the subscale level due to the complexity of the model and the large number of items (i.e., 9 latent variables and 105 item), which provided a not acceptable fit to the data. All analyses were conducted via Mplus 7.4. [61]. Appendix contains the Mplus input statements used to conduct the MLCFA analyses reported in this manuscript. No missing values of the main variables (i.e., PrfEng scale scores and university), were present, since non-attempted items were treated as incorrect responses. Previous findings suggested that this scoring strategy produces trivial effects on individuals' total performance when total scores are estimated (e.g., [62]).
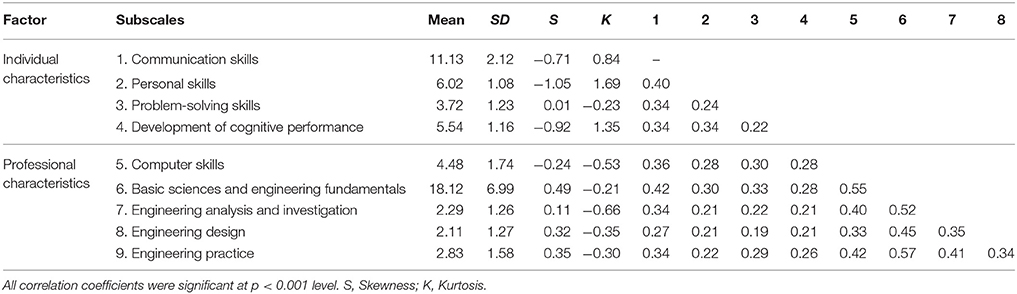
Table 1. Descriptive statistics and inter-correlations among the study variables.
Examining the Internal Structure of the Measure across Levels
First, a conventional confirmatory factor analysis model on the total covariance matrix (i.e., individual level) was performed to examine whether the hypothesized 2-factor solution fit the data well. Maximum likelihood estimation with robust standard errors was employed (MLR; [39]). Results showed that the 2-factor model (Figure 1) exhibited acceptable fit, suggesting it was a good approximation to the data [ = 247.619, p < 0.001; RMSEA = 0.071 (90% CI = 0.063–0.079); CFI = 0.939, TLI = 0.915; SRMR = 0.043].
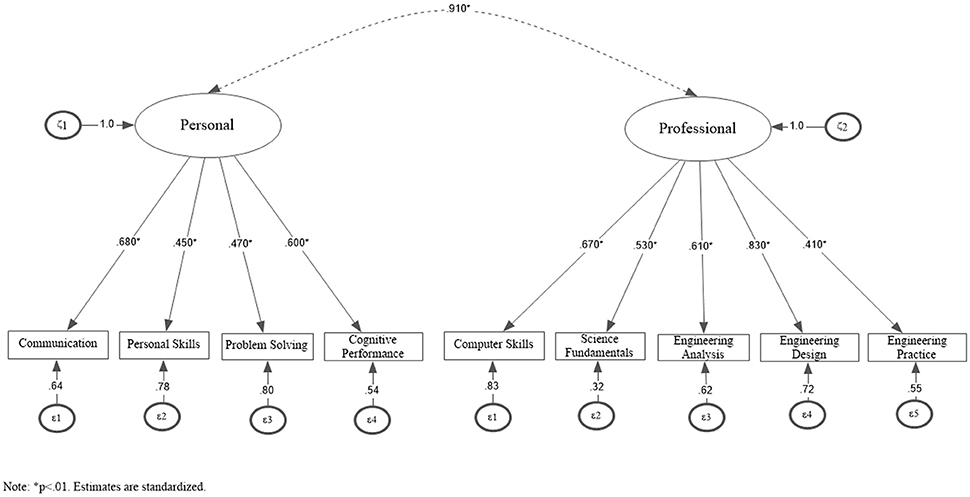
Figure 1. Two-factor simple structure of the PrfEng test at the aggregate level, ignoring nesting (N = 1,696).
After confirming the robustness of the factor structure at the person level, that same structure was tested at both levels via MLSEM. Prior to that modeling tests of prerequisite to multilevel modeling assumptions were tested. First, item variability using the ICCs was assessed. The ICC is the unexplained proportion of the variance by any predictors in the model, that can be attributed to the group level variable (university). It ranges from 0 (total independence of observations within clusters) to 1.00 (total dependency of the observations within clusters). The larger the ICC, the more individual differences are due to differences between clusters. Snijders and Bosker [63] suggested that for educational data, ICC values ranging between 0.05 and 0.20 are adequate and suggestive of the need to accommodate the variance at the cluster level (see also [64]). The ICC was estimated using the following formula:
where, between level variance, and with level variance
The results showed that all ICCs were greater than 0.05, suggesting the need to employ a between-level structure to the model (see Table 2).
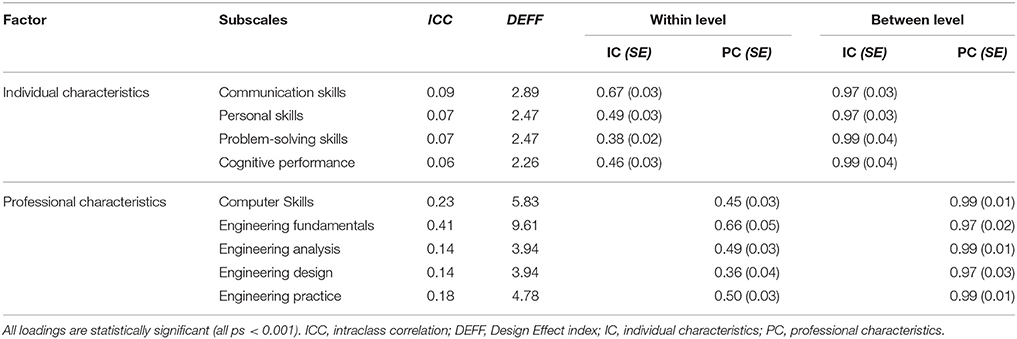
Table 2. Completely standardized factor loadings, intraclass correlation coefficients and design effect indices (N = 1,696).
A second approach involved testing whether the between-university level variances and covariances deviated significantly from zero (19). Fit indices of the Null Model, = 1,421.05, RMSEA = 0.134, CFI = 0.500, TLI = 0.199, SRMRWITHIN = 0.127, SRMRBETWEEN = 0.842, and the Independence Model, = 1,767.05, RMSEA = 0.1683, CFI = 0.370, SRMRWITHIN = 0.004, SRMRBETWEEN = 0.842, suggested that there are meaningful between-university level variances and covariances that warrant a multilevel modeling perspective.
A third approach involved assessing the “design effect” index [38], which targets at correcting the negative bias associated with nested data due to the violation of the independence of standard errors assumption. It contributes a multiplier that intents to correct standard errors. It is computed as follows:
with nc being the number of level-1 units that comprise the clustering variable.
As shown in the above equation the design effect is a function of both the number of units in the clustering variable but also the magnitude of the ICC. Values greater than 2.0 units are suggesting the need to model the autocorrelated structure that is due to nesting. Table 2 summarizes the results from all prerequisite analyses, which collectively suggested the need to use MLSEM. A last consideration related to the knowledge of the distributions of the outcome variables, which may deviate from expectations (i.e., the normal curve). Thus, to account for potential deviations from normality, robust standard errors were employed [65].
Results from the MLSEM showed that the two-level measurement model (2W-2B) fit the data well: [, N = 1,696 = 132.69, p < 0.001; RMSEA = 0.030, CFI = 0.971, TLI = 0.959; SRMR = 0.025 (within).019 (between)]. Consequently, the proposed 2-factor solution (individual characteristics—professional characteristics) was stable across levels of the analysis. Table 2 displays standardized parameter estimates from this solution across levels. Although the fit of the hypothesized model was acceptable, alternative, theoretically plausible competing models were tested, to examine whether they generate similar, or even improved predicted variance-covariance matrices [66]. Competing models involved: (a) one global latent factor at the within level and one global latent factor at the between level (1W-1B), (b) one global factor at the within level and two latent factors at the between level (1W-2B), and, (c) two latent factors at the within level and one global latent factor at the between level (2W-1B) (see Table 3).
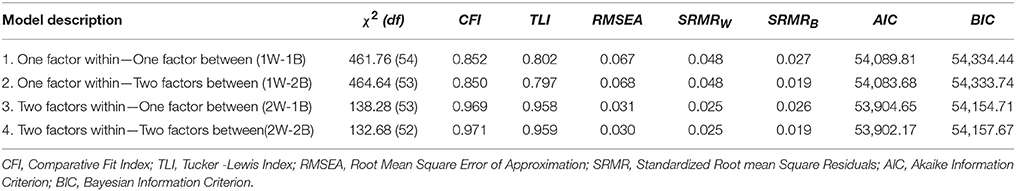
Table 3. Model fit for the tested multilevel models.
As shown in Table 3, the first two models (1W-1B and 1W-2B) did not provide a good fit to the data. The next model, examined a solution with two latent factors at the within level and one general latent factor at the between level (1W-2B)4. Results pointed to the presence of excellent model fit: [ = 138.28, p < 0.001; RMSEA = 0.031, CFI = 0.969, TLI = 0.958; SRMR = 0.025 (within).026 (between)]. When the 1W-2B model was contrasted to the 2W-2B model, results showed a marginal advantage over the latter model by use of a delta chi-square test [Δ = 4.38, p = 0.036]. Consequently, it was concluded that the 2W-2B factor model provided the best fit to the data in relation to any other competing model (see Figure 2).
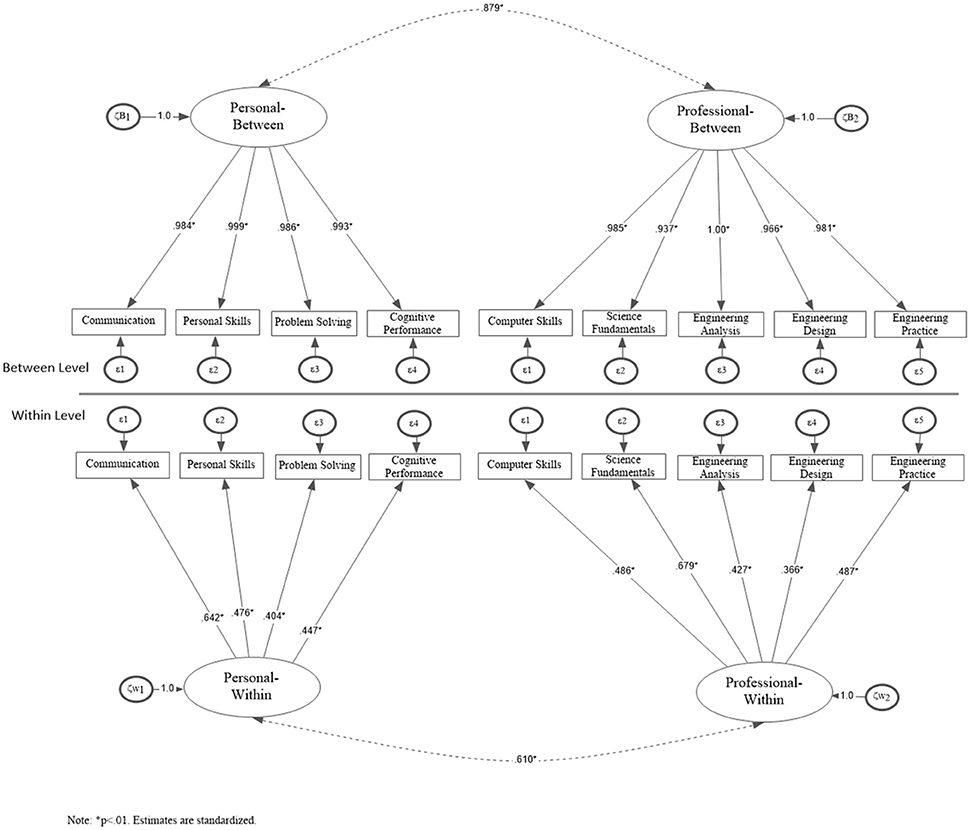
Figure 2. Two-factor structure fitted at both the person (within) and university (between) levels (Nw = 1696, Nb = 21).
Examination of the AIC and BIC information criteria partly confirmed the findings from the inferential analyses. Based on the AIC index, the less parsimonious model (2-factor model at the within and 2-factor model at the between level) provided better fit in relation to the 2W-1B model (AIC2W2B = 53,902.17, AIC2W1B = 53,904.65) and the opposite was true by use of the BIC index (BIC2W2B = 54,157.35, BIC2W1B = 54,154.71). These findings are not surprising knowing that AIC prefers larger models compared to BIC. However, the difference in absolute values of the information criteria was less than 10 units, suggesting strong resemblance in the fit of the two competing models (i.e., 2W-2B vs. 2W-1B) [43]. Consequently, the deciding factor on the optimal simple structure was theoretical consistency and ease of interpretation with the 2W2B model being selected as the preferred model.
Testing for Measurement Invariance Across Levels in the Analysis
Next, the model for cluster bias was tested; Initially, the cluster invariance model was applied, with the between- and within-level factor loadings constrained to be equal. Residuals variances at the between level were constrained to be equal to zero. Results showed that this model did not fit the data adequately: [ = 528.41, p < 0.001; RMSEA = 0.063, CFI = 0.833, TLI = 0.823; SRMR = 0.033]. Examination of model misfit by use of Modification Indices pointed to a discrepancy between the estimated residual variance of indicator fundam (i.e., Basic Sciences and Engineering Fundamentals subscale) and the constrained to zero estimate posited by the model. This indicator showed non-uniform cluster bias and overall only partial cluster invariance for the model [19]. Consequently, in order to satisfy cluster invariance, the fundam item residual variance was allowed free to vary. With that addition, the model was associated with improved model fit: [ = 244.11, p < 0.001; RMSEA = 0.039, CFI = 0.936, TLI = 0.931; SRMR = 0.028].
Additionally, a test of the cluster invariance model against a more general model, with no constraints in factor loadings was conducted. Using a chi-square difference test for nested models using MLR suggested that restricting the factor loadings was not necessary (Δχ2 = 24.09, for Δdf = 16, p = 0.088). The apparent conclusion from that testing was that factor loadings were in principle equivalent across levels, associated with meeting strong invariance. Next, the cluster invariance model (i.e., equal loadings across levels and no residual variances at the between level) was contrasted with the cluster bias model (i.e., equal loadings across model but freeing residual variance at the between level). The latter model exhibited also acceptable fit: = 244.11, p < 0.001; RMSEA = 0.039, CFI = 0.936, TLI = 0.931; SRMR = 0.028. To compare the two models, the difference chi-square procedure was utilized. Results showed that allowing a covariance between the residual factors at the between level did not improve model fit substantially (Δχ2 = 3.44, Δdf = 8, p = 0.904), suggesting that there was no cluster bias.
Invariance Across Gender
The Multilevel MIMIC model was employed to test for invariance by gender with the item means being regressed on a dummy gender indicator. Initially, a multi-group model using the procedures outlined by Kim et al. [20, 49] using mixture modeling to test for invariance of slopes and intercepts was tested. Results indicated that the difference between constrained and unconstrained solutions using the ΔAIC was only 8.736 units, suggesting high resemblance between models, as it did not exceed recommended cutoff values of 10 units [44]. Similarly, the chi-square difference test for these nested models was non-significant [ = 5.266, p = 0.628], thus, the assumption of strict invariance was met. Consequently, a dummy variable defining gender membership was added to the model exerting direct effects on both the factor and item means testing the null hypothesis that differences in means across gender are non-existent. These results are shown in Figure 3.
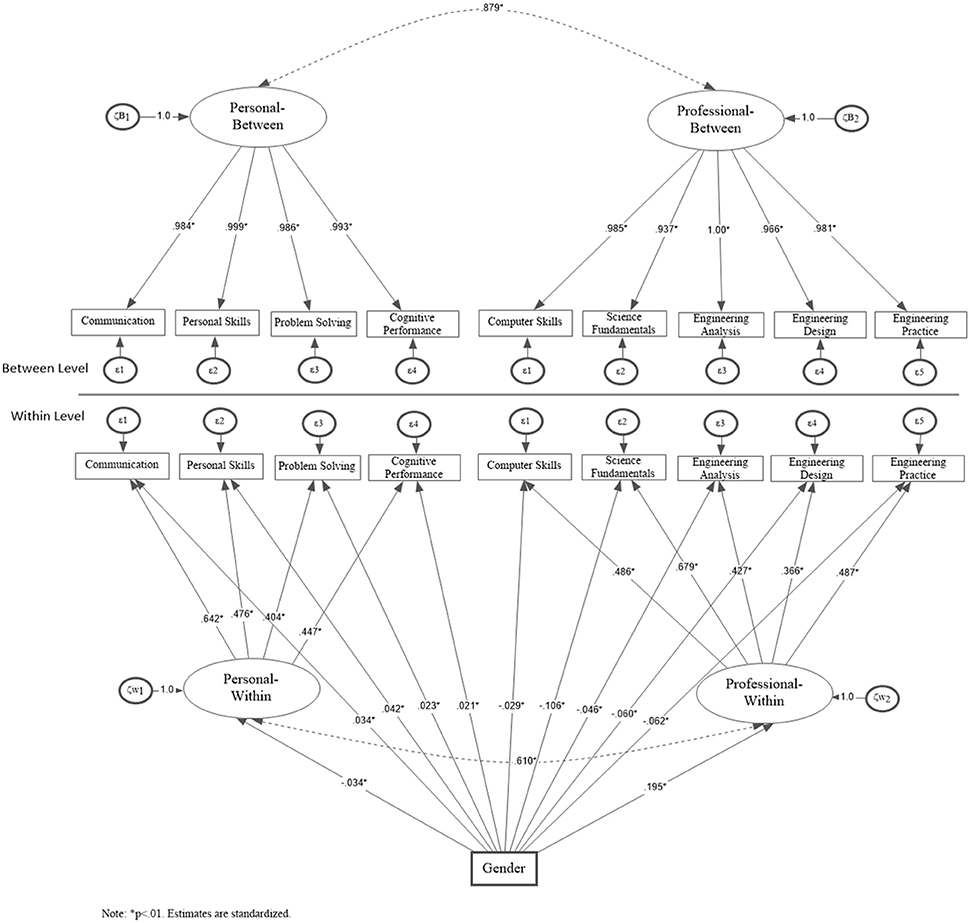
Figure 3. Multilevel MIMIC model for testing invariance across gender at the within part of the model (Nw = 1696).
Model fit of the Multilevel MIMIC model was excellent with descriptive fit indices being well above the 0.90 cutoff point (i.e., CFI = 0.962, TLI = 0.946), unstandardized residuals below 5% (RMSEA = 0.035) and, standardized residuals, SRMR = 0.025 at the within level and 0.031 at the between level). Significant differences between males and females were observed on the latent means and all indicators of professional and personal attributes (marked with a *). A positive sign suggests that levels were higher for males compared to females and the opposite was true for a negative sign. Interestingly, females had higher means on personal attributes and males on professional attributes across all subscales and, also the latent factor means (see Figure 3). Thus, gender non-invariance was evident at the within level model suggesting that the 2B2W was non-invariant across gender with levels of personal and professional traits differentiating the two groups. These differences were significant, despite the relatively small sample size5 for females, which could induce a Type-II error. However, the presence of significant differences is likely suggestive of true and robust differences, as these were manifested with a medium-powered test.
Estimating Internal Consistency Reliability across Levels
After establishing a robust factor structure across different levels in the analysis, researchers should then explore scale reliability. Given the clustered nature of the data analyzed, reliabilities may also differ depending on the level of interest [68] with the total reliability being the sum of the level reliabilities. To test whether internal consistency holds at both levels of analysis, the omega coefficient has been utilized. The results from this analysis are presented in Table 4 and suggest that internal consistency reliability was low at the person level suggesting significant amounts of error variance at the between persons, within universities level. On the contrary, the consistency across university units was high, as expected, because the person variability within a given university is collapsed to comprise one aggregate estimate. Specifically, the person estimates for professional and personal skills were 0.576 and 0.541 with 95% confidence intervals ranging between (0.499–0.664) and (0.477–0.614), which were by no means acceptable. The respective estimates of the two-factor solution at the university level were 0.971 and 0.986 with 95% confidence intervals ranging between (0.940–1.0) and (0.970–1.0), respectively. Nevertheless, the present analysis suggests that person scores may be more variable than expected and expected ability scores more variable than initially though (i.e., if estimated using aggregate data).
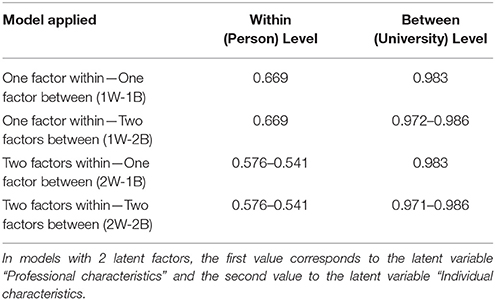
Table 4. Omega reliability coefficients for the tested multilevel models (N = 1,696).
Discussion
The main purpose of this study was to demonstrate how key qualities of a psychological measure (e.g., factor structure, measurement invariance, and internal consistency) are examined when data are nested within higher level units. Specifically, we utilized Multilevel Structural Equation Modeling (MLSEM) and Multilevel MIMIC models (MLMIMIC) to test whether: (a) one simple factor structure holds across levels (i.e., within- and between-) of the analysis, (b) cluster bias or strong measurement invariance are evident across levels, and, (c) invariance across gender at the person level by use of the Multilevel MIMIC model. Finally, we concluded with estimates of internal consistency reliability by use of omega composite reliability, assess levels of measurement error at different levels in the analysis.
Several researchers have posited the necessity of examining whether test's qualities are stable across different levels of analyses [16, 22, 23], since ignoring nesting may lead to inconsistencies and inaccuracies of the obtained estimates (e.g., due to violation of the independence of observations assumption) as well as theoretical misjudgments (e.g., concluding on a global simple structure when different ones are present at each level in the analyses). First, we run a CFA on the nine (9) subscales of the PrfEng scale, in order to establish a strong measurement model for the test under consideration. The results from this analysis revealed that a model with two distinct latent factors (i.e., professional vs. individual characteristics) best describes professional engineering qualifications. Subsequently, a MLSEM was utilized to examine the stability of these factor structures at the person and university levels. Initial findings demonstrated that the hypothesized framework (2-factor model) was reasonable with the present data and provided a good approximation of simple structure at both the person and university levels of the analyses. This model was superior in model fit in relation to any other competing model (e.g., a model with two latent factors at the within level and one general competency factor at the between level—see Table 3 for details on competing models).
We tested also the model for cluster bias, to detect violations of measurement invariance across clusters (i.e., universities). We compared whether the model with the invariant factor loadings and no residual variances at the university level provided better fit compared to: (a) a model with no constraints in factor loadings, and, (b) a model with equal loadings across model but with free residual variances at the between level (cluster bias model). The results from the first analysis showed that restricting the factor loadings resulted in a significant improvement in model fit. The results from the second analysis showed that allowing a covariance between the residual factors at the between level did not improve model fit, suggesting that there is no cluster bias. All findings pointed to the equivalence of factor loadings across levels, enabling meaningful and consistent interpretations of the latent traits. Results also pointed to the absence of cluster bias and a measurement model exhibiting strong invariance when contrasting person and university levels.
Next, we incorporated tests of measurement invariance at the within level (person) though evaluating the effects of gender by use of the Multilevel MIMIC model. Those results pointed to the presence of non-invariance and significant differences across gender on both measurement domains. Specifically, males had significantly elevated scores on professional attributes compared to females and the opposite held for the personal domain with females having elevated scores, compared to males. This finding pointing to an interaction between gender and traits would not be possible if measurement invariance was assumed rather than modeled. Thus, the multilevel MIMIC model had the sensitivity and power to decipher between gender differences using the within variance-covariance matrix only. This finding has important implications for professional selection and skill acquisition between males and females on the engineering domain although, as we suggest in the limitations section, we advise caution in the interpretation of these findings due to the unbalanced samples across gender.
Last, we examined internal consistency reliability across levels using omega composite reliability [55], a proper alternative to alpha when items are not tau-equivalent [7, 8]. Those results were striking pointing to the presence of diverse levels of precision at the person vs. the university level. Although that difference was expected due to the fact that the variance between persons which resides within a university is collapsed, it nevertheless points to the direction that person scores are not as reliably as initially thought. This finding has important implications for psychometrics and is discussed more thoroughly in the next paragraph.
The present study demonstrated that ignoring “nesting” in the data, may lead to inaccurate findings, data misrepresentations, and erroneous conclusions. Statistically speaking, the violation of independence of observations will be associated with smaller standard errors and inflated parameters. Theoretically speaking, ignoring nesting may lead to erroneous conclusions on the proper simple structure of an instrument and consequently misinform theory. For example, two alternative models fit the data equally well at the between level, the 1-factor and the 2-factor models. In the case of the one factor model the implications from the findings would be saliently different suggesting the presence of one global construct at the university level that describes “both” personal and professional attributes. This finding would be markedly different from the one we drew herein and if we had predictors at the between-level, those predictors would have different consequences. Thus, the use of multilevel modeling techniques in examining the internal structure of a scale by disattenuating measurement error and allowing for a proper disaggregation of variances and covariances at each level of analysis, provides a more advanced framework for assessing construct validity and leads toward a more accurately measure the constructs under study. Furthermore, the decomposition of the error of measurement onto within and between components has important implications on the evaluation of the precision of scores and the estimation of specific confidence intervals in that regard. For example, estimating 95% confidence intervals around person estimated scores would be markedly different if one uses the standard error of measurement estimated using aggregate data vs. within person data. Using the aggregate data indices of error of measurement are saliently deflated due to the reduced error observed at the university level. Thus, person scores appear more stable than how they actually are. This specific finding has important implications for score evaluation, decision making, normative score estimation, etc.
Limitations and Implications for Future Research
The present study has also certain limitations. For example, analyses were run at the subscale level rather than at the item level. This decision was due to the complexity of the theoretical framework of the scale (nine subscales) and the large number of items (105 items). As Floyd and Widaman [69] have noted: “It may be unreasonable to expect that lengthy questionnaires with many items assessing each factor will show satisfactory solutions when the individual items are submitted to confirmatory factor analysis” (p. 293). However, future studies could examine the stability of the PrfEng factor structure across different levels of analysis at the item level, by adopting appropriate techniques (i.e., parceling) to reduce the number of items.
Another limitation is the relatively small number of higher level units (i.e., university). As Maas and Hox [70] argued, a small number of higher level units may be associated with biased estimates of the higher-level standard errors, and unstable/biased estimates of the between and within level error variances and covariances. Many scholars have suggested that the number of higher level units should be at a minimum 30 or better 50 (e.g., [37, 71]); Others, however, have noted that 20 level-2 units suffice, especially if the number of participants within each cluster is relatively large [72]. In the present study, 21 higher level units (i.e., universities) were utilized with an average of 80.76 participants within each unit. Thus, since the number of higher level units is marginal, the findings may need to be interpreted with caution albeit the fact that the number of participants within each unit was pretty large. A third limitation is introduced by the unbalanced gender distribution, which is likely reflective of the choice across gender for the engineering subject matter. Consequently, caution is advised when interpreting the findings observed across gender. Future studies may further elucidate the role of gender by testing the invariance of the latent structure of the PrfEng Test across both within- and between- levels in the analysis.
In concluding, the results from the present study showed that the factor structure of the PrfEng test was the same across different levels of analysis although an alternative factor structure could be considered with achievement at the university level being defined using one global measure of skills. The present paper reflects an illustration of MLSEM and MLMIMIC methodologies as a means of testing invariance using nested data and can be extended to multiple levels, predictors at each level, assessments of population heterogeneity, and other. Consequently, multilevel SEM represents a promising venue for future research that can enrich our understanding of measured phenomena.
Author Contributions
IT and GS contributed to the study conception and design. IT conducted the data analysis and drafted the first version of the manuscript. GS and KA-H edited and provided critical revisions to the manuscript. GS conducted the MLMIMIC analysis. KA-H provided acquisition to the data, and contributed to the Method section.
Conflict of Interest Statement
The authors declare that the research was conducted in the absence of any commercial or financial relationships that could be construed as a potential conflict of interest.
Supplementary Material
The Supplementary Material for this article can be found online at: https://www.frontiersin.org/articles/10.3389/fams.2018.00003/full#supplementary-material
Footnotes
1. ^Fit indices are more sensitive to evaluating within-model misspecifications (i.e., models at the individual level) but less sensitive to between-model misspecifications (i.e., models at the group level) [37].
2. ^For alternative conceptualizations to measurement invariance such as the multi-group approach in multilevel structural equation modeling consult the work of Kim et al. [20] in which a mixture modeling approach is adopted to allow the decomposition of the variance-covariance matrix by group at the within level model (see also [50]).
3. ^The issue of excessive power has been greatly discussed by many colleagues (e.g., [59]). One of the recommendations put forth has been the downward adjustment of p-values for large sample sizes [60]. We have adopted this recommendation that typically involves alpha levels at 1% or 0.1%, but as Lin et al. [59] has pointed out there are no uniform criteria regarding this decision. Besides adjusting the alpha level, we also utilized recommendations regarding effect sizes for information criteria [43]. Collectively, both the alpha level adjustment and the use of effect size conventions of information criteria provided an informed decision regarding optimal model selection.
4. ^We decided to examine this model, since it is common the number of factors to differ at the different levels of the analysis, with fewer factors to emerge at the between level due to the fact that less variability is usually present across clusters than among individuals [16].
5. ^The sample size is not considered small as per the simulation study of Sideridis et al. [67] who found that sizes between 50 and 70 participants were associated with robust estimates of factor loadings and stable standard errors while also maintaining proper Type-I and Type-II errors.
References
3. Reise SP. Personality measurement issues viewed through the eyes of IRT. In: Embretson SE, Hersberger SL, editors. The New Rules of Measurement. Mahwah, NJ: Erlbaum (1999). p. 219–42.
4. Cronbach LJ. Coefficient alpha and the internal structure of tests. Psychometrika (1951) 16:297–334. doi: 10.1007/BF02310555
5. Joreskog KG. Simultaneous factor analysis in several populations. Psychometrika (1971) 36:409–26. doi: 10.1007/BF02291366
6. McDonald RP. The theoretical foundations of principal factor analysis, canonical factor analysis, and alpha factor analysis. Br J Math Stat Psychol. (1970) 23:1–21. doi: 10.1111/j.2044-8317.1970.tb00432.x
7. Raykov T. Estimation of composite reliability for congeneric measures. Appl Psychol Measur. (1997) 21:173–84. doi: 10.1177/01466216970212006
8. Padilla MA, Divers J. A comparison of composite reliability estimators: coefficient omega confidence intervals in the current literature. Educ Psychol Measur. (2016) 76:436–53. doi: 10.1177/0013164415593776
9. Raykov T. Scale construction and development using structural equation modeling. In: Hoyle RH, editor. Handbook of Structural Equation Modeling New York, NY: Guilford Press (2012). p. 472–92.
10. Guttman L. A basis for analyzing test-retest reliability. Psychometrika (1945) 10:255–82. doi: 10.1007/BF02288892
11. Zumbo BD. A Handbook on the Theory and Methods of Differential Item Functioning (DIF). Ottawa: Directorate of Human Resources Research and Evaluation, Department of National Defense (1999). Available online at: http://faculty.educ.ubc.ca/zumbo/DIF/handbook.pdf
12. Millsap RE, Everson HT. Methodology review: statistical approaches for assessing measurement bias. Appl Psychol Measur. (1993) 17:297–334. doi: 10.1177/014662169301700401
13. Vandenberg RJ, Lance CE. A review and synthesis of the measurement invariance literature: suggestions, practices, and recommendations for organizational research. Organ Res Methods (2000) 3:4–69. doi: 10.1177/109442810031002
14. Finch H. The MIMIC model as a method for detecting DIF: comparison with mantel-haenszel, SIBTEST, and the IRT likelihood ratio. Appl Psychol Measur. (2005) 29:278–95. doi: 10.1177/0146621605275728
17. Dyer NG, Hanges PJ, Hall RJ. Applying multilevel confirmatory factor analysis techniques to the study of leadership. Leadership Q. (2005) 16:149–67. doi: 10.1016/j.leaqua.2004.09.009
18. Selig JP, Card NA, Little TD. Latent variable structural equation modeling in cross-cultural research: multigroup and multilevel approaches. In: Van de Vijver, FJR, van Hemert DA, Poortinga Y, editors. Multilevel Analysis of Individuals and Cultures. Mahwah, NJ: Erlbaum (2008). p. 93–119.
19. Jak S, Oort FJ, Dolan CV. Measurement bias in multilevel data. Struc Eq Model. (2014) 21:31–9. doi: 10.1080/10705511.2014.856694
20. Kim ES, Kwok O, Yoon M. Testing factorial invariance in multilevel data: a monte carlo study. Struct Eq Model A Multidisc J. (2012) 19:250–67. doi: 10.1080/10705511.2012.659623
21. Rabe-Hesketh S, Skrondal A, Pickles A. Generalized multilevel structural equation modelling. Psychometrika (2004) 69:167–90. doi: 10.1007/BF02295939
22. Huang F, Cornell D, Konold T, Meyer P, Lacey A, Nekvasil E., et al. Multilevel factor structure and concurrent validity of the teacher version of the Authoritative School Climate Survey. J Sch Health (2015) 85:843–51. doi: 10.1111/josh.12340
23. Graham JW, Hoffer SM. Multiple imputation in multivariate research. In: Little TD, Schnable KU, Baumert J, editors. Modeling Longitudinal and Multilevel Data: Practical Issues, Applied Approaches, and Specific Examples. Mahwah, NJ: Erlbaum (2000). p. 201–18.
24. Wilson M. Constructing Measures: An Item Response Modeling Approach. Mahwah, NJ: Lawrence Erlbaum Associates, Inc. (2005).
25. Bliese PD, Hanges PJ. Being both too liberal and too conservative: the perils of treating grouped data as though it is independent. Organ Res Methods (2004) 7:400–17. doi: 10.1177/1094428104268542
26. Kenny DA, Judd CM. Consequences of violating the independence assumption in analysis of variance. Psychol Bull. (1986) 99:422–31. doi: 10.1037/0033-2909.99.3.422
27. Chan D. Functional relations among constructs in the same content domain in different levels of analysis: a typology of composition models. J Appl Psychol. (1998). 83:234–46. doi: 10.1037/0021-9010.83.2.234
28. Martin AJ, Malmberg L-E, Liem GAD. Multilevel motivation and engagement: assessing construct validity across students and schools. Educ Psychol Measur. (2010) 70:973–89. doi: 10.1177/0013164410378089
29. Zee M, Koomen HMY, Jellesma FC, Geerlings J, de Jong PF. Inter- and intra-individual differences in teachers' self-efficacy: a multilevel factor exploration. J Sch Psychol. (2016) 55:39–56. doi: 10.1016/j.jsp.2015.12.003
30. Mumford MD. Situations, interactions, and followers: the case of individualized leadership. In: Mumford MD, editor. Leadership: The Multiple-Level Approaches, Classical and New Wave. Stamford, CT: JAI Press. (1998). p. 421–8.
31. Kuh G, Hu S. The effects of student-faculty interaction in the 1990s. Rev Higher Educ. (2001) 24:309–32. doi: 10.1353/rhe.2001.0005
32. Aghion P, Dewatripont M, Hoxby C., Mas-Colell A, Sapir, A. The governance and performance of Universities: evidence from Europe and the US. Econ Policy (2010) 25:8–59. doi: 10.1111/j.1468-0327.2009.00238.x
33. McDonald RP, Marsh HW. Choosing a multivariate model: noncentrality and goodness-of-fit. Psychol Bull. (1990) 107:247–55. doi: 10.1037/0033-2909.107.2.247
34. Heck RH. Multilevel modelling with SEM. In: Marcoulides GA, Schumacker RE, editors. New Developments and Techniques in Structural Equation Modelling. Mahwah, NJ: Erlbaum (2001). p. 89–127.
35. Muthén B. Multilevel covariance structure analysis. Sociol Methods Res. (1994) 22:376–98. doi: 10.1177/0049124194022003006
36. Julian MW. The consequences of ignoring multilevel data structures in nonhierarchical covariance modeling. Struct Equ Model. (2001) 8:325–52. doi: 10.1207/S15328007SEM0803_1
38. Muthén BO, Satorra A. Complex sample data in structural equation modeling. Soc Methodol. (1995) 25:267–316. doi: 10.2307/271070
40. Hu L, Bentler P. Cutoff criteria for fit indexes in covariance structure analysis: conventional criteria versus new alternatives. Struct Equ Model. (1999) 6:1–55. doi: 10.1080/10705519909540118
41. MacCallum RC, Browne MW, Sugawara HM. Power analysis and determination of sample size for covariance structure modeling. Psychol Methods (1996) 1:130–49. doi: 10.1037/1082-989X.1.2.130
42. Bentler PM. Comparative fit indexes in structural models. Psychol Bull. (1990) 107:238–46. doi: 10.1037/0033-2909.107.2.238
43. Raftery AE. Bayesian model selection in social research. Sociol Methodol. (1995) 25:111–63. doi: 10.2307/271063
44. Burnham KP, Anderson DR. Model Selection and Inference: A Practical Information-Theoretical Approach. New York, NY: Springer-Verlag (1998).
45. Satorra A, Bentler P. A scaled difference chi-square test statistic for moment structure analysis. Psychometrika (2001) 66:507–14. doi: 10.1007/BF02296192
46. Meredith W. Measurement invariance, factor analysis, and factorial invariance. Psychometrika (1993) 58:525–42. doi: 10.1007/BF02294825
47. Muthén B. Means and Covariance Structure Analysis of Hierarchical Data. Los Angeles, CA: UCLA Statistics Series, #62 (1990).
48. Jöreskog KG, Goldberger AS. Estimation of a model with multiple indicators and multiple causes of a single latent variable. J Am Stat Assoc. (1975) 70:631–9. doi: 10.1080/01621459.1975.10482485
49. Kim ES, Yoon M, Lee T. Testing measurement invariance using MIMIC. Educ Psychol Measur. (2012) 72:469–92. doi: 10.1177/0013164411427395
50. Asparouhov T, Muthén B. Multiple Group Multilevel Analysis (Mplus Web Notes no. 16) (2012). Available online at: http://statmodel.com/examples/webnotes/webnote16.pdf
51. Kim SE, Yoon M, Wen Y, Luo W, Kwok O. Within-level group factorial invariance with multilevel data: multilevel Factor Mixture and Multilevel MIMIC models. Struct Equ Model. A Multidiscip J. (2015) 22:603–16. doi: 10.1080/10705511.2014.938217
52. Woods CM. Evaluation of MIMIC-model methods for DIF testing with comparison to two-group analysis. Multivar Behav Res. (2009) 44:1–27. doi: 10.1080/00273170802620121
53. Padilla MA, Divers J. Bootstrap interval estimation of reliability via coefficient omega. J Modern Appl Stat Methods (2013) 12:78–89. doi: 10.22237/jmasm/1367381520
54. Raykov T. A method for obtaining standard errors and confidence intervals of composite reliability for congeneric items. Appl Psychol Measur. (1998) 22:369–74. doi: 10.1177/014662169802200406
55. Raykov T. Analytic estimation of standard error and confidence interval for scale reliability. Multiv Behav Res. (2002) 37:89–103. doi: 10.1207/S15327906MBR3701_04
56. Raykov T, Marcoulides GA. Evaluation of validity and reliability for hierarchical scales using latent variable modeling. Struct Equ Model. (2012) 19:495–508. doi: 10.1080/10705511.2012.687675
57. Raykov T, Marcoulides GA. On examining specificity in latent construct indicators. Struct Equat Model. (2016) 23:845–55. doi: 10.1080/10705511.2016.1175947
58. Raykov T, Rodenberg C, Narayanan A. Optimal shortening of multiple-component measuring instruments: a latent variable modeling procedure. Struct Equa Model. (2015) 22:227–35. doi: 10.1080/10705511.2014.935927
59. Lin M, Lucas HC Jr, Shmueli G. Research commentary—too big to fail: large samples and the p-value problem. Inform Syst Res. (2013) 24:906–17. doi: 10.1287/isre.2013.0480
61. Muthén LK, Muthén BO. Mplus User's Guide. 7th Ed. Los Angeles, CA: Muthén and Muthén (1998–2015).
62. Clemens NH, Davis JL, Simmons LE, Oslund EL, Simmons DC. Interpreting secondary students' performance on a timed, multiple-choice reading comprehension assessment: the prevalence and impact of non-attempted items. J Psychoeduc Assess. (2015) 33:154–65. doi: 10.1177/0734282914547493
63. Snijders T, Bosker R. Multilevel Analysis: An Introduction to Basic and Advanced Multilevel Modeling. 2nd ed. Thousand Oaks, CA: Sage (2012).
64. Hayes AF. A primer on multilevel modeling. Hum Commun Res. (2006) 32:385–410. doi: 10.1111/j.1468-2958.2006.00281.x
66. Kline RB. Principles and Practice of Structural Equation Modeling. New York, NY: Guilford (2011).
67. Sideridis GD, Simos P, Papanicolaou A, Fletcher J. On the use of SEM for evaluating functional connectivity in the brain: sample size considerations Educ Psychol Measur. (2014) 74:733–58. doi: 10.1177/0013164414525397
68. Geldhof GJ, Preacher KJ, Zyphur MJ. Reliability estimation in a multilevel confirmatory factor analysis framework. Psychol Methods (2014) 19:72–91 doi: 10.1037/a0032138
69. Floyd FJ, Widaman KF. Factor analysis in the development and refinement of clinical assessment instruments. Psychol Assess. (1995) 7:286–96. doi: 10.1037/1040-3590.7.3.286
70. Maas CJM, Hox JJ. Sufficient sample sizes for multilevel modeling. Methodology (2005) 1:86–92. doi: 10.1027/1614-2241.1.3.86
71. Bell BA, Morgan GB, Kromrey JD, Ferron JM. The impact of small cluster size on multilevel models: a Monte Carlo examination of two-level models with binary and continuous predictors. In: JSM Proceedings, Section on Survey Research Methods. Vancouver, BC: American Statistical Association. (2010). p. 4057–67.
Keywords: multilevel structural equation modeling (MLSEM), nested models, multilevel reliability, construct validity, multiple indicator multiple causes model (MIMIC)
Citation: Tsaousis I, Sideridis GD and Al-Harbi K (2018) Examining Differences in Within- and Between-Person Simple Structures of an Engineering Qualification Test Using Multilevel MIMIC Structural Equation Modeling. Front. Appl. Math. Stat. 4:3. doi: 10.3389/fams.2018.00003
Received: 15 August 2017; Accepted: 12 January 2018;
Published: 02 February 2018.
Edited by:
Claudio Barbaranelli, Sapienza Università di Roma, ItalyReviewed by:
Gianmarco Altoè, Università degli Studi di Padova, ItalyMichela Balsamo, Università degli Studi “G. d'Annunzio” Chieti - Pescara, Italy
Copyright © 2018 Tsaousis, Sideridis and Al-Harbi. This is an open-access article distributed under the terms of the Creative Commons Attribution License (CC BY). The use, distribution or reproduction in other forums is permitted, provided the original author(s) and the copyright owner are credited and that the original publication in this journal is cited, in accordance with accepted academic practice. No use, distribution or reproduction is permitted which does not comply with these terms.
*Correspondence: Ioannis Tsaousis, tsaousis@uoc.gr