Coupling Power Laws Offers a Powerful Modeling Approach to Certain Prediction/Estimation Problems With Quantified Uncertainty
 Zhanshan (Sam) Ma
- 1Computational Biology and Medical Ecology Lab, Kunming Institute of Zoology, Chinese Academy of Sciences, Kunming, China
- 2Center for Excellence in Animal Genetics and Evolution, Chinese Academy of Sciences, Kunming, China
Power laws (PLs) have been found to describe a wide variety of natural (physical, biological, astronomic, meteorological, and geological) and man-made (social, financial, and computational) phenomena over a wide range of magnitudes, although their underlying mechanisms are not always clear. In statistics, PL distribution is often found to fit data exceptionally well when the normal (Gaussian) distribution fails. Nevertheless, predicting PL phenomena is notoriously difficult because of some of its idiosyncratic properties, such as lack of well-defined average value and potentially unbounded variance. Taylor's power law (TPL) is a PL first discovered to characterize the spatial and/or temporal distribution of biological populations. It has also been extended to describe the spatiotemporal heterogeneities (distributions) of human microbiomes and other natural and artificial systems, such as fitness distribution in computational (artificial) intelligence. The PL with exponential cutoff (PLEC) is a variant of power-law function that tapers off the exponential growth of power-law function ultimately and can be particularly useful for certain predictive problems, such as biodiversity estimation and turning-point prediction for Coronavirus Diease-2019 (COVID-19) infection/fatality. Here, we propose coupling (integration) of TPL and PLEC to offer a methodology for quantifying the uncertainty in certain estimation (prediction) problems that can be modeled with PLs. The coupling takes advantage of variance prediction using TPL and asymptote estimation using PLEC and delivers CI for the asymptote. We demonstrate the integrated approach to the estimation of potential (dark) biodiversity of the American gut microbiome (AGM) and the turning point of COVID-19 fatality. We expect this integrative approach should have wide applications given duel (contesting) relationship between PL and normal statistical distributions. Compared with the worldwide COVID-19 fatality number on January 24th, 2022 (when this paper is online), the error rate of the prediction with our coupled power laws, made in the May 2021 (based on the fatality data then alone), is approximately 7% only. It also predicted that the turning (inflection) point of the worldwide COVID-19 fatality would not occur until the July of 2022, which contrasts with a recent prediction made by Murray on January 19th of 2022, who suggested that the “end of the pandemic is near” by March 2022.
Introduction
A power law (PL) describes a non-linear functional relationship between two variables—one varies as a power of another (e.g., f(x) = axb) and has certain properties, such as scale invariance, lack of well-defined average value, and universality [1–4]. The scale invariance is exhibited by a simple log-transformation of PL into a straight-line (linear) on log-log scale {e.g., ln [f(x)] = ln (a) + bln (x)}, and it also specifies that all PLs with a particular scaling exponent are equivalent up to constant factors, e.g., f(cx) = a(cx)b = cbf(x)∝f(x). The lack of well-defined average value refers to a reality that arithmetic mean or average is a poor indicator for the majority of the power-law variables (e.g., the average income of a population that includes a billionaire). A PL usually has a well-defined mean only for a certain range of its scaling exponents, and the variance of PL seems disproportionally large and is frequently not well defined, which explains the association between PL phenomena and black swan behavior. This also makes many classic statistical methods that are based on the normal distribution and/or on the homogeneity of variance inapplicable to data of PL phenomena. The third property of PL is the universality that is to do with the scale invariance or the equivalence of PLs with a particular scaling exponent. In dynamic systems, diverse systems with the same power-law scaling exponents (also known as critical exponents) can exhibit identical scaling behavior and share the same fundamental dynamics as they approach criticality, such as phase transitions. Systems with the same critical exponents are classified as belonging to the same universality class [1–6].
Taylor's power law (TPL), first discovered by entomologist and ecologist L. R. Taylor [7] in investigating the spatial distribution of insect populations more than a half-century ago [5, 8–12], has been expanded far beyond its original domains of agricultural entomology and population ecology [1, 2, 5, 6, 13–19]. The TPL is one form of PLs that describe the distributions of a wide variety of natural and man-made phenomena over a wide range of scales [20–22]. PL patterns have been discovered/rediscovered in astronomy, biology and ecology, computer science, criminology, economics, finance, geology, mathematics, meteorology, physics, statistics, and especially in inter-disciplinary fields [3, 4].
Taylor's power law, as one of the most well-known PLs in ecology and biology, shares the three general properties of PLs mentioned above. It differs from other PLs in choosing its two variables: the mean (M) and variance (V) of population abundances (counts) [5, 7, 11], i.e.,V = aMb. It has also been rediscovered in many other fields beyond its original domain of population ecologies, such as epidemiology, genomics and metagenomics, and computer science [5, 6, 14, 15, 20–23]. It was extended to community ecology, especially the community and landscape ecology of human microbiomes [6, 23, 24]. In the present study, we take the advantage of TPL in modeling the relationship between mean and variance for quantifying the uncertainty of natural phenomenon. This should be feasible because variance is arguably the most commonly used statistic moment for characterizing the uncertainty (variation) of random variables. The approach is particularly advantageous if the distribution of random variable follows PL distribution, but it should still be applicable otherwise since TPL holds across a wide range of mean-variance relationships as signaled by a wide range of its scaling parameter (b).
Species-area relationship (SAR) is another classic PL in ecology, which relates the number of species (species richness: S) and the area (A) of species habitat, in the form of S = cAz. Ma [25, 26] further extended the SAR to a general diversity-area relationship (DAR) by replacing species number (richness) with the general diversity measured in Hill numbers. Ma [25–27] further introduced PL with exponential cutoff (PLEC) model to describe DAR and proposed the concept of maximal accrual diversity (MAD). Based on the PLEC model for DAR, Ma derived the estimation of MAD. MAD can be considered as a proxy of potential (dark) diversity, which includes both local diversity and the portion of diversity that are absent locally but present regionally (or in regional species pools). In other words, potential diversity measures both visible and invisible (dark) diversities and is of obvious significance for biodiversity conservation. Similar to SAR/DAR, there is so-called species-time relationship (STR) or diversity-time relationship (DTR) [26]. The PLEC version of DTR was successfully applied to predict the inflection points (tipping points) of COVID-19 infections [28].
Power law with exponential cutoff, as a variant of PL, has more general applications beyond the abovementioned SAR/DAR/STR/DTR/COVID-19 predictions [25–28]. PL behaves (grows or declines) exponentially, especially at late stages, and the PLEC possesses an exponential cutoff parameter that ultimately tapers off the unlimited growth or decline ultimately. Therefore, the PLEC model is of important practical significance when prediction or estimation is needed. However, existing PLEC modeling can only provide point estimation and not the interval of the estimation (i.e., uncertainty quantification of the estimation).
The present article is aimed to integrate the TPL with the PLEC model with the objective to improve the predictive power of the PLEC model by quantifying the uncertainty of estimation (prediction) with TPL. Specifically, by harnessing the capacity of TPL in estimating the variance (SD), we develop an approach to offering CIs for the estimation of PLEC quantities (see Figure 1). We demonstrate our method with the estimations of potential American gut microbiome (AGM) diversity and COVID-19 fatalities. The demonstrated approach can be potentially suitable for a predictive mathematical model as long as the variance and mean of its dependent variable can be quantified with the TPL model.
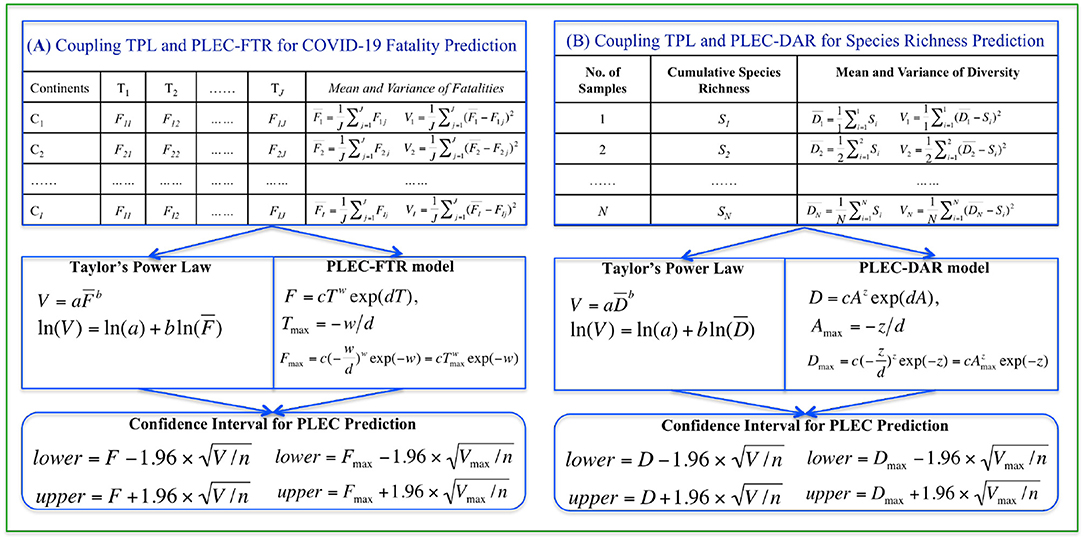
Figure 1. A diagram illustrating the coupling of TPL and PLEC models: for predicting COVID-19 fatality [(A) the left block] and American gut microbiome diversity [(B) the right block]. The top pair of boxes in both case studies illustrates the format of input data, the middle boxes specify the power law models, and the bottom boxes list the formulae for computing the CIs.
Materials and Methods
Taylor's Power Law
Compared with other PLs, TPL has two somewhat unique characteristics, both of which are determined by the two variables (variance and mean) it aims to quantify. The first is that its scaling parameter (exponent) that measures the population (community) spatial heterogeneity or temporal stability. This has to do with the fact that the variance (V) to mean (M) ratio (V/M) is a measure of the dispersion of data points (population abundances or counts), while dispersion, aggregation, and heterogeneity essentially characterize the same or similar system properties [6, 16]. For example, the TPL scaling parameter (b) can be used to measure heterogeneity at population, community, and landscape levels, respectively, depending on the level, the TPL model is constructed. The second characteristic of TPL is also related to the variance and mean: the relationship can be utilized for designing sampling schemes since the variance (level of variation or heterogeneity) determines the sampling efforts (sample sizes) necessary for estimating the population (species) abundances reliably {e.g., [12, 17]}. We take the advantages of TPL in this study to improve the quality of prediction/estimation because variance or SD is the foundation for computing CI of estimation.
Taylor's power law is one form of PLs, and it establishes the relationship between the variance and the mean of a random variable Y (e.g., population counts or abundances of biological populations) as a power function:
where V and M are the variance and mean of random variable Y; a and b are the parameters that can be estimated by fitting TPL to the variance-mean pairs of a series of spatial or temporal samples of populations. TPL can be fitted by a simple log-transformation {e.g., [5, 7]}, which generates:
Alternatively, non-linear optimization techniques, such as Marquardt's algorithm [29] or Simplex optimization [30], can be used to fit TPL directly (i.e., Eq. 1). However, log-transformed linear fitting (Eq. 2) may actually have an advantage from the perspective of scale-invariance as mentioned in the introduction section previously.
Ma [23] extended TPL to the community level by specifying Y as species abundance, M as the mean species abundance (size) per species in a community, and V is the corresponding variance. By regressing V-M across a series of communities (samples), one obtains type-I TPL extension (TPLE) for community spatial heterogeneity and type-II TPLE for community temporal stability. Similarly, there were type-III for mixed-species spatial heterogeneity and type-IV for mixed species temporal stability. The four TPLEs have the exactly same mathematical form as the original TPL [1] and [2], but the variables and parameters are defined and interpreted differently. Taylor [5] conjectured that TPL is only applied to integers, such as population counts (abundances), and it works poorly for ratios and very poorly for bounded ratios.
In this study, we take the advantages of TPL/TPLEs to estimate variance (V) corresponding to mean (M). The variance or its squared root (SD) provides necessary quantities for estimating CIs of PL or PLEC models as introduced below.
Power Law With Exponential Cutoff Model
Power law with exponential cutoff is a variant of PL model, and it was initially used to extend another classic PL in ecology, i.e., the SAR [31, 32]. The PL model for SAR is:
where S is the number of species and A is the area of habitat occupied by S species.
Ma [25] extended the SAR to the general DAR by replacing the species richness (number of species) with general biodiversity (in Hill numbers).
where qD is diversity measured in the q-th order Hill numbers, A is the area, and c and z are parameters.
The PLEC model for DAR is:
where d is a third parameter (taper-off parameter) and should be negative in DAR scaling models, and exp(dA) is the exponential decay term that eventually overwhelms the PL behavior at a very large value of A. The PLEC was originally introduced to SAR modeling by Plotkin et al. [33] and Ulrich and Buszko [34] (also see [35]), and Ma [25] extended it to DAR.
Ma [25] further derived the asymptote of the PLEC model and termed it as the MAD or potential diversity.
qD may have a maximum in the following form:
There are similar STR and corresponding DTR [27, 32]. STR/DTR has the exactly same PL/PLEC models as SAR/DAR described previously, but the data used to fit the models are different and so do the model parameters [27]. As further explained in the next sub-section, the fitting of PLEC can be performed with non-linear optimization, although log-transformed linear fitting, similar to fitting of TPL, can be used.
Ma [28] adapted the STR/DTR model to predict the inflection (turning) points of COVID-19, in which maximal accrual or potential diversity is equivalent to maximal infection numbers. In STR/DTR modeling, a convention is to use parameter w in place of the z of SAR/DAR as a diversity-time scaling parameter.
In the present study, we used the PLEC-DAR model to demonstrate the prediction of gut microbiome diversity and the PLEC-DTR model to demonstrate the prediction of COVID-19 fatalities, both augmented by the TPL model to get their CIs, as outlined below:
Coupling TPL and PLEC Models for Predicting the Interval of COVID-19 Fatalities
Here, we outline the integration of TPL with PLEC for predicting the interval of COVID-19 fatalities as following steps (also see Figure 1).
Step (i) Use the PLEC model (Eq. 5), adapted for fitting the fatality-time relationship (FTR) datasets as follows, i.e.,
where T is the time in days, and F is the fatality, c, w, and d are PLEC-FTR parameters. When the taper-off effects of parameter d is usually rather weak before the fatality numbers reach the peak, it is reasonable to treat w as an approximation to the fatality growth rate and c as an approximation to the initial fatality number. To fit PLEC-FTR model (Eq. 8), we adopted a non-linear optimization algorithm implemented as an R function “nlsLM” in R package “minpack.lm” (https://www.rdocumentation.org/packages/minpack.lm/versions/1.2-1/topics/nlsLM) [36]. Since Tmax > 0 is a necessary condition for the PLEC model to be biomedically sound, a constraint d < 0 was imposed for the non-linear fitting of the PLEC-FTR model.
Step (ii) Compute maximal accrual fatality (MAF) number using eqns. [6] and [7], adapted as:
Step (iii) Use TPL model (Eq. 1) for fitting the spatiotemporal aggregation (heterogeneity) of fatality numbers, i.e., adapting the original TPL (Eq. 1) as the following TPL for fatality aggregation:
where is the mean fatality number of COVID-19 and V is the corresponding variance; a and b are the parameters. Parameters a and b are estimated by fitting Eq. [11] to spatiotemporal data of COVID-19 fatality, using the same scheme/procedures as used for fitting TPL to COVID-19 infection numbers [28].
Step (iv) Compute the variance (V) and SD () based on Eq. [11] for fatality (F) (Eq. 8) or MAF (Fmax) (eqn. 9).
Step (v) Compute the lower and upper limits of 95% CI of COVID-19 fatality with the following pair of equations:
where n is the number of time points that correspond to F or Fmax in (eqns. 8 and 9).
With eqns. (12a) and (13a), one can obtain the CI of COVID-19 fatalities at any time (day) points; alternatively, with eqns. (12b) and (13b), one can obtain the CI of maximal accrual of COVID-19 fatality.
When Fmax cannot be predicted (too early to predict), the PL model for FTR can be used to complete the above procedures for estimating the intervals of F, i.e., by setting d = 0, there is a PL model for F = cTwexp(dT) = cTw.
Coupling TPL and PLEC Models for Predicting the Gut Microbiome Diversity
Similar to the previous integration of TPL and PLEC for estimating the CIs of COVID-19 fatalities, here we specify the procedures for predicting the Cis of AGM diversity (also see Figure 1).
Step (i) Use PLEC model (Eq. 5) for fitting the DAR datasets, i.e.,
where A is the number of individuals, and qD is the AGM diversity in Hill numbers, c, z, and d are PLEC-DAR parameters. To fit the PLEC-DAR model, we use the same non-linear optimization procedures as described previously for COVID-19 fatality prediction.
Step (ii) Compute MAD number using eqns. [6] and [7].
Step (iii) Adapt the TPL model (Eq. 1) for fitting the mean diversity and variance relationship:
where is the mean diversity (Hill numbers) of AGM and V is the corresponding variance; a and b are the parameters. Parameters a and b are estimated by fitting Eq. [15] to AGM diversity data, using the same scheme/procedures as described above for COVID-19 fatality prediction.
Step (iv) Compute the variance (V) and SD () based on Eq. [15] for diversity (D) (Eq. 5) or MAD (Dmax) (eqn. 7).
Step (v) Compute the lower and upper limits of 95% CI of diversity with the following pair of equations:
where n is the number of samples corresponding to D (Eq. 5) or Dmax (Eq. 7). With eqns. (16a) and (17a), one can obtain the CI of diversity at any diversity accrual points; alternatively, with eqns. (16b) and (17b), one can obtain the CI of maximal accrual of diversity in Hill numbers.
When Dmax cannot be predicted (too early to predict), the PL model for DAR can be used to complete the above procedures for estimating the intervals of D, i.e., by setting d = 0, there is a PL model for D = cAzexp(dA) = cAz.
Results
Coupling TPL and PLEC-FTR for Predicting the Intervals of COVID-19 Fatalities
The worldwide COVID-19 fatality numbers are available from the following website (https://github.com/CSSEGISandData/COVID-19) managed by Johns Hopkins University. Since the objective of this study was to demonstrate the feasibility of the coupling PL approach, we only extracted continent-level data for demonstrative purposes. For the country-level predictions, which are too extensive to cover in this article, we have another separate report.
Figure 1A illustrates the procedures to predict COVID-19 fatality, and Table 1 lists the predictions for six continents and the whole world. The PLEC modeling succeeded in all continents and the world, except for Asia. The failure in Asia should be that the new wave of the outbreak in India was still too early to foresee the turning point of fatality, as discussed in Ma [28] for the similar prediction of COVID-19 infections.
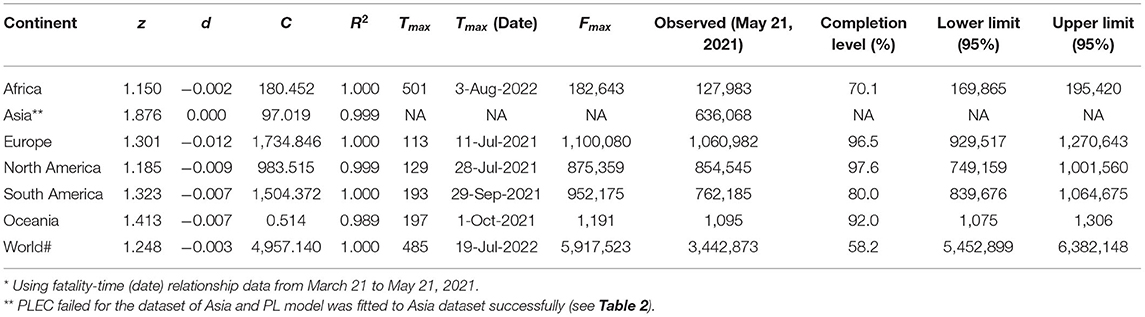
Table 1. The power law with exponential cutoff for fatality-time relationship (PLEC-FTR) model fitted with nonlinear optimization for daily cumulative counts of COVID-19 fatality, augmented with Taylor's power law (TPL) to obtain the 95% CIs*.
In Table 1, the first five columns are self-evident given they are simply the PLEC-FTR parameters. The next three columns are the predictions by the PLEC model, the MAF (number) (Fmax), and the days (Tmax) (Julian days or Calendar date) at which Fmax occurs. The next column is the actual fatality numbers at May 21, 2021, which happened to be the date we had completed the modeling work of this study, and which was listed to allow for a quick and rough reality check. The next column is the “completion level”—the percentage of past fatality over MAF (Fmax). The last two columns are the novel contribution of this study, i.e., the lower and upper limits of predicted fatality numbers, which are not possible without the coupling of both the PLs (TPL and PLEC-FTR models).
Table 2 lists the fatality prediction for Asia based on the PL-FTR model, for which the PLEC model was failed. The predictions of the PL model should be treated with caution and are only of a rough reference value. As explained previously, when the PLEC-FTR modeling efforts fail, it is usually that the outbreak is still in early stage and there are not yet sufficiently long time-series datasets to allow for the fitting of the PLEC model. Although the PL-FTR model can be fitted in these cases, the predictions from the PL model are not sufficiently reliable.
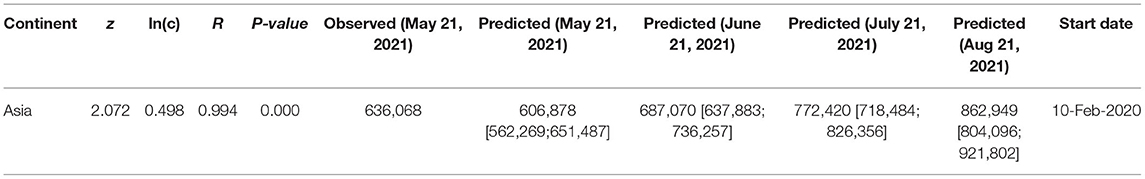
Table 2. The power law for fatality-time relationship (PL-FTR) model fitted for the daily cumulative counts of COVID-19 fatality, augmented with Taylor's power law (TPL) to obtain the 95% CIs.
Similar to the predictions of COVID-19 infections [28], there are some standard pre-processing procedures to take before fitting the PLEC-FTR to the fatality-time (day) datasets. For example, proper selection of starting point by truncating early data points (possibly including whole previous pandemic waves) could be necessary for successful model fitting. In fact, the fitting results presented in Table 1 are obtained by setting the starting date for modeling on March 21, 2021 (until May 21, 2021). As discussed in detail by Ma [28], the selection of starting points does not influence the correctness of prediction since the infection (or death) numbers before truncation points are accumulated and treated as new starting infection (fatality) numbers for model-building.
Figure 2 displays the fitting of the TPL model to the COVID-19 fatality datasets, and the TPL parameters are used to compute the CIs for the fatality number prediction from the PLEC-FTR model. Figure 3 displays the predicted COVID-19 fatalities based on the results, which are listed in Table 1.
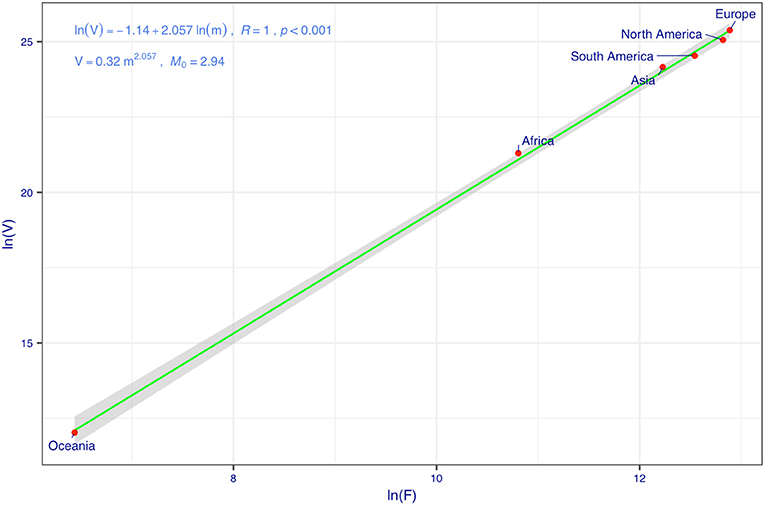
Figure 2. Taylor's power law (TPL) model for the cumulative counts of COVID-19 fatalities: the variance corresponding to the mean fatality (F) is used to compute the SE and width of CI.
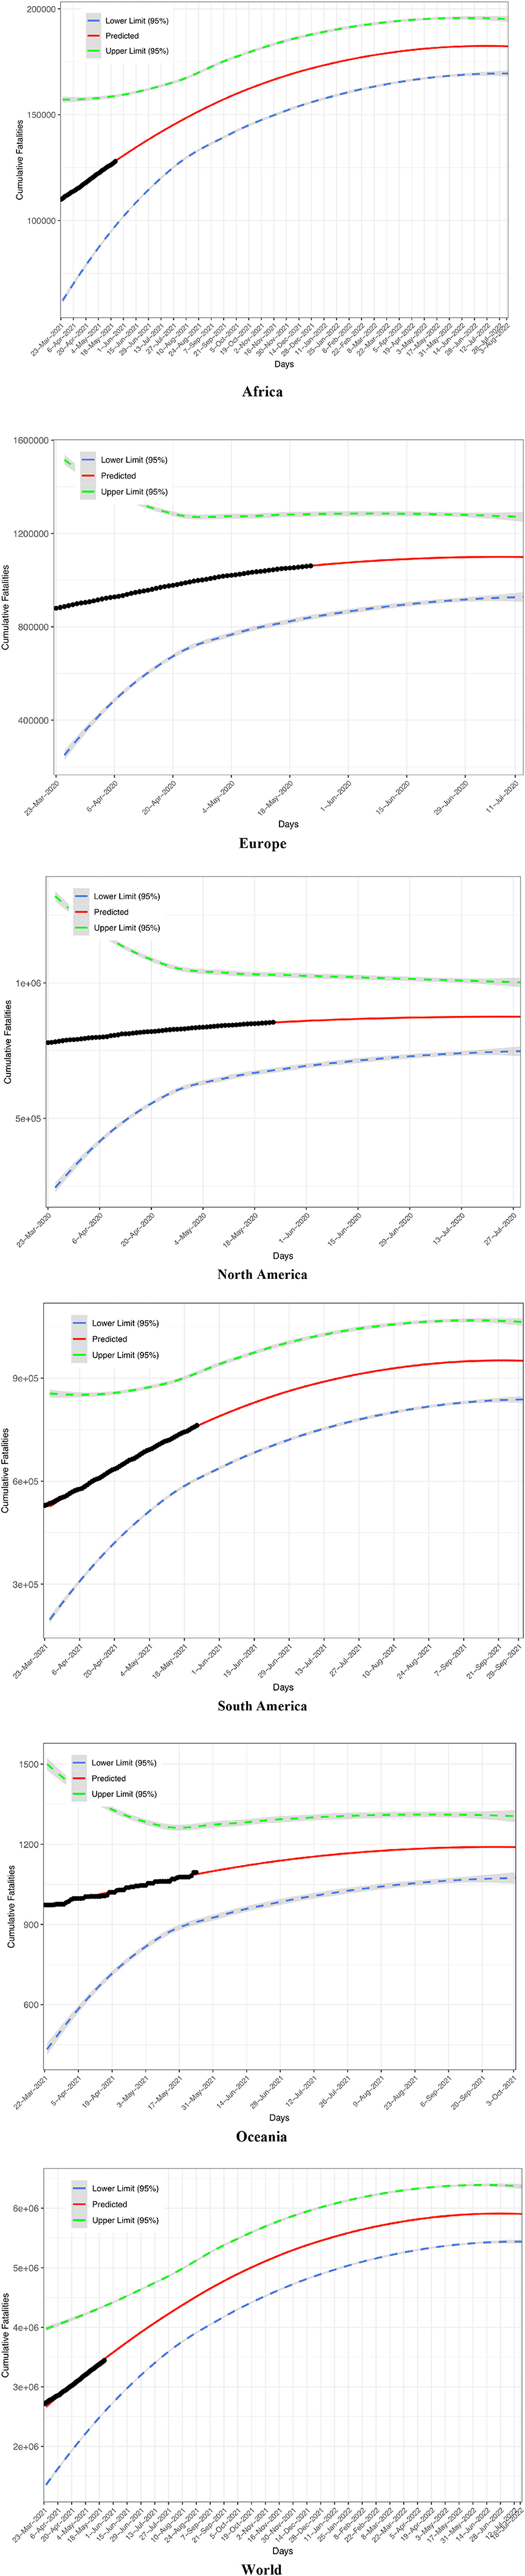
Figure 3. Predicted fatality number (solid curve in red), lower and upper bounds (dashed lines), and observed fatality number (solid cycles in black) for five continents and the world: Africa, Europe, North America, South America, Oceania, and the World.
Coupling TPL and PLEC-DAR for Predicting the Intervals of Gut Microbiome Diversity
Figure 1B shows the procedures for integrating the TPL and PLEC-DAR PL models for estimating the CIs of AGM diversity. The AGM datasets used to perform this demonstration are available for downloading in the public domain (http://americangut.org).
Table 3 exhibits the results from implementing the coupled TPL and PLEC-DAR modeling analysis. The first five columns in Table 3 are simply the parameters of the fitted PLEC-DAR model for the AGM datasets, and the last four columns are simply the predicted MAD (species richness) of the AGM, i.e., the maximal accrual species richness (Dmax) and the lower and upper limits of Dmax. Amax is the number of individuals (sample sizes) at which the Dmax is reached. Given that the samples of 1,473 individuals are used to build the PLEC-DAR model, and the Amax implies that 533 (=Amax − 1,473, where Amax = 2,006, see Table 3) additional individuals are required to accumulate the maximal accrual species richness in the AGM cohort or population. Figure 4 illustrates the fitting of the TPL model, which helps the estimation of the 95%-level CIs of Dmax. Figure 5 illustrates the predicted species richness (Dmax) (the solid curve in red color) and its CI (dashed lines) and the observed species richness (the solid dots in blue color).
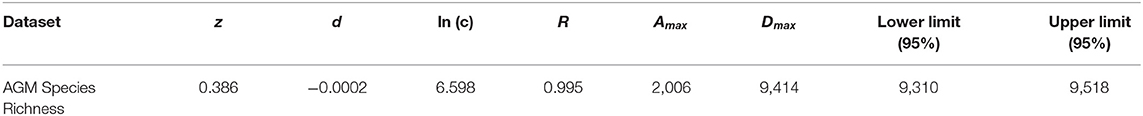
Table 3. The power law with exponential cutoff for diversity-area relationship (PLEC-DAR) model fitted with 1,000 times of re-sampling of the American gut microbiome (AGM) datasets consisting of 1,473 AGM samples, augmented with Taylor's power law (TPL) to obtain the 95% CIs.
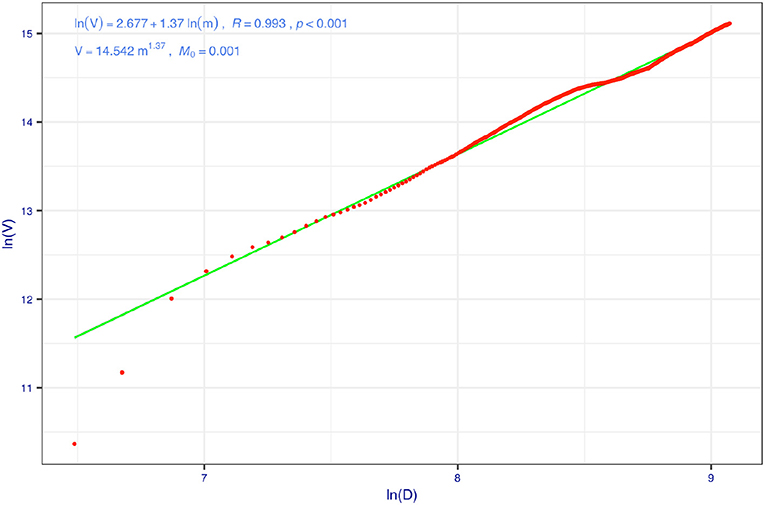
Figure 4. Taylor's power law (TPL) model for the cumulative species richness of American gut microbiome (AGM) data set (the 100 times of re-sampling were used to fit 100 PL models, and here is one example): for each time of re-sampling, there are 1,473 pairs of variance/mean of species richness, computed for each step of diversity-area relationship (DAR) accumulation.

Figure 5. Predicted species richness (solid curve in red color) of American gut microbiome (AGM) that includes lower and upper bounds (dashed lines) and observed species richness (solid tiny circles in blue color).
Numerous mathematical models have been produced to forecast the future of COVID-19 epidemics, but models are not crystal balls for predictions [37]. In particular, estimates from models about COVID-19 can contribute to uncertainty and anxiety to the public, lowering uncertainty can be helpful for alleviating possible anxiety accordingly. Jewell et al. [37] argued that short-term prediction can be critical for assisting the planning, but it is usually less productive to focus on long-term “guesses” for such purposes. The demonstrated application of the coupling PLs can lower the uncertainty of fatality prediction, besides being particularly simple and effective for short term (e.g., one epidemic wave of a pandemic) forecasting.
There are many alternative models to our proposed approach. For example, Li et al's [38] editorial introduces a series of 34 articles, published in the journal “Frontiers in Physics”, on COVID-19 predictive modeling covering models/methods from classic Susceptible, Infectious, and/or Recovered (SIR) model and the associated reproductive number of the SIR to Gaussian model for the time evolution of the first corona pandemic wave. The Gaussian model is arguably the simplest analytically tractable model that allows for quantitative prediction of the time evolution of infections and fatalities during a pandemic wave. It can be rather challenging to compare and evaluate specific models, although rigorously evaluations and validations of model predictions are critical for their applications. For this, we feel it is beyond the scope of this article to compare our method with the existing models, especially those for COVID-19 predictions. On the other hand, we would like to present a brief discussion on the general strategy for building mathematical models in the section “Conclusions and Discussion.”
Before concluding this subsection, an interesting phenomenon regarding the applications of artificial intelligence (AI) and machine learning (ML) to COVID-19 predictions seems to be worthy of particular notice. Vytla et al. [39] reviewed a slightly surprising phenomenon: the prediction of the COVID-19 pandemic is described as “the kryptonite of modern AI” and many predictions “by AI and ML are neither accurate nor reliable.” The failure of AI can be due to an array of factors, and most prominent includes the lack of sufficient historic data to train AI models and the low quality of big data, often collected from social media. Even though the “garbage-in-garbage-out” is a well-known trap to modelers, the failure of AI models for COVID-19 predictions just reminds us that AI or ML is not an exception. In fact, the failure of big data in predicting epidemics occurred prior to the COVID-19 pandemic, for example, the failure of legendary Google Flu Trends (GFT) (https://www.wired.com/2015/10/can-learn-epic-failure-google-flu-trends/). According to Vytla et al. [39], the failure of AI and big data modeling has led to the enthusiasm to simple and traditional mathematical models for COVID-19 predictions. From this perspective, the simple PL approach we demonstrated in this study can be counted as another successful example. However, it should be emphasized that Vytla et al. [39] review and the previously discussed opinions on AI/ML may be limited to the predictions of epidemics/pandemics, and they can still be very useful for other problems of epidemics/pandemics.
Conclusions and Discussion
The following findings can be summarized from previous sections:
(i) Coupling of TPL and PLEC models, the two PLs from classic ecological theories with applications beyond their original domain of ecology and biology, offers a feasible solution for some important prediction problems of power-law phenomena. We demonstrate the approach with two examples.
(ii) For the COVID-19 prediction problem, the PLEC-FTR model is able to predict the turning (inflection) points of fatality in the form of (Fmax, Tmax), i.e., the MAF number and corresponding date at which Fmax is reached. In a previous study, we have demonstrated that the PLEC model successfully predicted the turning points of COVID-19 infections [28]. Both fatality and infection prediction problems are essentially the same, and therefore, prediction of fatality is undoubtedly feasible. An issue with our previous infection prediction is the lack of CI [28]. Thanks to the coupling with the TPL model, the PLEC-FTR is able to deliver the CI for Fmax by leveraging the capability of TPL in predicting variance (SD) at different fatality levels. This is because the TPL in the case of fatality prediction can be harnessed to establish the power-function relationship between mean fatality number and corresponding variance. With the variance (SD), estimation of CIs is then a trivial statistical exercise. Obviously, the coupling approach is equally applicable to the prediction of COVID-19 infections, although it was not recognized [28]. This example also suggests that the TPL-PLEC coupling approach may be applied to other similar predictive problems in epidemiology and public health.
(iii) For the biodiversity prediction of AGM diversity, the coupling of TPL and PLEC-DAR models is able to predict the maximal accrual species richness (Dmax) of AGM, which can be considered as potential or “dark” species richness of gut microbiomes in the American cohort (population). The potential or dark biodiversity refers to the total diversity that includes the portion that may be absent locally but is present in the regional species pool (and therefore is able to colonize local communities through dispersal/migration) [26]. In the case of the human gut microbiome, the potential diversity can be considered as a cohort or population level characteristic of the gut microbiome. In the case of this study, it can represent the potential species richness of the American population, given the datasets were obtained from sampling 1,473 Americans, a sufficiently large sample size.
In perspective, we expect that the power-law coupling approach possesses great promises for a wide range of important problems whenever both TPL and PLEC models can be successfully applied. The precondition that both PL models must be reliably built also reminds us that the approach cannot be a silver-bullet solution. For example, in the case of PLEC-DAR modeling for the gut microbiome diversity, we only presented the results for species richness (i.e., the Hill numbers when diversity order q = 0). The reason was that TPL was failed to fit the mean and variance of the Hill numbers at other diversity orders. This made it infeasible to estimate the CIs for other diversity orders. TPL has been found applicable in many natural and man-made systems; however, there are situations where it may fail. Taylor [5] conjectured that TPL might work poorly for ratios and very poorly for bounded ratios. The Hill number at diversity q = 0 (i.e., species richness) is an integer, but at other diversity orders, such as q = 1, 2, or 3, the Hill numbers are indeed bounded ratios. Taylor's [5] conjecture may explain the limitation of TPL in fitting the mean-variance relationship in measuring biodiversity.
Furthermore, the universality property of PLs hints great promises for our coupling approach, although there have been occasional debates on proving universally in practical data fitted to PLs {e.g., [4]}. The universality refers to the equivalence of PLs with a particular scaling parameter (exponent), such as b in TPL, z in SAR (DAR), or w in STR (DTR), which are termed critical exponents. Critical exponents are termed so because the PL distributions of certain quantities are associated with phase transitions in dynamic systems as they approach criticality. The hallmark of universality is therefore the sharing of dynamics, and the systems with precisely the same critical exponents are said to belong to the same universality class. In the field of TPL, the transitions between aggregated (heterogeneous), random (Poisson), and uniform distribution of biological population or species abundance distribution can be characterized by the population aggregation critical density (PACD) [13] or community heterogeneity critical diversity (CHCD) [23], which could be generated by self-organizations in the ecosystems (e.g., population or community). Different from physics, the processes, such as self-organization in biology and ecology, are difficult to prove rigorously. Nevertheless, there are indeed observations of the equivalence of TPL scaling exponents, such as the apparent invariance (constancy) of TPL scaling parameter (b) of global hot spring microbiomes across wide ranges of pH values and temperatures [40]. If these observations are found general in ecosystems, then the predictions based on our coupling approach of PLs can be not only feasible but also be reliable. Unlike the events that are governed by the normal (Gaussian) distribution, the events governed by the highly skewed PL distribution are particularly challenging to predict. In particular, some PL-governed events often lack of well-defined average values, but with potentially unbounded variance, tend to be black-swan and/or catastrophic. This also makes our proposed coupling method particularly valuable potentially.
Finally, we would like to present a very brief discussion on the general modeling strategy that is related to the two demonstrative case studies for illustrating the applications of the proposed coupling PLs. Since modeling strategy may be influenced by domain-specific knowledge, the discussion below is conducted in the context of ecological modeling {e.g., [41]} and COVID-19 prediction {e.g., [28, 37]}, to keep relevant to the two demonstrative examples of this article. According to Levins [42], it is ideal to operate with manageable models that maximize generality, realism, and precision toward the overlapping, but not identical goals of understanding, predicting, and modifying nature. Levins [42] distinguished three alternative strategies, namely, [1] sacrifice generality to realism and precision (which is the approach of most simulation models); [2] sacrifice realism to generality and precision (most physicists who work in population ecology follow this tradition; the Lotka-Volterra model is an example); and [3] sacrifice precision to realism and generality, an example of this strategy is the theory of island biogeography by MacArthur and Wilson [43], which we have briefly discussed in the final paragraphs of this article. It is noted that the term “precision” here, more precisely, refers to more specific or detailed factors (information) used in modeling works.
Although Darwin's evolutionary theory answered the question of where and how biological species are originated and evolved on the earth's planet, the evolutionary theory did not explain how and why species co-exist and form diverse communities of species. Indeed, the competition or struggle for living, one essential aspect of evolutionary theory, would predict that the earth could be dominated by a handful of ultimate winners from competitions, which is obviously not consistent with the reality that the earth is cohabited by diverse species that usually coexist. In fact, biodiversity has been studied and paid attention by both scientists and the general public extensively in modern societies [44]. The study of biodiversity distribution, known as biogeography, was stuck in a “natural history phase” until the 1960s, due to the dominance by the collection of data and description of species, which were necessary but not sufficient. MacArthur and Wilson [43] demonstrated in their landmark monograph “The Theory of Island Biogeography” that the first principles of population ecology and genetics can be applied to explain how distance and area combine to regulate the balance between immigration and extinction in island populations. They were motivated to stimulate new forms of theoretical and empirical studies, rather than synthesizing and unifying existing theories or establishing a general new theory. Somewhat contrary to their unassuming start, their work does lead to a stronger theory of biodiversity. Today, even a half of a century has passed, the monograph continues to be inspiring and remains at the center of discussions about the geographic distributions of species in biodiversity research. Here are mentioned the above historical episodes for two reasons. First, MacArthur and Wilson's [43] island biogeography theory is well recognized as a landmark breakthrough in biogeography and community ecology. It can be considered as an extremely successful example of the modeling strategy of sacrificing precision (details) to realism and generality. Second, one of the key elements of their theory is the SAR PL, which is one of the PLs coupled in this study, i.e., the DAR extended by Ma [25–27]. Both factors should have contributed to the success of the biodiversity and COVID-19 predictions demonstrated in this study.
Besides the frequent infeasibility in simultaneously maximizing generality, realism, and precision of mathematical models, another commonly encountered dilemma for modelers is the complex vs. simple models. According to Jewell et al. [37], intuitively, simpler models may offer less valid predictions due to their limited capacity in capturing complex and unobserved human mixing patterns and other time-varying properties of infectious disease spread. However, complex models can be no more reliable than simple ones if they fail to capture key aspects of the problem. In addition, complex models may produce the illusion of realism and make it prone to omit crucial points. Furthermore, outputs of complex models are usually more sensitive to changes in parametric assumptions and/or the estimations of external disease or environmental factors, such as the lengths of latent/infectious periods due to mutation of a pathogen [37]. Of course, the disadvantages of complex models are not necessarily the advantages of simpler models. On the other hand, simpler models are usually inexpensive to construct and manage, and they may provide adequate solutions under certain circumstances. We hope that this work proposes and demonstrates a simple modeling approach for certain problems where PLs are applicable.
Finally, one may wonder how accurate the prediction of our coupling power laws is in forecasting the worldwide COVID-19 fatality. Compared with the worldwide COVID-19 fatality number on January 24th, 2022 (when this paper is formally accepted and online), the error rate of the prediction with our coupled power laws, made in the May 2021 (based on the fatality data then alone) is approximately 7% only (i.e., the precision level is 93%).
Specifically, we computed the worldwide fatality on Jan 24, 2022 with the following parameters and formula: F = CTw exp(dT) + F0, where C = 4957.140, w = 1.248, T = 308, d = −0.003, F0 = 2716229 (the fatality number at the starting date of the model-building, i.e., March 21st, 2021 in the case of the world model). We obtain F = 5226117, i.e., the predicted fatality number on January 24, 2022, and the prediction is based on the power law model established with the worldwide fatality numbers before May 21st, 2021 (Table 1, Figure 3). According to the publicly released COVID-19 fatality (https://github.com/CSSEGISandData/COVID-19), the actual worldwide fatality number is 5610729 on Janurary 24th, 2022. The precision of point estimation is then 92.6 or 93% approximately. Furthermore, the 95% confidence interval of the estimation can be computed with Eqns. (12, 13) and is [4713112, 5739122].Therefore, the point estimation of the worldwide COVID-19 fatality number on January 24th 2022 does fall within the confidence interval with a precision level of 92.6%. In fact, these results (including Table 1 and Figure 3) had already been released on May 23rd 2021 in the preprint of this article Ma [45].
Our model (Table 1, Figure 3) also predicted that the turning point (inflection point) of worldwide COVID-19 fatality would not occur until the July of 2022, which contrasts with the recent prediction made by Murray [46] who suggested that the “end of the pandemic is near” by March 2022.
Data Availability Statement
Publicly available datasets were analyzed in this study. Available publicly: https://github.com/CSSEGISandData/COVID-19.
Author Contributions
The author confirms being the sole contributor of this work and has approved it for publication.
Funding
This study received funding from the following sources: A National Natural Science Foundation (NSFC) grant (no. 31970116), Cloud-Ridge Industry Technology Leader Grant.
Conflict of Interest
The author declares that the research was conducted in the absence of any commercial or financial relationships that could be construed as a potential conflict of interest.
Publisher's Note
All claims expressed in this article are solely those of the authors and do not necessarily represent those of their affiliated organizations, or those of the publisher, the editors and the reviewers. Any product that may be evaluated in this article, or claim that may be made by its manufacturer, is not guaranteed or endorsed by the publisher.
Acknowledgments
The author appreciates the data curation and computational assistance from Dr. Li LW, the Chinese Academy of Sciences. The author is also deeply indebted to two expert reviewers for their meticulous review of and insightful comments and suggestions for my manuscript, which offered significant help to improve this work.
Abbreviations
AGM, American Gut Microbiome; DAR, Diversity-area relationship; DTR, Diversity-time relationship; FTR, Fatality-time relationship; MAD, Maximal accrual diversity; PLEC, Power law with exponential cutoff; SAR, Species-area relationship; STR, Species-time relationship; TPL, Taylor's power law.
References
1. Eisler Z, Bartos I, Kertesz J. Fluctuation scaling in complex systems: Taylor's law and beyond. Adv Phys. (2008) 57:89–142. doi: 10.1080/00018730801893043
2. Fronczak A, Fronczak P. Origins of Taylor's power law for fluctuation scaling in complex systems. Phys Rev E. (2010) 81:066112. doi: 10.1103/PhysRevE.81.066112
4. Stumpf MPH, Porter MA. Critical truths about power laws. Science. (2012) 335:665–6. doi: 10.1126/science.1216142
5. Taylor RAJ. Taylor's power law: order and pattern in nature. Academic Press, London. (2019) p. 657.
6. Ma ZS, Taylor RAJ. Human reproductive system microbiomes exhibited significantly different heterogeneity scaling with gut microbiome, but the intra-system scaling is invariant. Oikos. (2020) 129:903–11. doi: 10.1111/oik.07116
8. Taylor LR, Taylor RAJ. Aggregation, migration and population mechanics. Nature. (1977) 265:415–21. doi: 10.1038/265415a0
9. Taylor LR, Taylor RAJ, Woiwod IP, Perry JN. Behavioral dynamics. Nature. (1983) 303:801–4. doi: 10.1038/303801a0
10. Taylor LR, Perry JN, Woiwod IP, Taylor RAJ. Specificity of the spatial power-law exponent in ecology and agriculture. Nature. (1988) 332:721–2. doi: 10.1038/332721a0
11. Taylor LR. Assessing and interpreting the spatial distributions of insect populations. Annual Review of Entomology, vol. (1984) 29:321–57. doi: 10.1146/annurev.en.29.010184.001541
12. Taylor RAJ. Spatial distribution, sampling efficiency and Taylor's power law. Ecol Entomol. (2018) 43:215–25. doi: 10.1111/een.12487
13. Ma ZS. Further interpreted Taylor's power law and population aggregation critical density. Trans Ecol Soc China. (1991) 1991:284–8.
14. Ma ZS. Chaotic populations in Genetic Algorithms. Applied Soft Computing. (2012) 12:2409–24 doi: 10.1016/j.asoc.2012.03.001
15. Ma ZS. Stochastic populations, power law and fitness aggregation in Genetic Algorithms. Fundamenta Informaticae. (2013) 122:173–206. doi: 10.3233/FI-2013-787
16. Ma ZS. Assessing and interpreting the metagenome heterogeneity with power law. Front. Microbio. (2020) 11:648. doi: 10.3389/fmicb.2020.00648
17. Ma ZS. Estimating the optimum coverage and quality of amplicon sequencing with Taylor's power law extensions. Front Bioeng Biotechnol. (2020) 8:372. doi: 10.3389/fbioe.2020.00372
18. Oh J, Byrd AL, Park M, NISC Comparative Sequencing Program, Kong HH, Segre JA. Temporal stability of the human skin microbiome. Cell. (2016) 165:854–66. doi: 10.1016/j.cell.2016.04.008
19. Cohen JE. Statistics of primes (and probably twin primes) satisfy Taylor's Law from ecology. Am Stat. (2016) 70:399–404. doi: 10.1080/00031305.2016.1173591
20. Cohen JE, Schuster WSF. Allometric scaling of population variance with mean body size is predicted from Taylor's law and density-mass allometry. Proc Natl Acad Sci U.S.A. (2012)109:15829. doi: 10.1073/pnas.1212883109
21. Cohen JE, Xu M. Random sampling of skewed distributions implies Taylor's power law of fluctuation scaling. Proc Natl Acad Sci U.S.A. (2015) 112:7749. doi: 10.1073/pnas.1503824112
22. Reuman DC, Zhao L, Sheppard LW, Reid PC, Cohen JE. Synchrony affects Taylor's law in theory and data. Proc Natl Acad Sci U.S.A. (2017) 114:6788. doi: 10.1073/pnas.1703593114
23. Ma ZS. Power law analysis of the human microbiome. Molecular Ecology. (2015) 24:5428–45. doi: 10.1111/mec.13394
24. Ma ZS. Spatial heterogeneity analysis of the human virome with Taylor's power law. Comput Struct Biotechnol J. (2021) 19:2921–7 doi: 10.1016/j.csbj.2021.04.069
25. Ma ZS. Extending species-area relationships (SAR) to diversity-area relationships (DAR). Ecol Evol. (2018) 8:10023–38. doi: 10.1002/ece3.4425
26. Ma ZS. A new DTAR (diversity–time–area relationship) model demonstrated with the indoor microbiome. J Biogeography. (2019) 46. doi: 10.1111/jbi.13636
27. Ma ZS. Diversity time-period and diversity-time-area relationships exemplified by the human microbiome. Sci Rep. (2018) 8:7214. doi: 10.1038/s41598-018-24881-3
28. Ma ZS. Predicting the outbreak risks and inflection points of COVID-19 pandemic with classic ecological theories. Advanced Science. (2020) 7:2001530. doi: 10.1002/advs.202001530
29. Ma ZS. Fitting Taylor's power law curve by marquardt's optimum algorithm. J Beijing Forestry University. (1990) 12:6.
30. Ma ZS. Optimization of nonlinear ecological models with the accelerated simplex algorithm. J Biomathematics. (1992) 7:160–7.
32. Preston FW. Time and space and the variation of species. Ecology. (1960) 41:611–27. doi: 10.2307/1931793
33. Plotkin JB, Potts MD, Yu DW, Bunyavejchewin S, Condit R, et al. Predicting species diversity in tropical forests. Proc Natl Acad Sci U.S.A. (2000) 97:10850–4. doi: 10.1073/pnas.97.20.10850
34. Ulrich W, Buszko J. Self-similarity and the species–area relation of Polish butterflies. Basic Appl Ecol. (2003) 4:263–70. doi: 10.1078/1439-1791-00139
35. Tjørve E. Shapes and functions of species–area curves (II): a review of new models and parameterizations. J Biogeogr. (2009) 36:1435–45. doi: 10.1111/j.1365-2699.2009.02101.x
37. Jewell NP, Lewnard JA, Jewell BL. Opinion: predictive mathematical models of the COVID-19 pandemic: underlying principles and value of projections. JAMA. (2020) 323:1893–4. doi: 10.1001/jama.2020.6585
38. Li HJ, Wang L, Wang Z, Du ZW, Xia C, Moustakas A, Pei S. Editorial: mathematical modelling of the pandemic of 2019 novel coronavirus (COVID-19): Patterns, dynamics, prediction, and control. Front Phy. (2021). doi: 10.3389/fphy.2021.738602
39. Vytla V, Ramakuri SK, Peddi A, Srinivas K, Ragav NN. Mathematical models for predicting covid-19 pandemic: A review. J Phys Conf Ser. (2021) 1797. doi: 10.1088/1742-6596/1797/1/012009
40. Li LW, Ma ZS. Comparative power law analysis for the spatial heterogeneity scaling of the hot-spring and human microbiomes. Mol Ecol. (2018) 28:2932–43. doi: 10.1111/mec.15124
41. Kingsland SE. Modeling Nature, Episodes in the History of Population Ecology. The University of Chicago Press. (1985).
43. MarArthur RH, Wilson EO. The theory of island biogeography. Princeton Landmarks in Biology. (1967).
44. Ma ZS, Ellison AM. Dominance network analysis provides a new framework for studying the diversity-stability relationship. Ecol Monographs. (2019) 89. doi: 10.1002/ecm.1358
45. Ma ZS. Coupling power laws offers a powerful method for problems such as biodiversity and COVID-19 fatality predictions. Quantitative Methods. (2021). doi: 10.48550/arXiv.2105.11002
Keywords: Taylor's power law (TPL), power law with exponential cutoff (PLEC), potential (dark) biodiversity, long-tail skewed distribution, turning point of COVID-19, COVID-19 fatality prediction
Citation: Ma ZS (2022) Coupling Power Laws Offers a Powerful Modeling Approach to Certain Prediction/Estimation Problems With Quantified Uncertainty. Front. Appl. Math. Stat. 8:801830. doi: 10.3389/fams.2022.801830
Received: 26 October 2021; Accepted: 24 January 2022;
Published: 25 March 2022.
Edited by:
Jun Ma, Lanzhou University of Technology, ChinaReviewed by:
Ilaria Spassiani, Istituto Nazionale di Geofisica e Vulcanologia (INGV), ItalyLijun Pei, Zhengzhou University, China
Copyright © 2022 Ma. This is an open-access article distributed under the terms of the Creative Commons Attribution License (CC BY). The use, distribution or reproduction in other forums is permitted, provided the original author(s) and the copyright owner(s) are credited and that the original publication in this journal is cited, in accordance with accepted academic practice. No use, distribution or reproduction is permitted which does not comply with these terms.
*Correspondence: Zhanshan (Sam) Ma, ma@vandals.uidaho.edu