A hybrid individual-based mathematical model to study bladder infections
 Anas Lasri Doukkali
 Tommaso Lorenzi2
  Benjamin J. Parcell
 Jennifer L. Rohn
 Ruth Bowness
- 1Schools of Medicine and Mathematics and Statistics, University of St Andrews, St Andrews, United Kingdom
- 2Department of Mathematical Sciences, Politecnico di Torino, Torino, Italy
- 3Medical Microbiology, NHS Tayside, Ninewells Hospital and Medical School, Dundee, United Kingdom
- 4Division of Medicine, Department of Renal Medicine, Centre for Urological Biology, University College London, London, United Kingdom
- 5Department of Mathematical Sciences, Claverton Down, University of Bath, Bath, United Kingdom
Introduction: Bladder infections are common, affecting millions each year, and are often recurrent problems.
Methods: We have developed a spatial mathematical framework consisting of a hybrid individual-based model to simulate these infections in order to understand more about the bacterial mechanisms and immune dynamics. We integrate a varying bacterial replication rate and model bacterial shedding as an immune mechanism.
Results: We investigate the effect that varying the initial bacterial load has on infection outcome, where we find that higher bacterial burden leads to poorer outcomes, but also find that only a single bacterium is needed to establish infection in some cases. We also simulate an immunocompromised environment, confirming the intuitive result that bacterial spread typically progresses at a higher rate.
Conclusions: With future model developments, this framework is capable of providing new clinical insight into bladder infections.
1. Introduction
Urinary tract infections (UTIs) are infections affecting the urethra, bladder and kidneys. Lower UTIs affect the bladder and urethra, and upper UTIs affect the kidneys. Simple or uncomplicated UTIs are caused by a number of pathogens in people with a normal urinary tract and kidney function, and no predisposing co-morbidities. They can often be self-limiting or readily cleared with a short course of antibiotics. One in four uncomplicated UTIs patients, however, experience persistent or recurrent infection and/or treatment failure, and complicated UTIs carry an increased likelihood of such outcomes [1].
UTIs are some of the most common bacterial infections, with an infection toll of 150 million people each year worldwide [2]. UTIs are a significant cause of morbidity, particularly affecting females, older men and infant boys [1]. Ramifications of such infections can lead to pyelonephritis with sepsis, renal damage in young children, pre-term labor in pregnant women and complications that arise from frequent antimicrobial use (for example, antibiotic resistance). Patients who suffer from symptomatic UTI are normally treated with the use of antibiotics. Currently, the antibiotics most commonly used include Nitrofurantoin, Trimethoprim, Cotrimoxazole (a combination of Trimethoprim and Sulfamethoxazole), Fosfomycin or Nitrofurantoin. However, the rise we have seen in antibiotic resistance in addition to the highly recurrent profile of the infection means healthcare professionals may have to use alternative lines of treatment, which have greater risk of infection with Clostridioides difficile. Extended-spectrum beta-lactamase (ESBL)-producing Enterobacterales are increasing and these bacteria are often multi-drug resistant. With limited treatment options and a lack of new antibiotics being developed it is essential to focus on prevention of UTIs and gain more understanding of the cellular and molecular dynamics of how uropathogens adhere, colonize and adapt to the nutritionally lacking environment of the bladder; elude the immune system; persevere and spread through the urinary tract [3–5].
UTIs are highly recurrent and may persist through different rounds of treatments. This recurrence is due to either relapse (symptomatic recurrent UTIs with the same organism following adequate therapy) or re-infection (recurrent UTIs with previously isolated bacteria after treatment and with a negative intervening urine culture, or a recurrent UTI caused by a second bacterial isolate). In the majority of cases however, recurrent UTIs are thought to represent reinfection with the same organism. UTIs are caused by both Gram-negative and Gram-positive bacteria, and in some cases by specific fungi, but the majority are caused by the bacterial species Uropathogenic Escherichia coli (UPEC) [1]. Although the causes of recurrence are multifactorial—with at least a dozen mechanisms, some acting in tandem—one key factor could be the ability of UPEC to establish quiescent intracellular reservoirs (QIRs). Thus, the establishment of these bacterial communities at deeper levels of the urothelium may allow them to evade immune cell interaction and other mechanisms such as bacterial shedding.
The bladder has a number of strategies to protect itself against microbial invaders. First and foremost, the urinary tract has anatomical barriers, alongside the flushing action of urination, which usually suffice to prevent pathogenic elements from entering the tract and establishing a persistent infection. The presence of virulence factors in some bacteria, however, can help them to bypass these barriers and successfully establish infection. Virulence factors are any set of characteristics that will help bacteria in eluding the primary line of defense, and hence increase the risk of successful infection [1]. A crucial step during the infection process of a number of species of UTI pathogens, including the most common uropathogen, Escherichia coli (E. coli), is the ability to permeate and invade the bladder epithelial barrier and seek refuge within the bladder epithelial cells (BECs). This is normally done by hijacking the capacity of the epithelial cells to regulate bladder volume [6]. Another important thing to note is, due to the presence of toxic compounds in urine, the bladder must maintain a tight epithelial barrier. Thus, any immune reaction has to carefully balance the response to microbial challenge with the need to maintain the structural integrity of the epithelial barrier [7]. This will sometimes lead to premature termination of the anti-inflammatory response, resulting in chronic or recurrent infections due to residual bacteria. The innate immune response refers to the non-specific defense mechanisms that are deployed by the immune system usually hours after a pathogen is established. This is particularly important in bladder infections, as the role of the adaptive immune system in UTI is less straightforward, and is still being clarified [8]. The innate immune system is composed of various recruited and resident cells that express a wide range of pattern recognition receptors (PRRs). These receptors allow for early recognition of the pathogen which will be translated to induce a quick and robust pro-inflammatory response [9]. As noted before, although these immune responses are important, they have to be controlled to avoid any substantial damage to the epithelial barrier. As a last line of defense, the bladder sheds cells from its internal walls to reduce bacterial load. These host shedding mechanisms are modulated to avoid adverse effects [10, 11]. Below we review the main innate immune cells that operate in the urinary tract and focus on their unique antimicrobial activities.
1.1. Bladder epithelial cells
These cells, lining the interior of the urinary tract, will deploy the first line of defense against the infection, with the secretion of factors, both pro-inflammatory cytokines and antibacterial agents. The first cytokines detected after infection are IL-1, IL-6, and IL-8 [6, 9, 12]. This group of cytokines is important for the recruitment of phagocytes into the infected bladder [13]. Additional factors secreted by epithelial cells hinder bacterial growth by eliminating growth factors present in urine. Following bacterial infection of BECs, the pathogens are then encapsulated in RAB27b+ fusiform vesicles with exocytic properties, meaning BECs will be able to expel intracellular bacteria back into the extracellular medium [14]. If any bacteria avoids expulsion, by escaping the RAB27b+ vacuoles, it is then met with a second wave of elimination in which such pathogens are recognized and captured by autophagy. If BECs become heavily infected, a preventive measure is the shedding of the superficial epithelial cell layer through the urine, as mentioned above [10]. This leaves the underlying tissue exposed to urine toxins and de novo infection of deeper layers, so the shedding of BECs is immediately followed by a shift of the urothelium to a highly active and proliferative phase to restore the previous loss via replacement by cells underneath that differentiate and take their place [15].
1.2. Neutrophils
Neutrophils are the first type of immune cells to be recruited to the bladder. Initially, they respond to CXC-chemokine ligand 1 (CXCL1) and other chemo-attractants produced by superficial epithelial cells, macrophages and mast cells [16]. In mouse experiments, neutrophils are detected in urine as early as 2 h post-infection, with their peak at approximately 6 h post-infection [17]. The number of neutrophils is proportional to that of bacteria in the urinary tract [6].
1.3. Macrophages
A substantial population of macrophages resides in the submucosa of the urinary tract, and more cells are recruited to these sites following infection. Once activated, macrophages produce important chemokines and cytokines that regulate the activity of these and other immune cells in the vicinity, hence, influencing the timing and the intensity of inflammatory responses during UTIs [18]. Communication between bladder macrophages leads to mobilization of neutrophils into the epithelium and their subsequent activation alongside neighboring immune cells. These responses ensure efficient bacterial clearance whilst minimizing unnecessary and damaging inflammation.
1.4. Mast cells
Mast cells are also resident immune cells located underneath the uroepithelium adjacent to the blood vessels and lymphatic vessels that traverse the mucosal region. These type of cells have a pivotal sentinel and key immunomodulatory role during UTIs, which is partly due to their ability to release many pre-stored inflammatory mediators upon activation. These chemicals are kept within cytoplasmic granules and gradually secrete the chemical mediators after being released extracellularly [19–21]. Although it is currently unknown what causes the activation of bladder mast cells when the epithelium is still intact, it is believed that factors released from responsive epithelial cells such as ATP, LL-37 and IL-33 could contribute to this process. The number of mast cells in the bladder increases during bladder infection, which points to an important dynamic role for these cells in the fight against the infection. Although mast cells are considered pro-inflammatory immune cells, experiments in mice show that once the infection progresses, such cells adopt anti-inflammatory responses (by releasing cytokines, IL-10) [22]. This switch in function seems to happen in parallel with the breaking down of the epithelial barrier and could facilitate epithelial regeneration.
Although previous mathematical frameworks have been developed to model the role of bladder hydrodynamics in bacterial elimination in lower UTIs [23], we are not aware of any studies that describe spatio-temporal models of the bladder. We have built an individual-based mathematical model capable of simulating discrete bacteria and immune cells, as well as the diffusion of relevant cytokine molecules, which crucially considers a spatial domain. This spatial model is capable of investigating the potential for the bacteria to evade bacterial shedding and treatment by establishing QIRs and hence can assess to what extent this mechanism is responsible for infection recurrence. In Section 2 we describe the mathematical model, with all “agent” rules explained and differential equations outlined. Section 3 explores the results from model simulations before we make some concluding comments and outline future research in Section 4.
2. Methods
We have developed a simple individual-based mathematical model, UTImodel, to simulate an infection in a section of the bladder. Individual-based models simulate individual elements or ‘agents' on a computational grid. The grid describes the environment, here the bladder, and the model includes rules to describe agent-agent and agent-environment interactions. These interactions between agents and between some agents and their environment can be quite complex; not only can these interactions change with time but so can the strategies used to decide what action will be employed at any particular time. These actions are generally constituted by the exchange of information which as a result, agents can either update their internal state or take other actions [24]. Individual-based modeling, in contrast to many other modeling techniques, allows for heterogeneity in population and environment [25, 26]. Our model is a hybrid model; as well as discrete agents (bacteria and immune cells), it also contains a generic chemokine molecule that acts as a chemoattractant, directing the immune cells to the site of infection. This generic chemokine is modeled via a Partial Differential Equation (PDE).
2.1. Model environment
The spatial domain is formed by the innermost bladder layer, the urothelium, where the two-dimensional model domain is of size Lg × Lg, where Lg = 200 for the simulations presented in this paper. The size of each grid cell within our environment is constructed in order to contain the largest agent within the biological system to be described, the macrophage. The diameter of a human macrophage is approximately 20 μm, hence each grid cell will be equivalent to a 400 μm2 section of the bladder. We therefore model over a 16 mm2 section of the superficial urothelium. We choose this small section of the bladder to investigate as we want to focus on the beginning of a bladder infection and believe this size is sufficient to study the initial growth and immune response. Each grid cell will represent a location instance within our model which can adopt the following states: empty, occupied by immune cell, bacteria or blood vessel. Although blood vessels do not appear on the urothelium in reality, we assume that these are the spatial locations of the blood vessels at deeper levels. Future iterations of the model will study a three-dimensional space where we can simulate the representation of the vasculature more realistically. On our 2-D spatial domain, we fix grid cells to be locations to represent cross-sections of 4 blood vessels, with locations [(175, 25), (25, 175), (175, 175), (25, 25)]. We place bacteria in the center of the domain. See Figure 1 to see the spatial domain and initial cell distributions for our simulations.
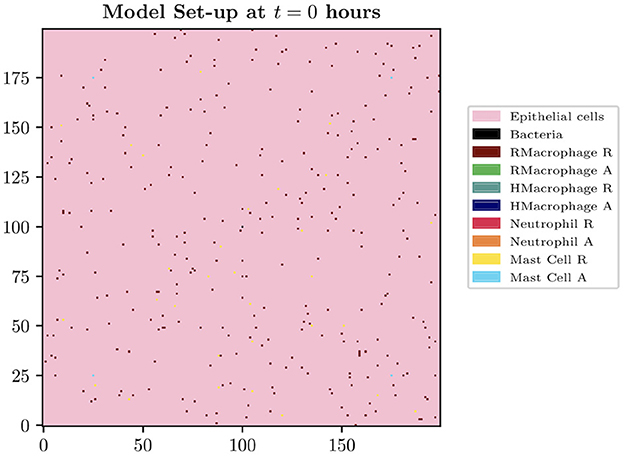
Figure 1. Spatial domain and initial cell distributions.
2.2. Agents and rules
For our simple model, we define five types of agents: bacteria, resident macrophages (LY6C−), helper macrophages (LY6C+), neutrophils and mast cells. We have chosen not to include BECs as agents within this version of the model, in order for computational simplicity. This will be included in future work. The interaction between such agents will be set by specific rules defined within our model. Functions for all these interactions are stored in separate classes in the code created for each specific agent.
2.2.1. Bacteria
In our model, we simulate UPEC bacteria. Initially, IB bacteria are seeded at the center of the grid. We place bacteria in the center of the domain as our computational environment represents a section of a initially healthy bladder, which is then seeded with bacteria, in order to investigate bacterial growth without the infection approaching the computational boundary. This set-up is also optimal for using experimental results to verify model output, which is our intention in future work. Initial bacterial placement can easily be changed to either random allocation or to be located at the boundaries, which again is intended to be studied in future work. The bacteria are able to replicate according to a growth rate of Bsp. See Table 1 for these parameter values, with corresponding references to the experimental data these are based on. Bacteria can be found in either a replicating or “resting” state, where bacteria are deemed to be resting when there is no space on the computational grid for them to replicate into. At each time point, the neighborhoods are checked and when empty spaces in the proximity of the bacteria are available, the bacteria are able to switch back to a replicating state and spread across the domain. Bacterial replication within our model is assumed to have a neighborhood depth of Ndb = 2. Hence, if bacteria are able to replicate, an empty location within the specified depth is chosen and populated with a new bacterium. If all locations are occupied, the replication state is switched temporarily to resting. The neighborhood type is alternated between Moore and von Neumann at each time step, in order to more accurately model bacterial cluster shapes. A Moore neighborhood consists of the eight cells that surround the cell of interest, whereas a von Neumann neighborhood contains the four adjacent grid cells to the cell of interest, i.e. above, below, right and left. Again, in future model developments a 3-D version of this domain will be studied to simulate the environment more realistically, where bacterial growth will be less restricted.
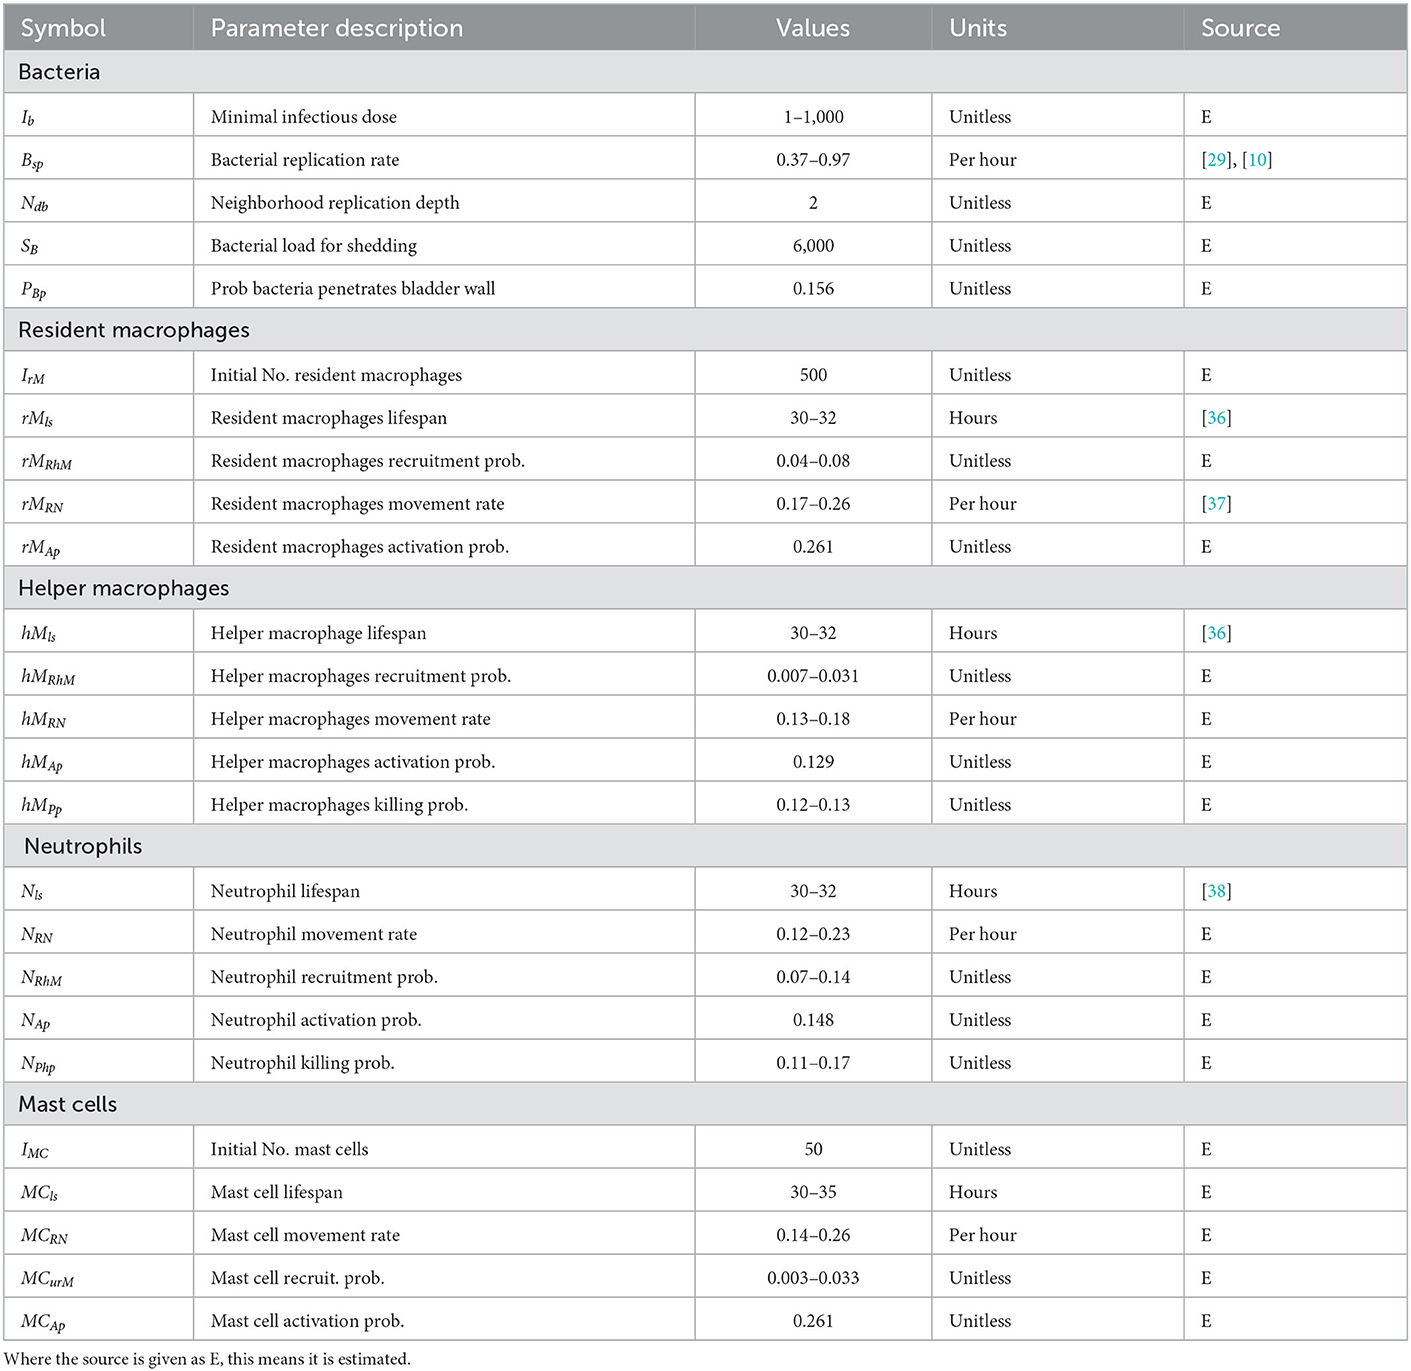
Table 1. Table of model parameter values.
2.2.2. Macrophages
Macrophages are represented as both resident and recruited discrete agents on the grid. Only one macrophage can occupy each grid cell and, independently of their nature (resident or recruited), all macrophages have the following attributes: position, age and state (resting or activated). Such characteristics are updated at every model time step. IrM resident (initially resting) macrophages are seeded onto the grid at the start of the simulation. Macrophages are randomly assigned an age rMls or hMls for resident or helper macrophages, respectively. Once a macrophage reaches its assigned age, it is removed from the grid. If a resident macrophage is in the Moore neighborhood (of order 2) of a bacterium, they are activated with probability rMAp. Once activated, Ly6C+/helper macrophages are recruited into the domain with probability rMRhM, and placed in the neighborhood of the activated macrophage. As well as recruiting helper macrophages, activated macrophages also secrete a generic chemokine molecule, the dynamics of which are described in Section 2.3. Macrophages move along the gradient of this chemoattractant, directing the immune cells to the site of infection. When no chemokine is present in the spatial domain, the macrophages follow a random walk. The movement rates are described by rMRN and hMRN for resident and helper macrophages, respectively. Ly6C+/helper macrophages are able to kill bacteria: once a bacterium is in the immediate neighborhood (Moore neighborhood of order 1) of an activated macrophage, this will kill said bacterium with probability hMphP.
2.2.3. Neutrophils
The lifespan of the neutrophils are set in the model as Nls. They are recruited by activated macrophages, similarly to helper macrophages, with probability NRhM. The neutrophils move chemotactically in the same manner as all immune cells in the system, up the gradient of the chemoattractant, or as a random walk when no chemokine is present. They move at rate NRN. Neutrophils can kill bacteria in their immediate neighborhood with probability NphP. Neutrophils are down-regulated by mast cells (see Section 2.2.4 for details).
2.2.4. Mast cells
There are IMC mast cells initially seeded on the grid. Their lifespan is set to MCls, they move at rate MCRN and are recruited through the blood vessels with probability MCurM. They are activated with probability MCAp. Mast cells are responsible for up-regulating helper macrophages, aiding with the clearance of bacterial infection. When there is a bacterium in the immediate neighborhood (Moore neighborhood of order 1) of a mast cell and no helper macrophages are present within this same neighborhood, the mast cell recruits a helper macrophage to a random location within this neighborhood.
Mast cells are also known to down-regulate the recruitment of neutrophils [22, 27] in order to limit excessive damage to the epithelial tissue [28]. When a mast cell is in an immediate neighborhood of three or more neutrophils, it removes one (at random) from the grid.
Figure 2 summarizes the interactions of the agents within our model.
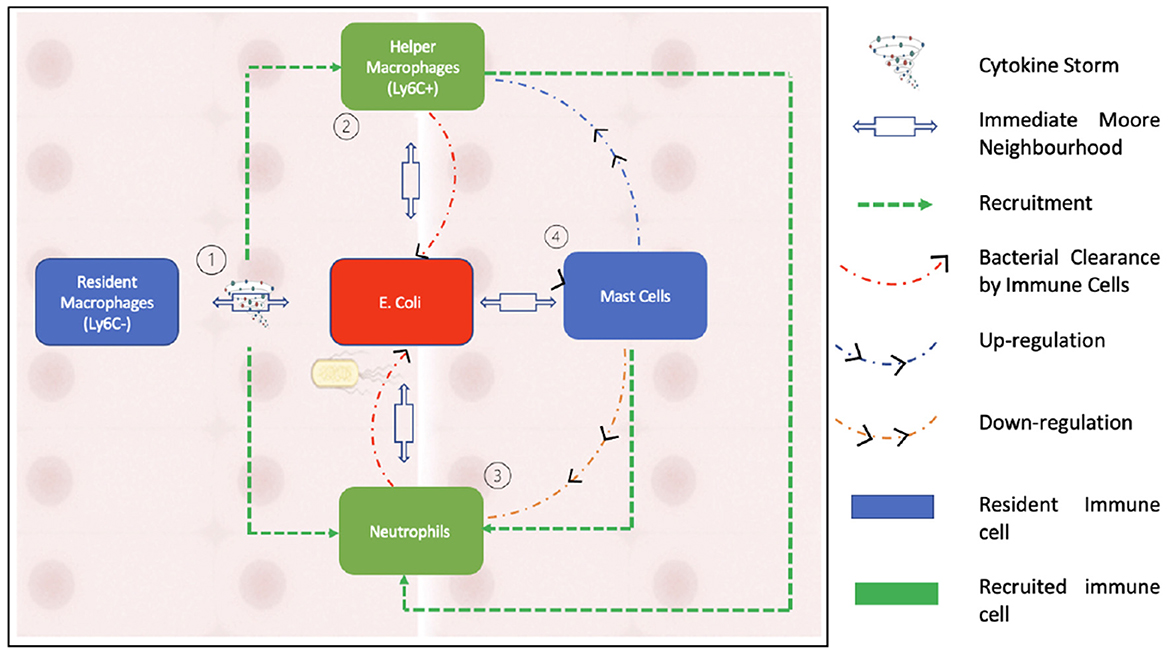
Figure 2. This figure illustrates the interactions between the agents that form our model. As can be seen in the schematic, neutrophils are recruited by activated macrophages while being down regulated by mast cells. Bacterial clearance occurs through helper macrophages and neutrophils.
2.3. Chemokine dynamics
A generic chemokine is secreted two-dimensionally by resident macrophages upon activation. This chemokine serves as a chemoattractant, directing all immune cells in the system to the site of infection. The spatiotemporal evolution of the chemokine concentration, C(x, t), is described by the following PDE:
Which is subject to the initial condition C(x, 0) = 0. Here, D denotes the spatially-dependent diffusion coefficient, s denotes the source of chemokine from the activated macrophages, u denotes the uptake of chemokine by the host cells, and d denotes the extracellular decay.
2.4. Uncertainty and sensitivity analysis
Model parameter values were guided by available experimental data. There is always some uncertainty surrounding parametrisation of models such as these. To mitigate this, we carried out uncertainty and sensitivity analysis (UA/SA) for all parameters shown in Table 1 to have a range of values. This was conducted in three stages:
1. Once we searched the experimental literature to find suitable ranges for parameter estimates, we generated our sample space using Latin Hypercube Sampling (LHS). The output of this first stage is a data matrix consisting of all the data samples to be fed into our model. Here we introduced a testing framework using YAML (Yet Another Markup Language), which is a data serialization language that allows us to develop a framework using python, C++ and Rstudio. We use Rstudio to generate our LHS samples which are then imported through python. Python is then responsible for taking in a data frame and outputting Ns YAML files, each containing a separate parameter set which, through a newly developed python module, we are able to feed to the C++ model.
2. The second stage includes sorting simulation output and plotting simulation results. We simply analyse the model data here. By plotting various outputs, we can visualize the results from the whole parameter space.
3. We then carry out the sensitivity analysis using Rstudio. We utilize the global SA technique Partial Rank Correlation Coefficient (PRCC), which works by establishing nonlinear but monotonic relationships between model inputs and outputs.
We chose to analyse PRCC, using bacterial load as the output of interest. Figure 3 shows the results from this sensitivity analysis, which suggest that the parameters related to the neutrophils in the model are significant. We investigate this further by plotting the PRCC values for these parameters through 80 h of a simulation, shown in Figure 4.
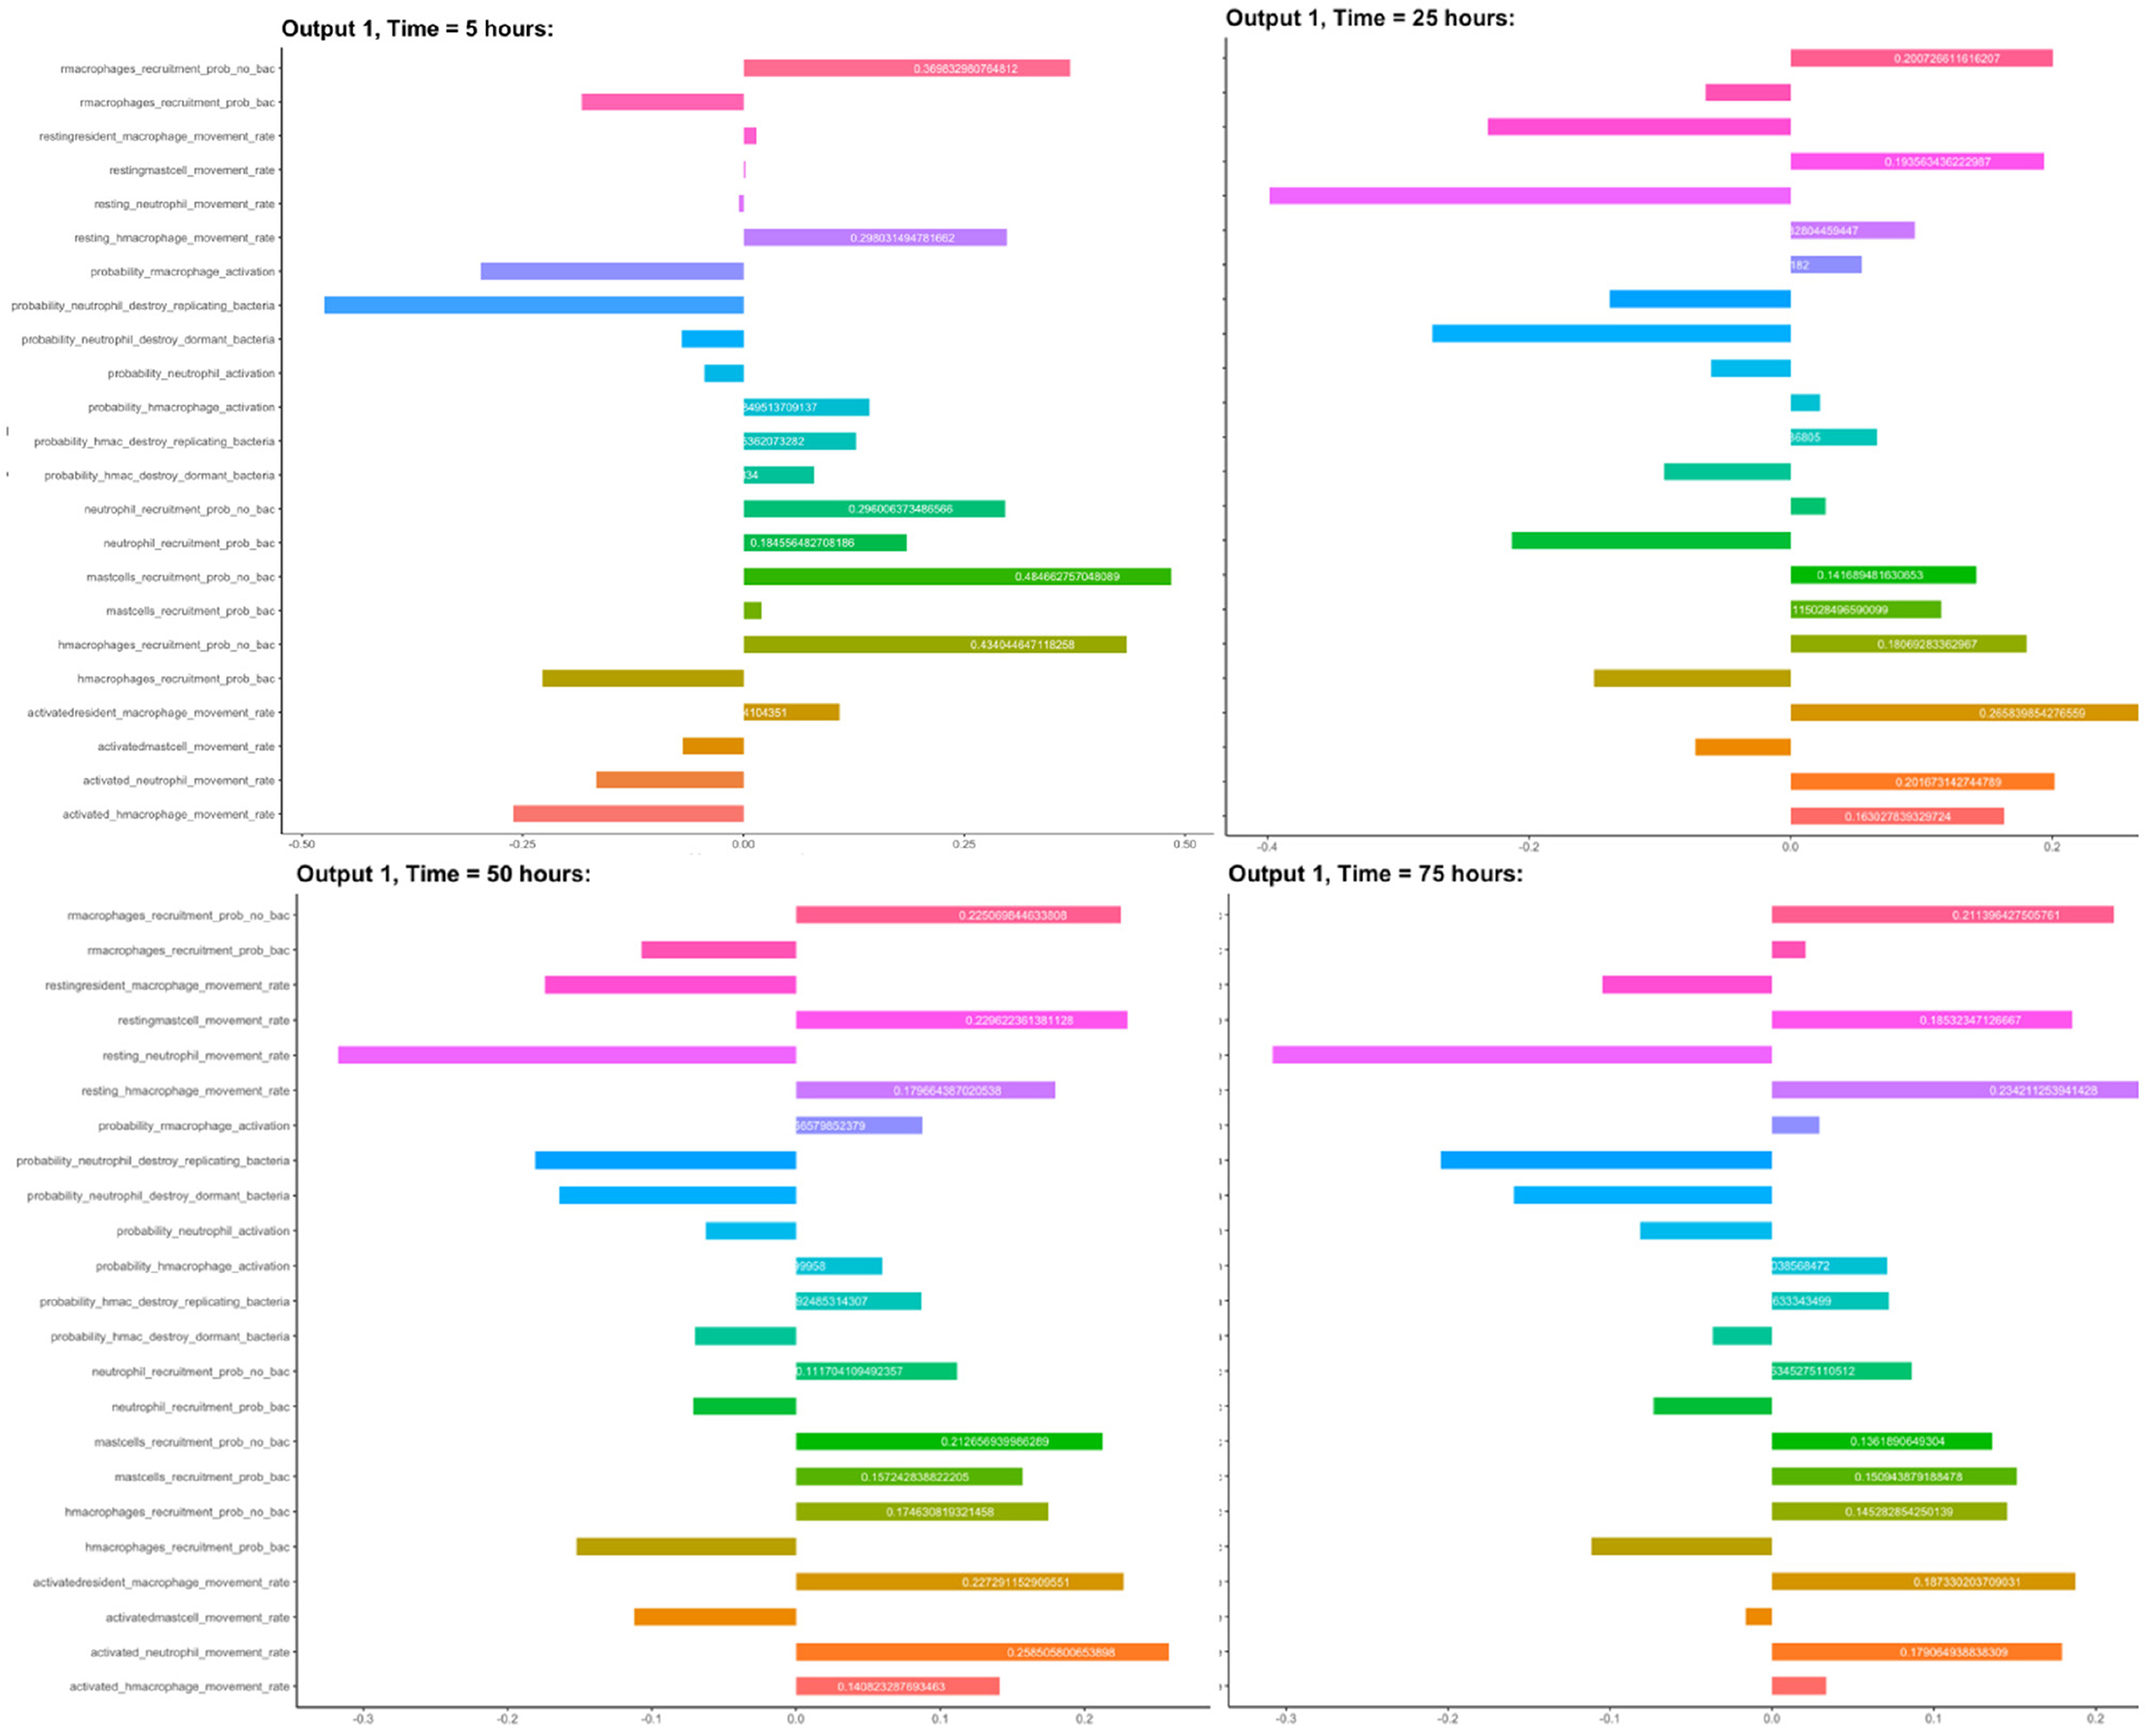
Figure 3. Sensitivity analysis: PRCC values for all input parameters, using bacterial load as the output.
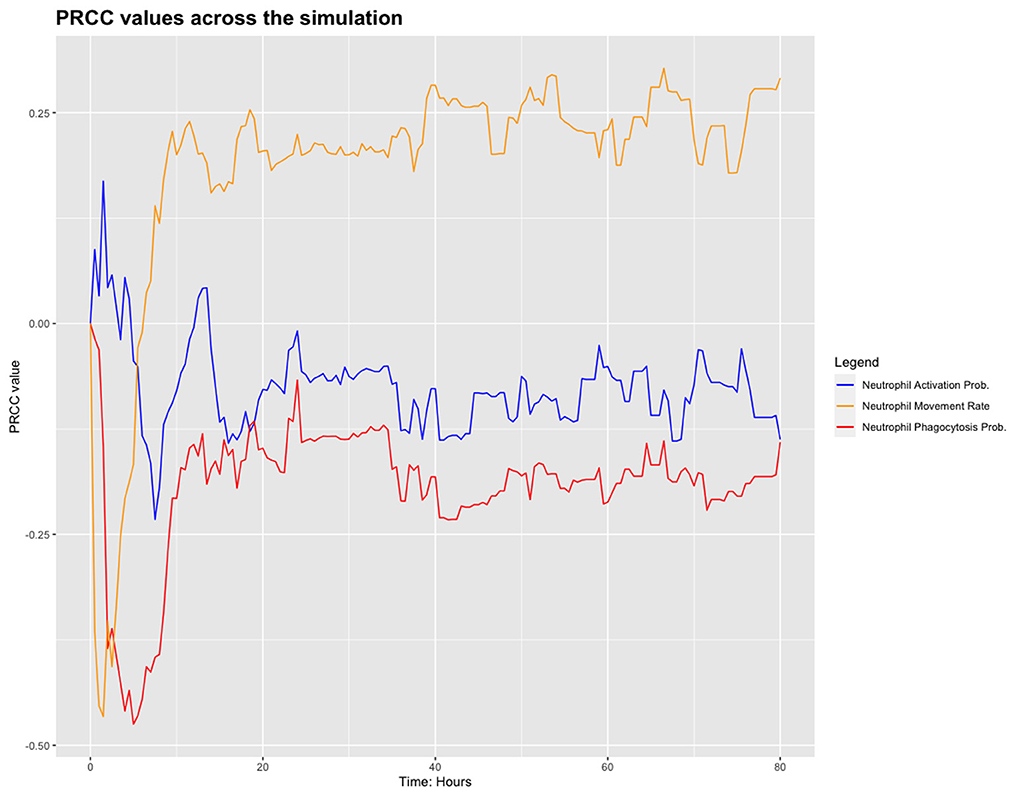
Figure 4. PRCC values for neutrophil parameters.
We chose to analyse PRCC, using bacterial load as the output of interest. Figure 3 shows the results from this sensitivity analysis, where we show the parameters with high sensitivity. Also notice in this figure that some parameters appear more than once in different forms depending on their state. For example, the probability of recruitment of macrophages is investigated separately; when bacteria are present and when bacteria are not present.
We have identified these parameters as the sensitive ones in the model but that their sensitivity only appears to be significant near the start of the simulation. Future work will include investigation of these parameters with regard the outcome of simulations. For the work presented here, however, we set these parameters as outlined in Table 1.
3. Results
Our model is able to capture a number of possible outcomes. Individual simulations may resolve in a variety of ways: immune cells may be able to completely eradicate bacterial infection with the combination of immune agents and periodic bacterial clearance through shedding of the bladder wall; bacteria may colonize the modeled bladder section leading to established cystitis; or bacteria may persist in small numbers, perhaps evading the shedding mechanism by penetrating the epithelial barrier. These later simulations may be thought of as non-symptomatic cases.
3.1. Initial bacterial load
Here we investigate the effect that the initial bacteria load, IB, can have on the infection dynamics. We first fix all model parameters, with the exception of IB. Subsequently, we generate 200 simulations through each variation of IB.
As we simulate 80 h, we will refer to an infection as being in the early stages when t ∈ [0, 15) hours. We refer to t ∈ [15, 30) hours as the middle stage of infection, which in the literature is identified as the stage when recruited immune cells are heavily involved in bacterial clearing. Finally, we refer to t ∈ [30, 80) hours as the late stage of the infection. Bacterial shedding occurs within the model when NB > 6000, which usually occurs during the late stages of infection. Throughout this analysis, we will use the following notation to refer to the bacterial load at time y hours.
3.1.1. Case where IB = 1
When choosing IB = 1, there is a large amount of variation in the infection outcomes. Progression profiles of UPEC can be observed, each resulting in a different final outcome. Figure 5 shows the number of bacteria from t = 0 to t = 15, for 4 simulations that highlight the extremes of infection progression outcomes. In Figure 5A, bacterial replication within the initial hours is slow; however, UPEC manages to evade the efforts of clearance by the immune cells and is able to replicate at higher rates toward the end of the early stage, reaching a final bacterial load of . In Figure 5B however, the infection progresses initially at higher speeds reaching a bacterial load of . Following this, the immune response manages to achieve good partial clearance outpacing replication at t = 7.5h. Toward the end of the early stage, the bacterial load is . In Figure 5C, bacteria is almost instantly cleared prior to being able to replicate, where immune cells successfully kill the bacteria. As immune cells are initially randomly placed within our grid, it is possible for an individual simulation to have immune cells within the immediate vicinity of IB, which, in addition to having a low initial bacterial load (IB = 1), leads to fast and total clearance of bacteria. In Figure 5D, the infection progresses quickly reaching . The bacterial increase however, although steady throughout the early stage of the infection, halts and the immune system manages to successfully clear all bacteria with . To gain a better insight into the immune clearance process we also present Figure 6 which describes the immune cell dynamics for the same 4 simulations as shown in Figure 5. As expected, we see here higher recruitment of both macrophages and neutrophils in simulations with higher bacterial loads. Figure 7 shows spatial plots of the simulation shown in Figures 5A, 6A at timepoints t = 0, 5, 10, 15 h. We see here as the infection progresses, there is a large influx of immune cells through the blood vessels that are subsequently directed by the chemokine signal to the site of infection at the center of the domain. We see that, at t = 15 h, the immune response has not been successful in containing the infection spread.
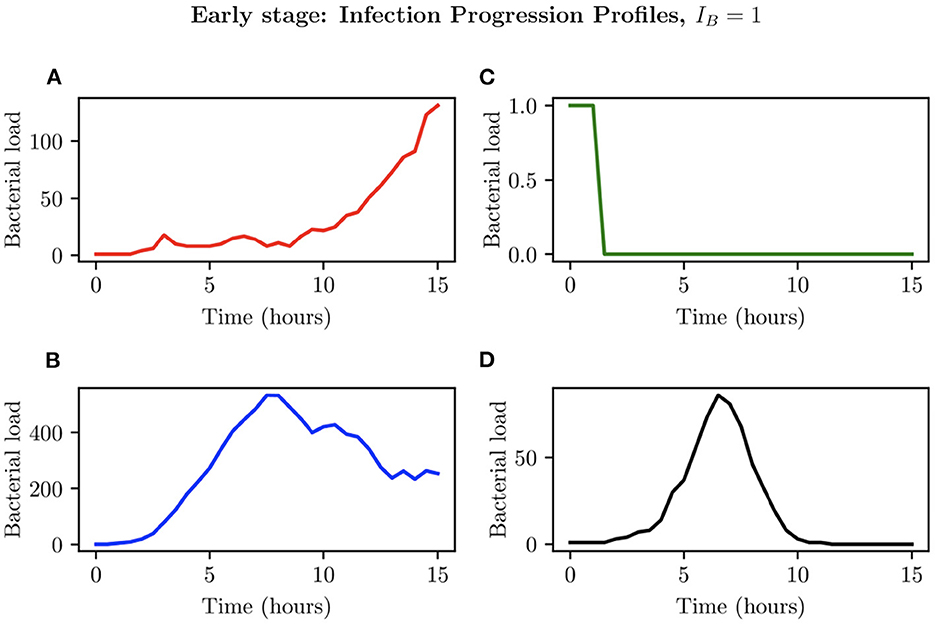
Figure 5. Simulations (A–D) represent 4 different bacterial growth profiles arising with IB = 1.
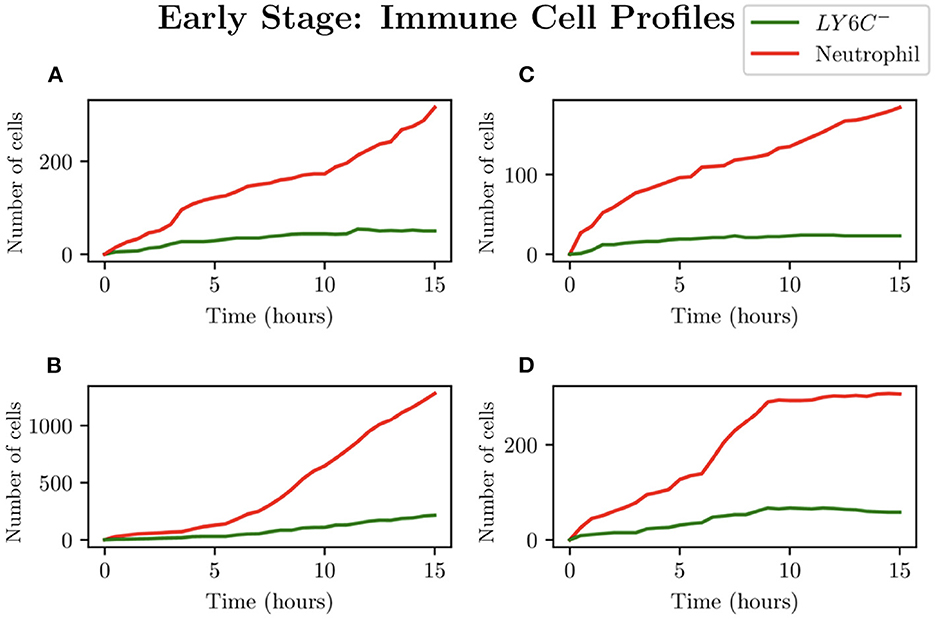
Figure 6. Simulations (A–D) represent the neutrophil and helper macrophages (LY6C−) profiles arising from the case IB = 1. The specific simulations correspond to those shown in Figure 5.
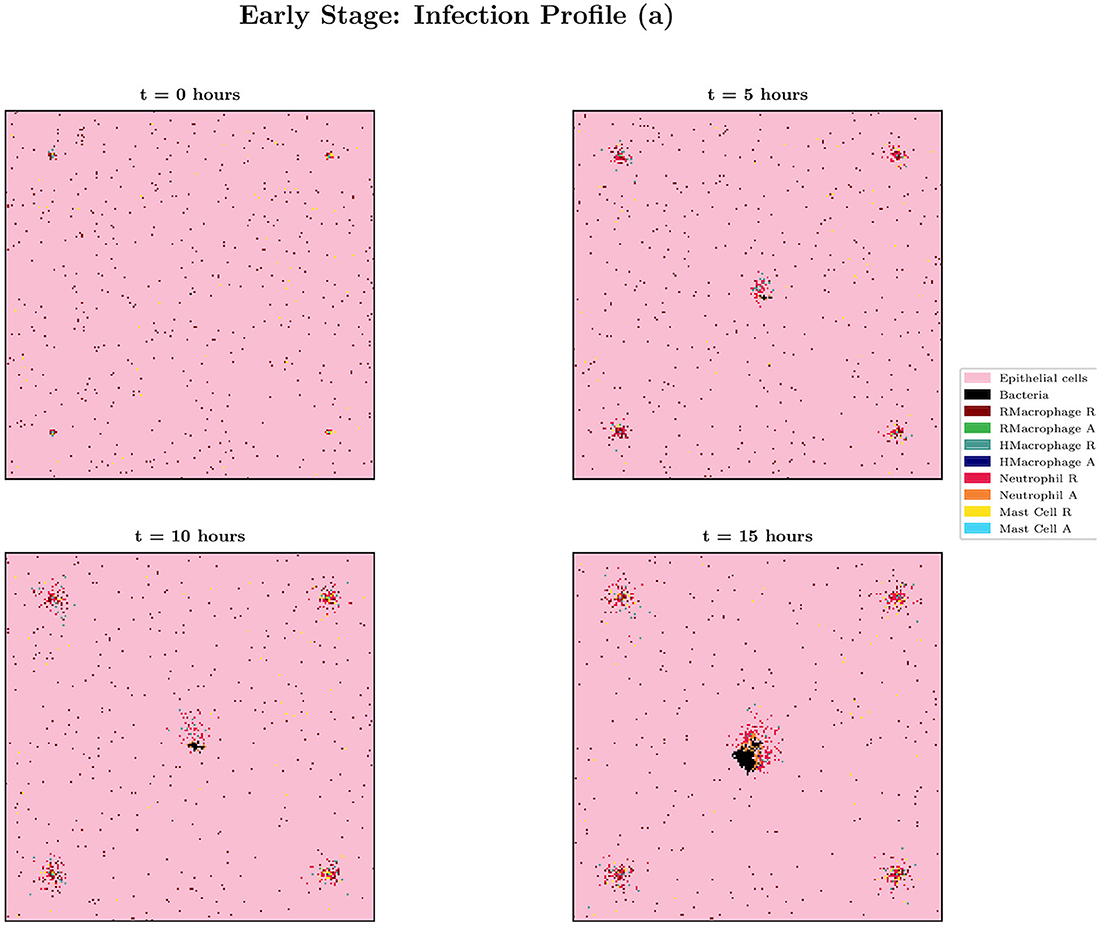
Figure 7. Spatial plot showing the agents in the system for simulation (a) from Figures 5, 6 at times t = 0, 5, 10 and 15 h. Agents and blood vessels indicated by the key in the plot.
While analysis of these individual simulations for the first 15 h is useful, we also look at the aggregate behavior resulting from our simulations with IB = 1. With a total of 200 simulations, run for a total of 80 h, clearance was achieved in 76.7% of instances. Within these, the vast majority (65.8%) was due to early clearance, i.e. before 15 h, with mid and late clearance accounting collectively for the remaining 10.9% of clearance cases.
Thus, our model indicates that low initial bacteria loads usually lead to total bacterial clearance within the initial stages of infection, with the majority of instances achieving total clearance within 6 h. However we see in this work that when only a single bacterium can lead to significant infection spread, as in 23.3% of simulations, clearance was never achieved. Here the bacteria were able to further colonize bladder epithelial tissue, bypassing immune cell action and bacterial shedding.
3.1.2. Case where IB = 100
We now investigate an initial bacterial load of IB = 100, by examining the different possible infection progression profiles. As can be seen in Figure 8, total clearance here does not occur at any time before t = 6 h, with the simulations in Figures 8A–D showing early periods of considerable bacterial growth before halting due to immune cell intervention. Simulation (Figure 8A) presents an individual infection simulation where the bacterial load reaches a maximum of , after which, the immune response achieves successful total clearance. Simulation (Figure 8B) on the other hand presents a relatively steady bacterial load until t = 9.50 h, reaching , after which the immune cells are only able to achieve partial clearance of the bacteria, with . In simulations (Figures 8C, D) we see the bacterial load decline occurring earlier in the simulations, with successful immune responses to the infection.
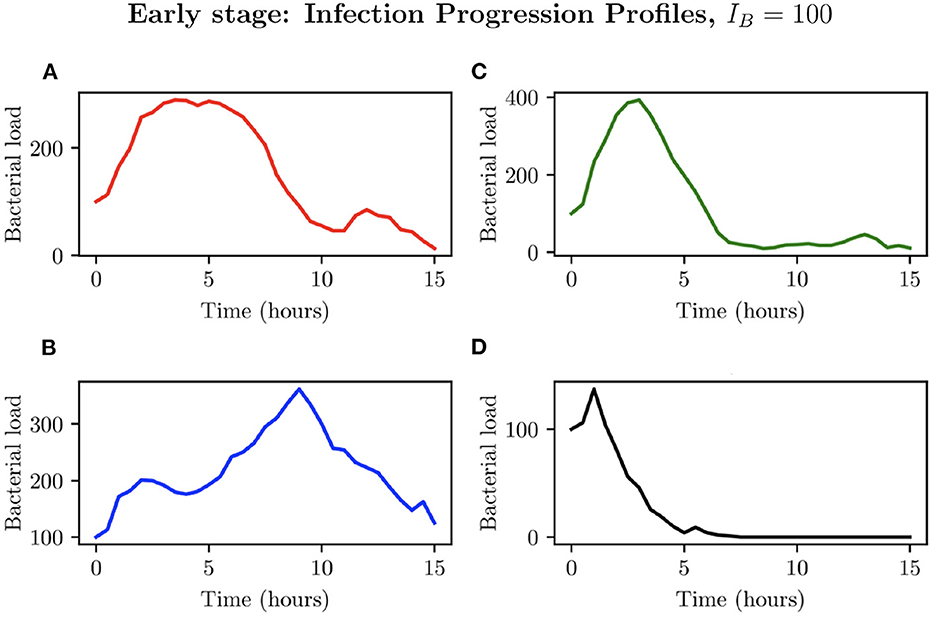
Figure 8. Simulations (A–D) represent the bacterial growth profiles arising from 4 simulations chosen to represent different possible outcomes for IB = 100.
In looking at the aggregate of the 200 simulations where IB = 100, we can see that bacteria persist in 30.8% of simulations (as opposed to 23.3% when IB = 1). Early clearance accounted for 45.8% of simulations while mid stage clearance accounted for 21.9% of instances. Late clearance was achieved in 3 simulations (1.5%). See Figure 9 for pie charts summarizing this.
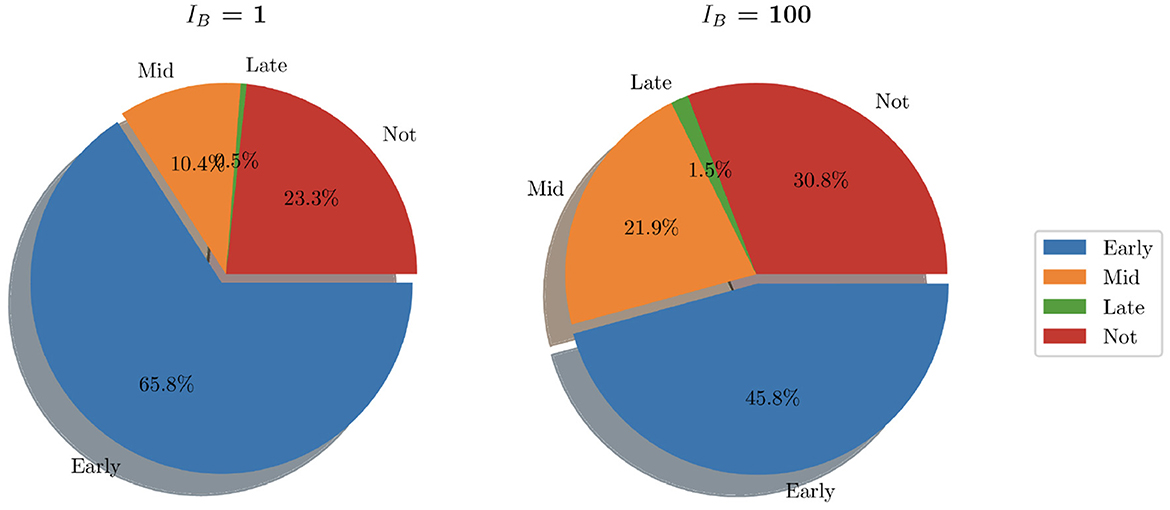
Figure 9. Pie charts summarizing bacterial clearance status for simulations with IB = 1 and IB = 100.
Although an increased IB causes recruitment of immune cells at earlier times to the site of infection in comparison with lower IB, bacteria are able to replicate and reach higher loads, typically having reached a maximum within the initial 5 h. As can be seen in Figures 8B, C instances attained bacterial loads NB > 300. Reaching these stable numbers allows the bacterial population to persist despite attempted clearing by neutrophils and helper macrophages. Through analysis of spatial plots we can see that earlier immune cell intervention in simulations with IB = 100, as opposed to simulations with IB = 1 is due to the closer proximity of the boundary of the bacterial population to recruited immune cells. As can be seen from Figure 10, the aggregate profiles and patterns of bacterial growth in the IB = 1 simulations are similar to those with IB = 100. The differences in the profiles of helper macrophages, neutrophil and bacterial clearance are due to the higher intensity of immune action due to the increased initial bacterial count.
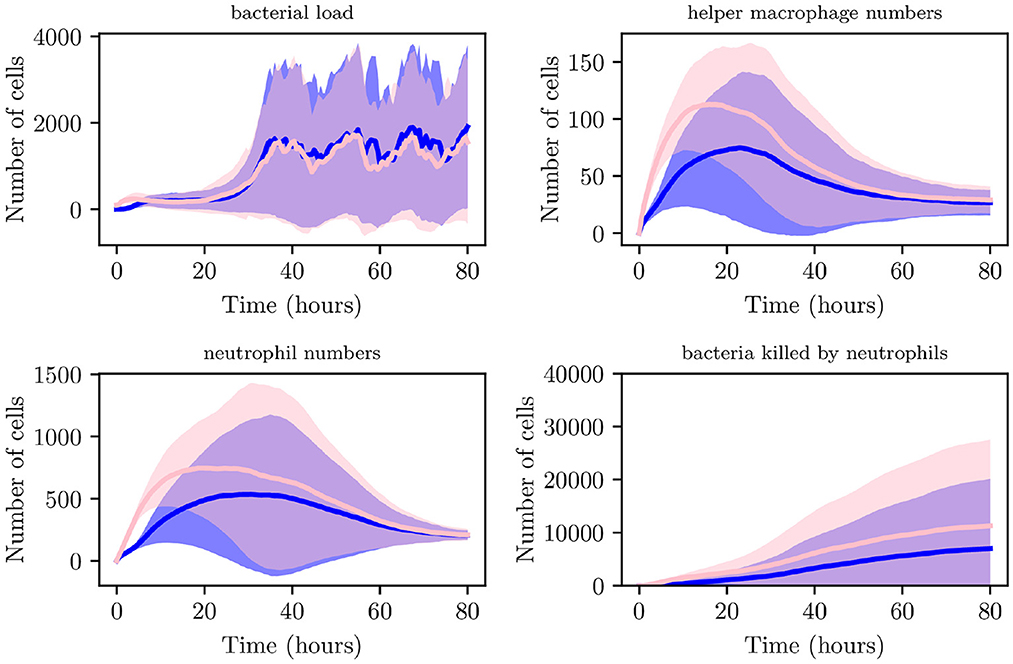
Figure 10. Average values for bacterial load, helper macrophage load, neutrophil load and neutrophil clearance for simulations with IB = 1 (shown in blue) and for simulations with IB = 100 (shown in pink), with 95% confidence intervals (shown by the shaded regions).
3.2. Bacterial replication rate
Studies have shown that UPEC presents different replication profiles [29]. At early stages of the infection, E. coli replicates with an average doubling time of 20–45 min [30]. As the infection progresses however, research has shown that UPEC adopts a relatively lower replication rate, estimated with a doubling time of 40–60 min [29]. We now include this to our model and investigate the effects on bacterial clearance and immune presence. In order to do this, we include two parameters describing the replication rate. Bearlysp describes the replication rate during the earlier stages of the model (when t < 10 h). On the other hand, Blatesp is then used after 10 h. Hence, we set
Here we analyse the output resulting from 1,000 individual simulations of our model, allowing us to create and analyse a virtual population as in Verma et al. [31, 33] and Niederer et al. [32]. We allow UPEC to adopt two replication profiles as detailed above, whilst also varying the initial bacterial load, IB ∈ {1, 100, 500, 1,000}, with 200 simulations performed for each case.
This will allow us to investigate the effects IB can have on the progression of the infection. As can be seen from Figure 11, during the initial 2 h, lower IB present a relatively slower growth rate while high IB will initially present with a much higher growth rate. These differences however are less noticeable when looking at 2 < t < 9 h, as the bacterial count of high IB begins to decline due to clearance by neutrophils and helper macrophages that have arrived at the site of infection. While in contrast, a low IB allows bacteria to maintain a steady growth within the interval 2 < t < 6 h. Once 9 < t < 14 h, all simulations converge closely. The final bacterial load of the early stage, , matches in order of initial bacterial count except for IB = 1 which has managed to overtake IB = 100. Although the trend appearing from the early stages of infection seems to indicate possible bacterial clearance, once we look at the later stages of the simulation we realize the importance bacterial shedding plays, where we see the periodic nature of the bacterial profiles.
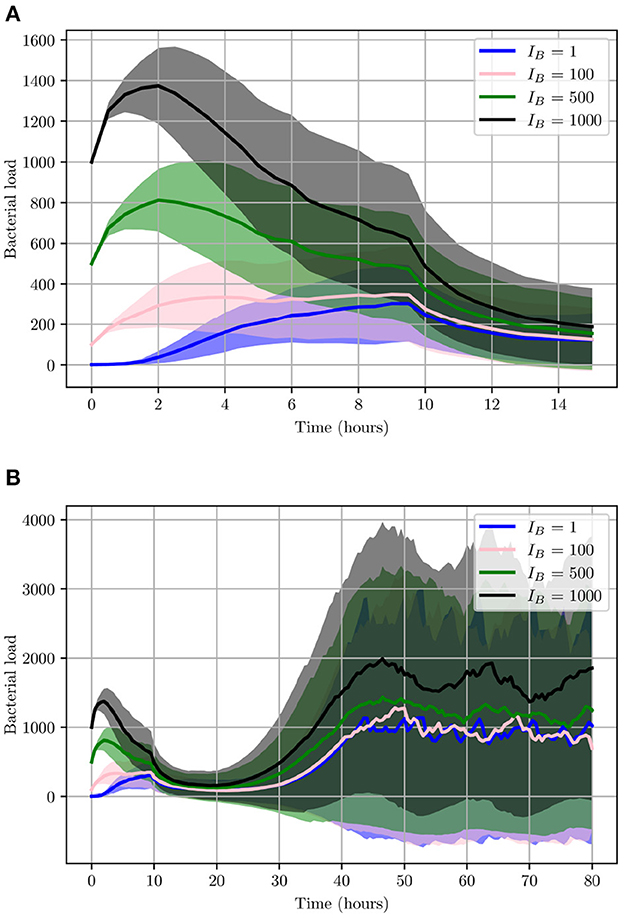
Figure 11. Average values for bacterial load. (A) The early stage with initial bacterial loads IB ∈ {1, 100, 500, 1,000}. (B) The average loads throughout the entire simulation (0 < t < 80). Ninety-five percent confidence intervals are shown by the shaded regions.
As illustrated in Figure 11, although the growth of UPEC during the early stages can be slow and heavily hindered by neutrophils, at later stages bacterial growth increases significantly. Consequently, bacterial shedding can be a crucial mechanism to control infection within the superficial urothelium and prevent full colonization of the bladder wall.
Similarly to Figure 9, we show the pie charts of these simulations where we have taken the following initial bacterial loads: IB = 500 and IB = 1,000. In contrast to the earlier analysis shown in Figure 9 where we looked at relatively low initial bacterial loads, Figure 12 presents the clearance in the case of high initial bacterial loads. As we can see, with higher initial bacterial loads, clearance is not achieved in 40.6% of instances (when IB = 500) and 61.9% when (IB = 1,000). In addition to this, total bacterial clearance is now achieved generally during the middle stages of infection rather than early stages as was shown with IB = 1 and IB = 100. This signals toward the ability of higher IB to establish more severe infections.
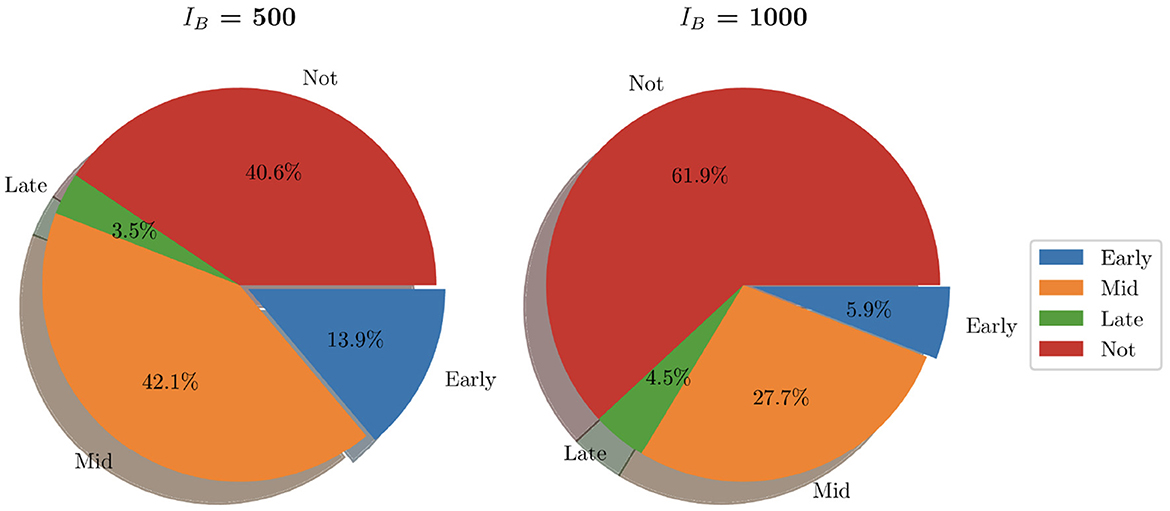
Figure 12. Pie charts summarizing bacterial clearance status for simulations with IB = 500 and IB = 1,000.
3.2.1. Simulating an immunocompromised environment
We now generate 200 simulations with IB = 1, however, we change the number of resident immune cells to reflect an immunocompromised environment. We set IrM = 300, and IMC = 30 (as opposed to all previous simulations where IrM = 500 and IMC = 50). As can be seen in Figure 13, in an immunocompromised environment with low initial loads of resident immune cells, our model indicates that bacteria are able to establish larger infections. Furthermore, an aggregate analysis of the 200 simulations (see Figure 14) indicates that our model does not achieve clearance in 51% of instances, in contrast with the non-immunocompromised environment (also IB = 1), only 23.3% of simulations do not achieve clearance. Our model produced late clearance in 6.7% of instances, which allows more time for the bacteria to penetrate the umbrella cells and potentially form more QIRs. This in turn would lead to greater bacterial loads and growth post shedding, thus increasing the likelihood of recurrence.
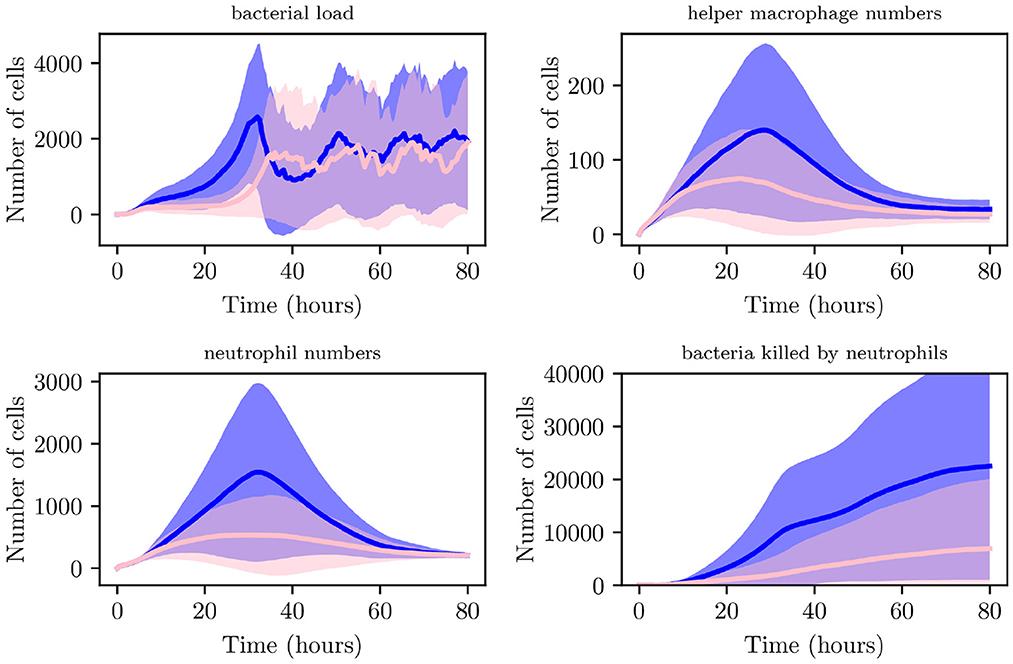
Figure 13. Average values for bacterial load, helper macrophage load, neutrophil load and bacteria killed by neutrophils. Simulations for the immunocompromised environment in pink and the non-immunocompromised environment in blue, with 95% confidence intervals shown by the shaded regions.
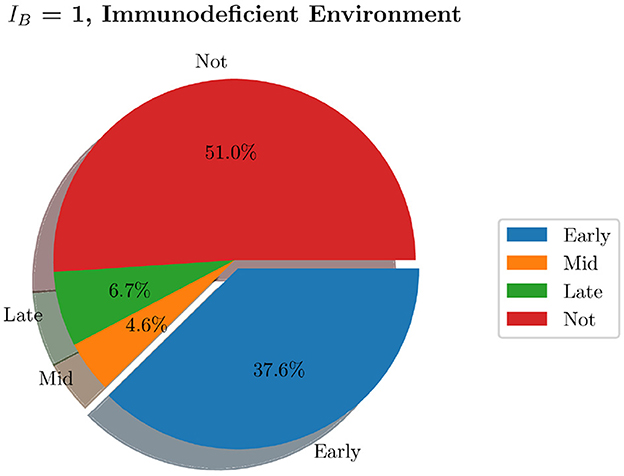
Figure 14. Pie charts summarizing bacterial clearance status for simulations with and immunocompromised environment, IB = 1.
4. Discussion
We have developed a spatial mathematical model to investigate the pathogen-host response in a typical bladder infection. In a 2-dimensional 16 mm2 section of the bladder, we use our hybrid individual-based model to simulate Uropathogenic E. coli as individual elements, as well as immune cells. In particular, we model resident and helper macrophages, neutrophils and mast cells. In addition to these discrete elements, we also model a generic chemokine in order to act as a chemoattractant. This is molecule directs the immune cells to the site of infection, diffusing into the spatial domain via a PDE.
In this paper, we have outlined the basic framework for the model. We include a gradual decrease in the speed of bacteria, as evidenced in the literature, and also model bacterial shedding as a mechanism for reducing bacterial burden in the bladder. We investigate several initial bacterial loads and show that even with one bacterium at the start of the simulation it is possible for infection to spread with colonization of the bladder epithelial tissue. This finding is consistent with recent work in the porcine model of UTI, in which an initial inoculum of ≤10 bacteria was sufficient to seed a productive infection in vivo [34]. Not surprisingly, as the initial bacterial burden increases, the time taken for the infection to clear increases. The number of simulations not cleared within the 80 h of the simulated infection also increases as the initial bacterial load increases. Interestingly, the average number of bacteria present in the cases where the infection is not cleared, is not too dissimilar for IB = 1,000, and we only see a big difference when IB = 1,000. At this initial bacterial load, the average number of bacteria during the late stage of infection is significantly larger than for smaller initial bacterial loads. In Section 3.2.1 we investigate an immunocompromised environment with smaller numbers of immune cells acting against the infection. Here we see, as expected, that for immunocompromised simulations, more cases resulted in infection persisting at the end of the simulation than in the non-immunocompromised simulations. These results are consistent with clinical scenarios. For example, UTI occurs in up to 72% of immunocompromised donor kidney recipients, usually within the first few months post-transplant [35].
We have shown that the modeling framework that we have developed is able to simulate various scenarios in order to analyse the resulting impact of particular parameters, helping to aid understanding of these infections. Although we have only modeled the first 80 h of an infection course, as we keep a count in the model of the bacteria that manage to penetrate into the epithelial bladder wall and evade bacterial shedding, in future work we will run longer simulations to investigate the growth of these bacteria and their role in recurrent infections. We also plan to integrate a Pharmacokinetic/Pharmacodynamic (PK/PD) model of commonly used antibiotics in order to simulate treatment effects. To our knowledge, integrating a PK/PD model into a spatial model has not been done before to study bladder infections, and the spatio-temporal framework we present here is the crucial starting point. We are also in the process of completing parallel wet-lab experiments to compare to our model simulations. This analysis will be shown in future publications. We acknowledge the limitations of the model parameterisation of our framework and also plan to conduct a number of simulations to more rigorously test the effects of varying the neutrophil parameters, as these were highlighted in the sensitivity analysis as the most sensitive quantities. We also plan to include the BECs as agents within the model in future iterations, as well as expand the model to three dimensions in order to more realistically simulate the environment. With the planned future developments, this model will be capable of providing new clinical insight into bladder infections.
Data availability statement
The original contributions presented in the study are publicly available. This data can be found at: https://github.com/Ruth-Bowness-Group/UTImodel, https://doi.org/10.5281/zenodo.7293870.
Author contributions
RB provided funding for the work. RB and ALD contributed to model conception and wrote the first draft of the manuscript. ALD, RB, TL, JR, and BP contributed to the design of the study. ALD created the computational code and performed analyses. TL, JR, and BP wrote sections of the manuscript. All authors contributed to manuscript revision, read, and approved the submitted version.
Funding
RB was supported by a fellowship funded by the Medical Research Council, MR/P014704/1, and also acknowledges funding from the Academy of Medical Sciences (London), the Wellcome Trust (London), the UK Government Department of Business, Energy and Industrial Strategy (London), the British Heart Foundation (London), and the Global Challenges Research Fund (Swindon, UK; grant number SBF003\1052). TL gratefully acknowledges support from the Italian Ministry of University and Research (MUR) through the grant Dipartimenti di Eccellenza 2018-2022 (Project no. E11G18000350001) and the PRIN 2020 project (No. 2020JLWP23) Integrated Mathematical Approaches to Socio-Epidemiological Dynamics (CUP: E15F21005420006).
Conflict of interest
The authors declare that the research was conducted in the absence of any commercial or financial relationships that could be construed as a potential conflict of interest.
Publisher's note
All claims expressed in this article are solely those of the authors and do not necessarily represent those of their affiliated organizations, or those of the publisher, the editors and the reviewers. Any product that may be evaluated in this article, or claim that may be made by its manufacturer, is not guaranteed or endorsed by the publisher.
References
1. Flores-Mireles AL, Walker JN, Caparon M, Hultgren SJ. Urinary tract infections: epidemiology, mechanisms of infection and treatment options. Nat Rev Microbiol. (2015) 13:269–84. doi: 10.1038/nrmicro3432
2. Stamm WE, Norrby SR. Urinary tract infections: disease panorama and challenges. J Infect Dis. (2001) 183:S1-S4. doi: 10.1086/318850
3. Hannan TJ, Totsika M, Mansfield KJ, Moore KH, Schembri MA, Hultgren SJ. Host-pathogen checkpoints and population bottlenecks in persistent and intracellular uropathogenic Escherichia coli bladder infection. FEMS Microbiol Rev. (2012) 36:616–48. doi: 10.1111/j.1574-6976.2012.00339.x
4. Kostakioti M, Hultgren SJ, Hadjifrangiskou M. Molecular blueprint of uropathogenic Escherichia coli virulence provides clues toward the development of anti-virulence therapeutics. Virulence. (2012) 3:592–3. doi: 10.4161/viru.22364
5. Subashchandrabose S, Hazen TH, Brumbaugh AR, Himpsl SD, Smith SN, Ernst RD, et al. Host-specific induction of Escherichia coli fitness genes during human urinary tract infection. Proc Natl Acad Sci USA. (2014) 111:18327–32. doi: 10.1073/pnas.1415959112
6. Abraham SN, Miao Y. The nature of immune responses to urinary tract infections. Nat Rev Immunol. (2015) 15:655–63. doi: 10.1038/nri3887
7. Hayes BW, Abraham SN. Innate immune responses to bladder infection. Microbiol Spectrum. (2016) 4:4–6. doi: 10.1128/microbiolspec.UTI-0024-2016
8. Lacerda Mariano L, Ingersoll MA. The immune response to infection in the bladder. Nat Rev Urol. (2020) 17:439–58. doi: 10.1038/s41585-020-0350-8
9. Song J, Bishop BL, Li G, Duncan MJ, Abraham SN. TLR4-initiated and cAMP-mediated abrogation of bacterial invasion of the bladder. Cell Host Microbe. (2007) 1:287–98. doi: 10.1016/j.chom.2007.05.007
10. Terlizzi ME, Gribaudo G, Maffei ME. UroPathogenic Escherichia coli (UPEC) infections: virulence factors, bladder responses, antibiotic, and non-antibiotic antimicrobial strategies. Front Microbiol. (2017) 8:1566. doi: 10.3389/fmicb.2017.01566
11. Kim M, Ashida H, Ogawa M, Yoshikawa Y, Mimuro H, Sasakawa C. Bacterial interactions with the host epithelium. Cell Host Microbe. (2010) 8:20–35. doi: 10.1016/j.chom.2010.06.006
12. Nagamatsu K, Hannan TJ, Guest RL, Kostakioti M, Hadjifrangiskou M, Binkley J, et al. Dysregulation of Escherichia coli α-hemolysin expression alters the course of acute and persistent urinary tract infection. Proc Natl Acad Sci USA. (2015) 112:E871–80. doi: 10.1073/pnas.1500374112
13. Chromek M, Slamová Z, Bergman P, Kovács L, Ehrén I, Hökfelt T, et al. The antimicrobial peptide cathelicidin protects the urinary tract against invasive bacterial infection. Nat Med. (2006) 12:636–41. doi: 10.1038/nm1407
14. Bishop BL, Duncan MJ, Song J, Li G, Zaas D, Abraham SN. Cyclic AMP-regulated exocytosis of Escherichia coli from infected bladder epithelial cells. Nat Med. (2007) 13:625–30. doi: 10.1038/nm1572
15. Mysorekar IU, Isaacson-Schmid M, Walker JN, Mills JC, Hultgren SJ. Bone morphogenetic protein 4 signaling regulates epithelial renewal in the urinary tract in response to uropathogenic infection. Cell Host Microbe. (2009) 5:463–75. doi: 10.1016/j.chom.2009.04.005
16. Godaly G, Bergsten G, Hang L, Fischer H, Frendeus B, Lundstedt AC, et al. Neutrophil recruitment, chemokine receptors, and resistance to mucosal infection. J Leukocyte Biol. (2001) 69:899–906. doi: 10.1189/jlb.69.6.899
17. Shahin R, Engberg I, Hagberg L, Eden CS. Neutrophil recruitment and bacterial clearance correlated with LPS responsiveness in local gram-negative infection. J Immunol. (1987) 138:3475–80. doi: 10.4049/jimmunol.138.10.3475
18. Michlewska S. Macrophage phagocytosis of apoptotic neutrophils is critically regulated by the opposing actions of pro-inflammatory and anti-inflammatory agents: key role for TNF-α (2011).
19. Soruri A, Grigat J, Forssmann U, Riggert J, Zwirner J. β-Defensins chemoattract macrophages and mast cells but not lymphocytes and dendritic cells: CCR6 is not involved. Eur J Immunol. (2007) 37:2474–86. doi: 10.1002/eji.200737292
20. Säve S, Persson K. Extracellular ATP and P2Y receptor activation induce a proinflammatory host response in the human urinary tract. Infect Immunity. (2010) 78:3609–15. doi: 10.1128/IAI.00074-10
21. Jang TY, Kim YH. Interleukin-33 and mast cells bridge innate and adaptive immunity: from the Allergologist's perspective. Int Neurourol J. (2015) 19:142. doi: 10.5213/inj.2015.19.3.142
22. Chan CY, John ALS, Abraham SN. Mast cell interleukin-10 drives localized tolerance in chronic bladder infection. Immunity. (2013) 38:349–59. doi: 10.1016/j.immuni.2012.10.019
23. Paya AS, Fernandez DR, Gil D, Garcia Chamizo JM, Perez FM. Mathematical modeling of the lower urinary tract. Comput Methods Programs Biomed. (2013) 109:323–38. doi: 10.1016/j.cmpb.2012.09.005
24. Wilensky U, Rand W. An Introduction to Agent-Based Modeling: Modeling Natural, Social, and Engineered Complex Systems With NetLogo. Cambridge, MA: Mit Press (2015).
25. Parunak HVD. “Go to the ant”: engineering principles from natural multi-agent systems. Ann Oper Res. (1997) 75:69–101. doi: 10.1023/A:1018980001403
26. Wilensky U, Reisman K. Thinking like a wolf, a sheep, or a firefly: learning biology through constructing and testing computational theories–an embodied modeling approach. Cogn Instruct. (2006) 24:171–209. doi: 10.1207/s1532690xci2402_1
27. Wang X, Liu W, O'Donnell M, Lutgendorf S, Bradley C, Schrepf A, et al. Evidence for the role of mast cells in cystitis-associated lower urinary tract dysfunction: a multidisciplinary approach to the study of chronic pelvic pain research network animal model study. PLoS ONE. (2016) 11:e0168772. doi: 10.1371/journal.pone.0168772
28. Johnzon CF, Rönnberg E, Pejler G. The role of mast cells in bacterial infection. Am J Pathol. (2016) 186:4–14. doi: 10.1016/j.ajpath.2015.06.024
29. Forsyth VS, Armbruster CE, Smith SN, Pirani A, Springman AC, Walters MS, et al. Rapid growth of uropathogenic Escherichia coli during human urinary tract infection. mBio. (2018) 9:e00186–18. doi: 10.1128/mBio.00186-18
30. Justice SS, Hung C, Theriot JA, Fletcher DA, Anderson GG, Footer MJ, et al. Differentiation and developmental pathways of uropathogenic Escherichia coli in urinary tract pathogenesis. Proc Natl Acad Sci. (2004) 101:1333–38. doi: 10.1073/pnas.0308125100
31. Verma BK, Subramaniam P, Vadigepalli R. Model-based virtual patient analysis of human liver regeneration predicts critical perioperative factors controlling the dynamic mode of response to resection. BMC Syst Biol. (2019) 13:1–15. doi: 10.1186/s12918-019-0678-y
32. Niederer S, Aboelkassem Y, Cantwell CD, Corrado C, Coveney S, Cherry EM, et al. Creation and application of virtual patient cohorts of heart models. Philos Trans R Soc A. (2020) 378:20190558. doi: 10.1098/rsta.2019.0558
33. Verma BK, Subramaniam P, Vadigepalli R. Characterizing different class of patients based on their liver regeneration capacity post hepatectomy and the prediction of safe future liver volume for improved recovery. In: 2018 International Conference on Bioinformatics and Systems Biology (BSB). Allahabad: IEEE (2018). p. 152–6.
34. Stærk K, Andersen MØ, Andersen TE. Uropathogenic Escherichia coli can cause cystitis at extremely low inocula in a pig model. J Med Microbiol. (2022) 71:001537. doi: 10.1099/jmm.0.001537
35. Mitra S, Alangaden GJ. Recurrent urinary tract infections in kidney transplant recipients. Curr Infect Dis Rep. (2011) 13:579–87. doi: 10.1007/s11908-011-0210-z
36. Patel AA, Ginhoux F, Yona S. Monocytes, macrophages, dendritic cells and neutrophils: an update on lifespan kinetics in health and disease. Immunology. (2021) 163:250–61. doi: 10.1111/imm.13320
37. Barros-Becker F, Lam PY, Fisher R, Huttenlocher A. Live imaging reveals distinct modes of neutrophil and macrophage migration within interstitial tissues. J Cell Sci. (2017) 130:3801–8. doi: 10.1242/jcs.206128
Keywords: mathematical, model, individual-based, simulation, bladder, infection, Escherichia coli
Citation: Lasri Doukkali A, Lorenzi T, Parcell BJ, Rohn JL and Bowness R (2023) A hybrid individual-based mathematical model to study bladder infections. Front. Appl. Math. Stat. 9:1090334. doi: 10.3389/fams.2023.1090334
Received: 05 November 2022; Accepted: 10 January 2023;
Published: 03 February 2023.
Edited by:
Esteban A. Hernandez-Vargas, University of Idaho, United StatesReviewed by:
Babita K. Verma, Johns Hopkins University, United StatesFlorian Wagenlehner, University of Giessen, Germany
Copyright © 2023 Lasri Doukkali, Lorenzi, Parcell, Rohn and Bowness. This is an open-access article distributed under the terms of the Creative Commons Attribution License (CC BY). The use, distribution or reproduction in other forums is permitted, provided the original author(s) and the copyright owner(s) are credited and that the original publication in this journal is cited, in accordance with accepted academic practice. No use, distribution or reproduction is permitted which does not comply with these terms.
*Correspondence: Ruth Bowness,  rb2250@bath.ac.uk