An agent-based multi-level model to study the spread of gonorrhea in different and interacting risk groups
 Paola Stolfi
 Davide Vergni
 Filippo Castiglione
- 1Institute for Applied Computing (IAC), National Research Council of Italy, Rome, Italy
- 2Biotech Research Center, Technology Innovation Institute, Abu Dhabi, United Arab Emirates
Introduction: Mathematical modeling has emerged as a crucial component in understanding the epidemiology of infectious diseases. In fact, contemporary surveillance efforts for epidemic or endemic infections heavily rely on mathematical and computational methods. This study presents a novel agent-based multi-level model that depicts the transmission dynamics of gonorrhea, a sexually transmitted infection (STI) caused by the bacterium Neisseria gonorrhoeae. This infection poses a significant public health challenge as it is endemic in numerous countries, and each year sees millions of new cases, including a concerning number of drug-resistant cases commonly referred to as gonorrhea superbugs or super gonorrhea. These drug-resistant strains exhibit a high level of resistance to recommended antibiotic treatments.
Methods: The proposed model incorporates a multi-layer network of agents' interaction representing the dynamics of sexual partnerships. It also encompasses a transmission model, which quantifies the probability of infection during sexual intercourse, and a within-host model, which captures the immune activation following gonorrhea infection in an individual. It is a combination of agent-based modeling, which effectively captures interactions among various risk groups, and probabilistic modeling, which enables a theoretical exploration of sexual network characteristics and contagion dynamics.
Results: Numerical simulations of the dynamics of gonorrhea infection using the complete agent-based model are carried out. In particular, some examples of possible epidemic evolution are presented together with an application to a real case study. The goal was to construct a virtual population that closely resembles the target population of interest.
Discussion: The uniqueness of this research lies in its objective to accurately depict the influence of distinct sexual risk groups and their interaction on the prevalence of gonorrhea. The proposed model, having interpretable and measurable parameters from epidemiological data, facilitates a more comprehensive understanding of the disease evolution.
1. Introduction
Effective surveillance of endemic and epidemic infections, along with the implementation of control measures, greatly benefits from the insights gained through precise mathematical modeling. Mathematical modeling plays a pivotal role in accurately characterizing the transmission and spread of diseases by providing a solid formal framework to represent various factors contributing to epidemic dynamics. Additionally, the use of robust statistical methods for parameter estimation enhances the reliability and accuracy of these models.
The present study is conducted as part of the JPIAMR-project MAGIcIAN1, an international initiative focused on promoting the sustainable introduction of novel class and last-resort antimicrobial drugs while minimizing the emergence of antimicrobial resistance. Within this project, one of the primary objectives, which is the subject of this article, is to develop a computational model that accurately captures the dynamics of gonorrhea transmission, a sexually transmitted infection (STI) caused by the bacterium Neisseria gonorrhoeae (N. gonorrhoeae). The aim is to provide scenarios that assist in controlling the prevalence of this infection.
The selection of the N. gonorrhoeae bacterium for this study is driven by its significant impact on public health. It remains a major concern due to the alarming number of new cases reported worldwide. According to the World Health Organization (WHO), an estimated 82.4 million new cases were recorded among adolescents and adults aged 15–49 years in 2020 alone2. Furthermore, the emergence of extensively drug-resistant strains of gonorrhea, commonly known as gonorrhea superbugs or super gonorrhea, poses an additional threat. These strains exhibit high-level resistance not only to the current recommended treatments for gonorrhea (ceftriaxone and azithromycin) but also to other commonly used antibiotics such as penicillin, sulphonamides, tetracycline, fluoroquinolones, and macrolides. This combination of a significant number of new cases and the presence of extensively drug-resistant strains underscores the urgent need for a better understanding of the spread and control of this infection.
In recent years, scientists have dedicated significant efforts to studying the N. gonorrhoeae infection from various perspectives, recognizing its threat to public health. These efforts have yielded valuable insights. For instance, in the study by Spicknall et al. [1], the authors explore the relative importance of different anatomical sites in gonorrhea transmission among men who have sex with men (MSM). They propose an anatomical site-specific gonorrhea transmission model specific to this population. Another study by Craig et al. [2] investigates the potential impact of a vaccine on the spread of gonorrhea using an individual-based epidemiological simulation model. Their work delves into the effects of vaccination strategies in mitigating the transmission dynamics of the infection. Heymans et al. [3] examine the role of sexual habits in determining different transmission networks. They construct a MSM sexual network using molecular data from a clinic in Amsterdam and compare the resulting clusters with epidemiological characteristics obtained from questionnaires. This study sheds light on the relationship between sexual behavior and the spread of gonorrhea. Additionally, Buyze et al. [4] investigate the impact of screening activities on the prevalence of gonorrhea within the homosexual community. Their research explores the effectiveness of screening interventions in reducing the prevalence of the infection.
These studies, among others, contribute to a comprehensive understanding of gonorrhea transmission, its associated factors, and potential control measures.
In the realm of mathematical treatment for the spread of sexually transmitted infections (STIs), a crucial aspect to consider is the sexual contact network. This network is represented by a graph consisting of nodes that represent individuals in the community and edges that represent sexual connections between two individuals. Numerous contributions in literature have focused on modeling sexual contact networks. For example, Buyze et al. [4] utilized a separable temporal exponential-family random graph model to characterize the sexual contact network of MSM in Belgium. They calibrated their model using data from Belgian participants in the European MSM Internet Survey [5], which has been conducted since 2010 and provides a large and diverse sample of MSM across Europe. Vajdi et al. [6] introduced a multilayer sexual contact network that accounts for both steady and casual partnerships. In their model, individuals can be in either an active or inactive state, which is independent of their infection status and solely pertains to their search for sexual partners. The transition between these states is modeled as a stochastic process. The authors investigated the spread of STIs using a susceptible-infected-susceptible (SIS) model and developed a mean-field approximation to describe the spreading process. These studies, among others, have made significant contributions to understanding the dynamics of STI transmission by incorporating the complex structure of sexual contact networks. The incorporation of these networks provides a more realistic and comprehensive representation of the spread of STIs within communities. In Mei et al. [7], the focus is on explaining the HIV epidemic among MSM in Amsterdam. The authors introduce a complex agent network that combines a multi-agent system with a complex network to depict the network of sexual partnerships. The model is calibrated using various data sources, including questionnaires, clinical data, and information from literature. This comprehensive approach allows for a more accurate representation of the HIV epidemic dynamics. Zarrabi et al. [8] reconstruct the HIV transmission network in central Italy by integrating social and genetic data. Through their work, they reveal the significant role of transmission between different risk groups in HIV spread. This approach provides insights into the interconnectedness of various risk groups and their contributions to the overall transmission dynamics. In Whittles et al. [9], a dynamic power-law sexual network is proposed to study a gonorrhea outbreak. The authors introduce an affinity parameter that describes the propensity to form and dissolve partnerships, which are modeled using stochastic processes. The methodology is applied to the MSM community, utilizing data from the Natsal-3 survey [10], and calibrating the models based on data from the Gonococcal Resistance to Antimicrobial Surveillance Programme [11], conducted by the UK Health Security Agency (formerly Public Health England). Additionally, the study investigates the impact of screening, condom use, and the introduction of vaccines on the gonorrhea outbreak.
These studies highlight the importance of incorporating complex sexual networks and diverse data sources to understand and control the spread of STIs, such as HIV and gonorrhea, among specific populations. The combination of agent-based modeling, network analysis, and data calibration provides valuable insights into the dynamics of STI transmission and the potential impact of control measures.
The model here presented offers a comprehensive depiction of the spread of gonorrhea by incorporating both population-level (between-host) and individual-level (within-host) dynamics. This multi-level approach allows for a more accurate representation of infection dynamics among different risk groups and enables the inclusion of targeted intervention strategies to control the prevalence of the infection. At the between-host level, the model incorporates a dynamic multilayer network that captures the dynamics of sexual partnerships among individuals. This network takes into account the existence of different sexual orientations, represented as different layers, and the interactions between them, including bisexual individuals. This approach goes beyond the common focus on the MSM community and acknowledges the diversity of sexual orientations and their potential impact on gonorrhea transmission. The transmission model within the between-host component accounts for the probability of gonorrhea infection during sexual intercourse. By considering the dynamics of sexual partnerships and the varying risks associated with different types of sexual interactions, the model provides a more realistic representation of the transmission process. The within-host component of the model comprises a set of ordinary differential equations that describe the evolution of the pathogen and the immune response within an individual. This component also considers the use of antibiotic treatments, which play a crucial role in controlling the infection at the individual level. By integrating these between-host and within-host components, the model offers a comprehensive framework for studying the spread of gonorrhea, considering both the population-level dynamics of sexual partnerships and the individual-level dynamics of the pathogen and immune response. This holistic approach provides a more accurate representation of the infection dynamics and enables the exploration of targeted intervention strategies to control the prevalence of gonorrhea.
The principal novelty of this work is in combining the flexibility of Agent-Based Modeling (ABM) [12] with a formal probabilistic model, enabling the study of complex interactions and the identification of interpretable parameters from available data. In this approach, each agent in the model represents an individual with specific features that influence the dynamics of infection and disease progression. Two important characteristics considered for each agent are their sexual orientation and level of promiscuity, which significantly impact the likelihood of acquiring and transmitting gonorrhea infection. The sexual contact network is represented as a dynamic power-law interacting multilayer network. Each layer corresponds to a different risk group, such as Heterosexuals (HMW or HM and HW to differentiate gender), Men Having Sex with Men (MSM), and Women Having Sex with Women (WSW). Each risk group exhibits distinct sexual behavior, leading to different degree distributions within each layer. Additionally, the model incorporates individuals who are bisexual, allowing for interactions between different layers and communities. The ABM approach offers the potential to enrich agent characteristics as the model evolves and new epidemiological data becomes available. It also enables the modeling of interactions between different communities, which is crucial for capturing the overall dynamics of infection. Moreover, the model allows for customization of the infection dynamics within an individual based on their specific features, assigning a risk of infection to each individual.
To the best of our knowledge, this is the first attempt to model gonorrhea infection at multiple levels while considering different risk groups. By integrating ABM with a probabilistic framework, this approach provides a novel and comprehensive tool for studying the dynamics of gonorrhea infection and understanding the impact of different risk groups on its spread.
2. Results
In this section, we present some numerical simulations of the dynamics of gonorrhea infection using the complete agent-based model. In Section 2.1 we present some example of possible epidemic evolution while in Section 2.2 we apply our model to a real case study. The goal is to construct a virtual population that closely resembles the target population of interest. To achieve this, we define the distribution of agent features within the virtual population, including gender, sexual orientation, presence of infections, and symptoms among individuals. Moreover, also the parameters associated with the dynamics of sexual partnerships, i.e., how partnerships form, evolve, and dissolve over time, need to be determined in order to capture the complexity of real-world sexual interactions. Finally, some parameters related to the transmission of infection and to the within-host dynamics are needed. The goal is to determine parameters to ensure that the model behavior aligns with observed data and known epidemiological characteristics. For a more comprehensive understanding of each level and its mathematical and implementation details, please refer to the Section “Materials and methods”. That section provides in-depth explanations of the model's components, algorithms, and numerical techniques employed in the study. The multi-level model is implemented in R programming language.
2.1. Simulation study
In this section we construct several simulation examples aimed at showing the behavior of the sexual contact network and of the complete multi-level model. Specifically, these simulations involve a population of N = 20, 000 individuals, distributed across different sexual orientations. Within this simulated population, 60% of individuals are heterosexual, 35% are homosexual males, and 5% are homosexual females. This distribution of sexual orientations within the simulated population reflects the proportions observed in the SOAP data (see Section 2.2).
As specified in Section 2.2, the degree distribution of each community or risk group, follows a power law distribution with different exponent γ, see Section 4 for details. We consider three sets of parameters for these exponents which are reported in Table 1. Specifically, Par 2 and Par 3 are obtained by estimating the degree distribution of the three considered communities in Amsterdam and Rotterdam respectively, while Par 1 is set to test our model with higher values of the γ parameter for the heterosexual and the homosexual communities.
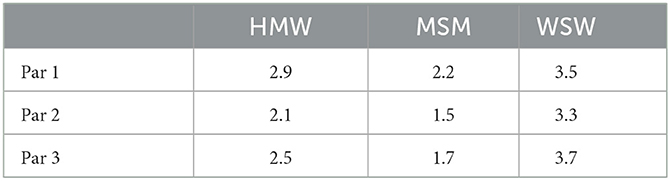
Table 1. Power law distribution parameters used in the simulation examples.
For each of these sets we consider four different mixing scenarios which means that among homosexual men and women, some of them are bisexual, therefore they have the potential to form sexual partnerships with individuals from both homosexual and heterosexual communities. The four mixing scenarios are: no mixing, 1% of mixing, 10% of mixing and 25% of mixing.
For each scenario we provide information regarding the Largest Connected Component (LCC), the diameter of the LCC, the degree distribution and the dynamic of the epidemics.
In the study of networks, and most importantly in the case of dynamical networks, the concepts of LCC and diameter play a crucial role in understanding the overall structure of the network and provide valuable insights into the evolution of dynamical processes over the nextwork [13]. Moreover, in our case, the study of these quantities is mandatory in order to have a good topological description of the structure of a multi-layer dynamic network with different mixing levels between the layers that nontrivially affect the infection spreading. The LCC is the largest subset of nodes within a network that are mutually connected, i.e., there is always a path between any two nodes in the component [14]. Obviously the LCC in a dynamical network can change over time and, a fortiori, has important implications in the epidemic spreading. The diameter of a network refers to the longest among all the shortest path between any pair of nodes within the network. It measures the distance in steps, via the shortest path, of the two farthest nodes in the network. The diameter provides a measure of the network's efficiency in terms of communication and information transfer [14]. A smaller diameter implies that nodes in the network can be easily connected and it gives a measure on how fast a contagion process can spread over the network.
Figure 1 shows LCC and diameter for three different set of parameters (see Table 1) and four different level of mixing, respectively. As expected, at rising the mixing level the LCC growth, while it decreases when using steepest scale-free parameters. In the latter case, also the behavior of the diameter behaves has expected, i.e., a steepest degree distribution corresponds to larger diameters, but what is quite unexpected is the small rising occurring when changing the level of mixing. This surprising behavior could depend on the relationship between two factors: (i) the topological structure of each layer, i.e., a scale-free network with different scaling exponent, and (ii) the mixing involving agents with a high degree which could have a limited impact on the overall diameter.
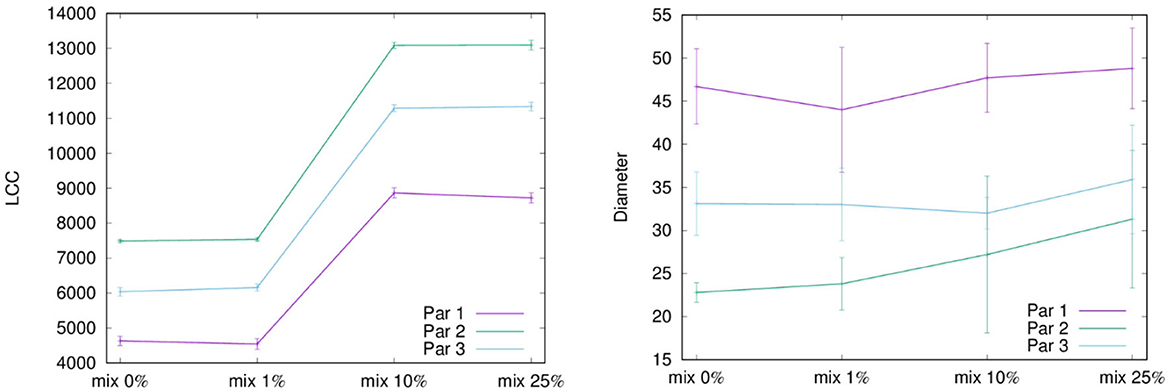
Figure 1. This figure shows the LCC and the diameter for each configuration of the parameters of the network and for each mixing scenarios.
Figure 2 shows the degree distribution of heterosexual community in the network obtained by considering the second set of parameters in Table 1 and the different mixing scenarios. It turned out that the scale-free structure of the community remains unchanged at varying the mixing scenario. For a matter of space here we report only heterosexuals, but the same happens for all the risk groups, meaning that proposed methodology is able to keep the characteristic structure of each risk group regardless the mixing, which is the main novelty of this model.
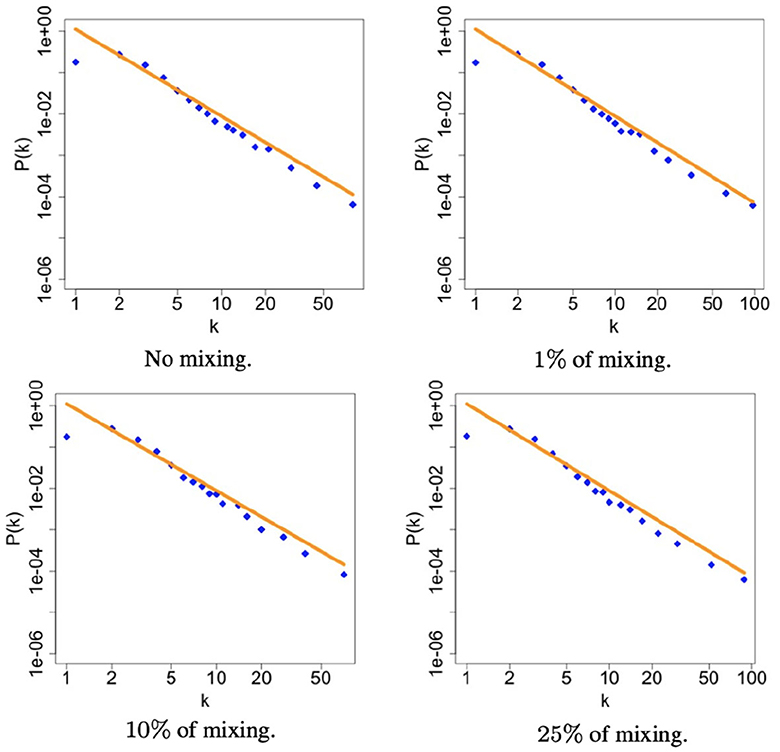
Figure 2. The figures illustrate the degree distribution of heterosexuals community within the simulated sexual contact networks for each level of mixing. The plots are presented in a log-log scale to better visualize the power-law distribution. In each panel, a orange line is the true scaling reported in Table 2 while the blue dots are the simulated values. This orange line serves as a reference to assess the accuracy of the proposed method in capturing the observed degree distribution.
The different sets of scale-free parameters reported in Table 1 impact the dynamic of epidemic. In Figure 3 we report the simulated dynamics obtained from the first and the third set of scale-free parameters. We observe that, when the scale-free parameters are in the range (2, 3), as is for Par 1 in Table 1, the behavior of the epidemic is comparable between HMW and MSM, even if the latter, having an higher scaling parameter, has a steepest growth, as shown in Figure 3A. On the contrary, when the scale-free parameters between the communities differ, as is for Par 3 in Table 1, the epidemic growth affecting MSM and HMW in not comparable, as in Figure 3B. Regarding WSW community, the scaling parameters in the two examples are similar and higher than those of MSM and HMW, and, since there are a small numbers of agents in this community, just 5%, the number of infected is very low.
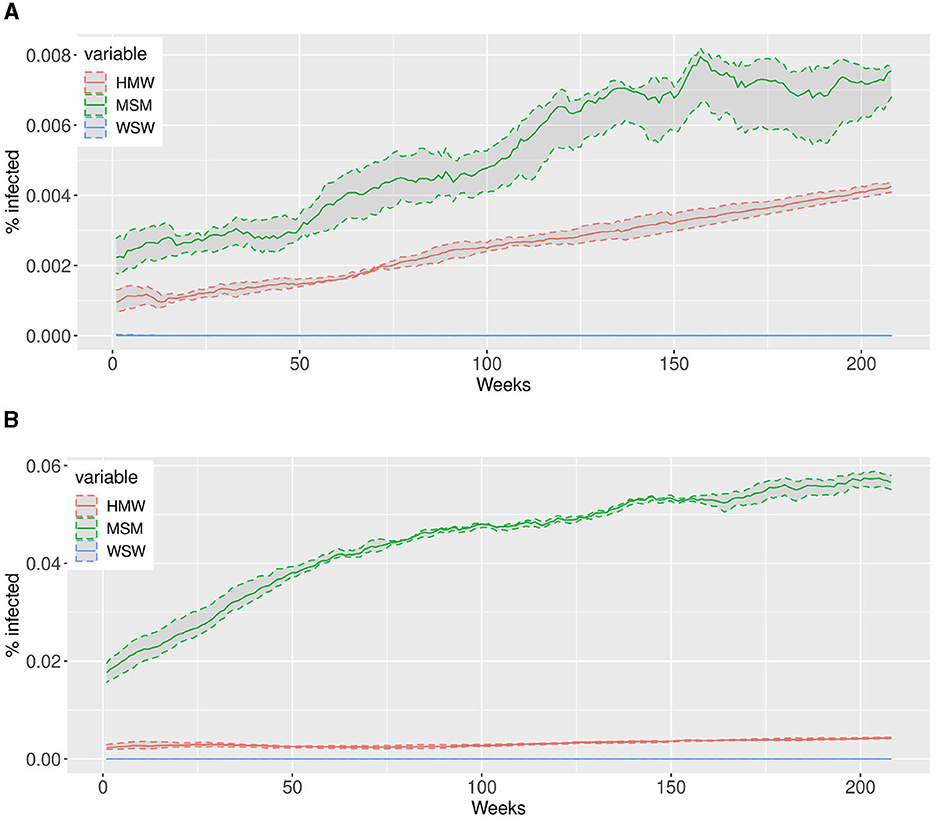
Figure 3. The simulations depict the dynamic evolution of infected individuals over a span of 4 years (208 weeks on the x-axis) for two sets of power law parameters reported in Table 1, namely the first and the third. We conducted 10 simulations and computed the median value across all simulations, which is represented by the solid lines. The shaded areas correspond to the interquartile ranges, providing a visual representation of the variability observed within the simulations. (A) First set of power law parameters. (B) Third set of power law parameters.
2.2. A real case study
The agent-based multi-level model has undergone calibration using data sourced from the SOAP (STI surveillance database [15]) provided by the National Institute of Public Health of The Netherlands. In the following we briefly describe the dataset and how the information are used to calibrate the parameters of the model.
The dataset covers the period from 2010 to 2018 and comprises 1,439,186 records, representing unique visits to healthcare providers. The dataset encompasses various information essential for defining the sexual behaviors of each agent within the model. This includes personal details, which provide insights into individuals' sexual habits. Additionally, the dataset contains information on past sexually transmitted diseases, previous antibiotic treatments, and current gonorrhea infection status. It is important to note that the dataset includes records for all individuals who underwent gonorrhea testing, regardless of the test result. Consequently, the sample is representative of high-risk groups within the considered regions. Given the non-homogeneous nature of the reported information across regions, the data is not aggregated. Instead, the analysis focuses on two regional health services with the highest number of records, namely Amsterdam and Rotterdam. These regions serve as focal points for the subsequent analysis and evaluation of the model's performance. For a matter of space, here we only show the results obtained for the region of Rotterdam, while those related to the city of Amsterdam can be found in the conference paper containing a preliminary version of this work, Stolfi et al. [16].
The personal information available in the dataset, specifically gender and sexual orientation, is utilized to create a realistic virtual population within the model. This ensures that the simulated population aligns with real-world demographics and characteristics. Specifically, we simulated a population of N = 20, 000 individuals where 60% of individuals are heterosexual, 35% are homosexual males, and 5% are homosexual females. It is assumed that among homosexual men and women, 10% of them are bisexual, meaning they have the potential to form sexual partnerships with individuals from both homosexual and heterosexual communities. To calibrate the rate of antibiotic usage, information on symptoms is employed. The probability of developing symptoms differs based on sexual orientation and gender. For heterosexual males, the probability is set at p = 0.7, while for heterosexual/homosexual females and homosexual males, the probability is set at p = 0.3, these parameters are consistent with existing literature [17]. The duration of asymptomatic infections is ~6 months, while symptomatic infections last for 2 weeks from the start of antibiotic treatment. Individuals with symptomatic infections receive treatment during the simulation. Information on the number of sexual partners in the past 6 months is used to estimate the parameters of the sexual contact network.
According to the data presented in Figure 4A, illustrating the number of sexual partners in the last 6 months for the three communities under consideration, it is evident that each community adheres to a power-law degree distribution as outlined in our model. The scale-free parameters of each community are estimated using the maximum likelihood estimation method [18]. The resulting values are γ = 2.5 for HMW, γ = 1.7 for MSM and γ = 3.7 for WSW, which correspond to Par3 in Table 1. As in the simulation study, we are able to exactly replicate the degree distribution of the real network also in the presence of mixing between risk groups (see Figure 4B). The estimated parameters play a crucial role in determining the structure and characteristics of the sexual contact network within the model. By incorporating real-world data, we ensure that the simulated network closely resembles the actual patterns of sexual partnerships in the target region and in the target risk groups.
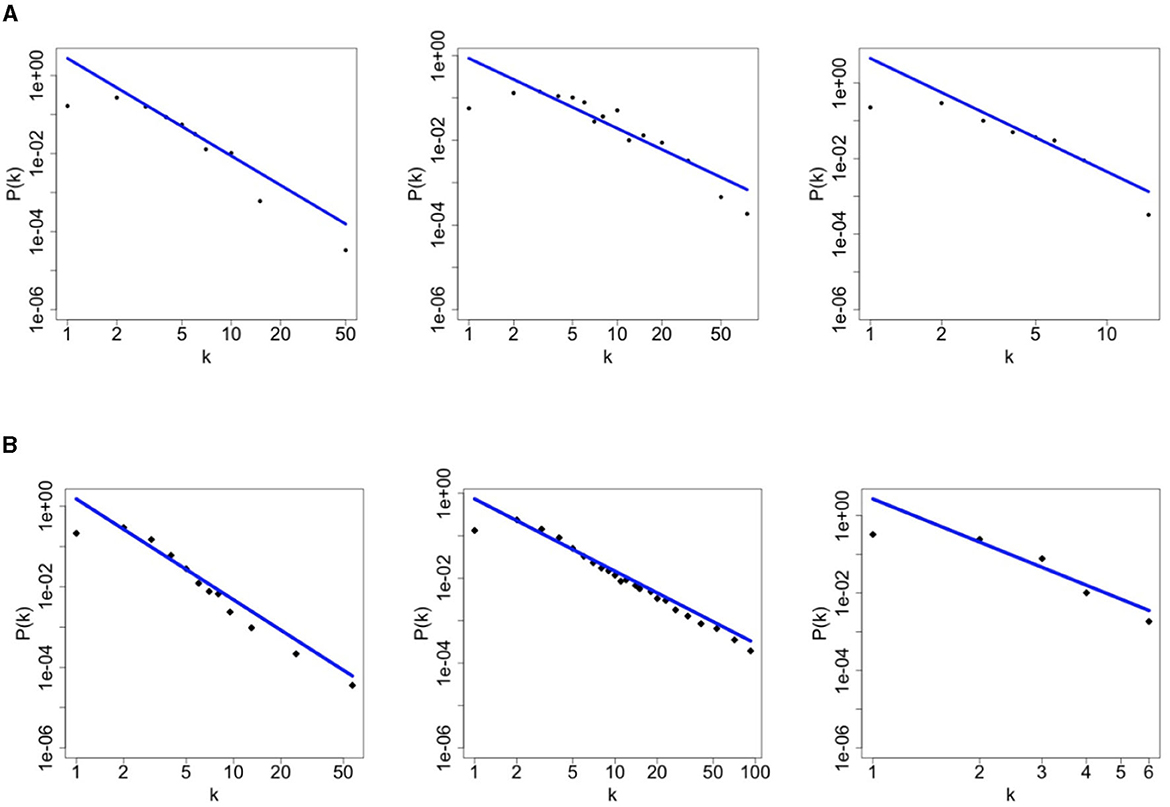
Figure 4. Contact degree distribution of each community, namely heterosexuals men and women (left), homosexual men (middle), and homosexual women (right). The first row refers to the SOAP data of Rotterdam [15] while the second row refers to simulation data for Rotterdam. (A) Rotterdam data-HMW, MSM, WSW, respectively. (B) Simulated data-HMW, MSM, WSW, respectively.
The information on current gonorrhea infection, specifically the number of infected individuals, is utilized to calibrate two important free parameters in the model: the probability of transmission at peak load and the average number of sexual intercourses per day in the population. These parameters are crucial in determining the transmission dynamics of gonorrhea within the model (details are provided in model Section 4). Due to the complexity of the multi-level model, maximum likelihood estimation is not feasible for parameter calibration. Therefore, a simulation-based estimation method [19] is employed to calibrate these free parameters. This approach involves running simulations of the model with different parameter values and comparing the simulated outcomes with the observed data on the percentage of infected individuals. Figure 5 displays the percentage of infected individuals in Rotterdam from 2010 to 2018. It is observed that the proportion of infected individuals remains consistently between 2 and 10% of the total individuals visiting the clinics during these years. This suggests that gonorrhea is endemic in that region. Furthermore, the impact of the two communities, HMW and MSM, is comparable. This differ for what we observed in Amsterdam, see Stolfi et al. [16], where MSM have a higher impact on the prevalence of infection compared to HMW. These observations highlight the importance of considering different risk groups and their respective contributions to the overall prevalence of gonorrhea infection in different regions.
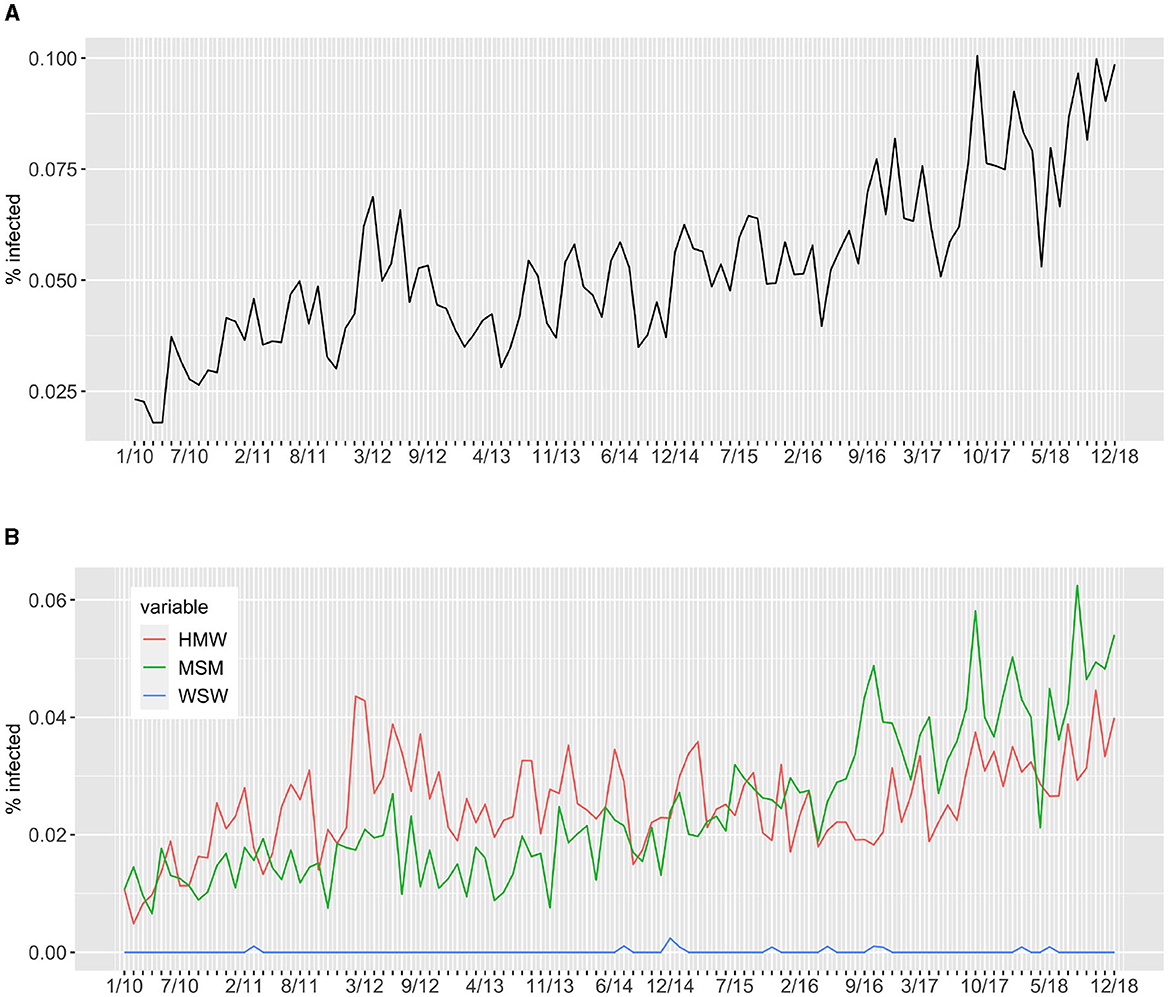
Figure 5. Percentage of infected individuals visiting the clinics in Rotterdam from 2010 to 2018. Panel (A) reports the total percentage of infected individuals while panel (B) report the percentage of infected individuals per sexual orientation, namely heterosexuals (HMW) and homosexuals (MSM and WSW).
In Figure 6, we present the dynamics of the simulations over a period of 208 weeks, corresponding to 4 years. Figure 6A display the total percentage of infected individuals while Figure 6B display the percentage of infected individuals within each community. The solid lines in both plots represent the median percentage of infected individuals averaged over 50 simulations, while the shaded areas indicate the interquartile ranges. It is evident that the model successfully reproduces the endemic nature of gonorrhea infection observed in Rotterdam, exhibiting a narrow range of variability. This demonstrates the robustness of our model in capturing the observed patterns. Additionally, the model accurately reflects the differential impact of each community on the prevalence of gonorrhea, which is a crucial factor in formulating effective intervention strategies.
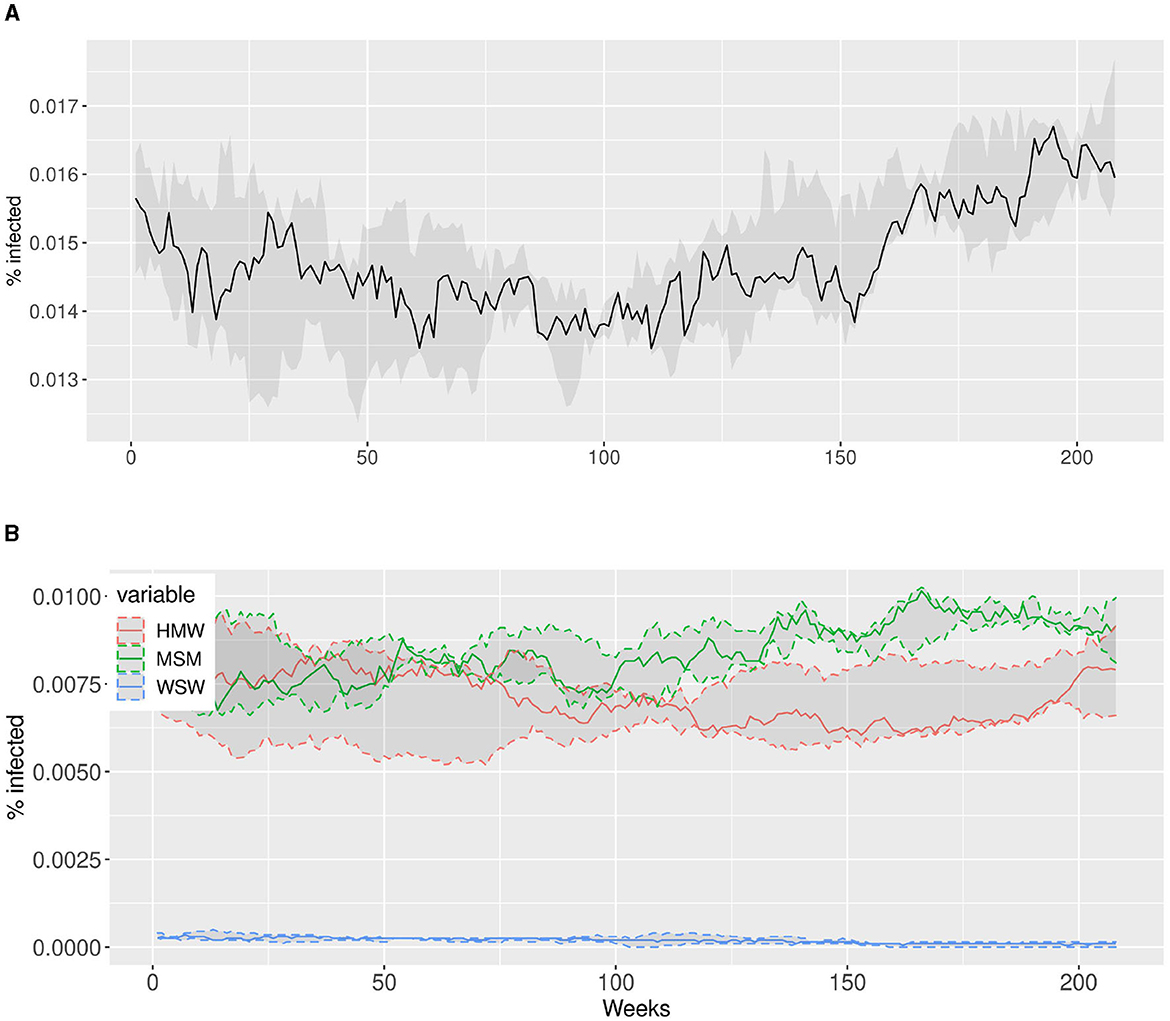
Figure 6. The simulations for Rotterdam depict the dynamic evolution of infected individuals over a span of 4 years (208 weeks on the x-axis). We conducted 50 simulations and computed the median value across all simulations, which is represented by the solid lines. The shaded areas correspond to the interquartile ranges, providing a visual representation of the variability observed within the simulations. (A) Simulations for Rotterdam: Total percentage of infected individuals in Rotterdam. (B) Simulations for Rotterdam: Percentage of infected individuals per sexual orientation in Rotterdam.
3. Discussion
The strength of the presented model lies in its ability to accurately represent various risk groups within a population. Unlike many previous studies that focused solely on MSM in a dynamic framework or included different risk groups in a static framework, our model considers different risk groups based on sexual orientation in a dynamic scheme. Additionally, we investigate groups that are interconnected through individuals who have diverse sexual preferences, such as bisexual men and women. This capability to model interacting communities with distinct sexual behaviors in a dynamic framework is particularly significant as it greatly influences the overall dynamics of STI transmission and prevalence. As far as our knowledge extends, this represents the initial undertaking in modeling interacting risk groups within a dynamic framework. Consequently, it is important to highlight that, although desirable for scientific scrutiny, a direct comparison with existing models is not achievable. However, if we restrict our model only to one community than we get the same model introduce in Whittles et al. [9].
We have provided the mathematical details of the agent-based multi-level model and demonstrated its capability to reproduce the infection dynamics in various regions and assess the contribution of different communities to the spread of gonorrhea. The strength of this model lies in the fact that each agent represents an individual with specific characteristics that influence the infection dynamics. By expanding and incorporating additional characteristics, we can generalize the model to describe a broader range of infectious phenomena, such as considering different infection sites and varying antibiotic resistance. Importantly, this model can also incorporate intervention strategies aimed at controlling the spread of gonorrhea, making it versatile and adaptable for managing public health interventions.
The ultimate goal of the multi-level model is to contribute to antimicrobial resistance (AMR) surveillance and facilitate the introduction of new antimicrobial drugs while minimizing the emergence of resistance. To achieve this, the model will be extended to include different bacterial strains with varying antibiotic resistance profiles, allowing for the representation of the emergence of resistant strains. This can be implemented through a probabilistic model that takes into account individual features such as STI history and frequency of antibiotic treatments, providing a more accurate replication of resistance dynamics within the population of interest. Additionally, the model will be utilized to generate scenarios that incorporate screening activities for detecting asymptomatic infections, the use of different first and second-line antibiotic treatments, and the tailoring of treatment based on individual characteristics such as past antibiotic usage or previous STIs. By simulating these scenarios, the model can quantitatively assess and monitor the emergence of antimicrobial resistance. Furthermore, the model can serve as a strategy for guiding the introduction of novel antibiotics. The key output of the model will be the evolution of resistant strains at the population level. By comparing these dynamics across different scenarios, the model provides a quantitative tool for monitoring AMR and offers insights into strategies for the introduction of new antibiotics.
4. Materials and methods
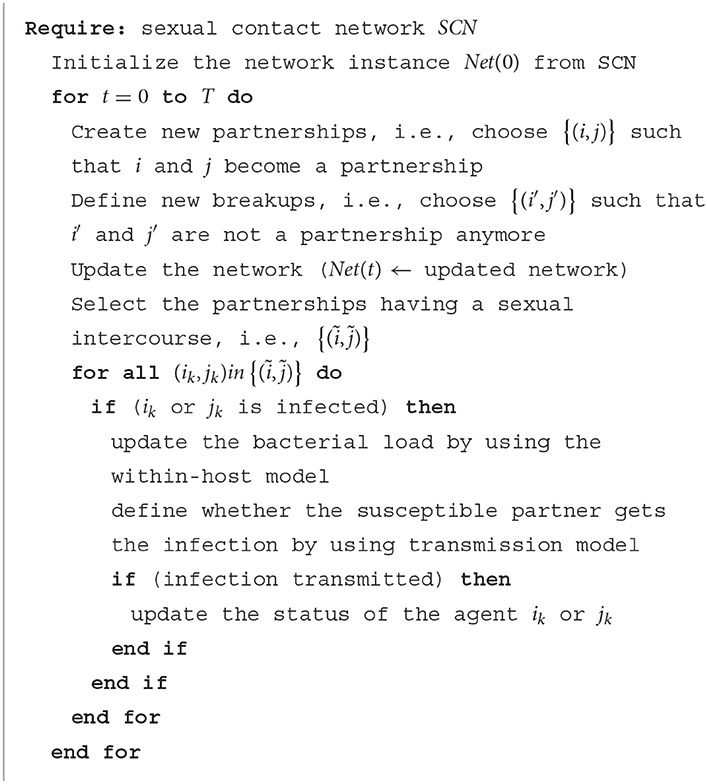
The agent-based multi-level model is composed of two main components: the between-host component and the within-host component. The between-host component encompasses the sexual contact network and the transmission model. The sexual contact network is constructed with multiple layers that represent different risk groups based on sexual orientation. Each risk group has its own dynamics of sexual partnerships, which are modeled using stochastic processes. This allows for the representation of diverse sexual behaviors and interactions within and between risk groups. The transmission model quantifies the probability of infection during sexual intercourse using a probabilistic approach. On the other hand, the within-host component focuses on the individual-level dynamics of the infection. It incorporates a set of ordinary differential equations (ODEs) that describe the evolution of the pathogen within an infected individual. These equations capture the interactions between the pathogen and the host's immune response, taking into account factors such as pathogen replication, immune response activation, and the use of antibiotic treatment. By considering the within-host dynamics, the model can simulate the progression of the infection and the effectiveness of interventions at an individual level. By combining the between-host and within-host components, the agent-based multi-level model provides a comprehensive framework for studying the spread of infections within a population. It allows for the exploration of complex interactions between individuals, the impact of different risk groups, and the effects of interventions on both the individual and population levels. In Algorithm 1 we provide an algorithmic description of the implementation of the agent based multi-level model.
4.1. Dynamic sexual contact network
The sexual contact network in the agent-based multi-level model is represented as a dynamic network, where each node represents an individual or agent characterized by various features, for instance gender and sexual orientation. The edges or links between nodes represent sexual partnerships between individuals. The network is structured into communities or layers that correspond to different sexual orientations, including heterosexuals and homosexuals. These communities capture the clustering of individuals with similar sexual preferences. However, in addition to within-community interactions, the model also allows for interactions between communities through the presence of bisexual individuals who can form partnerships with individuals from different communities. In Figure 7 we provide a graphical representation of the resulting network structure, namely obtained through our multi-layer dynamic network model with 300 nodes, with the details of the process of formation and breakup.
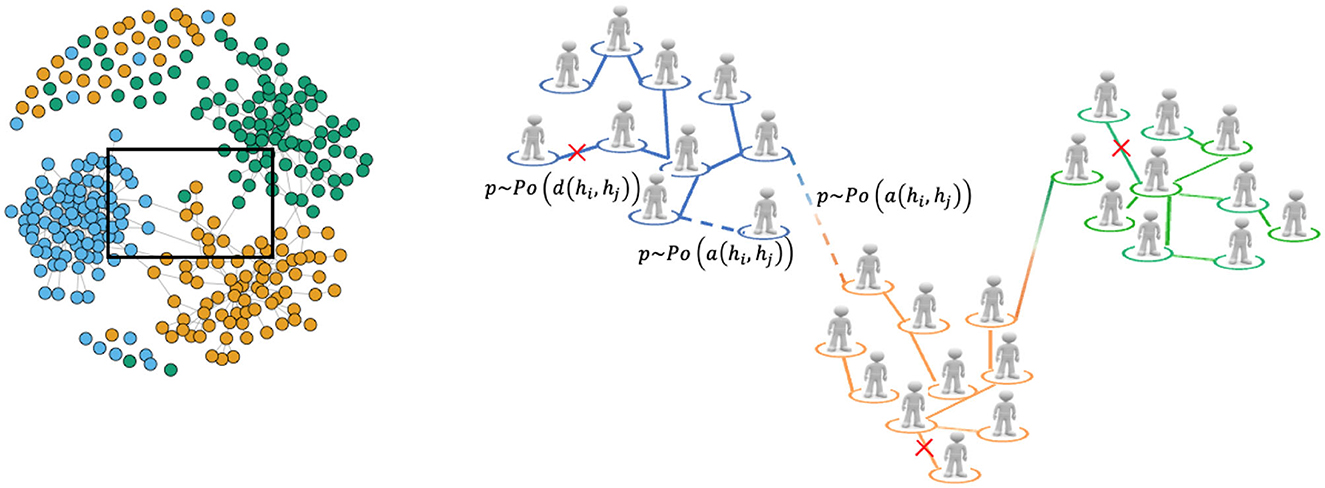
Figure 7. Graphical representation of the multi-layer network with the formation and breakup of partnerships processes between two agents i and j, that are modeled by Poisson processes whose rate are a (hi, hj) and d (hi, hj), respectively as detailed in Section 4.1.1. Solid lines represent ongoing partnerships, dashed lines represent potential new partnerships while crossed lines represent potential break of partnerships. It is worth noting that the net on the left hand side is a network generated by our multi-layer dynamic network model with 300 nodes.
The degree distribution of sexual contact networks typically follows a power-law distribution, indicating that there are a few highly connected individuals (hubs) and a large number of individuals with few connections [20]. However, it is important to note that different communities within the network may exhibit different scale exponents, reflecting the diversity in sexual behavior and partnership patterns among different sexual orientations. To capture this diversity and enable interactions between communities, a novel approach has been developed in this model. This approach builds upon previous work on epidemic dynamics in a single community, specifically the work by Whittles et al. [9]. By extending and adapting this approach to the multi-community case, the model can capture the complex mixing patterns and dynamics of sexual partnerships within and between communities.
4.1.1. Multi-layer dynamic network
Let N be the number of individuals in the network, hi = (si, λi) be the feature vector of individual i, where si ∈ = {HM, HW, MSM, WSW} stands for the sexual orientation and λi refers to the propensity to form new partnerships, whose probability distribution is different among communities (or layers). Sexual contacts naturally change over time, therefore formation and breakup of partnerships between two agents i and j are modeled by Poisson processes whose rate are a(hi, hj) and d(hi, hj), respectively. Following Whittles et al. [9] let us assume d(hi, hj) = ϕa(hi, hj), with ϕ > 1. This assumption reflects empirical findings that a high number of concurrent sexual partnerships implies a short duration of relationships. Since a Poisson process with parameter τ can also be defined by stating that the time differences between events of the process are exponential variables with mean τ−1, the probability that agents i and j are in a partnership at time t is given by
Using this formula, we calculate the probability of agents i and j being in a partnership in the upcoming year
4.1.2. Degree distribution of partnership
The probability distribution of partnership of agent i in the past years can be formally expressed as
where Ω is the event space of all agents and f(h) = f(λ|s) is the probability density of the propensity λ given the sexual orientation si. Since the sexual orientation is a discrete variable, the above expression can be explicitly written as
where ψs = Ns/(N−1) and Ns is the number of individuals having sexual orientation s. The degree distribution of agent i, i.e., the number of relationship in which agent i is involved, denoted as ki, is a random variable following the binomial distribution, namely where is the number of individuals which can form a partnerships with an agent having sexual orientation si. Therefore the degree distribution of agent i is given by the expected value
As mentioned earlier, sexual contact networks typically exhibit a power-law degree distribution [20]. Therefore, we assume that the community with sexual orientation si follows a power-law degree distribution based on data from the previous year
Clearly, since we are dealing with a finite set of individuals, the power law cannot extend to infinity, so it is mandatory to introduce two cut-offs for the distribution, k0,si and k∞,si. The constant csi can be computed as
and
Now we can use the method of transformation to compute the degree distribution of the community having sexual orientation si:
The density of λ|si is then obtained as
Integrating both sides between 0 and λ we obtain
which gives the following formula
4.1.3. Closed expression for formation and breakup rates
Now there are two formulae for the degree distribution of sexual contact for the orientation si, Equations (4) and (10). Assuming a suitable and realistic expression for the probability that agents i and j are in a partnership in a given year, q(hi; hj), we can derive an explicit expression for the coefficients governing partnership formation and dissolution. These coefficients, in turn, determine the dynamics of the sexual network.
We assume that
The first hypothesis is reasonable since in the case of the same sexual orientation the probability of being in a relationship can be factorized by the product of the same relationship propensity function, g(λj|si), characterizing the particular sexual orientation. The second hypothesis states that there is a small and constant probability, ḡ, of being in a relationship with a bisexual individual. This is because the model contemplate a mating term between different sexual orientations, but it must not be too large to heavily influence the network of sexual contacts, as it happens in reality. Here M(si, sj) is the symmetrical mating matrix between different sexual orientation, whose values is 1 if si = HW and sj = MSM or si = HM and sj = WSW, 0 otherwise.
From the above assumptions and Equations (4) and (3), it follows
We integrate the previous formula as follows
By using Equation (10) the left hand side is computed as
Therefore
and
To obtain g(λ|si), we consider Equation (12) rearranging it as follows
This is the closed formula for g(λ|si) that can be used to compute the rate of formation and breakup of partnerships recalling the assumption d(hi, hj) = ϕa(hi, hj,) and therefore
which can be inverted as
While the process of formation and breakup of partnerships is similar to the one proposed in Whittles et al. [9] (which in turn is based on the work in Servedio et al. [21]), the introduction of a multi-layer network in a dynamic framework, where each layer is characterized by its own degree distribution and the layers have the possibility to interact, represents the novelty of this work.
4.2. Transmission model
A crucial element in the multi-level description of gonorrhea infection dynamics is played by the transmission model, which stochastically describes both the number of intercourses occurring in the unit of time and the probability of infection transmission during an intercourse.
The number of intercourses in the unit of time is described by a poisson process whose parameter depends on the population size and on the data available for the population. At each time step, the extracted number of intercourses are randomly distributed among the various possible couples active at that time. Once a couple is selected, if one agent of the couple is infected and the other is uninfected, then a new infection could take place with a transmission probability computed according to the model already presented in Stolfi et al. [16] that is inspired by Craig et al. [2].
Briefly, the probability of transmission, denoted as β, is determined by the bacterial load l:
where lc is the critical load, representing the minimum bacterial load required for transmission, lp is the bacterial peak load, and βp is the transmission probability at the peak load.
4.3. Within-host model
Once an agent becomes infected, the multi-level model incorporates the within-host component to capture the dynamics of the infection. This component consists of a set of ordinary differential equations that describe the competition and evolution of the immune system and bacteria within the infected agent. The within-host model takes into account different dynamics depending on whether the infected agent seeks treatment or not, which is influenced by the presence or absence of symptoms.
We begin with the model proposed in Caudill and Lawson [22], which considers a single site of infection and a single strain of bacteria. When an agent becomes infected, the immune response is activated, resulting in the slowing down of bacterial growth through a term that represents the general immune response. The following equations provide a detailed description of this process:
where the parameters are described in Table 2. A further discussion of this model together with the trajectories of the dynamics can be found in Stolfi et al. [19].

Table 2. Description and value of the within-host model parameters.
4.4. Algorithmic description of the integrated model
Algorithm 1. Multi-level model algorithm.
Data availability statement
The data analyzed in this study is subject to the following licenses/restrictions. The dataset belongs to RIVM National Institute for Public Health and we are not authorized to make it available to the public. Requests to access these datasets should be directed at: https://www.rivm.nl/<.
Author contributions
PS, DV, and FC contributed to conception and design of the study and wrote sections of the manuscript. PS organized the database, performed the statistical analysis and implemented the model. All authors contributed to manuscript revision, read, and approved the submitted version.
Funding
Partial support from the Italian Ministry of Education, University and Research under the frame of JPI AMR (project MAGIcIAN, No. 0000873).
Acknowledgments
The authors would like to thank the RIVM National Institute for Public Health and the Environment for sharing the data. The authors would also like to thank Constance Schultsz, Rik Oldenkamp, and Emiliano Mancini for the insightful discussions.
Conflict of interest
The authors declare that the research was conducted in the absence of any commercial or financial relationships that could be construed as a potential conflict of interest.
Publisher's note
All claims expressed in this article are solely those of the authors and do not necessarily represent those of their affiliated organizations, or those of the publisher, the editors and the reviewers. Any product that may be evaluated in this article, or claim that may be made by its manufacturer, is not guaranteed or endorsed by the publisher.
Footnotes
1. ^https://www.magician-amr.eu
2. ^https://www.who.int/news-room/fact-sheets/detail/multi-drug-resistant-gonorrhoea
References
1. Spicknall IH, Mayer KH, Aral SO, Romero-Severson EO. Assessing uncertainty in an anatomical site-specific gonorrhea transmission model of men who have sex with men. Sex Transm Dis. (2019) 46:321–8. doi: 10.1097/OLQ.0000000000000953
2. Craig AP, Gray RT, Edwards JL, Apicella MA, Jennings MP, Wilson DP, et al. The potential impact of vaccination on the prevalence of gonorrhea. Vaccine. (2015) 33:4520–5. doi: 10.1016/j.vaccine.2015.07.015
3. Heymans R, A Matser A, Bruisten SM, Heijman T, Geskus RB, Speksnijder AG, et al. Distinct Neisseria gonorrhoeae transmission networks among men who have sex with men in Amsterdam, the Netherlands. J Infect Dis. (2012) 206:596–605. doi: 10.1093/infdis/jis399
4. Buyze J, Berghe WV, Hens N, Kenyon C. Current levels of gonorrhoea screening in MSM in Belgium may have little effect on prevalence: a modelling study. Epidemiol Infect. (2018) 146:333–8. doi: 10.1017/S0950268818000092
5. The European MSM Internet Survey. (2022). Available online at: https://www.emis-project.eu/ (accessed June 2023).
6. Vajdi A, Juher D, Saldaña J, Scoglio C. A multilayer temporal network model for STD spreading accounting for permanent and casual partners. Sci Rep. (2020) 10:1–12. doi: 10.1038/s41598-020-60790-0
7. Mei S, Sloot PM, Quax R, Zhu Y, Wang W. Complex agent networks explaining the HIV epidemic among homosexual men in Amsterdam. Math Comput Simul. (2010) 80:1018–30. doi: 10.1016/j.matcom.2009.12.008
8. Zarrabi N, Prosperi MC, Belleman RG, Di Giambenedetto S, Fabbiani M, De Luca A, et al. Combining social and genetic networks to study HIV transmission in mixing risk groups. Eur Phys J Spec Top. (2013) 222:1377–87. doi: 10.1140/epjst/e2013-01932-x
9. Whittles LK, White PJ, Didelot X. A dynamic power-law sexual network model of gonorrhoea outbreaks. PLoS Comput Biol. (2019) 15:e1006748. doi: 10.1371/journal.pcbi.1006748
10. Natsal-3 Survey. (2022). Available online at: https://www.natsal.ac.uk/natsal-survey/natsal-3 (accessed June 2023).
11. Gonococcal Resistance to Antimicrobials Surveillance Programme. (2022). Available online at: https://www.gov.uk/government/publications/gonococcal-resistance-to-antimicrobials-surveillance-programme-grasp-report (accessed June 2023).
12. Castiglione F. Agent-based modeling and simulation, introduction to. In:Pérez-Castrillo D, Sotomayor M, Castiglione F, editors. Complex Social and Behavioral Systems: Game Theory and Agent-Based Models. New York, NY: Springer (2020), p. 661–5. doi: 10.1007/978-1-0716-0368-0_13
13. Newman M, Barabási AL, Watts DJ. The Structure and Dynamics of Networks. Princeton, NJ: Princeton University Press (2011). doi: 10.1515/9781400841356
14. Newman M. Networks. Oxford: Oxford University Press. (2018). doi: 10.1093/oso/9780198805090.001.0001
15. Slurink IAL, van Aar F, Op de Coul ELM, Heijne JCM, van Wees DA, Hoenderboom BM, et al. Sexually Transmitted Infections in the Netherlands in 2018. STI Department, Epidemiology and Suveillance Unit, Centre for Infectious Disease Control. Bilthoven: National Institute for Public Health and the Environment (RIVM) (2019).
16. Stolfi P, Vergni D, Oldenkamp R, Schultsz C, Mancini E, Castiglione F. An agent-based multi-level model to study the spread of antimicrobial-resistant gonorrhoea. In: 2022 IEEE International Conference on Bioinformatics and Biomedicine (BIBM). Las Vegas, NV: IEEE (2022), p. 803–8. doi: 10.1109/BIBM55620.2022.9994926
17. Korenromp EL, Sudaryo MK, de Vlas SJ, Gray RH, Sewankambo NK, Serwadda D, et al. What proportion of episodes of gonorrhoea and chlamydia becomes symptomatic? Int J STD AIDS. (2002) 13:91–101. doi: 10.1258/0956462021924712
18. Langlois D, Cousineau D, Thivierge JP. Maximum likelihood estimators for truncated and censored power-law distributions show how neuronal avalanches may be misevaluated. Phys Rev E. (2014) 89:012709. doi: 10.1103/PhysRevE.89.012709
19. Stolfi P, Bernardi M, Petrella L. Sparse simulation-based estimator built on quantiles. Econom Stat. (2022). doi: 10.1016/j.ecosta.2022.01.006
20. Liljeros F, Edling CR, Amaral LAN, Stanley HE, Åberg Y. The web of human sexual contacts. Nature. (2001) 411:907–8. doi: 10.1038/35082140
21. Servedio VD, Caldarelli G, Buttà P. Vertex intrinsic fitness: how to produce arbitrary scale-free networks. Phys Rev E. (2004) 70:056126. doi: 10.1103/PhysRevE.70.056126
Keywords: agent-based modeling, dynamic networks, multi-scale modeling, epidemic modeling, scale-free networks
Citation: Stolfi P, Vergni D and Castiglione F (2023) An agent-based multi-level model to study the spread of gonorrhea in different and interacting risk groups. Front. Appl. Math. Stat. 9:1241538. doi: 10.3389/fams.2023.1241538
Received: 16 June 2023; Accepted: 25 September 2023;
Published: 13 October 2023.
Edited by:
Gennady Bocharov, Marchuk Institute of Numerical Mathematics (RAS), RussiaReviewed by:
Abdessamad Tridane, United Arab Emirates University, United Arab EmiratesMarcus Rosenblatt, University of Freiburg, Germany
Copyright © 2023 Stolfi, Vergni and Castiglione. This is an open-access article distributed under the terms of the Creative Commons Attribution License (CC BY). The use, distribution or reproduction in other forums is permitted, provided the original author(s) and the copyright owner(s) are credited and that the original publication in this journal is cited, in accordance with accepted academic practice. No use, distribution or reproduction is permitted which does not comply with these terms.
*Correspondence: Paola Stolfi, p.stolfi@iac.cnr.it