Item response theory to discriminate COVID-19 knowledge and attitudes among university students
 Ronald Wesonga
 M. Mazharul Islam1,2
 - 1Department of Statistics, Sultan Qaboos University, Muscat, Oman
- 2Data Science Analytics Lab, Sultan Qaboos University, Muscat, Oman
The study sought to compare two-item response theory (IRT) models, the Rasch and 2PL models, and to uncover insights on COVID-19 knowledge and attitude item difficulty and discrimination among university students. We premise this study on ITM to argue that logical flow, degree of difficulty, and discrimination of items for the constructs among respondents contribute to the validity and quality of statistical inferences. The developed Rasch and 2PL models are compared to determine the difficulty and discrimination of knowledge and attitude items, with an application to COVID-19. Our results show that although the Rasch and 2PL models provide rich diagnostic tools to understand multiple traits, the 2PL model provides more robust results for the assessment of knowledge and attitude of students about the COVID-19 epidemic. Moreover, of the two constructs, the items for the attitude construct recieved more reliable responses than the knowledge construct items. Accordingly, under any pandemic, the lack of proper and evolving knowledge could have dire consequences; hence, strict efforts should be made while designing knowledge items.
1 Introduction
Often times, lack of sufficient information about a disease, especially a pandemic creates panic and various misconceptions in society, thus causing preventable losses. These effects may not be uniform across communities and thus differ based on the amount of information and enlightenment about the disease. The world has recently faced one of the worst epidemic ever in history, which affected lives and livelihoods of all communities [1, 2]. It was noted, however, that the infection and effect rates have also been different based on the demographic, health, and socio-economic characteristics [3–5]. Two main constructs of interest have been knowledge and attitude about the COVID-19 pandemic. One could argue that the multiplicative effect of COVID-19 in communities, including its spread and mortality was highly associated with knowledge and attitude. Realizing the significance of information, many countries developed COVID-19 data portals and information sources under their ministries of health that kept communities updated about the disease and its evolution. Research targeting the assessment of knowledge and attitude about COVID-19 have been conducted at various levels. However, the questions of construction of items, their logical flow, level of difficulty or simply level of easiness, and ability to respond to such items are rarely given their deserved attention. To accomplish the aim of this study, we sought to determine COVID-19 knowledge and attitude among the university students whose education was been greatly impacted in various ways [6, 7].
The heterogeneity of responses is a typical source of variation that deserves being accounted for in a statistical response model [8, 9]. Differences between respondents were modeled via a probability distribution, and inferences have been made with respect to population distribution.
The item response theory (IRT) also known as the latent response theory refers to a family of mathematical models concerned with the measurement of a hypothetical construct that is latent and can only be measured indirectly via the measurement of other manifest variables [10, 11]. The IRT models attempt to explain the relationship between latent traits, the unobservable characteristic or attribute, for example, knowledge and attitude, and their manifestations (that is, observed outcomes, responses, or performance). This hypothetical construct is a latent variable and often represents the ability, skill, or more generally a latent person characteristic that the items measure. The latent variable can also be called an ability parameter as a generic name for the latent construct that is measured by the items and is usually denoted as θ. In other words, the ability of the person (θ) is the probability of providing the correct answer for that item. The higher the individual's ability, the higher is the probability of a correct response. When the latent variable refers to a person characteristic such as ability or proficiency, it is also called a person parameter or item difficulty. The parameter or item difficulty determines the manner of which the item behaves along the ability scale.
There are two key assumptions we considered in item response theory for our study. The first assumption was that a change in the latent variable leading to a change in the probability of a specified response is completely described by the item characteristic curve (ICC), item characteristic function, or trace line. This ICC specifies how the probability of an item response change due to the latent variable. On an ICC, items that are difficult to endorse are shifted to the right of the scale, indicating the higher the ability of the respondents who endorse it correctly, while those, which are easier, are more shifted to the left of the ability scale. Different mathematical forms of the item characteristic curves lead to different item response models. For dichotomous responses, the probability of a success are modeled as a function of item and person parameters [12]. The second assumption we considered was that responses to a pair of items are statistically independent when the underlying latent variable is held constant.
Therefore, in this study, we sought to propose item response model to examine the level of difficulty of items that measure knowledge and attitude among university students, with an application on the recent COVID-19 pandermic. The study is premised on the fact that recently many studies have focused on measuring knowledge, attitude, and practices for the COVID-19 pandemic [13]. These studies greatly contribute to reduce stigmatization as well as promote general understanding, control, and reduction of high morbidity and mortality among the populations. Our study is structured as follows: section one was dedicated to providing an introduction to item response theory, problem statement, and research contribution. In section two, we describe the methods, including item response models, item difficulty estimation using the maximum likelihood estimation (MLE) and marginal maximum likelihood estimation (MMLE), item information measures, and data source. In section three, we present results of our application on measuring knowledge and attitude constructs for students about COVID-19. And in section five, we deduce important summary of the results and draw conclusions.
2 Methods
The methodology is organized in a way such that the item response (IR) models are presented first, followed by estimation of parameters for the ability of the students to respond, specifically employing the MLE and MMLE, information by item, efficiency measures, and a brief description of the data source.
2.1 Item response models
A random vector of K responses with observed values yi = (yi1, ⋯ , yiK) of an individual student indexed i with ability parameter θi, and the assumption of local independence is
There is one latent variable underlying the observed responses when local independence holds, and after conditioning on this latent variable, the observed responses were assumed to be independent.
In this study, we developed IRT to estimate knowledge and attitude of university students about COVID-19 so as to contribute toward alleviation of consequences and impacts caused due to COVID-19 [14].
The binary item response, one-parameter response model, provides the probability of a correct response for individual student i with ability level θi and item difficulty parameter bk as
An important feature is that the ICCs are parallel to one another was derived from the Rasch model to represent and compare student's ability level. The interpretation of which is that an increase in ability leads to the same increase in the probability of success to respond correctly about the knowledge items. Furthermore, if items are well constructed, they would discriminate in the same way between success probabilities for related ability levels of the students.
Moreover, adding a discrimination parameter ak creates a two-parameter model, which as a result, generates an ICC with a slope parameter ak. This implies that the items would no longer be equally related to the ability parameter to respond to the knowledge items.
Moreover, it is known, especially due to various reasons among students that a good percentage of the items could be through guess work. Thus, we added a guessing parameter ck, creating a three-parameter model, as described in Equation (4).
It can be shown that when ck = 0, this three-parameter model reduces to the two-parameter model. However, for ck>0, the interpretation of bk is changed. In the three-parameter model, the proportion responding correctly at equals , and in the two-parameter model, the value of θi at which the student respondent has a probability of responding correctly to the COVID-19 knowledge items.
2.2 The Rasch model
Similar to the 1-parameter model, the Rasch model [15–17] has been defined to provide the probability of a correct response for an individual student i with ability level θi and item difficulty parameter bk as in Equation (5):
which translates to Equation (6)
where ϑ = Dāθ and βi = Dābi are measures of ability and difficulty, respectively. We noted that both of these parameters are important in obtaining accurate and realistic measures for the student's knowledge and attitude about the COVID-19 pandermic. The odds of success were measured by
accordingly
where, and .
This is a special case of the Birnbaum's three-parameter model (3PLM), where all items have equal discriminating power and minimal guessing, which is inevitable, especially among students. The Rasch model is known to be robust with respect to departures of model assumptions, usually observed in actual test COVID-19 data, which is surrounded by uncertainties. With fewer items, it is easy to estimate and present with limited estimation problems, usually present in the knowledge and attitude questions.
2.3 Estimation of students' ability using the MLE
The basic problem was to determine item and ability parameters from the knowledge and attitude items regarding COVID-19 given survey data from university students. We describe the MLE as in the estimation procedure.
Let P(Ui|θ) be the probability that a student with ability θ correctly scores a response Ui on item i where
If the uni-dimensional latent space is complete, then the local independence holds, thus for given ability, the joint probability of responses U1, ⋯ , Un is
This transforms into a likelihood function, which gives the value of the student's ability and generates the greatest probability for the observed response pattern.
If θm is the mth approximation to the MLE θ, after convergence, estimates θ using Equation (10):
2.4 Properties of maximum likelihood estimator
We describe the maximum likelihood estimators (MLEs) because under general conditions, they present with the following important properties, that is:
1. consistent, since as the sample size and number of items increase, the estimators converge to the true values.
2. functions of sufficient statistics when sufficient statistics exist, implying that the sufficient statistics contain all the information about the parameter.
3. efficient, meaning that asymptotically the MLEs have the smallest variance.
4. they are asymptotically normally distributed. Thus, for the Rasch model,
This implies that, similar to for the one-parameter logistic model, the Rasch model for the number of correct COVID-19 score is a sufficient statistics for the ability θ.
2.5 Properties of marginal maximum likelihood estimator
The marginal maximum likelihood estimators (MMLEs) of the structural parameters are those values that maximize the marginal likelihood function. Darrell Bock and Lieberman [18] provided marginal maximum likelihood estimators of the parameters for the two-parameter model. Under the MMLE, we assumed that the ability distribution was normal with zero mean and unit variance and integrated over θ numerically. The resulting equations were then solved iteratively. The basic problem with this approach is that the marginal likelihood function has to be evaluated over the 2n response patterns. This restricts the application of the estimation procedure to the case where there were only 10–12 items. Previously, Bock and Aitkin [19] improved the procedure considerably by characterizing the distribution of ability empirically and employing a modification of the expectation-maximization (EM) algorithm. Thissen [20] adopted this procedure to obtain marginal maximum likelihood estimators in the Rasch model. The marginal maximum likelihood procedure, in the Rasch model, yields comparable results to the conditional estimation procedure [20]. However, since the complex elementary symmetric functions are not required, the marginal procedure appears to be more effective than the conditional procedure.
Given that the probability of a student respondent a obtaining the response vector of items, U, is
where πu is the unconditional or marginal probability of obtaining response pattern u. Therefore, there are 2n response patterns in all for n binary items. If we let ru denote the number of students obtaining response pattern u, then
where c is a constant, and the marginal maximum likelihood estimators are obtained by differentiating lnL with respect to parameters a, b, c and solving the resulting likelihood functions.
2.6 Information by item
The amount of information provided by each item is given by
We noticed that the amount of information at a given student's ability level is the inverse of its variance. Hence, the larger the amount of information provided by the knowledge item, the greater the precision of the measurement. Items measured with more precision provide more information. However, the maximum amount of information would be given when the probability of answering the knowledge items correctly and wrongly are equal.
The information function I(θ) is defined as
From Equation 9,
Using the product rule,
Incidentally,
Note that
Consequently,
2.7 Relative precision, relative efficiency, and efficiency
Relative precision at θ of the two test models [21]
while efficiency (Eff) is
and the relative efficiency (RE) is
2.8 Data source
To evaluate the response ability, difficulty, and discrimination of the items on survey instrument, we used data from a cross-sectional survey that was conducted to explore mental health among the university students during the COVID-19 epidemic and its prevalence-related objectives. The details of the survey methodology may be obtained [22]. A cross-sectional online survey was conducted among the students of Sultan Qaboos University (SQU) in Oman. At the time of the survey, there were 17,019 registered undergraduate and postgraduate students in SQU. All the SQU students had access to social media and institutional e-mail systems. An online semi-structured questionnaire was developed in both English and Arabic and hosted via a unique uniform resource locator (URL). The link to the questionnaire was sent through emails to all students. An information sheet and a consent form were available on the first page of the questionnaire. The study was conducted in accordance with the Declaration of Helsinki. The participants were informed of the study purpose, ethical electronic consent was obtained, and they were assured that all the information provided would be kept confidential and anonymous. A total of 3,180 students clicked on the survey link, but ultimately, 1,915 students provided informed consent and complete responses. In this study, we extracted variables on two constructs, that is, knowledge and attitude to compare two models on item response theory. Tables 1, 2 present the questions (items) for measuring students' knowledge and attitude toward COVID-19, respectively.
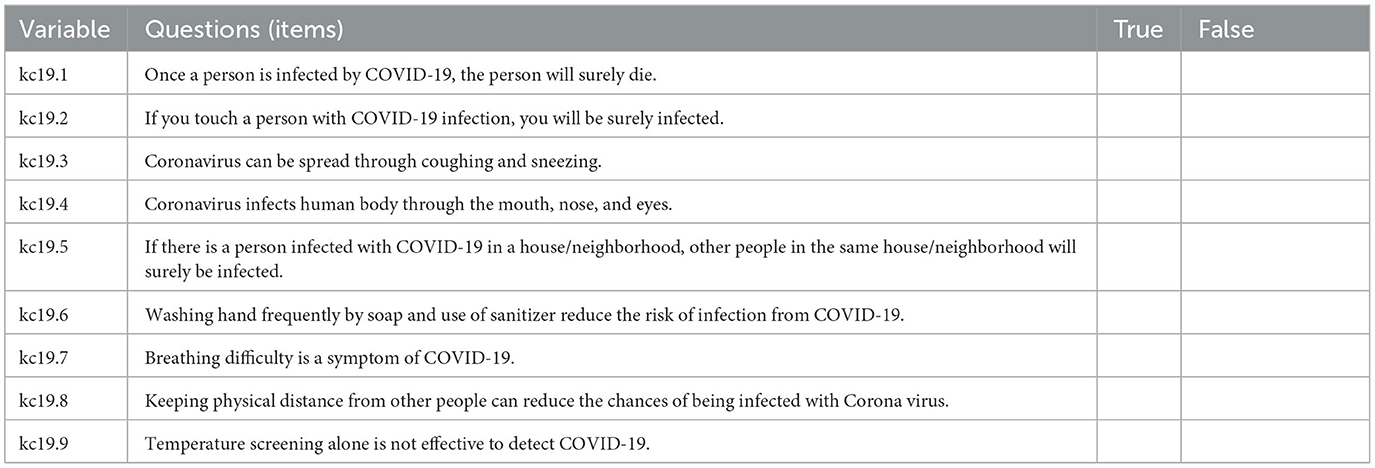
Table 1. Variable and description of items on knowledge about COVID-19.
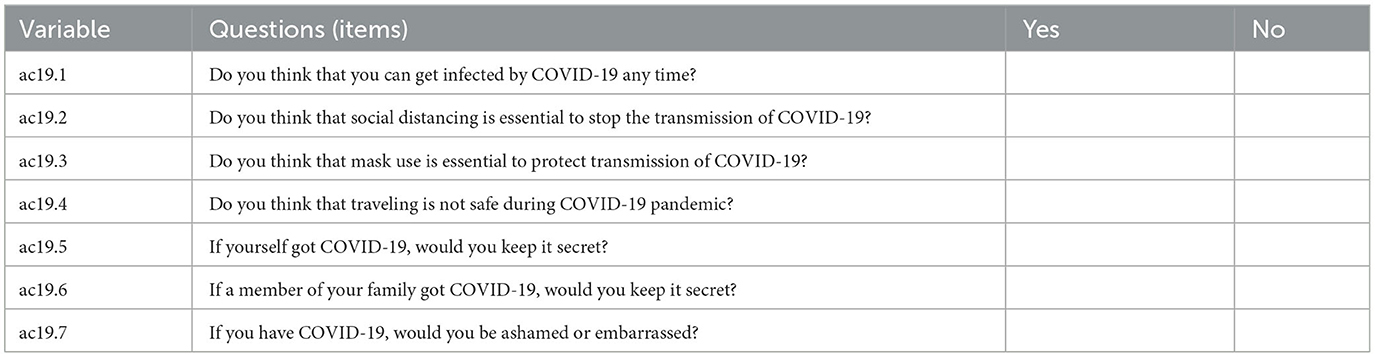
Table 2. Variable and description of items on attitude about COVID-19.
3 Experimental results
3.1 Descriptive analysis
The 95% simultaneous confidence intervals for individual mean components for COVID-19 students' knowledge and attitude items.
The knowledge construct had nine items, and only seven for the attitude construct. Figure 1, graph (A) and graph (B) show the 95% confidence intervals of the mean scores for the knowledge and attitude constructs, respectively. A score close to one implies a better understanding, and the scores nearer to zero, indicate poor knowledge and attitude about COVID-19 epidemic. The 95% confidence intervals for the scores of each item were small, indicating high precision, regardless of comprehension and attitude. Under the knowledge construct, Figure 1A items; 3,4,6,7,8 and 9 were well scored (mean scores > 0.75) by the students, while three scores 1,2 and 5 were poorly scored. It is also clear that under the attitude construct, Figure 1B, whereas items 1,2,3, and 4 were well scored (mean score > 0.75), three items 5,6, and 7 were poorly scored.
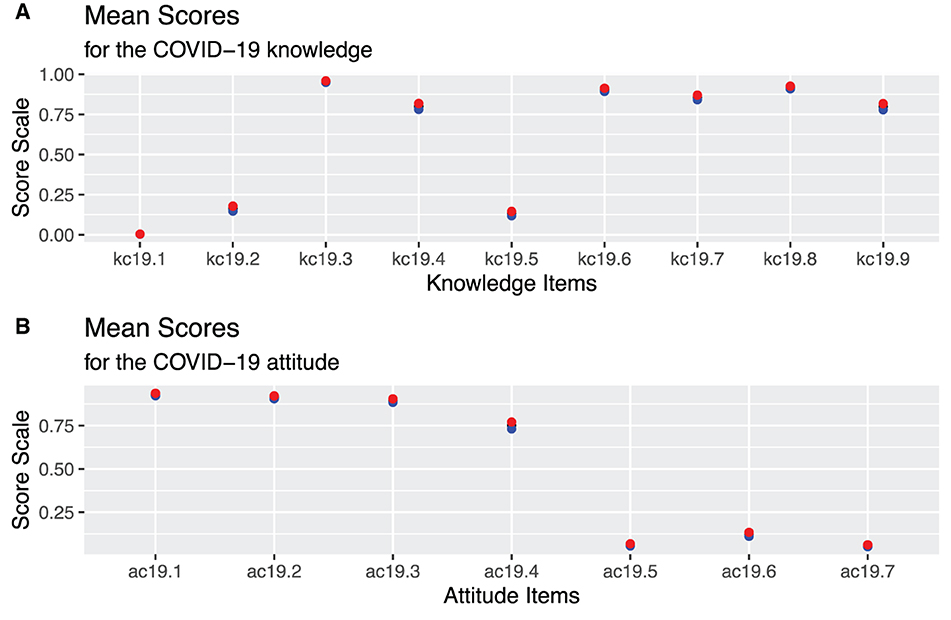
Figure 1. The 95% CI of the mean scores for the knowledge (A) and attitude (B) constructs.
3.2 Rasch model estimation using CML
A Rasch model was fitted to the data using a conditional maximum likelihood (CML) estimation of the item parameters.
Figures 2A, B show the model Beta coefficients derived from the Rasch model for each item under the knowledge and attitude constructs, respectively. The coefficients demonstrate difficulty level of the items. It can be deduced from the Rasch model that there were two classes of difficulty levels for measuring COVID-19 knowledge and attitudes. Of the nine items for knowledge, three of them, including items 1, 5, and 2 were difficult and six, that is, items 3,8,6,7,4, and 9 were easy. Similarly, three items, namely, 7, 5, and 6 under the attitude construct were classified as difficult, while items 1,2,3, and 4 in that order were classified as being easy to respond to.
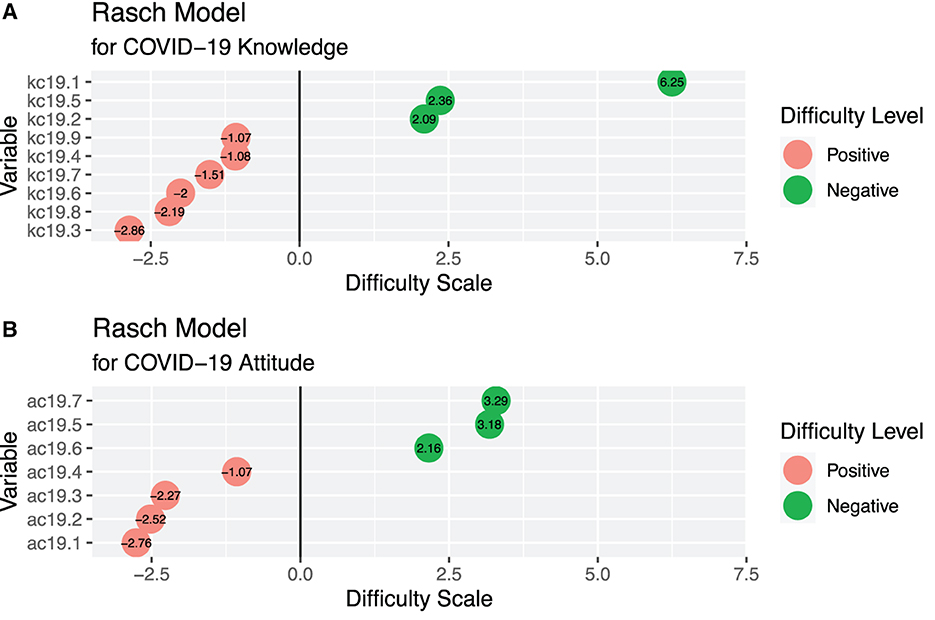
Figure 2. The model coefficients for the knowledge (A) and attitude (B) constructs.
3.3 Item characteristic curves
We sought to understand if students' had similar abilities in responding to the knowledge and attitude items regarding COVID-19. Thus, we plotted the item characteristic curves (ICC) of the items to illustrate the estimated item parameters.
Figure 3 presents the item characteristic curves, ICC, which show the probability of responding to an item in the knowledge and attitude constructs. The upper most curves correspond to the ease of responding, whereas the lower curves imply that the items were difficult. Indeed, these findings corroborate well with the models presented in Figure 2.
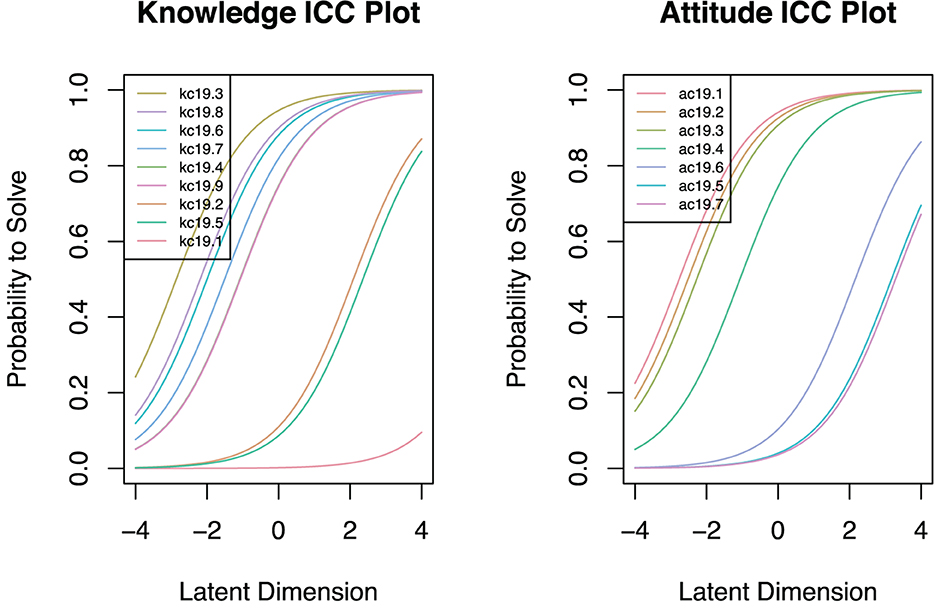
Figure 3. Student knowledge and attitude characteristic curves.
3.4 Person-item mapping
A person-item map displays the location of item (and threshold) parameters as well as the distribution of person parameters along the latent dimension. Person-item maps are useful to compare the range and position of the item measure distribution (lower panel) to the range and position of the person measure distribution (upper panel). Items should ideally be located along the whole scale to meaningfully measure the “ability” of all student-respondents.
Findings presented in Figure 4 show that students' ability levels were greatly unbalanced since the items do not cover the whole spectrum. The knowledge construct seems not to have adequately measured the ability levels of the students about the COVID-19 epidemic. On the contrary, the attitude construct seems more located along the scale, hence showing better students' ability to respond.
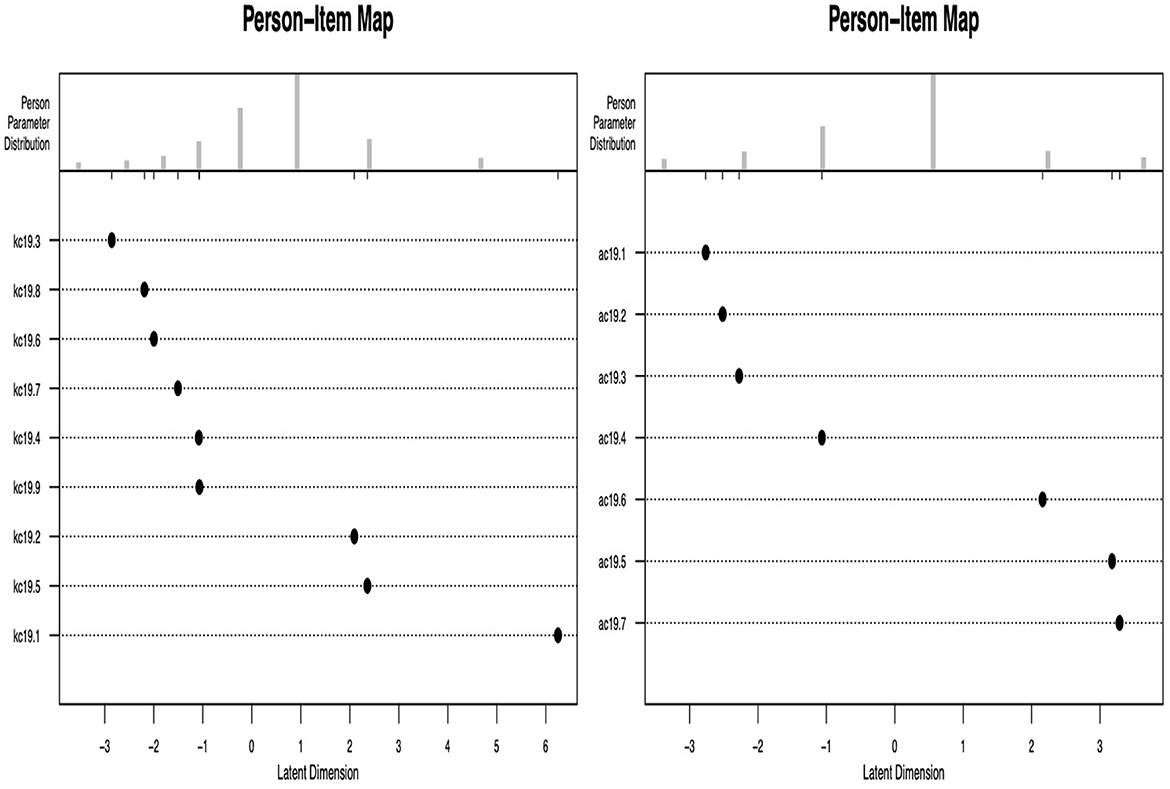
Figure 4. Student item mapping for COVID-19 knowledge and attitude.
3.5 Rasch model estimation using MML
We fitted a Rasch model to the data using the marginal maximum likelihood (MML) estimation of the item parameters. Here, the model was identified by assuming a standard normal distribution of the person parameters. All item parameters were freely estimated because the mean of the person parameters is fixed to 0. The Rasch model using the MML estimator for the knowledge construct shows similar results like those presented in Figures 2A, B.
However, we further assessed the level of discrimination for each item to confirm the earlier findings. Incidentally, among the knowledge construct, item 1 identified as the most difficult was also found to be associated with a higher discrimination tendency [23]. Inversely, item 5, the easiest to respond to had the least discrimination tendency. Among the attitude construct items, the Rasch model with the MML estimator showed that all the items were classifed as easy to respond to. However, their discriminating power was low.
Moreover, on comparing the two models, it is shown that the attitude model presents a higher log-likelihood than the knowledge model (LL: -2651.402 vs. -3709.827), indicating that the model for attitude construct is relatively better.
3.6 Relative fit of the Rasch and the 2PL model
We tested the equality of the Rasch and the 2PL models in assessing knowledge and attitude constructs. Using the the two information criteria thus, AIC and BIC, and the log-likelihood test (LRT), we can confortably say that the two models for both constructs result in significantly different results. The knowledge construct present different statistics, [AIC: 7,520.13 vs. 7455.65; BIC: 7,571.33 vs. 7,547.82 and LRT: 80.47, df = 8, p = 0.000], compared to the attitude construct, [AIC: 5,477.83 vs. 5,330.80; BIC: 5,518.80 vs. 5,402.49 and LRT: 159.03, df = 6, p = 0.000].
3.7 Absolute fit of the 2PL model
We further sought to check for the knowledge and attitude 2PL models' fit using the Andersen's test on three categorical variables, including gender (male versus female), grade point average (< 3.00 vs. at least 3.00), and health status (good versus bad). This check was used to associate absolute fit to linearity between the binary categorical variables. It can be observed from Figure 5, among variables that the 2PL meets the requirement for providing absolute fit for COVID-19 fitted knowledge and attitude constructs.
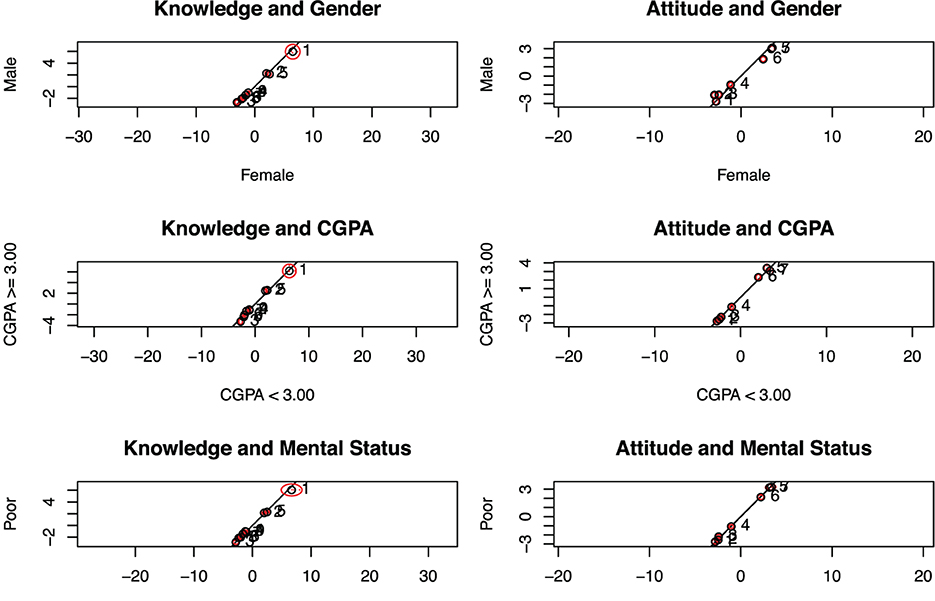
Figure 5. Student item mapping for COVID-19 knowledge and attitude.
4 Discussions
The measurement models for the less quantifiable constructs such as knowledge and attitude is indeed an important aspect in assessing an individual's ability to change, resource limitation, emotional pressure, and even loss [24, 25]. Specifically, proper construction of knowledge and attitude measurement items definitely plays a great role to improve and acts as a precursor for better predictive modelling of the management of pandemics, such as COVID-19. One's knowledge and attidtude, especially when constantly updated could result in reduction of stress, anxiety, depression, and worry. This may indirectly prevent daily reported deaths due to a pandemic. Moreover, better outcomes may be realized when accompanied by constantly updated measures, such as lockdown, wearing of masks, and limited movements, which arise as information evolves. On the other hand, a prevalent open and supportive response model could be more functional to adaptation and prediction efficacy in dealing with the difficulty and better operational skills.
In this regard, our study was two-pronged. First, we compared the model efficacies as well as sought to uncover insights of the target groups. Thus, we explored the fact that item construction for knowedge and attitude plays a fundamental role to determine the level of awareness but also should be designed so well that the items do discriminate individuals based on their abilities. Basically, a comparison of the one-parameter, the Rasch model against the two-parameter model, while examining their performance alongside parameter-estimation methods presented, with an application to COVID-19 data is a significant contribution [26, 27]. Our findings indeed indicate that although the two models are competetive, the two-parameter model is superior to the Rasch model. The two-parameter model, in its discriminating process, estimates the ability as well as examines the difficulty parameters.
5 Limitations
Sampling for the experimental data was conducted through email contacts targeting students at the Sultan Qaboos University in Oman. As a result, there could have arisen a possibility of bias as some students could not have been able to participate in the study for various reasons, leading to cautious inferences. A more national systematic, inclusive sampling method is warranted to improve the generalization of the findings.
6 Conclusion
The construction of Likert-scale measurement items may sometimes fail to adduce relevant inferences if aspects of level of difficulty, discrimination, or simply item flow are not considered. Our study has compared two IRT models, that is, the Rasch model and the 2PL models on students' COVID-19 knowledge and attitude constructs. We have applied and compared estimated parameters from the maximum likelihood estimation and the marginal maximum likelihood estimation methods. Our findings show that the 2PL model is more applicable in assessing COVID-19 knowledge and attitude than the Rasch model. The 2PL also directly provides a discrimination parameter, which is important to promote classification accuracy among respondents based on their abilities. Additionally, we found that parameter estimation using the MML competes favorably as compared to the popular MLE with the advantage that all item parameters can freely be estimated because the mean person parameter is fixed at zero. Therefore, we can also conclude that although students' attitude was better measured, the item constructs for COVID-19 were not significantly different from those for the knowledge constructs as far as their discriminating power was concerned. Generally, we conclude that students took the cross-sectional survey seriously but were more poised with higher abilities to respond to the attitude than knowledge items. This could be caused by various psycho-social, psychosomatic, or other associated reasons, including stress. Further studies are recommended to determine reasons why its easier to measure attitude than knowledge in most studies [28, 29]. Further extension on the 2-PL model could be done to include the guess parameter. On the COVID-19 pandemic survey data application, we recommend more national sensitization campaigns to be conducted to boost knowledge during such times in future pandemics. In summary:
• There were statistically significant differences in the results between the knowledge and attitude construct 2PL and Rasch models as observed from the AIC, BIC and the log-likelihood ratio tests. A relatively better model fit was observed for the COVID-19 attitude construct model than knowledge.
• Andersen's test for the 2PL model fit on the three predictor variables, student's gender, GPA, and health status, provided an absolute fit for students' knowledge and attitude constructs regarding COVID-19.
• Moreover, the attitude model had a higher log-likelihood than the knowledge construct model, thus providing a resultant better performance for the attitude construct relative compared to the knowledge construct.
Data availability statement
The raw data supporting the conclusions of this article will be made available by the authors, without undue reservation.
Author contributions
RW: Conceptualization, Data curation, Formal analysis, Investigation, Methodology, Software, Writing – original draft, Writing – review & editing. MI: Conceptualization, Data curation, Formal analysis, Investigation, Methodology, Writing – review & editing. IA: Conceptualization, Data curation, Formal analysis, Investigation, Methodology, Writing – review & editing. AA: Conceptualization, Data curation, Formal analysis, Investigation, Writing – review & editing.
Funding
The author(s) declare that no financial support was received for the research, authorship, and/or publication of this article.
Conflict of interest
The authors declare that the research was conducted in the absence of any commercial or financial relationships that could be construed as a potential conflict of interest.
The author(s) declared that they were an editorial board member of Frontiers, at the time of submission. This had no impact on the peer review process and the final decision.
Publisher's note
All claims expressed in this article are solely those of the authors and do not necessarily represent those of their affiliated organizations, or those of the publisher, the editors and the reviewers. Any product that may be evaluated in this article, or claim that may be made by its manufacturer, is not guaranteed or endorsed by the publisher.
References
1. Ceylan RF, Ozkan B, Mulazimogullari E. Historical evidence for economic effects of COVID-19. Eur J Health Econ. (2020) 21:817–23. doi: 10.1007/s10198-020-01206-8
2. Rume T, Islam SDU. Environmental effects of COVID-19 pandemic and potential strategies of sustainability. Heliyon. (2020) 6:e04965. doi: 10.1016/j.heliyon.2020.e04965
3. Liu F, Wang M, Zheng M. Effects of COVID-19 lockdown on global air quality and health. Sci Total Environm. (2021) 755:142533. doi: 10.1016/j.scitotenv.2020.142533
4. Mattioli AV, Ballerini Puviani M, Nasi M, Farinetti A. COVID-19 pandemic: the effects of quarantine on cardiovascular risk. Eur J Clin Nutr. (2020) 74:852–5. doi: 10.1038/s41430-020-0646-z
5. Sanchez-Teruel D, Robles-Bello MA, Lara-Cabrera M, Valencia-Naranjo N. Gender implications of the fear of COVID-19 scale in the spanish population: a validation study. Psychol Trauma. (2022) 14:258. doi: 10.1037/tra0001062
6. Mulyono H, Suryoputro G, Jamil SR. The application of WhatsApp to support online learning during the COVID-19 pandemic in Indonesia. Heliyon. (2021) 7:e07853. doi: 10.1016/j.heliyon.2021.e07853
7. Pokhrel S, Chhetri R. A literature review on impact of COVID-19 pandemic on teaching and learning. Higher Educ Future. (2021) 8:133–41. doi: 10.1177/2347631120983481
8. Fayyoumi E, Idwan S, AboShindi H. Machine learning and statistical modelling for prediction of novel COVID-19 patients case study: Jordan. Mach Learn. (2020) 11:3–11. doi: 10.14569/IJACSA.2020.0110518
9. Schneble M, De Nicola G, Kauermann G, Berger U. A statistical model for the dynamics of COVID-19 infections and their case detection ratio in 2020. Biom J. (2021) 63:1623–32. doi: 10.1002/bimj.202100125
10. Breakwell GM, Fino E, Jaspal R. The COVID-19 preventive behaviors index: Development and validation in two samples from the United Kingdom. Evaluat Health Prof . (2021) 44, 86. doi: 10.1037/t85801-000
11. Caycho-Rodriguez T, Vilca LW, Cervigni M, Gallegos M, Martino P, Portillo N, et al. Fear of COVID-19 scale: Validity, reliability and factorial invariance in Argentina's general population. Death Stud. (2022) 46:543–52. doi: 10.1080/07481187.2020.1836071
12. Owino A, Wesonga R, Nabugoomu F. Determining food insecurity: an application of the rasch model with household survey data in Uganda. Int J Food Sci. (2014) 2014:121269. doi: 10.1155/2014/121269
13. Ahmed O, Faisal RA, Sharker T, Lee SA, Jobe MC. Adaptation of the bangla version of the COVID-19 anxiety scale. Int J Ment Health Addict. (2020) 20:284–95. doi: 10.1007/s11469-020-00357-2
14. Sunjaya DK, Sumintono B, Gunawan E, Herawati DMD, Hidayat T. Online mental health survey for addressing psychosocial condition during the COVID-19 pandemic in Indonesia: Instrument evaluation. Psychol Res Behav Manag. (2022) 15:161. doi: 10.2147/PRBM.S347386
15. Anderson J, Kearney G, Everett A. An evaluation of rasch's structural model for test items. Br J Math Stat Psychol. (1968) 21:231–8. doi: 10.1111/j.2044-8317.1968.tb00411.x
16. Rasch G. An individualistic approach to item analysis. In: Readings in Mathematical Social Science. Washington, DC: American Psychological Association (1966) p. 89–108.
17. Whitely SE. Models, meanings and misunderstandings: some issues in applying Rasch's theory. J Educ Measurem. (1977) 227–35. doi: 10.1111/j.1745-3984.1977.tb00040.x
18. Darrell Bock R, Lieberman M. Fitting a response model for dichotomously scored items. Psychometrika. (1970) 35:179–97. doi: 10.1007/BF02291262
19. Bock RD, Aitkin M. Marginal maximum likelihood estimation of item parameters: application of an EM algorithm. Psychometrika. (1981) 46:443–59. doi: 10.1007/BF02293801
20. Thissen D. Marginal maximum likelihood estimation for the one-parameter logistic model. Psychometrika. (1982) 47:175–86. doi: 10.1007/BF02296273
21. Birnbaum A. Some latent trait models. In: Statistical Theories of Mental Test Scores. Tokyo: National Institute of Informatics (1968).
22. Islam MM, Wesonga R, Al Hasani I, Al Manei A. Prevalence and determinants of mental health issues among university students during COVID-19 pandemic in Oman: an online cross-sectional study. Int Res Public Environm Health. (2022) 9:43.
23. Diotaiuti P, Valente G, Mancone S, Corrado S, Bellizzi F, Falese L, et al. (2023). Effects of cognitive appraisals on perceived self-efficacy and distress during the COVID-19 lockdown: an empirical analysis based on structural equation modeling. Int J Environm Res Public Health. 20:5294. doi: 10.3390/ijerph20075294
24. Alrubaiee GG, Al-Qalah TAH, Al-Aawar MSA. Knowledge, attitudes, anxiety, and preventive behaviours towards COVID-19 among health care providers in Yemen: an online cross-sectional survey. BMC Public Health. (2020) 20:1–11. doi: 10.1186/s12889-020-09644-y
25. Hämäläinen R, Nissinen K, Mannonen J, Lämsä J, Leino K, Taajamo M. Understanding teaching professionals' digital competence: What do PIAAC and TALIS reveal about technology-related skills, attitudes, and knowledge? Comp Human Behav. (2021) 117:106672. doi: 10.1016/j.chb.2020.106672
26. Overton CE, Stage HB, Ahmad S, Curran-Sebastian J, Dark P, Das R, et al. Using statistics and mathematical modelling to understand infectious disease outbreaks: COVID-19 as an example. Infect Dis Model. (2020) 5:409–41. doi: 10.1016/j.idm.2020.06.008
27. Vespignani A, Tian H, Dye C, Lloyd-Smith JO, Eggo RM, Shrestha M, et al. Modelling covid-19. Nat Rev Phys. (2020) 2:279–81. doi: 10.1038/s42254-020-0178-4
28. Azlan AA, Hamzah MR, Sern TJ, Ayub SH, Mohamad E. Public knowledge, attitudes and practices towards COVID-19: a cross-sectional study in Malaysia. PLoS ONE. (2020) 15:e0233668. doi: 10.1371/journal.pone.0233668
Keywords: IRT, Rasch, measurement, discrimination, COVID-19, survey data
Citation: Wesonga R, Islam MM, Al Hasani I and Al Manei A (2024) Item response theory to discriminate COVID-19 knowledge and attitudes among university students. Front. Appl. Math. Stat. 9:1328537. doi: 10.3389/fams.2023.1328537
Received: 26 October 2023; Accepted: 05 December 2023;
Published: 05 January 2024.
Edited by:
Yousri Slaoui, University of Poitiers, FranceReviewed by:
Pierluigi Diotaiuti, University of Cassino, ItalyMd Hasinur Rahaman Khan, University of Dhaka, Bangladesh
Copyright © 2024 Wesonga, Islam, Al Hasani and Al Manei. This is an open-access article distributed under the terms of the Creative Commons Attribution License (CC BY). The use, distribution or reproduction in other forums is permitted, provided the original author(s) and the copyright owner(s) are credited and that the original publication in this journal is cited, in accordance with accepted academic practice. No use, distribution or reproduction is permitted which does not comply with these terms.
*Correspondence: Ronald Wesonga, wesonga@squ.edu.om; wesonga@wesonga.com