Using Telemetry Sensors Mapping the Energetic Costs in European Sea Bass (Dicentrarchus labrax), as a Tool for Welfare Remote Monitoring in Aquaculture
 Sébastien Alfonso
 Walter Zupa
 Maria Teresa Spedicato
 Giuseppe Lembo
 Pierluigi Carbonara
- COISPA Tecnologia & Ricerca, Bari, Italy
Physiological real-time monitoring could help to prevent health and welfare issues in farmed fishes. Among physiological features that can be of interest for such purposes, there is the metabolic rate. Its measurement remains, however, difficult to be implemented in the field. Thus, mapping the fish acceleration recorded by tag with the oxygen consumption rate (MO2) could be promising to counter those limitations and to be used as a proxy for energy expenditure in the aquaculture environments. In this study, we investigated the swimming performance (Ucrit) and the swimming efficiency (Uopt, COTmin), and we estimated the metabolic traits (standard and maximum metabolic rates, SMR and MMR, as well the absolute aerobic scope, AS) of European sea bass (Dicentrarchus labrax; n = 90) in swimming tunnel. Among all tested fish, 40 fishes were implanted with an acoustic transmitter to correlate the acceleration recorded by the sensor with the MO2. In this study, the mean SMR, MMR, and AS values displayed by sea bass were 89.8, 579.2, and 489.4 mgO2 kg−1 h−1, respectively. The Uopt and COTmin estimated for sea bass were on average 1.94 km h−1 and 113.91 mgO2 kg−1 h−1, respectively. Overall, implantation of the sensor did not alter fish swimming performance or induced particular stress, able to increase MO2 or decrease swimming efficiency in tagged fish. Finally, acceleration recorded by tag has been successfully correlated with MO2 and fish mass using a sigmoid function (R2 = 0.88). Overall, such results would help for real-time monitoring of European sea bass health or welfare in the aquaculture environment in a framework of precision livestock farming.
Introduction
The real-time monitoring technologies to manage animal farming are gaining uses to improve production and to monitor the health and welfare of farmed animals (Føre et al., 2018; Halachmi et al., 2019; Brijs et al., 2021). One approach developed in a framework of precision livestock farming is to monitor a number of sentinel animals using sensors (Halachmi et al., 2019). Continuous real-time monitoring may allow early detection of health or welfare issues, also leading to an early response from producer, and so to increase the likelihood of response success implemented. Overall, this would help to improve the lives of farmed animals by reducing suffering related to an impaired welfare state and enhance farm production. During the last decades, a wide range of sensors has been developed to remotely monitor animal behavior and physiology, including in fishes (Brijs et al., 2021). Among these, some sensors are measuring position, acceleration, internal temperature, muscle activity, metabolic rate, or heartbeat rate of fish (e.g., Brijs et al., 2019; Carbonara et al., 2020b; Gesto et al., 2020; Muñoz et al., 2020; Rosell-Moll et al., 2021). For instance, the fish acceleration measured by some sensors was found to be sensitive to acute stressors found in aquacultures, such as hypoxia or ammonia exposure (Gesto et al., 2020; Rosell-Moll et al., 2021), or chronic stressors, such as stocking density (Carbonara et al., 2019, 2020a). Therefore, the use of such sensors could represent a promising tool for health and welfare remote monitoring in aquaculture, fish welfare being of great concern for consumers, producers, and regulatory authorities (Ashley, 2007; European Food Safety Authority, 2009).
Among physiological features that can be of interest for fish health and welfare monitoring, there is the metabolic rate, which could be used as proxy of the energetic expenditure related to fish's daily activities (Chabot et al., 2016a; McKenzie et al., 2016; Norin and Clark, 2016). Briefly, the oxygen consumption rate (MO2) displayed by a fish is comprised between the standard metabolic rate (SMR), which represents the minimal amount of oxygen needed by a fish to support its aerobic metabolic rate, and the maximum metabolic rate (MMR) which refers to the maximum rate of aerobic metabolism that can be sustained by the animal (Chabot et al., 2016a; Norin and Clark, 2016). The numerical difference between MMR and SMR defines the absolute aerobic scope (AS), which quantifies the amount of oxygen that can be consumed to support all physiological and locomotive activities, such as migration, feeding, and reproduction (Fry, 1947; Brett, 1972). In rearing conditions, sustaining a high metabolic rate, close to the MMR, consumes energy, and this energy will be no more available for other life activities, or to be invested in growth or reproduction, leading to potential health and welfare issues for fish. The SMR and MMR of fish are typically measured in the laboratory during the critical swimming test (Ucrit) in swimming chamber. Briefly, the SMR and MMR can be estimated based on the relationship between the MO2 and swimming speed, by extrapolating the value of MO2 when the speed value is equal to zero for the SMR, while the MMR is overall measured at the Ucrit value during the critical swimming test (Chabot et al., 2016a; McKenzie et al., 2016).
Although the MO2 is a good indicator of fish physiological state, its measurement is not easily applicable to fishes either in the wild or in aquaculture environments (McKenzie et al., 2016). Thus, mapping the acceleration recorded by a sensor with the MO2 during the Ucrit test could be promising to later use the tag acceleration data as an estimation of MO2 in free-swimming fish, and so as proxy of energetic costs related to the environment (e.g., Wilson et al., 2013; Wright et al., 2014; Alfonso et al., 2021a,b; Carbonara et al., 2021; Zupa et al., 2021). However, it is important to first emphasize that, as metabolic rate is known to be affected by different factors (e.g., size, species, temperature), MO2 estimate using accelerometer tags needs accurate specific species mapping, at a given size and temperature, prior to being used in aquaculture environments (Chabot et al., 2016a; Rubio-Gracia et al., 2020).
The aim of this study was (1) to investigate the swimming performance, metabolic traits, and swimming efficiency for tagged and untagged European sea bass (Dicentrarchus labrax), a key species for the European marine aquaculture (Vandeputte et al., 2019) and (2) to calibrate the acceleration recorded by tag with the MO2 of the fish to be later used as a proxy of its energy expenditure. To do so, we assessed first the swimming performance of sea bass in the swimming tunnel and estimated the metabolic traits and swimming efficiency in sea bass ranging from 212 to 998 g at 18°C. Among all fishes, a subsample was implanted with an accelerometer tag, and the acceleration recorded by the sensor was correlated with the MO2. In addition, the metabolic traits, swimming performance, and swimming efficiency were compared between tagged and untagged fish to evaluate tagging effect on these variables. Overall, this work could later benefit to health and welfare of farmed fish by remote real-time monitoring of the European sea bass in the framework of precision livestock aquaculture farming.
Materials and Methods
All experiments were performed in accordance with EU recommendations (Directive 2010/63/EU) and the Italian National Legislation (D. lgs. 26/2014) on the fish welfare, with the authorization of Italian Health Ministry number code 838/2019-PR.
Fish
European sea bass were provided by an aquaculture farm (Ittica Caldoli, Lesina, Italy) and then kept 6 weeks for acclimation in our facility at Coispa Tecnologia & Ricerca (Bari, Italy) before proceeding to experimental procedures described below. Fish were kept in 1.2–m3 circular fiberglass tanks in a flow-through system with marine water input of 150 L h−1 (35 PSU). Stocking density was ~12 kg.m3, oxygen saturation was at ~80%, and temperature was maintained constant at 18 ± 1°C. The light regime was also maintained constant during the entire experimental period (12-h light:12-h dark). The fish were fed ~1% of the body mass using commercial food Marine 3P (Skretting, Vignetto, Italy).
Critical Swimming Test (Ucrit) and Estimation of Metabolic Traits and Cost of Transport (COT)
Critical swimming tests were conducted using a swim tunnel respirometer Loligo Systems (Viborg, Denmark) of 30- or 90-L in accordance with the manufacturer's instruction depending on the fish size. In more detail, fish larger than 450 g were challenged in the 90-L swim tunnel whereas other fish were tested in the 30-L swim tunnel. The trials were controlled using the DAQ-M device (no. AR12500, Loligo Systems, Viborg, Denmark). The speed of the water flow was calibrated by means of a flow-meter Flowtherm NT (Höntzsch, Germany), whereas the oxygen concentration was measured using a polymer optical fiber oxygen probe (POF; Loligo Systems) inserted in the swimming chamber. The oxygen probe was connected to the WITROX oxygen instrument 1 (no. OX11800; with a high-accuracy temperature sensor; Loligo Systems) to sample oxygen variations during the trials. Finally, the swimming chambers were housed in a buffer tank to maintain a constant temperature of 18 ± 1°C during the trial.
About 24 h before introducing fish into the swimming tunnel for the trial, fish were starved to ensure a post-absorptive state (McFarlane et al., 2004) and were lightly anesthetized using 30 mg L−1 hydroalcoholic solution of clove oil (bathed for ~1 min in anesthetic) for taking morphometric measurements (Zupa et al., 2015). After the fish being introduced into the swimming chamber, the fish was left undisturbed for 30 min at least before induction of swimming velocity of 0.1 m s−1. Velocity has been maintained for 90 min at least, allowing fish acclimation before starting the trial. The swimming trial started when the oxygen consumption (MO2) reached a constant low plateau (Martos-Sitcha et al., 2018). During the trial, the swimming speed has been increased with a constant ramp of 0.1 m s−1 at constant time intervals of 10 min until fatigue was reached (Carbonara et al., 2010). Each interval was constituted of 3 steps: a 5-min step of “flushing,” 2-min step of “waiting,” and 3-min step of “MO2 measurement” (Alfonso et al., 2021a). During the MO2 measurement step, the oxygen concentration of the swim tunnel water was recorded every second. MO2 was automatically calculated by the software AutoResp v.2.3 (Loligo Systems) from linear decrease in the O2 concentration inside the chamber, using the appropriate constants for oxygen solubility in seawater (salinity, temperature, and barometric pressure).
The Ucrit values were estimated according to Brett (1964) and corrected for solid blocking effects (Smit et al., 1971; Kline et al., 2015). Absolute Ucrit (m s−1) was also accounted for size and displayed as relative Ucrit (BL s−1). During the swimming trial, the MO2 was fitted as a function of swimming speed, and the model was used for estimating the values of the metabolic variables: SMR, MMR, and the absolute AS (refer to “Statistical Analyses”). The cost of transport (COT) was fitted as the function of swimming speed (U, km h−1) according to the study by Zupa et al. (2015), and Uopt and COTmin were estimated based on the model (refer to “Statistical Analyses”).
In this study, 90 fish were challenged in the swimming chamber for the Ucrit trial. Among the 90, 50 fish were will serve as a baseline of swimming performance and MO2 (named untagged fish), whereas 40 fish were implanted with accelerometer tag (named tagged fish) to correlate the acceleration recorded by tag with the MO2. Morphometric data of fish used in the study are displayed in Table 1 for both untagged and tagged fish.
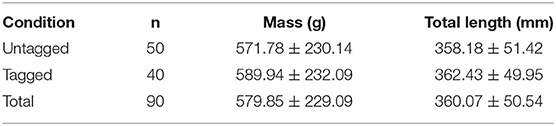
Table 1. Morphometric measures (mass [g] and total length, TL [mm]) and sample size of European sea bass (Dicentrarchus labrax) tested in the swimming chamber for Ucrit trials depending on condition (untagged and tagged fish).
Implantation of Accelerometer Tags and Calibration of Acceleration With MO2 During Ucrit Trial
A total of 40 fish (Table 1) were randomly selected for mapping the swimming activity recorded by accelerometer tag with the MO2 during the Ucrit trials. The fish was starved 24 h before the implantation of tag. Prior to proceeding to the surgery, fish was anesthetized using 30 mg L−1 of hydroalcoholic clove oil solution for ~3 min, and the gills of fish were continuously irrigated with the anesthetic bath during the surgical procedure. The acoustic transmitter VEMCO V9AP (AMIRIX Systems Inc., Nova Scotia, Canada) was implanted into the body cavity through a 1.5-cm incision and carefully sutured, as described in the study of Alfonso et al. (2021a) (Figure 1). After the surgery, fish was left undisturbed in a separate tank for 5 days of recovery before trial in a swimming tunnel as described above. Choice of 5 days of recovery was based on the preliminary work in sea bass (Carbonara et al., 2021). Daily observations following the surgery were carried out to ensure that fish did eat and behave normally before being tested.
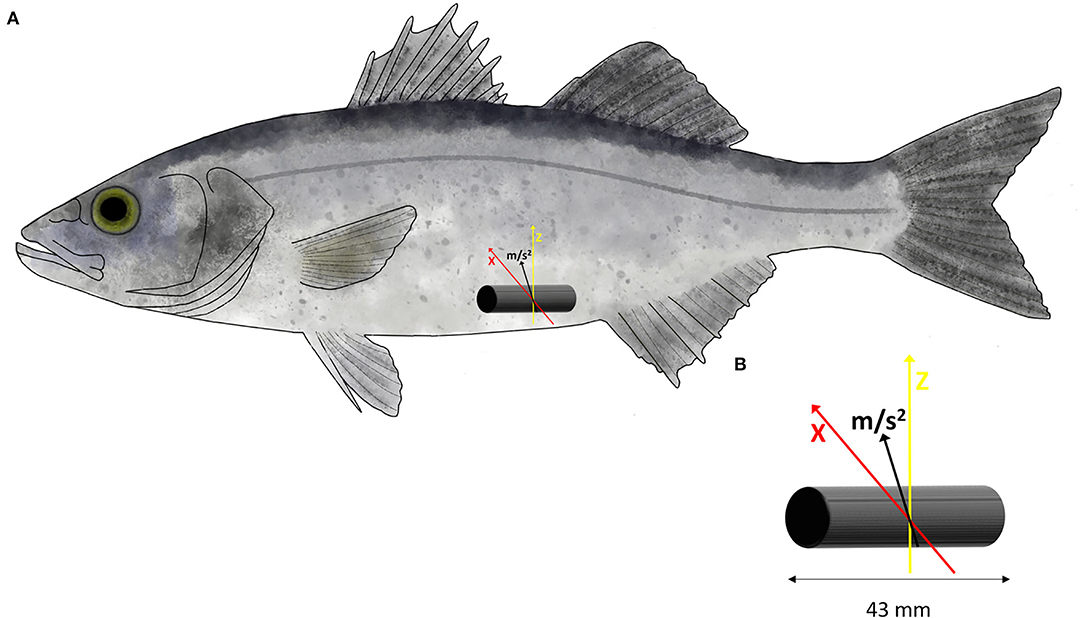
Figure 1. (A) Location and position of the V9AP acoustic transmitter into the body cavity of European sea bass (Dicentrarchus labrax). (B) The transmitter is programmed to record the acceleration (m s2) over two axes (X, in red and Z, in yellow).
For the Ucrit trial, the accelerometer tag was programmed to record, with a sampling rate of 10 Hz, the acceleration over two axes (X and Z) (Brownscombe et al., 2018), excluding the y-axes of the backward or forward movements (Figure 1). The tag transmits the coded values that correspond to fish acceleration on average of every 30 s. The tag provided an 8-bit value which represents the root mean square (RMS) acceleration. The value ranges from 0 to 255 and displayed as an arbitrary unit (AU). Value can be converted in acceleration using the following equation (acceleration (m s−2) = 0.01955(x), where x is the value given by tags) resulting from the contribution of two axes. The data were stored in acoustic receivers Vemco VR2W (AMIRIX Systems Inc., Nova Scotia, Canada) located near the swimming chamber until the end of trial. Then, the data were extracted from the receiver using the software VUE (AMIRIX Systems Inc., Nova Scotia, Canada), and the values retrieved from the tag were averaged for each step of swimming speed before processing to the mapping with MO2 recorded during the trial.
Statistical Analysis
Statistical analyses were carried out using the R software version 4.0.4 (R Core Team, 2021) at the 95% level of significance. Data are presented as mean ± SE except otherwise mentioned. For boxplot representation, the central line of the boxplot indicates the median whereas the boxes on either side represent the quartiles (whiskers covering 95% of the values). In boxplots, the values are represented by dots, and the outlier values are represented by bigger dots.
Concerning analyses, the swimming performance (Ucrit) was first compared using the t-test between the tagged and untagged sea bass. Subsequently, swimming performance (Ucrit) was evaluated using ANOVA as a function of two factors, the fish mass and tagging condition, and the interaction of both factors. Since tagging conditions, as well the interaction mass and tagging, were not significant (refer to Supplementary Table S1), they were both removed before running ANOVA, and so the swimming performance was analyzed only as a function of fish mass.
The MO2 of sea bass during the Ucrit trials was fitted as a function of swimming speed (U) using an exponential model for each fish using the following formula:
where α and β are constant. SMR was estimated by extrapolating the MO2 value when the swimming speed (U) was equal to 0 (Chabot et al., 2016b), whereas the MMR value was estimated using the MO2 value at the Ucrit value (i.e., when the swimming speed U = Ucrit) (Norin and Clark, 2016). The numerical difference between MMR and SMR indicates the absolute AS (Halsey et al., 2018). Linear regressions were carried out for all metabolic traits as the function of fish mass to evaluate the relation between mass and metabolic rates in sea bass. Metabolic traits were compared between tagged and untagged fish using the t-test.
As briefly explained above, the COT (mgO2 kg−1 km−1), which provides an index of overall swimming efficiency, was modeled as the function of swimming speed (U, km h−1) following the following formula according to the study by Zupa et al. (2015):
where a and b are constant. The COT function is characterized by a U-shaped (Claireaux et al., 2006) and has a minimum (minimum cost of transport, COTmin), which corresponds to the optimal swimming speed Uopt (i.e., best swimming efficiency). Uopt was calculated as follows:
Linear regressions were applied for Uopt and COTmin as the function of fish mass to evaluate the relationship between mass and swimming efficiency in sea bass. In addition, the Uopt and COTmin were compared using the t-test between tagged and untagged fish.
To calibrate the swimming activity measured by the tag with the MO2, two modeling steps were performed as described in the study by Alfonso et al. (2021a). Briefly, for the first step, the MO2 was modeled as a function of the swimming activity using self-starting non-linear least squares (NLS) logistic models (SSlogis) for each fish (Supplementary Table S2), based on the following formula:
where Asym is a numeric parameter representing the asymptote; xmid is a parameter representing the x value at the inflection point of the curve, when y = Asym/2, and scal: is a scale parameter of the x-axis.
Parameters of the model (i.e., Asym, xmid, and scal) for each fish were retrieved and were tested depending on fish mass using linear regression (Supplementary Table S2; Supplementary Figure S2). For the second step, one SSlogis model accounting for all fish has been fitted. In this model, the parameters have been adapted depending on the link between the parameter and fish mass (results from the first step). In more details, in the step 1, the Asym was the unique parameter that was affected by the fish mass (Asym = 633.8–0.21 * Mass; p < 0.001; R2 = 0.36; Supplementary Figure S2). So, in step 2, the Asym parameter was modified from fixed to the equation displayed above accounting for fish mass, whereas the two other parameters were kept as constant (since no influenced by mass). These latter two parameters (xmid and scal) were estimated using the classic iteration method.
Results
Critical Swimming Speed (Ucrit), Estimation of Metabolic Traits, and COT
Overall, the absolute Ucrit values ranged from 0.86 to 1.26 m s−1 with an average of 1.05 ± 0.07 m s−1. The relative Ucrit values ranged from 2.06 to 4.19 with on average of 2.98 ± 0.45 BL s−1. The implantation of tag did not influence the fish swimming performance, whatever was measured as absolute or relative Ucrit (Supplementary Figure S3; Supplementary Table S1). The absolute Ucrit resulted to be not correlated to the fish mass (p > 0.05; Supplementary Figure S3A) whereas the relative Ucrit decreased as a function of fish mass (p < 0.001; R2 = 0.75; Supplementary Figure S3B).
The MO2 increased following an exponential pattern in sea bass during the Ucrit trial (Figure 2). Exponential models fitted did explain well the MO2 during Ucrit (p < 0.001 for all fish; R2 > 0.7; refer to Supplementary Table S3 for statistics details). The parameter β of the exponential model did not vary according to fish mass (p > 0.05) whereas the parameter α decreased with the increase of fish mass (R2 = 0.14; p < 0.01; Supplementary Table S3).
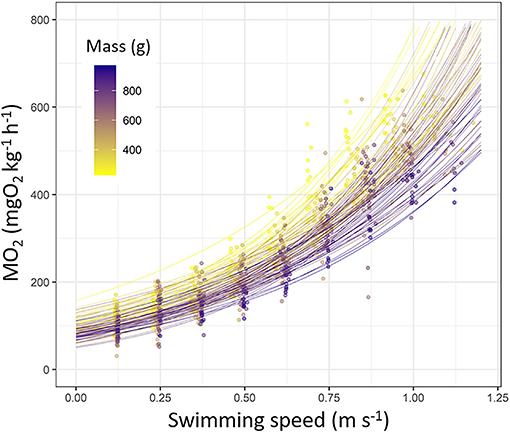
Figure 2. Oxygen consumption rate (MO2, mgO2 kg−1 h−1) fitted as a function of swimming speed (m s−1) in European sea bass (Dicentrarchus labrax; n = 90). Each line represents a fish based on exponential model (statistics details are provided in Supplementary Table S3). Each dot represents a value obtained during Ucrit trial. Dots and line color are referring to the fish mass (from 200 to 1,000 g; from yellow to dark blue).
For each fish, the SMR value has been retrieved from the MO2 when swimming speed = 0 based on the exponential model, and MMR was extrapolated from the MO2 value at the Ucrit trial. The estimated SMR, MMR, and absolute AS values estimated by the models were 89.77 ± 20.35, 579.21 ± 94.89, and 489.44 ± 92.37 mgO2 kg−1 h−1, respectively, with higher variability for MMR and the absolute AS than SMR (Supplementary Table S3). The SMR and MMR were negatively correlated with the fish mass (SMR, y = 109.88–0.03 * x; p < 0.001; R2 = 0.14; MMR, y = 744.06–0.28 * x; p < 0.001; R2 = 0.47; Figures 3A,B). This resulted into lower absolute aerobic scope for larger fish (y = 634.18–0.25 * x; p < 0.001; R2 = 0.38; Figure 3B). The estimated SMR values were lower in tagged fish than untagged fish (82.79 ± 20.06 mgO2 kg−1 h−1 vs. 95.35 ± 18.98 mgO2 kg−1 h−1; p < 0.01), whereas the MMR and absolute AS were similar between conditions (p > 0.05; Figure 3C).
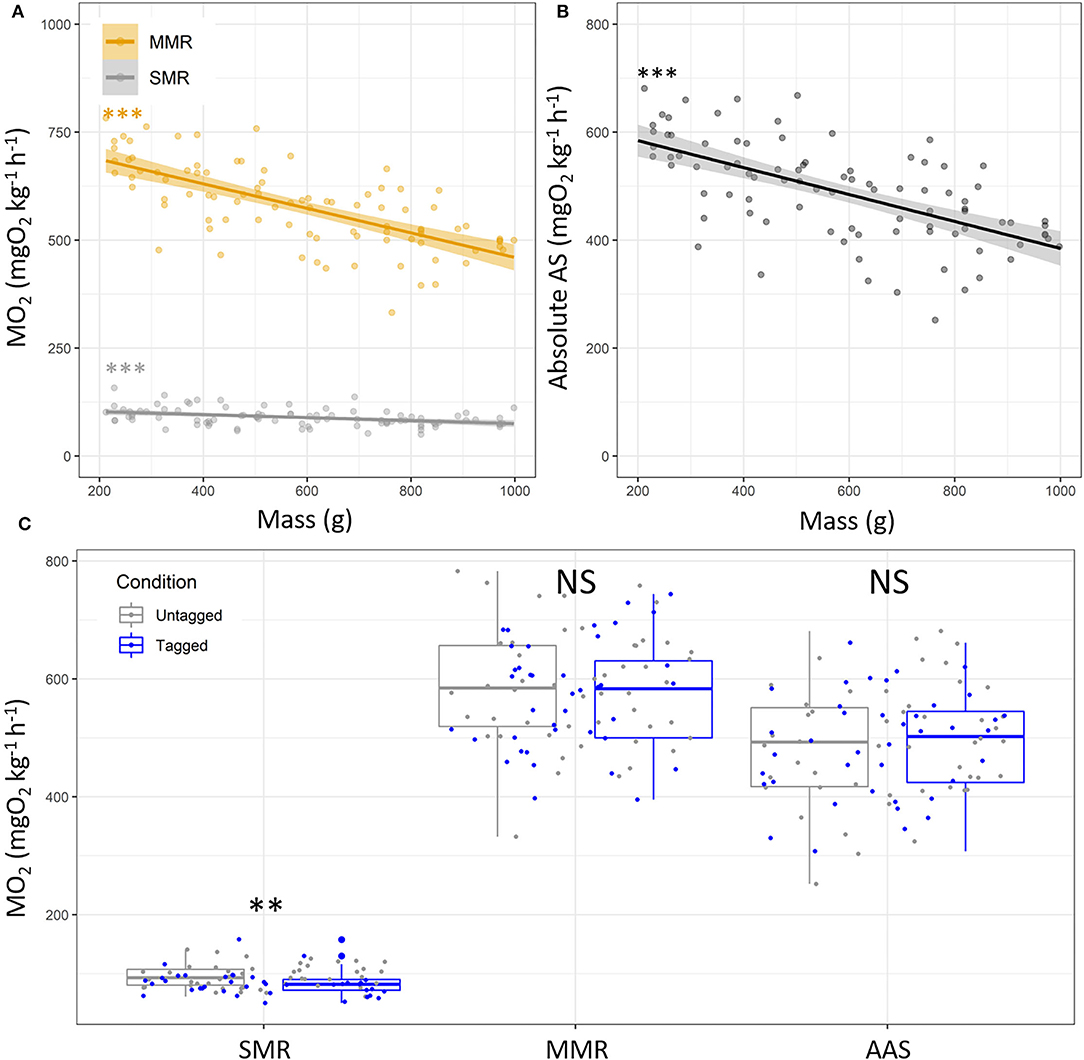
Figure 3. Metabolic traits depending on fish mass in European sea bass (Dicentrarchus labrax; n = 90). (A) Standard and maximum metabolic rates (SMR, gray dots and MMR, orange dots), and (B) absolute aerobic scope (AAS; MO2, mgO2 kg−1 h−1). Each dot represents the metabolic variables of a single fish. For panel (A), the orange line represents linear regression for the MMR values. For panel (B), the line represents linear regression, and the shape around represents the 95% confidence interval for the SMR, MMR and AS. Significance of the linear regressions is indicated in the two panels (A,B) [linear regression: ***: p < 0.001/not significant (NS)]. (C) Metabolic variables (SMR, MMR) and absolute AS for untagged (n = 50, gray) and tagged (n = 40, blue) European sea bass. For panel (C), the significant differences are indicated for SMR, MMR, and AS depending on tagging condition [t-test: **: p < 0.01/not significant (NS)].
The estimated Uopt and COTmin by the models were 1.94 ± 0.33 km h−1 and 113.91 ± 17.54 mgO2 kg−1 km−1 in sea bass (Figure 4A; refer to Supplementary Table S4 for statistics details). The Uopt was not affected by the fish mass (Supplementary Table S4; p > 0.05), whereas the COTmin decreased with the increase in fish mass (Figure 4B; y = 141.45–0.05x; p < 0.001; R2 = 0.38). Both the Uopt and COTmin were lower in tagged fish than untagged ones (Figures 4C,D; p < 0.01 for both), i.e., 1.82 ± 0.33 vs. 2.03 ± 0.30 km h−1 and 107.39 ± 16.20 vs. 119.11 ± 16.97 mgO2 kg−1 km−1, respectively, for Uopt and COTmin.
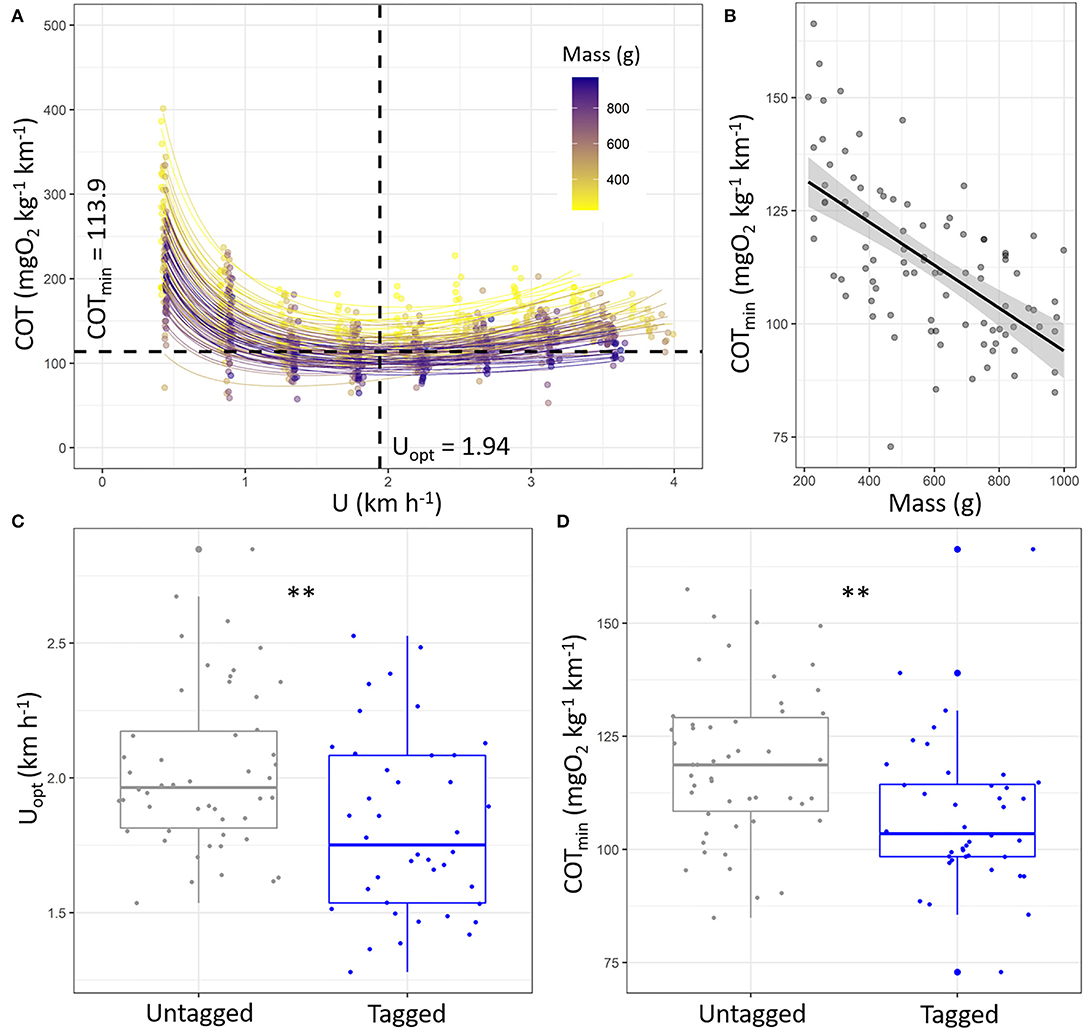
Figure 4. (A) Cost of transport (COT, mgO2 kg−1 km−1) as a function of speed (km h−1) during the Ucrit trial of European sea bass (Dicentrarchus labrax; n = 90) and associated fits for each fish (refer to Supplementary Table S4 for details). Average values of Uopt and COTmin were added to the figure. (B) Estimated COTmin (mgO2 kg−1 km−1) as function of fish mass (g). The line represents linear regression, and the shape around represents the 95% confidence interval of the linear regression (p < 0.05). Boxplot of the (C) Uopt (km h−1) and (D) COTmin (mgO2 kg−1 km−1) for untagged fish (n = 50, gray) and tagged fish (n = 40, blue). The significant differences are indicated for Uopt and COTmin and depending on tagging condition (t-test: **: p < 0.01).
Mapping Fish Acceleration Measured by tag With the MO2
During the Ucrit trial, the swimming activity recorded by tag increased with the increase of swimming speed following an exponential pattern for all challenged fish (p < 0.05 for all fish; Figure 5; refer to Supplementary Table S5 for statistics details). The swimming activity pattern recorded by tag resulted to be not different depending on the fish mass, since both parameters of the models (α and β) did not significantly change as the function of the fish mass (ANOVA, p > 0.05 for both parameters; Supplementary Table S5).
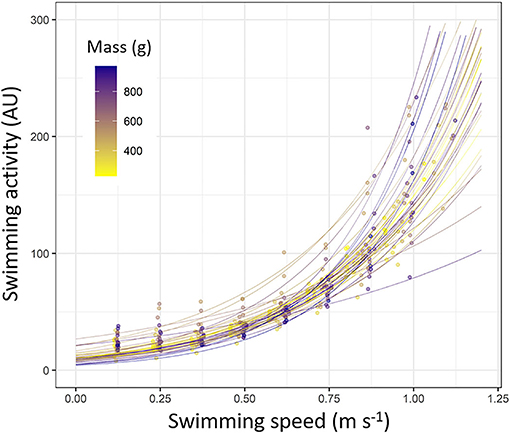
Figure 5. Swimming activity (arbitrary unit, AU) measured by accelerometers tags depending on the swimming speed during Ucrit trial (m s–1) in European sea bass (Dicentrarchus labrax; n = 40). Each line represents a fish based on exponential model (y = α * eβ*x; statistics details about α and β for each fish are shown in Supplementary Table S5). Each dot represents a value obtained during Ucrit trial. Dots and line color are referring to the fish mass (from 200 to 1,000 g; from yellow to dark blue).
Particularly, the MO2 has been fitted using the sigmoid model (Table 2; R2 = 0.88). In this model, the Asym parameter was replaced by the linear equation accounting for fish mass (refer to the section “statistical analyses” for details). According to the two modeling steps (Table 2), the MO2 can be estimated as follows:
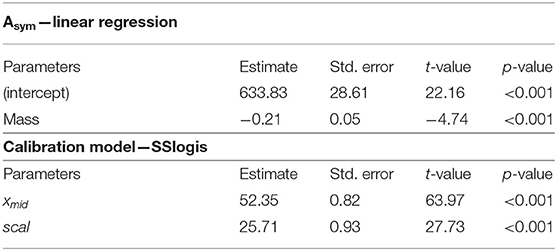
Table 2. Outputs of the significant linear regression for the Asym parameter (p < 0.001; R2 = 0.36), and for the model mapping the MO2 depending on swimming activity measured by tag (SSlogis, p < 0.001; R2 = 0.88) in European sea bass (Dicentrarchus labrax; n = 40).
where x1 is the swimming activity measured by tag and x2 is the fish mass (g). xmid and scal were 52.3 ± 0.8 and 25.7 ± 0.9, respectively (Table 2).
Looking at the model predictions, for low acceleration values displayed by tag, the MO2 increases in all fish but the increase is faster in smaller sea bass than in larger ones. The MO2 asymptote (Asym) is reached sooner by larger fish than for smaller ones, i.e., the plateau phase of the MO2 is lower for larger fish than for smaller ones (Figure 6).
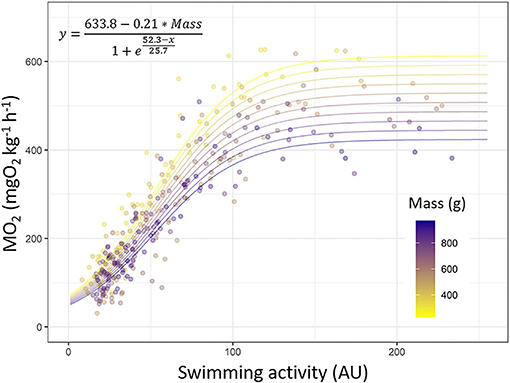
Figure 6. Mapping the MO2 values (mgO2 kg−1 h−1) with the swimming activity (arbitrary unit, AU) measured by tag in European sea bass (Dicentrarchus labrax; n = 40). Prediction of the model [y = (633.8–0.21 * Mass)/(1 + exp((52.3–x)/25.7)); R2 = 0.88] was used to plot the different lines. Each dot indicates a value obtained during Ucrit trial. Dots and line color are referring to fish mass (from 200 to 1,000 g; from yellow to dark blue).
Discussion
Here, we measured the swimming performance and estimated the metabolic traits and swimming efficiency of European sea bass, which is a key species for the European marine aquaculture (Vandeputte et al., 2019), and we then evaluated the possible effects of accelerometer tag implantation on these parameters. Finally, we correlated the acceleration values recorded by the tag with MO2, to be later used as a proxy of energy expenditure in free-swimming sea bass in response to the environments, including in aquaculture environments (Alfonso et al., 2021b).
In this study, the absolute Ucrit values ranged from 0.86 to 1.26 m s−1 and relative Ucrit values ranged from 2.06 to 4.19 BL s−1 and were consistent with values reported in the literature European for sea bass (Chatelier et al., 2006; Claireaux et al., 2006; Zupa et al., 2015; Carbonara et al., 2021). The absolute Ucrit values did not vary according to fish mass contrary to what is expected, but the relative Ucrit values decreased with the increase of fish mass, as already reported for this species (Zupa et al., 2015), and following overall classic pattern in fishes. Strong currents are known to affect the schooling structure, fish behavior, swimming speed, and so the energy expenditure (Oppedal et al., 2011; Hvas et al., 2021). Therefore, measuring Ucrit and understanding the swimming capability in key aquaculture species are of primary importance to make a correct farming site selection while avoiding stress and/or high energetic costs due to high currents exposure (Oppedal et al., 2011; Remen et al., 2016; McKenzie et al., 2021). In addition, the implantation of the accelerometer tag in the fish body cavity has been found not to trigger any significant disruption of the swimming performance, suggesting low invasiveness for tag implantation, as previously shown in various studies (Alfonso et al., 2020, 2021a; Arechavala-Lopez et al., 2021; Føre et al., 2021), and so, the trust that the measures carried out in implanted fish can be expected to be similar to fish without, as long as a few conditions are met (Jepsen et al., 2005, 2011; Macaulay et al., 2021). In conclusion, the tagged fish can be considered as highly representative of the entire monitored fish population (i.e., both tagged and untagged) (Alfonso et al., 2020). This is of particular interest when using tagged sentinel fish for health or welfare monitoring of the whole population under aquaculture conditions (e.g., Føre et al., 2017; Alfonso et al., 2021b).
The MO2 of European sea bass during the Ucrit test has been previously modeled depending on swimming speed using an exponential model (Claireaux et al., 2006). Overall, the estimated SMR, MMR, and absolute AS values by the models were 89.77 ± 20.35, 579.21 ± 94.89, and 489.44 ± 92.37 mgO2 kg−1 h−1, respectively, with higher variability for the estimations of MMR and the absolute AS than SMR. The estimations carried out by the models are in the range of what can be expected for this species (Chatelier et al., 2006; Claireaux et al., 2006; Zupa et al., 2015). For similar temperature (18 ± 1°C), in the study of Zupa et al. (2015), we estimated SMR at 166 mgO2 kg−1 h−1, MMR at 599 mgO2 kg−1 h−1, resulting in an absolute AS of 483 mgO2 kg−1 h−1 for sea bass of ~260 g, whereas higher values were found for sea bass of ~420 g with SMR estimated at 163, MMR at 827 mgO2 kg−1 h−1 and resulting absolute AS at 664 mgO2 kg−1 h−1. Whereas Claireaux et al. (2006) estimated SMR at 92 mgO2 kg−1 h−1, MMR at 338 mgO2 kg−1 h−1, resulting in absolute AS of 246 mgO2 kg−1 h−1 for sea bass of ~150 g, for sea bass (~200 g) at 20°C. Chatelier et al. (2006) estimated SMR at 86, MMR at 509 mgO2 kg−1 h−1, resulting in absolute AS of 423 mgO2 kg−1 h−1. Even if SMR, MMR, and absolute AS values are in the expected range, SMR and AS are higher than those estimated by Chatelier et al. (2006) and Claireaux et al. (2006). Besides the size and/or temperature effects on metabolic variables, high variability of SMR and MMR values between individuals is generally observed (Burton et al., 2011; Norin and Clark, 2016), with higher variations observed for MMR. The observed variability may be mainly explained by the differences in experimental protocol to estimate metabolic traits (e.g., difference in the duration of time intervals of the trial, difference in the velocity increase between two velocity step intervals) (Chabot et al., 2016b; Norin and Clark, 2016). In this work, both SMR and MMR measured decreased with the increase of fish mass, resulting in lower absolute AS in larger sea bass. Therefore, smaller sea bass, overall having a higher absolute AS than larger ones, have a greater oxygen amount to be used for routine activities, to invest in biological processes or for stress coping. The SMR was found to be slightly lower in tagged sea bass than in untagged ones (82.79 ± 20.06 vs. 95.35 ± 18.98 mgO2 kg−1 h−1), whereas both MMR and absolute AS were similar between untagged and tagged sea bass. This may appear a bit confusing but it could be explained by some stresses induced by handling and introduction in the swimming chamber for untagged sea bass, which translated into a slightly higher SMR; sea bass being highly stress responding fish (Fanouraki et al., 2011; Alfonso et al., 2019). On the contrary, this stress would not be perceived for tagged individuals which were already handled and implanted with tag 5 days before the swimming trial, reducing stress for further handling. Indeed, repeated exposures to the same stressor can desensitize fish and attenuate the neuroendocrine and metabolic responses to subsequent exposure to stressors (Reid et al., 1998; Barton, 2002). For instance, Barton et al. (1986) found in rainbow trout stressed several times that cortisol response was lower than the one measured in unstressed fish, indicating possible desensitization of the hypothalamic–pituitary–interrenal (HPI) axis to repeated disturbances. Further studies have investigated SMR values for tagged fish (vs. untagged) more days later tagging to validate this hypothesis. This may be also tested by handling untagged fish in a similar way than tagged ones although not tagging them. Nevertheless, the results of the study overall indicate that tagging did not induce particular stress to the species that could impact the MMR and reduce the AS, as already suggested by a previous study using other variables (e.g., growth performance, cortisol levels) (Jepsen et al., 2011; Wright et al., 2014; Alfonso et al., 2020).
In this study, the Uopt and COTmin estimated for sea bass were on average 1.94 ± 0.33 km h−1 and 113.91 ± 17.54 mgO2 kg−1 h−1. Overall, these values are consistent with the literature concerning this species, ranged from 2.08 to 2.48 km h−1 for Uopt and ~85–200 mgO2 kg−1 km−1 for COTmin at 18°C (Claireaux et al., 2006; Zupa et al., 2015). The Uopt was not affected by the fish mass, as already observed, whereas the COTmin decreased with the increase of fish mass despite what was observed for sea bass ranging from 200 to 450 g (Zupa et al., 2015). In this study, we investigated the relation between COTmin and mass for sea bass ranging from 212 to 998 g with greater sampling size (i.e., n = 90 vs. n = 20), overall providing stronger results regarding that relationship in sea bass, which is also consistent with the literature in fishes (e.g., Oldham et al., 2019; Palstra et al., 2020). In addition, we found that the Uopt and COTmin were lower in tagged fish than untagged ones. Lower Uopt and COTmin for tagged sea bass have been already observed by other authors (Wright et al., 2014). It was probably due to the fact that fish in that study were challenged prior to and after the tag implantation, and thus, that fish were more acclimated to the swimming chamber (Wright et al., 2014). It was not the case in our experiment, but like for the observations of lower SMR in tagged fish, we would suggest that these results may be explained by a slight greater stress state following handling for untagged fish, less experienced in handling than tagged ones recently before the Ucrit test and by desensitization of the HPI-axis with a consequent lower hormonal, metabolic, and energy response (Barton, 2002). Nevertheless, as explained before, this hypothesis needs to be tested before being fully validated. Altogether, these results are supporting the use of accelerometer sensors in free-swimming sea bass, as a proxy of energy expenditure in response to aquaculture environments and practices.
Finally, for mapping the acceleration measured by tag with the MO2 and mass of sea bass, we applied a sigmoid function which gives a very good fit with the data; this function accounts the initial exponential pattern of MO2 and then the slowdowns near Ucrit, as well as the effects of mass. The asymptote of this model is reached after for smaller fish (i.e., with greater MO2 values) than for larger ones, being consistent with size-related metabolic traits (Robinson et al., 1983). Further calibrations could also take into account for another parameter, such as temperature, to improve the accuracy of the MO2 estimations (Wilson et al., 2013) or could be retrieved from the literature (Claireaux et al., 2006; Wright et al., 2014). The slowing down of the increase in MO2 near Ucrit corresponds to the attainment of the MMR, and the fuel for sustaining swimming is provided by anaerobic metabolism through burst swimming or at high intensity (Mckenzie, 2011). This has been previously observed for sea bass using electromyogram analysis in red and white muscles (Lembo et al., 2007; Zupa et al., 2015), with the progressive start of aerobic metabolism located at ~65 % of the Ucrit (i.e., 0.69 m s−1). In addition, Claireaux et al. (2006) estimated the Umax at ~0.9 m s−1, defined as the start of using the anaerobic metabolism by starting to display a burst swimming mode, and the MO2 is usually leveled off or decreased slightly. Based on these three works, that corresponds to accelerometer values of ~70–125 AU (refer to Figure 5) and corresponds to the attainment of the asymptote of the MO2 value (refer to Figure 6). Therefore, according to these studies, we suggest that the high swimming activity values recorded by tags (>70 AU) are also informing about the progressive contribution of anaerobic metabolism to sustain swimming. This needs to be acknowledged when using acceleration recorded by tag as a proxy of energetic costs, in addition to anerobic ones.
In conclusion, this study provides insights regarding swimming performance, swimming efficiency, and aerobic metabolism for a wide range of sizes (from 212 to 998 g) in tagged and untagged sea bass. In addition, we found that the implantation of an accelerometer tag does not induce particular swimming disruption, or stress triggering an increase in the oxygen consumption rate during swimming (5 days after the implantation), supporting the use of such sensors for remotely health or welfare monitoring in aquaculture. Finally, mapping the acceleration recorded by tag with the MO2 brings valuable insights about energetic costs, which can be used in free-swimming fish to assess the fish response to environmental variations and/or aquaculture practices.
Data Availability Statement
The datasets generated during and/or analyzed during the current study are available from the corresponding author on reasonable request. Requests to access the datasets should be directed to SA, salfonso@coispa.eu.
Ethics Statement
The animal study was reviewed and approved by Italian Health Ministry (protocol 838/2019-PR approved on 17 December 2019).
Author Contributions
MS, GL, and PC contributed to conceptualization, funding acquisition, and project administration. SA, WZ, MS, GL, and PC contributed to methodology, writing, reviewing, and editing the manuscript. SA and WZ contributed to formal analysis and data curation. MS and GL contributed to resources. SA contributed to writing the original draft. All authors contributed to the article and approved the submitted version.
Funding
This study was funded by the H2020 FutureEUAqua project (grant agreement number 817737).
Conflict of Interest
The authors declare that the research was conducted in the absence of any commercial or financial relationships that could be construed as a potential conflict of interest.
Publisher's Note
All claims expressed in this article are solely those of the authors and do not necessarily represent those of their affiliated organizations, or those of the publisher, the editors and the reviewers. Any product that may be evaluated in this article, or claim that may be made by its manufacturer, is not guaranteed or endorsed by the publisher.
Acknowledgments
The authors are grateful to Émilie Levavasseur (levavasseur@laposte.net) for kindly drawing the European sea bass in Figure 1. The authors also thank two reviewers for providing us with relevant comments and suggestions to improve the previous version of the manuscript.
Supplementary Material
The Supplementary Material for this article can be found online at: https://www.frontiersin.org/articles/10.3389/fanim.2022.885850/full#supplementary-material
References
Alfonso, S., Sadoul, B., Gesto, M., Joassard, L., Chatain, B., Geffroy, B., et al. (2019). Coping styles in European sea bass: the link between boldness, stress response and neurogenesis. Physiol. Behav. 207, 76–85. doi: 10.1016/j.physbeh.2019.04.020
Alfonso, S., Zupa, W., Manfrin, A., Fiocchi, E., Dioguardi, M., Dara, M., et al. (2020). Surgical implantation of electronic tags does not induce medium - term effect : insights from growth and stress physiological profile in two marine fish species. Anim. Biotelemetry 8, 21. doi: 10.1186/s40317-020-00208-w
Alfonso, S., Zupa, W., Spedicato, M. T., Lembo, G., and Carbonara, P. (2021a). Mapping the energetic costs of free-swimming Gilthead Sea marine aquaculture. Biology (Basel). 10, 1357. doi: 10.3390/biology10121357
Alfonso, S., Zupa, W., Spedicato, M. T., Lembo, G., and Carbonara, P. (2021b). ” Use of telemetry sensors as a tool for health/welfare monitoring of European sea bass (Dicentrarchus labrax) in aquaculture,” in 2021 International Workshop on Metrology for the Sea; Learning to Measure Sea Health Parameters (MetroSea) (Reggio Calabria), 262–267. doi: 10.1109/MetroSea52177.2021.9611579
Arechavala-Lopez, P., Lankheet, M. J., Díaz-gil, C., and Abbink, W. (2021). Swimming activity of Gilthead Seabream (Sparus aurata) in swim-tunnels : accelerations , oxygen consumption and body motion. Front. Anim. Sci. 2, 1–14. doi: 10.3389/fanim.2021.679848
Ashley, P. J. (2007). Fish welfare: current issues in aquaculture. Appl. Anim. Behav. Sci. 104, 199–235. doi: 10.1016/j.applanim.2006.09.001
Barton, B., Schreck, C., and Barton, L. (1986). Effects of chronic cortisol administration and daily acute stress on growth, physiological conditions, and stress responses in juvenile rainbow trout. Dis. Aquat. Organ. 2, 173–185. doi: 10.3354/dao002173
Barton, B. A. (2002). Stress in fishes: a diversity of responses with particular reference to changes in circulating corticosteroids. Integr. Comp. Biol. 42, 517–525. doi: 10.1093/icb/42.3.517
Brett, J. R. (1964). The respiratory metabolism and swimming performance of young sockeye salmon. J. Fish. Res. Board Canada 21, 1183–1226. doi: 10.1139/f64-103
Brett, J. R. (1972). The metabolic demand for oxygen in fish, particularly salmonids, and a comparison with other vertebrates. Respir. Physiol. 14, 151–170. doi: 10.1016/0034-5687(72)90025-4
Brijs, J., Føre, M., Gräns, A., Clark, T. D., Axelsson, M., and Johansen, J. L. (2021). Bio-sensing technologies in aquaculture: how remote monitoring can bring us closer to our farm animals. Philos. Trans. R. Soc. B 376, 20200218. doi: 10.1098/rstb.2020.0218
Brijs, J., Sandblom, E., Axelsson, M., Sundell, K., Sundh, H., Kiessling, A., et al. (2019). Remote physiological monitoring provides unique insights on the cardiovascular performance and stress responses of freely swimming rainbow trout in aquaculture. Sci. Rep. 9, 1–12. doi: 10.1038/s41598-019-45657-3
Brownscombe, J. W., Lennox, R. J., Danylchuk, A. J., and Cooke, S. J. (2018). Estimating fish swimming metrics and metabolic rates with accelerometers: the influence of sampling frequency. J Fish Biol 93, 207–214. doi: 10.1111/jfb.13652
Burton, T., Killen, S. S., Armstrong, J. D., and Metcalfe, N. B. (2011). What causes intraspecific variation in resting metabolic rate and what are its ecological consequences? Proc. R. Soc. B Biol. Sci. 278, 3465–3473. doi: 10.1098/rspb.2011.1778
Carbonara, P., Alfonso, S., Dioguardi, M., Zupa, W., Vazzana, M., Dara, M., et al. (2021). Calibrating accelerometer data, as a promising tool for health and welfare monitoring in aquaculture: case study in European sea bass (Dicentrarchus labrax) in conventional or organic aquaculture. Aquac. Reports 21, 4–13. doi: 10.1016/j.aqrep.2021.100817
Carbonara, P., Alfonso, S., Gai, F., Gasco, L., Palmegiano, G., Spedicato, M. T., et al. (2020a). Moderate stocking density does not influence the behavioural and physiological responses of rainbow trout (Oncorhynchus mykiss) in organic aquaculture. Aquac. Res. 51, 3007–3016. doi: 10.1111/are.14640
Carbonara, P., Alfonso, S., Zupa, W., Manfrin, A., Fiocchi, E., Pretto, T., et al. (2019). Behavioral and physiological responses to stocking density in sea bream (Sparus aurata): Do coping styles matter? Physiol. Behav. 212, 112698. doi: 10.1016/j.physbeh.2019.112698
Carbonara, P., Corsi, I., Focardi, S., Lembo, G., Rochira, S., Scolamacchia, M., et al. (2010). The effects of stress induced by cortisol administration on the repeatability of swimming performance tests in the European sea bass (Dicentrarchus labrax L.). Mar. Freshw. Behav. Physiol. 43, 283–296. doi: 10.1080/10236244.2010.504046
Carbonara, P., Zupa, W., Bitetto, I., Alfonso, S., Dara, M., and Cammarata, M. (2020b). Evaluation of the effects of the enriched-organic diets composition on European Sea Bass Welfare through a multi-parametric approach. J. Mar. Sci. Eng. 8, 934. doi: 10.3390/jmse8110934
Chabot, D., McKenzie, D. J., and Craig, J. F. (2016a). Metabolic rate in fishes: definitions, methods and significance for conservation physiology. J. Fish Biol. 88, 1–9. doi: 10.1111/jfb.12873
Chabot, D., Steffensen, J. F., and Farrell, A. P. (2016b). The determination of standard metabolic rate in fishes. J. Fish Biol. 88, 81–121. doi: 10.1111/jfb.12845
Chatelier, a, McKenzie, D. J., Prinet, A., Galois, R., Robin, J., Zambonino, J., et al. (2006). Associations between tissue fatty acid composition and physiological traits of performance and metabolism in the seabass (Dicentrarchus labrax). J. Exp. Biol. 209, 3429–3439. doi: 10.1242/jeb.02347
Claireaux, G., Couturier, C., and Groison, A.-L. (2006). Effect of temperature on maximum swimming speed and cost of transport in juvenile European sea bass (Dicentrarchus labrax). J. Exp. Biol. 209, 3420–3428. doi: 10.1242/jeb.02346
European Food Safety Authority (2009). General approach to fish welfare and to the concept of sentience in fish - Scientific Opinion of the Panel on Animal Health and Welfare. EFSA J. 7, 1–27. doi: 10.2903/j.efsa.2009.954
Fanouraki, E., Mylonas, C. C., Papandroulakis, N., and Pavlidis, M. (2011). Species specificity in the magnitude and duration of the acute stress response in Mediterranean marine fish in culture. Gen. Comp. Endocrinol. 173, 313–322. doi: 10.1016/j.ygcen.2011.06.004
Føre, M., Frank, K., Dempster, T., Alfredsen, J. A., and Høy, E. (2017). Biomonitoring using tagged sentinel fish and acoustic telemetry in commercial salmon aquaculture: a feasibility study. Aquac. Eng. 78, 163–172. doi: 10.1016/j.aquaeng.2017.07.004
Føre, M., Frank, K., Norton, T., Svendsen, E., Alfredsen, J. A., Dempster, T., et al. (2018). Precision fish farming: a new framework to improve production in aquaculture. Biosyst. Eng. 173, 176–193. doi: 10.1016/j.biosystemseng.2017.10.014
Føre, M., Svendsen, E., Økland, F., Gräns, A., Alfredsen, J. A., Finstad, B., et al. (2021). Heart rate and swimming activity as indicators of post-surgical recovery time of Atlantic salmon (Salmo salar). Anim. Biotelemetry 9, 1–13. doi: 10.1186/s40317-020-00226-8
Fry, F. E. J. (1947). Effects of the environment on animal activity. Publ. Ontario Fish. Res. Lab. 68, 1–62.
Gesto, M., Zupa, W., Alfonso, S., Spedicato, M. T., Lembo, G., and Carbonara, P. (2020). Using acoustic telemetry to assess behavioral responses to acute hypoxia and ammonia exposure in farmed rainbow trout of different competitive ability. Appl. Anim. Behav. Sci. 230, 105084. doi: 10.1016/j.applanim.2020.105084
Halachmi, I., Guarino, M., Bewley, J., and Pastell, M. (2019). Smart animal agriculture: application of real-time sensors to improve animal well-being and production. Annu. Rev. Anim. Biosci. 7, 403–425. doi: 10.1146/annurev-animal-020518-114851
Halsey, L. G., Killen, S. S., Clark, T. D., and Norin, T. (2018). Exploring key issues of aerobic scope interpretation in ectotherms: absolute versus factorial. Rev. Fish Biol. Fish. 28, 405–415. doi: 10.1007/s11160-018-9516-3
Hvas, M., Folkedal, O., and Oppedal, F. (2021). Fish welfare in offshore salmon aquaculture. Rev. Aquac. 13, 836–852. doi: 10.1111/raq.12501
Jepsen, N., Davis, L. E., Schreck, C. B., and Siddens, B. (2011). The physiological response of chinook salmon smolts to two methods of radio-tagging. Trans. Am. Fish. Soc. 130, 495–500. doi: 10.1577/1548-8659(2001)130<0495:TPROCS>2.0.CO;2
Jepsen, N., Schreck, C., Clements, S., and Thorstad, E. B. (2005). “A brief discussion on the 2% tag/bodymass rule of thumb,” in Aquatic Telemetry: Advances and Applications. Proceedings of the Fifth Conference on Fish Telemetry held in Europe (Rome).
Kline, R. J., Parkyn, D. C., and Murie, D. J. (2015). empirical modelling of solid-blocking effect in a Blazka respirometer for gag, a large demersal reef fish. Adv. Zool. Bot. 3, 193–202. doi: 10.13189/azb.2015.030501
Lembo, G., Carbonara, P., Scolamacchia, M., Spedicato, M. T., and McKinley, R. S. (2007). Use of muscle activity indices as a relative measure of well-being in cultured sea bass Dicentrarchus labrax(Linnaeus, 1758). Hydrobiologia 582, 271–280. doi: 10.1007/s10750-006-0538-9
Macaulay, G., Warren-Myers, F., Barrett, L., Oppedal, F., Føre, M., and Dempster, T. (2021). Tag use to monitor fish behaviour in aquaculture: a review of benefits, problems and solutions. Rev. Aquac. 15, 1565–1582. doi: 10.1111/raq.12534
Martos-Sitcha, J. A., Simó-Mirabet, P., Piazzon, M. C., de las Heras, V., Calduch-Giner, J. A., Puyalto, M., et al. (2018). Dietary sodium heptanoate helps to improve feed efficiency, growth hormone status and swimming performance in gilthead sea bream (Sparus aurata). Aquac. Nutr. 24, 1638–1651. doi: 10.1111/anu.12799
McFarlane, W. J., Cubitt, K. F., Williams, H., Rowsell, D., Moccia, R., Gosine, R., et al. (2004). Can feeding status and stress level be assessed by analyzing patterns of muscle activity in free swimming rainbow trout (Oncorhynchus mykiss Walbaum)? Aquaculture 239, 467–484. doi: 10.1016/j.aquaculture.2004.05.039
McKenzie, D. J., Axelsson, M., Chabot, D., Claireaux, G., Cooke, S. J., Corner, R. A., et al. (2016). Conservation physiology of marine fishes: state of the art and prospects for policy. Conserv. Physiol. 4, cow046. doi: 10.1093/conphys/cow046
McKenzie, D. J., Palstra, A. P., Planas, J., MacKenzie, S., Bégout, M. L., Thorarensen, H., et al. (2021). Aerobic swimming in intensive finfish aquaculture: applications for production, mitigation and selection. Rev. Aquac. 13, 138–155. doi: 10.1111/raq.12467
Muñoz, L., Aspillaga, E., Palmer, M., Saraiva, J. L., and Arechavala-Lopez, P. (2020). Acoustic telemetry: a tool to monitor fish swimming behavior in sea-cage aquaculture. Front. Mar. Sci. 7, 645. doi: 10.3389/fmars.2020.00645
Norin, T., and Clark, T. D. (2016). Measurement and relevance of maximum metabolic rate in fishes. J. Fish Biol. 88, 122–151. doi: 10.1111/jfb.12796
Oldham, T., Nowak, B., Hvas, M., and Oppedal, F. (2019). Metabolic and functional impacts of hypoxia vary with size in Atlantic salmon. Comp. Biochem. Physiol. -Part A Mol. Integr. Physiol. 231, 30–38. doi: 10.1016/j.cbpa.2019.01.012
Oppedal, F., Dempster, T., and Stien, L. H. (2011). Environmental drivers of Atlantic salmon behaviour in sea-cages: a review. Aquaculture 311, 1–18. doi: 10.1016/j.aquaculture.2010.11.020
Palstra, A. P., Kals, J., Böhm, T., Bastiaansen, J. W. M., and Komen, H. (2020). Swimming performance and oxygen consumption as non-lethal indicators of production traits in atlantic salmon and gilthead seabream. Front. Physiol. 11, 759. doi: 10.3389/fphys.2020.00759
R Core Team (2021). R: A Language and Environment for Statistical Computing. Vienna: R Foundation for Statistical Computing. Available at: https://www.r-project.org (accessed May 02, 2022).
Reid, S. G., Bernier, N. J., and Perry, S. F. (1998). The adrenergic stress response in fish: control of catecholamine storage and release. Comp. Biochem. Physiol. C Pharmacol. Toxicol. Endocrinol. 120, 1–27. doi: 10.1016/S0742-8413(98)00037-1
Remen, M., Solstorm, F., Bui, S., Klebert, P., Vågseth, T., Solstorm, D., et al. (2016). Critical swimming speed in groups of Atlantic salmon Salmo salar. Aquac. Environ. Interact. 8, 659–664. doi: 10.3354/aei00207
Robinson, W. R., Peters, R. H., and Zimmermann, J. (1983). The effects of body size and temperature on metabolic rate of organisms. Can. J. Zool. 61, 281–288. doi: 10.1139/z83-037
Rosell-Moll, E., Piazzon, M. C., Sosa, J., Ferrer, M., Cabruja, E., Vega, A., et al. (2021). Use of accelerometer technology for individual tracking of activity patterns, metabolic rates and welfare in farmed gilthead sea bream (Sparus aurata) facing a wide range of stressors. Aquaculture 539, 736609. doi: 10.1016/j.aquaculture.2021.736609
Rubio-Gracia, F., García-Berthou, E., Guasch, H., Zamora, L., and Vila-Gispert, A. (2020). Size-related effects and the influence of metabolic traits and morphology on swimming performance in fish. Curr. Zool. 66, 493–503. doi: 10.1093/cz/zoaa013
Smit, H., Amelink-Koutstaal, J. M., Vijverberg, J., and Von Vaupel-Klein, J. C. (1971). Oxygen consumption and efficiency of swimming goldfish. Comp. Biochem. Physiol. – Part A Physiol. 39, 1–28. doi: 10.1016/0300-9629(71)90343-4
Vandeputte, M., Gagnaire, P. -A., and Allal, F. (2019). The European sea bass: a key marine fish model in the wild and in aquaculture. Anim. Genet. 50, 195–206. doi: 10.1111/age.12779
Wilson, S. M., Hinch, S. G., Eliason, E. J., Farrell, A. P., and Cooke, S. J. (2013). Calibrating acoustic acceleration transmitters for estimating energy use by wild adult Pacific salmon. Comp. Biochem. Physiol. A Mol. Integr. Physiol. 164, 491–498. doi: 10.1016/j.cbpa.2012.12.002
Wright, S., Metcalfe, J. D., Hetherington, S., and Wilson, R. (2014). Estimating activity-specific energy expenditure in a teleost fish, using accelerometer loggers. Mar. Ecol. Prog. Ser. 496, 19–32. doi: 10.3354/meps10528
Zupa, W., Alfonso, S., Gai, F., Gasco, L., Spedicato, M. T., Lembo, G., et al. (2021). Calibrating accelerometer tags with oxygen consumption rate of rainbow trout (Oncorhynchus mykiss) and their use in aquaculture facility : a case study. Animals 11, 1496. doi: 10.3390/ani11061496
Keywords: acoustic telemetry, MO2, welfare, energy expenditure, aquaculture, sea bass (Dicentrarchus labrax) L
Citation: Alfonso S, Zupa W, Spedicato MT, Lembo G and Carbonara P (2022) Using Telemetry Sensors Mapping the Energetic Costs in European Sea Bass (Dicentrarchus labrax), as a Tool for Welfare Remote Monitoring in Aquaculture. Front. Anim. Sci. 3:885850. doi: 10.3389/fanim.2022.885850
Received: 28 February 2022; Accepted: 13 April 2022;
Published: 13 May 2022.
Edited by:
Rafael Freire, Charles Sturt University, AustraliaReviewed by:
Kilian Toledo-Guedes, University of Alicante, SpainAna Roque, Institute of Agrifood Research and Technology (IRTA), Spain
Copyright © 2022 Alfonso, Zupa, Spedicato, Lembo and Carbonara. This is an open-access article distributed under the terms of the Creative Commons Attribution License (CC BY). The use, distribution or reproduction in other forums is permitted, provided the original author(s) and the copyright owner(s) are credited and that the original publication in this journal is cited, in accordance with accepted academic practice. No use, distribution or reproduction is permitted which does not comply with these terms.
*Correspondence: Sébastien Alfonso, salfonso@coispa.eu