Consumers attitudes toward animal welfare friendly produce: An island of Ireland study
 John J. Hyland
 Áine Regan
 Sharon Sweeney1
  Moira Dean
- 1Department of Agri-Food Business and Spatial Analysis, Rural Economy Development Programme, Teagasc, Mellows Campus, Athenry, Ireland
- 2Faculty of Medicine, Health and Life Sciences, The Institute for Global Food Security, Queen’s University Belfast, Belfast, United Kingdom
Public concern has arisen between increased productivity in animal production systems and farm animal welfare (FAW). Consumers demand ethical production systems and tend to purchase products that reflect their animal welfare concerns. They are becoming increasingly judicious, with growing expectations around animal produce. Nonetheless, positive attitudes concerning FAW do not always correspond to purchasing behavior, where higher concern is not related to higher purchasing frequency. The study seeks to determine if individuals behave differently in their dual roles as citizens and consumers, expressing preferences for FAW but ultimately failing to act on such preferences when making purchasing decisions. Theoretically, the research uses elements of the COM-B model to investigate the importance of capability, opportunity, and motivation for consumers. The study is conducted on an island of Ireland basis and investigates the perceptions and purchasing frequency of Irish and Northern Irish consumer’s (n = 972). Firstly, attitudes towards purchasing animal welfare products are elicited using Categorical Principal Component Analysis (CATPCA). Cluster analysis subsequently defines three distinct typologies based upon the final cluster centers attained from CATPCA. The largest cluster is characterized as being Indifferent (n = 672) and differentiated by relatively low concern for animal welfare. Despite this, their purchasing frequency of animal welfare products is monthly. The other two clusters, The Engaged and The Struggling, are similar in size and share the same concern for animal welfare but are polarized in their motivation, capability, and opportunity to purchase animal welfare friendly products. The Struggling typology act as citizens rather than consumers; while they are highly concerned for welfare they have significantly lower purchasing frequency even compared to The Indifferent. Finally, Non-Linear Canonical Correlation Analysis (NLCCA) is used to reveal and visually demonstrate the structure of the whole dataset. The analysis demonstrates that concern for animal welfare is not associated with purchase frequency of animal welfare friendly produce when contextual factors are not conducive to doing so. The findings are relevant to a broad audience including industry, policymakers, and academics.
Introduction
Demand for meat products is forecast to remain high amongst developed countries as the global population grows to c.a. 10 billion by 2050 (Henchion et al., 2021). In a historical and continued effort to keep pace with this global demand the meat industry has intensified accordingly and strived for efficiency. However, consumers have increasingly scrutinized production systems and voiced their ethical concerns regarding Farm Animal Welfare (FAW) (European Commission, 2007). Animal welfare is a multifaceted concept that can be grouped into four criteria: feeding, housing, health and optimized emotional states (Botreau et al., 2007). It is thereby defined by the World Organisation for Animal Health (OIE) as “the physical and mental state of an animal in relation to the conditions in which it lives and dies. An animal experiences good welfare if the animal is healthy, comfortable, well nourished, safe, is not suffering from unpleasant states such as pain, fear and distress, and is able to express behaviors that are important for its physical and mental state” (OIE, 2019).
Previous food crises and food scares have damaged the reputation of the agricultural sector where some consumers have lost confidence in the conventional food system (Bánáti, 2011; Agnoli et al., 2016; Barnett et al., 2016). In parallel, Europeans are increasingly concerned about FAW where a significant proportion of consumers believe that welfare standards need to be improved (European Commission, 2007; De Jonge and van Trijp, 2013; European Commission, 2016). To varying extents, FAW concerns are evident for all dominant farm animal species, i.e. cattle, sheep, pigs, and poultry. Nonetheless, the public is predominantly troubled about FAW in large-scale intensive production systems that are characterized by a considerable number of animals per unit area. Considerable concern is often unsurprisingly reserved for pig production systems, broilers, and laying hens (Martelli, 2009; Clark et al., 2016). Positive perceptions towards animals has been shown to be related with higher levels of concern and empathy for animal welfare (Cornish et al., 2016). Public perceptions of animal welfare therefore serve as a central construct within FAW, which could be used to encourage consumption behaviors (European Commission, 2016). Public concern can positively influence demand for specific welfare products; their attitudes consequently should be acknowledged so that practical and appropriate interventions can be designed and enforced (Clark et al., 2016; Cornish et al., 2016; Cornish et al., 2019).
Positive attitudes concerning FAW do not always correspond to purchasing behavior, where higher concern is not related to higher purchasing frequency of animal welfare friendly products (European Commission, 2007; European Commission, 2016). Despite the majority of European consumers favoring higher FAW standards, they face a number of challenges when purchasing welfare friendly products with may lead to attitude-behavior discrepancies. This attitude-behavioral gap explains the divergence between consumers’ attitudes and their actual purchasing behavior (Carrington et al., 2010). There are a multitude of reasons as to why consumer’s behavior does not correspond to their level of concern for FAW, these include: difficulty processing information, abrogation of responsibility to others, affordability, availability etc. (Cornish et al., 2019). The attitude-behavioral gap may also indicate possible discrepancy between a person’s role as a citizen or as a consumer (Aschemann‐Witzel and Niebuhr Aagaard, 2014; Clark et al., 2017). Individuals can hold contrasting perceptions of animal welfare; they may think as citizens influencing societal standards or as consumers at the point of purchase. As citizens, they support animals being entitled to a good life; as consumers, they avoid the cognitive connection with the live animal (De Bakker and Dagevos, 2012). Typically, citizens advance direct action concerning animal welfare through political processes, whereas consumers influence policy as a consequence of their purchasing behavior (Degeling and Johnson, 2015). It also demonstrates why non-consumers are forthright in their perceptions of FAW but look to legislative solutions as necessary for ensuring animal welfare standards (Pejman et al., 2019).
The island of Ireland (IOI) represents an interesting and understudied region with regard to consumers’ attitudes towards FAW. The region is comprised of two countries: Ireland, referred to as the Republic of Ireland (ROI), and Northern Ireland (NI). Both differ institutionally and can thereby diverge in terms of FAW standards, labels, etc. but share substantial similarities with respect to the economic and cultural importance of agriculture. Early research concerning FAW in ROI yielded mixed results. The BSE crisis of the 1990’s led consumers to reveal concerns regarding FAW but mainly in respect to animal feed (Meehan et al., 2002; McCarthy et al., 2003). Relatively recent research demonstrates that the public perceives there not to be enough FAW information available and desire more (Clark et al., 2016; European Commission, 2016). In a 2016 Eurobarometer report ROI consumers stated it was “very important” (80%) or “somewhat important” (17%) to protect the welfare of farm animals (European Commission, 2016). NI data, aggregated within the UK, reported similar results of 78% and 20%, respectively (European Commission, 2016). Previous studies in Ireland has shown that high FAW indicates to consumers that the product is healthier, safer, and of higher quality (Meehan et al., 2002; PwC, 2019). Of most pertinence is a study by Sweeney et al. (2022) who found that consumers from the IOI believed that FAW is generally high but that pig and poultry production is viewed comparatively unfavorably. Unequally distributed consumer concerns about welfare across sectors is not unique to Ireland and has been observed widely in the literature (Clark et al., 2016; Alonso et al., 2020). Sweeney et al. (2022) found, much like earlier Irish studies, that the public display a lack of knowledge and information on the topic of FAW more generally.
Before going further it is important to provide some contextual information regarding IOI consumption patterns and the availability of products that are labelled as welfare friendly. Dairy is the most consumed animal food type in ROI followed by chicken and beef. Conversely, eggs and pork are consumed considerably less (IUNA, 2011). It was not possible to disaggregate NI consumption data from the UK but similarly dairy is the most widely consumed animal source food followed by poultry and beef (Scarborough et al., 2016; Stewart et al., 2021). There are many widely used labels in the ROI and NI market that infer welfare across all product types: e.g. organic labelling; free-range labelling; and quality assurance logos. Assurance scheme labels are used by all sectors. Meanwhile, organic and free-range labels are more likely to be associated with pig, poultry, and egg production as conventional beef and dairy systems are predominately grass-fed and raised outdoors for much of the year. All industries are therefore equally represented with regards to utilizing welfare labels so consumers can make purchasing decisions based on welfare if they are so inclined.
Sweeney et al. (2022) stress that IOI research is needed which investigates possible gaps that exist between citizen views and actual consumer behavior (e.g., purchasing of welfare-related food products). Segmentation of consumers based on their perceptions of FAW is quite common and enables more targeted and tailored interventions (Vecchio and Annunziata, 2012; McFadden et al., 2013; Heise and Theuvsen, 2017; Blanc et al., 2020; Tomasevic et al., 2020; Mesić et al., 2021). This study aims to identify heterogeneous groupings of IOI consumers based on their attitudes towards purchasing animal welfare friendly products. Such analysis may reveal how such attitudes relate to purchasing frequency and demonstrate if there is an evident attitude-behavior gap in an IOI context. The analyses seek to determine if individuals behave differently in their dual roles as citizens and consumers, expressing preferences for FAW but ultimately failing to act on such preferences when making purchasing decisions (Vanhonacker et al., 2007; De Bakker and Dagevos, 2012; Clark et al., 2017). The research therefore aims to further understand consumer’s perception of FAW, particularly shedding light on the attitude-behavior gap (sometimes referred to as the ‘citizen-consumer disconnect’) (Grunert, 2006; Clark et al., 2016).
Methodology
Michie et al. (2011) deduce that for individuals to partake in a behavior (B) they require capability (C), opportunity (O) and motivation (M). The aforementioned elements are conceptualized as the COM-B model; it is a useful framework to provide a contextual diagnosis of what it is that individuals or their environment needs to be altered to achieve behavioral change. The accompanying Behavioural Change Wheel is an especially useful tool to identify appropriate interventions based on a particular COM-B diagnosis (Michie et al., 2011). Participant’s capability, opportunity and motivations were captured in a wide ranging questionnaire and analyzed to identify barriers and challenges associated with animal welfare produce. The elements of COM-B are defined below (Michie et al., 2011; Cornish et al., 2016):
1. Capability reflects an individual’s ability to engage in purchasing animal welfare produce. For example, can they easily identify animal welfare friendly foods? Three questions in the questionnaire relate to capability.
2. Opportunity comprises the factors external to an individual that are required for the behavior to occur. This can either mean physical opportunity, or situational factors, i.e. is there sufficient choice of animal welfare products in food stores. Three questions in the questionnaire relate to opportunity.
3. Motivation encompasses factors internal to an individual that influence behavior. The COM-B model differentiates between two types of motivations: automatic processes such as habit and impulses; and reflective processes such as intention. For instance, participants were asked if they always try to locate animal welfare friendly food (automatic), and if they would rather eat animal welfare friendly food (reflective). Four statements in the questionnaire relate to motivation.
The questionnaire statements regarding capability, opportunity and motivation are used to segment consumers based on their associated attitudes towards purchasing animal welfare produce. Segmenting consumers explicitly on their consumption risks overestimation of consumers not concerned about FAW (Onwezen and van der Weele, 2016). Therefore, consumers were segmented based only on their perceptions of purchasing animal welfare friendly food. Survey results are analyzed statistically upon application of a series of multivariate methods; Categorical Principal Component Analysis (CATPCA), Cluster Analysis, and Nonlinear Canonical Correlation Analysis (NLCCA). CATPCA is implemented to extract principal components from variables depicting attitudes towards purchasing animal welfare friendly products. CATPCA facilitates Cluster Analysis to elicit homogenous groups of respondents based on CATPCA results. Finally, NLCCA is employed to assess more complex associations between all variables in the dataset such as relationships between cluster memberships, purchasing animal welfare product attitudes, demographical variables, etc. All statistical analyses are conducted using SPSS version 27.
Data were collected through an online, cross-sectional survey. The survey was administered online via a market research agency amongst members of their proprietary research panel in ROI and NI during September 2020. Inclusion criteria were set as being aged 18+; being a consumer of meat or dairy; and being at least partially responsible for household grocery shopping (conduct some household shopping but not all). An exclusion criterion was applied for any individual holding the occupation of “farmer”. A quota sampling procedure was used to achieve a sample which was representative of gender, age, region (urban/rural) and social class in each of the two countries. Once a specific quota was filled no further responses were collected from that demographic. Weighting was applied to ensure final data was representative of these quotas to ensure appropriate representation. Data was continuously reviewed as it was captured and answering patterns were monitored e.g. to detect any ‘straight-liners’ to ensure quality standards.
Categorical principal component analysis
As the first objective of the study is to classify consumers based on their explicit attitudes towards purchasing animal welfare friendly foods it was necessary to reduce the number of variables to enable clustering. It is advisable to avoid using too many clustering variables, as it increases the likelihood that the variables are no longer dissimilar (Mooi and Sarstedt, 2011). Every additional variable used in clustering requires an over-proportional increase in observations to ensure valid results (recommended 5*2m or at least 2m; where m = number of variables) (Formann, 1984; Mooi and Sarstedt, 2011). Ten questionnaire items were used explicitly to measure consumer’s attitudes towards purchasing animal welfare friendly foods meaning an ideal sample size of over 5,000 respondents. A factor analysis (CATPCA) was therefore used to reduce the number of variables used for clustering while retaining as much of their meaning as possible.
CATPCA attempts to reduce the dimensionality of a set of categorical variables while accounting for as much of the variation as possible (Kaplan, 2004). The approach has the same objective as traditional PCA, but it is better suited for variables of categorical measurement level that may not be linearly related to each other. CATPCA does not make assumptions concerning the measurement level of the variables and the nature of their relationships, rather it analyses the data at a level specified by the researcher (interval, ordinal, or nominal) (Manisera et al., 2010).
The solution of CATPCA maximizes the correlations of the object scores with each of the quantified variables for the number of components (dimensions) specified (Meulman and Heiser, 2011). When these variables are highly correlated, they are effectively ‘saying the same thing’ and described as components (Field, 2009). The subsequently acquired component loadings are merely the correlations among all individuals’ answers to each of the questionnaire statements with the derived component score. A Varimax rotation was implemented to increase the interpretability of the results (Field, 2009). Cronbach’s alpha was applied to test the reliability and internal consistency of the derived factor loadings (Pallant, 2010). A principal advantage of this orthogonal rotation is that the variables tend to have either high or low loadings on the factors (Abdi, 2004). A varimax rotation thereby enhances the interpretability of results as the objective of CATPCA was to use the factor scores in other analyses to compare the factor structure in groups (Mooi and Sarstedt, 2011).
Cluster analysis
The components scores of perceptual items extracted from the CATPCA were subsequently used as classification criteria to cluster respondents into typologies (Janssens et al., 2008). Two-step cluster analysis and hierarchical cluster analysis were performed on the CATPCA scores to determine the optimal number of clusters (Burns and Burns, 2008). The appropriate number of clusters was determined by taking into consideration clusters which were clearly distinct and meaningful, while also maintaining a reasonable sample size (Devlin et al., 2012). The superior K-means methodology identified aggregates of individuals in multidimensional space (Janssens et al., 2008; Reedy et al., 2010). The K-means method minimizes the distances within each cluster to the center of that cluster, and was carried out following hierarchical cluster analysis. Respondents in a particular cluster are as similar as possible to all the other individuals in the same cluster, whereas an individual is as distinct as possible from others in different clusters (Reedy et al., 2010).
Nonlinear canonical correlation analysis
Nonlinear Canonical Correlation Analysis (NLCCA) is used to access and visually represent the overall data structure and possible overlooked relationships in the data. Canonical is a statistical term for analyzing latent variables (not directly observed) that represent multiple variables (directly observed). Canonical Correlation analysis is the analysis of multiple-X multiple-Y correlation. The Canonical Correlation Coefficient measures the strength of association between two Canonical Variates (weighted sum of the variables in the analysis).
NLCCA elicits a broad view of the interrelationships between variables and allows for a more detailed presentation of the data structure. NLCCA enables analyses variables at mixed levels (nominal, ordinal, numerical). The goal of NLCCA is to analyze the relationships between two or more sets of variables instead of between the variables themselves as in PCA (Meulman and Heiser, 2011). It is particularity advantageous as the method can also graphically display associations between variable categories. Essentially, NLCCA searches for what is common between sets of variables measured on the same objects (respondents).
NLCCA, a form of canonical correlational analysis, is a flexible exploratory technique commonly used to examine the nonlinear relationships between sets of categorical variables. No assumptions are made about the distribution of variables or the linearly of the relationships. It is a form of homogeneity analysis in that it analyses several sets of data simultaneously and deciphers what is common between sets of variables measured on the same objects (respondents). Rather than maximizing the correlations between these groups it compares them to an underlying latent ‘compromise set’ (Vrooman and Hoff, 2013).
NLCCA produces two key results. Firstly, it reduces the multidimensional survey responses to object scores in two independent dimensions for each variable. This enables exploration of which variables are most closely related. Secondly, NLCCA calculates ‘centroid’ scores for each of the categories that make up the answers to the survey questions. The centroid scores represent similarities between the categories. This enables exploration of how characteristics of animal welfare attitudes, cluster membership, and other variables are related. It also allows for the identification of variable groupings by plotting the category centroids on a two-dimensional graph. The values of the object scores for variable and the centroid scores for each category are located on the same dimensions (Fazey et al., 2014).
NLCCA also offers the opportunity to map a wide range of explanatory factors in correlation to different animal welfare and other variables while reducing the complex relationships by computing latent dimensions. This is attained by scaling and projecting the initial datasets as points in a low-dimensional Euclidean space (Van Der Burg and de Leeuw, 1983; Michailidis and De Leeuw, 1998). NLCCA was assessed with the OVERALS technique on SPSS where associations among k sets of variables can be analyzed (Gifi, 1990). The OVERALS procedure uses optimal scaling method to transform ordinal or nominal levels to numerical values to find the best transformation of the variables (Van der Burg et al., 1994; Bijleveld, 2007; Ponnam and Balaji, 2014). It is not necessary that the variables for each set are the same type or that there is an equal number of variables for each set. Hence, ‘irregularities’ in set characteristics are permitted (Van der Burg et al., 1994). The main purpose of OVERALS is to explain as much variance in the relationships among two or more sets of numerical, ordinal or nominal variables as possible in a low-dimensional Euclidean space. Hence, the scores are used to develop a geometrical representation of the dependencies in the data (Yazici et al., 2010). To illustrate complex associations between variables the method allows the researcher to introduce all interesting variables simultaneously. The rationale for using NLCCA is that complex multivariate data can be assessed in low-dimensional space which is essential for understanding patterns in the data (Härdle and Simar, 2019).
Results
Characteristics of respondents
In total, 972 completed surveys were obtained. Table 1 summarizes the general characteristics of the respondents. Most (70.7%) of respondents came from the Republic of Ireland which roughly represented the overall population differences between both countries.
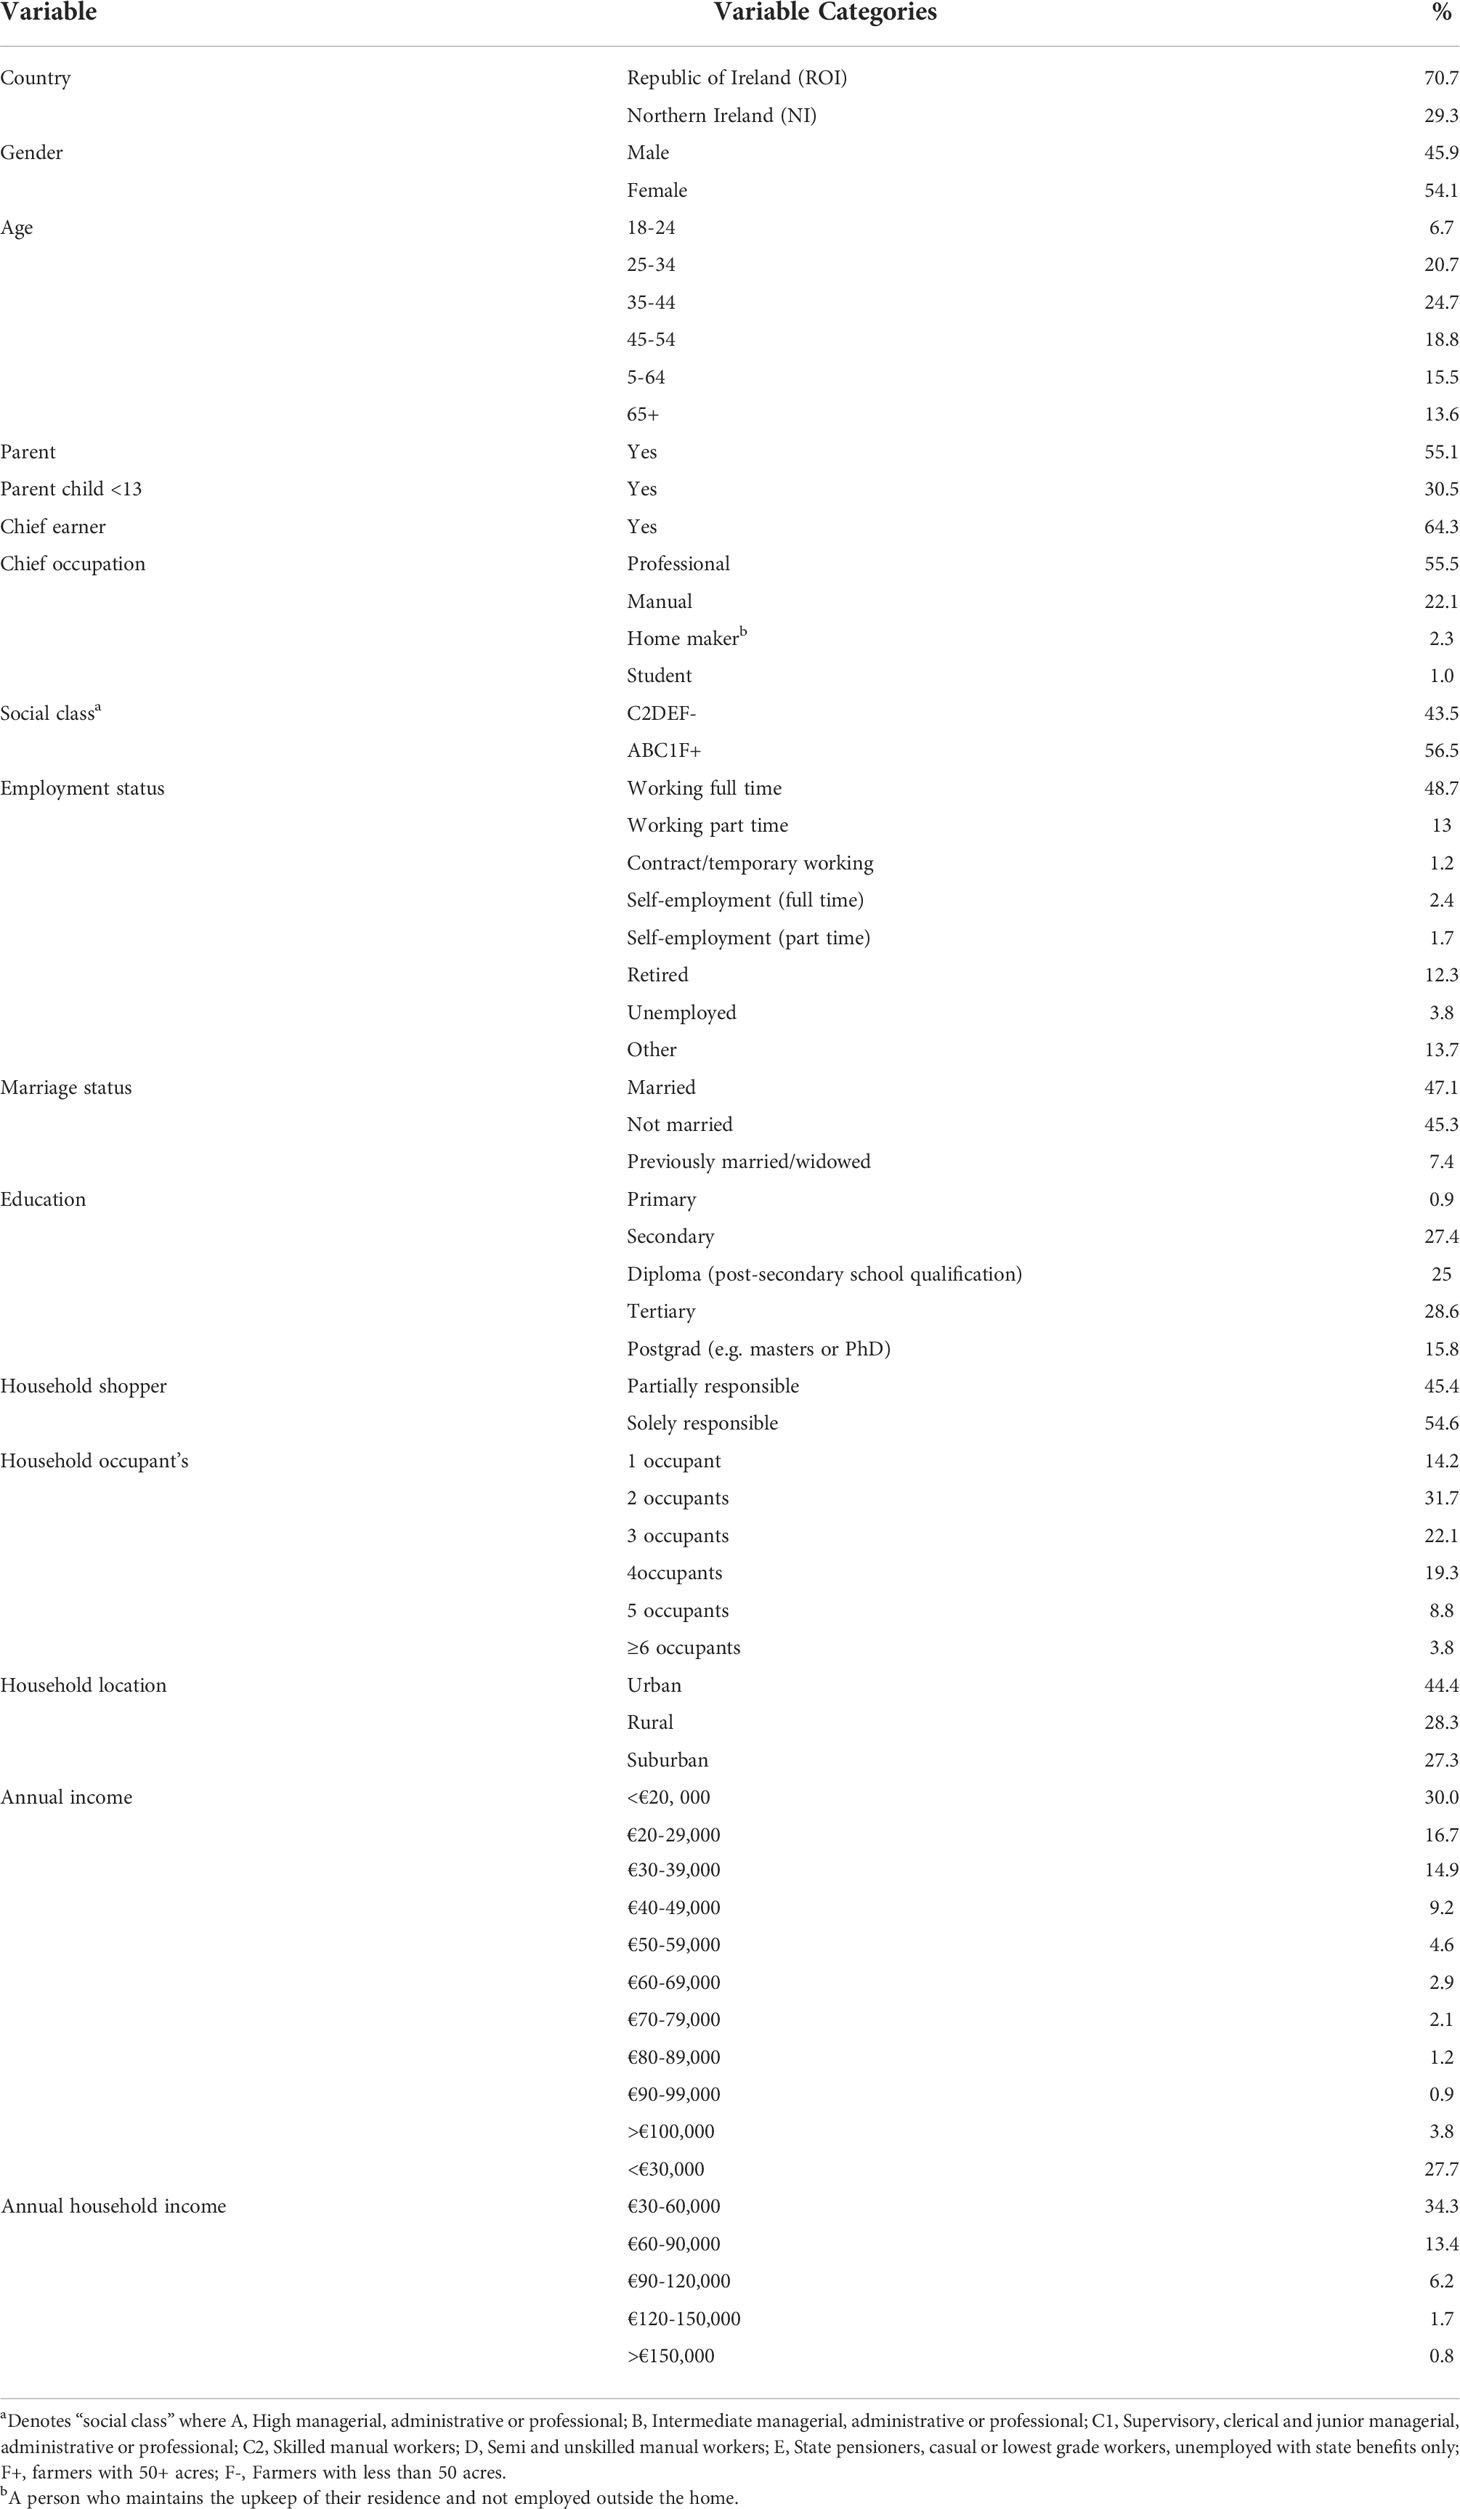
Table 1 Profile of the 972 respondents who took part in the study.
Respondents were asked how often they consumed animal welfare friendly products from a number of categories. Animal welfare friendly eggs was denoted as being the food group most frequently consumed followed by dairy, chicken, beef, and pork (Table 2). However, mean frequencies of consumption of animal welfare friendly products across all food groups was rather low and no greater than 1-4 times a month.
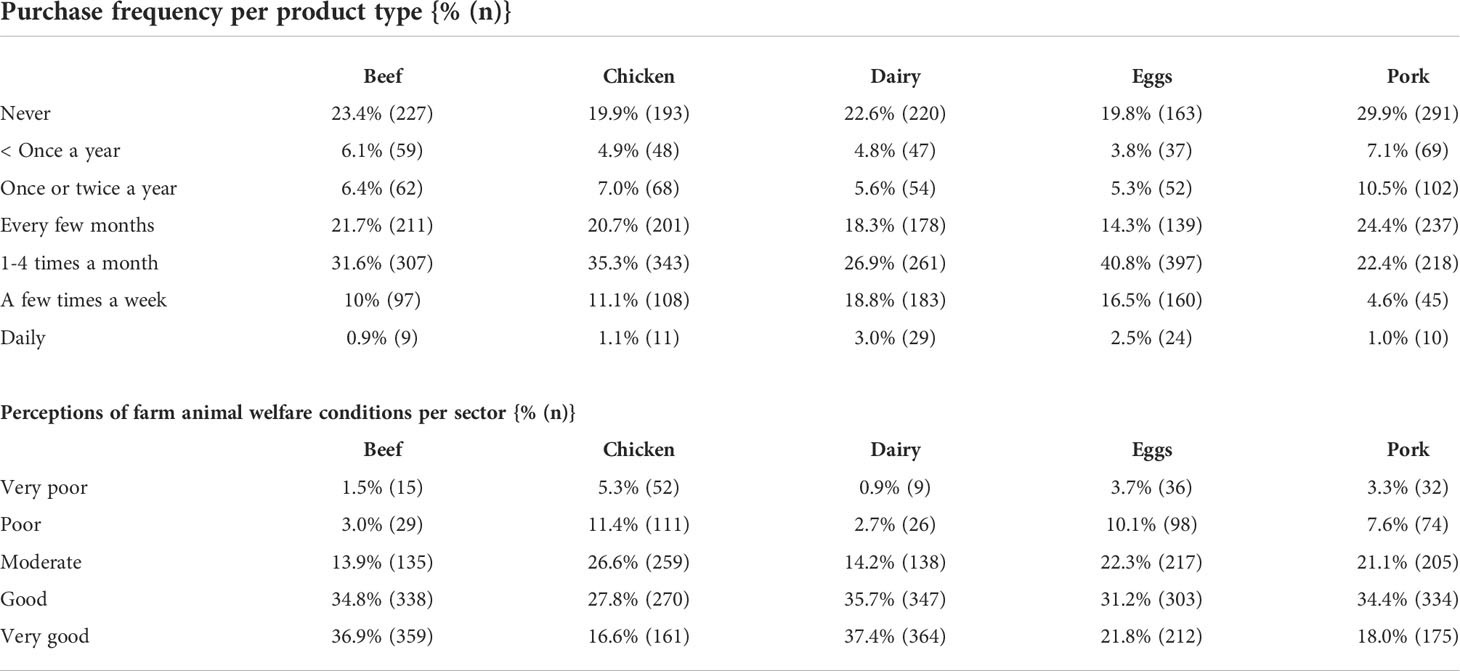
Table 2 Frequency of consumption of animal welfare versions of products and welfare rating of animal welfare ratings of associated sectors.
Somewhat consistent with the aforementioned findings is that the dairy sector was perceived as having very good animal welfare conditions (37.4%) followed closely by beef (36.9%) (Table 2). Conversely, chicken (16.6%), eggs (21.8%) and pork (18%) received comparatively lower very good welfare scores. Poor or very poor perceptions of animal welfare conditions were not prominent irrespective of sector.
Data preparation for cluster analysis using CATPCA
Attitudes regarding purchasing animal welfare products were elicited from respondents and evaluated using CATPCA in preparation for cluster analysis. Kaiser-Meyer-Olkin measure of sampling adequacy was found to be greater than 0.6 (0.893) and Bartlett’s Test of Sphericity was significant (p<0.05) indicating that CATPCA could proceed (Pallant, 2010). The analysis elicited two components one of which evaluates opportunity/capability, and another which evaluates motivation (Table 3). Hence, two elements of the COM-B model necessary to enact behavior, opportunity and capability, are captured by the same factor.
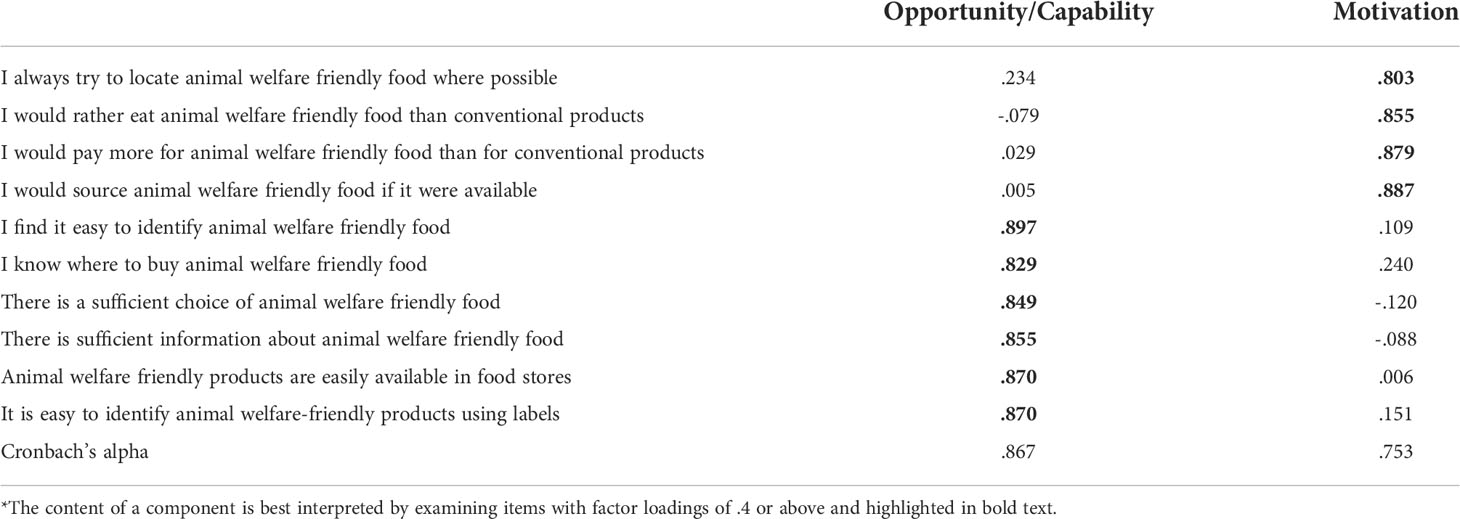
Table 3 Varimax rotated component loadings from a two-dimensional CATPCA*.
To evaluate the reliability of these latent variables a Cronbach alpha was calculated (Cronbach, 1951). A limit of 0.7 is suggested to assure that the measurement is free of random error (Nunnally Jum and Bernstein Ira, 1978). Cronbach alpha’s > 0.5 are considered acceptable as evidence of a common factor underlying the responses (Nunnally et al., 1967). The first and second dimensions accounted for 45% and 30% of variance respectively. The inclusion of further dimensions did not account for a satisfactory additional explanation of variance and yielded low component loading scores. Therefore, the extrapolation of two dimensions was deemed optimal.
Cluster analysis: Segmentation of respondents
Final cluster centers were attained from the CATPCA scores (Supplementary Material). These are computed as the mean for each variable within each final cluster and reflect the characteristics of the typical case for each cluster. Distinguishing characteristics of each cluster are indicated by high or low z-scores and are summarized in Table 4. Cluster 1 was the largest at 69.1% (n= 672), with two smaller clusters encompassing of 16.5% and 14.4% of respondents respectively. Clusters are labelled according to evident differences in perceptions based on the cluster centers for each. Significant differences between variables were examined by converting the adjusted residuals (Z-scores) to Chi-square values and testing those against a Chi-square distribution (Bonferroni-corrected P-value) (MacDonald and Gardner, 2000; Sharpe, 2015). An overview of the cluster characteristics is represented in Table 4 where symbols ‘+’ or ‘-’ denote positive or negative relationships between cluster membership and variables where significant differences were found (p<0.05). For more detailed information pertaining to defining cluster characteristics please refer to the Supplementary Material.
Indifferent (n=672; 69.1%): This segment of consumers represents the largest typology of respondents based on their perceptions of purchasing animal welfare friendly foods. The main defining characteristics of the cluster are summarized in Table 4; most notable was their significantly lower concern for animal welfare compared to the other clusters. They are significantly less likely to have a poor perception of animal welfare conditions compared to the Struggling and Engaged clusters. Nevertheless, they are significantly more motivated to purchase welfare friendly foods and believe they have the opportunity and capability to do so compared to Struggling consumers. Engaged consumers conversely have significantly higher levels of motivation as well as opportunities and capabilities. Members are significantly less likely to purchase all types of animal welfare friendly foods on a daily basis when compared to the Engaged. However, they are significantly more likely to consume animal welfare friendly pork and dairy at a moderate frequency (1-4 times a month) compared to those who are from the Struggling cluster (Supplementary Material: Table S3). There are no defining demographical characteristics associated with the cluster (Supplementary Material: Table S2).
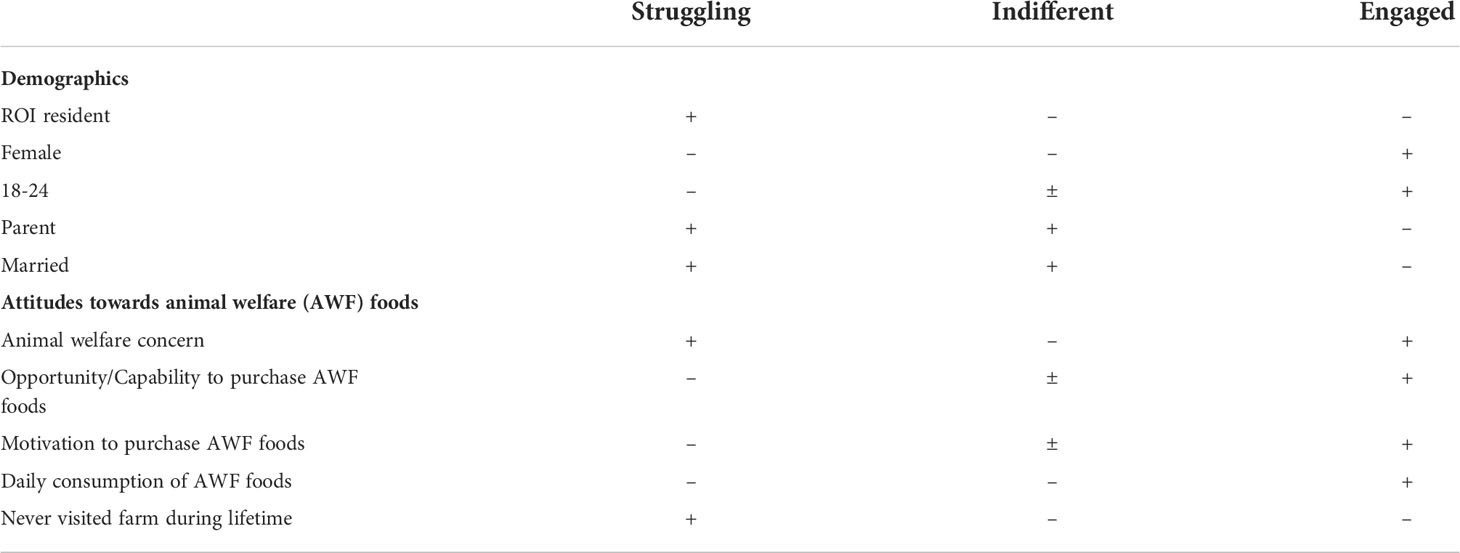
Table 4 Defining characteristics of the clusters.
Engaged (n = 160; 16.5%): Table 4 summarizes the defining features of Engaged consumers. This segment are highly motivated to purchase animal welfare friendly products. Most notably, they are significantly more likely to try to locate animal welfare friendly foods, they would rather eat such products, pay more, and source if available. Additionally, they have significantly higher opportunities and capabilities to purchase such products. This is represented by a significantly higher likelihood that they can identify animal welfare friendly foods, know where to buy them, and ability to use welfare labels. Coupled with this are significantly higher perceptions of there being sufficient choice, availability, and information pertaining to animal welfare friendly foods. Members of the Engaged cluster are consequently significantly more likely to purchase weekly and daily animal welfare friendly products across most product types compared to both other clusters (Supplementary Material: Table S3). With the exception of pork, weekly purchasing is significantly higher relative to the other typologies (Supplementary Material: Table S3). Compared to the Indifferent, the Engaged are significantly more likely to perceive all agricultural sectors to have very poor welfare conditions and to have gotten much worse over the previous ten years (Supplementary Material: Table S7). Demographically they differ significantly in that the cluster is more likely to include females compared to both other clusters and to include those aged 18-24 compared to the Struggling. Furthermore, they are significantly more likely not be married and not to have children (Supplementary Material: Table S2).
Struggling (n=140; 14.4%): Much like the Engaged, consumers in this cluster experience high levels of concern for animal welfare. Table 4 provides a summary of the characteristics associated with the grouping. Similarly, members also believe that welfare conditions are deteriorating across many sectors. They are significantly more likely to perceive animal welfare conditions of beef, pork and dairy sectors to be much worse compared to ten years ago (Supplementary Material: Table S7). Consumers in the typology are also significantly less likely to perceive improvements in beef, chicken, eggs, and dairy welfare over the timeframe. The cluster is named after the evident low levels of cognitive dissonance experienced as despite their negative appraisals of animal welfare they are significantly less motivated to purchase animal welfare produce compared to even the Indifferent cluster. The cluster is significantly more likely to believe they don’t have the opportunity or capability to purchase animal welfare friendly foods. Overwhelmingly feelings of finding it difficult to identify animal welfare foods, not knowing where to buy, lack of choice, dearth of information, inadequate availability, and difficulty using relevant labels represent significant hurdles (Supplementary Material: Table S5). They are consequently significantly less likely to buy any type of animal welfare food. While a large proportion of the other two clusters purchase such foods 1-4 times a month, those who are struggling are significantly less likely to buy welfare produce even at this somewhat moderate rate (Supplementary Material: Table S3). In addition, the cluster has an extraordinarily low level of weekly and daily purchase frequency across all foods (Supplementary Material: Table S3). Interestingly, struggling consumers are significantly more likely to have never visited a farm in their lifetime. In terms of demographics, this cluster was significantly more likely to be from ROI compared to the others (Table 4).
Dataset structure: Nonlinear canonical correlation analysis
The OVERALS analysis was employed to visualize the structure of the whole dataset and analyze the complex relationship between all variables (i.e. cluster membership, purchase frequency, demographics, attitudes towards purchasing animal welfare friendly food, engagement with farming, animal welfare rating of different sectors). Hence, six sets of variables were initially included to address such questions. However, some variables, and consequently sets, were omitted from the final analysis as they did not meet model criteria (explained in the next section).
Model description and fit
Each variable is included in the set indicative of the grouping it theoretically belongs to. Subsequently, weaker variables are removed from the analysis following a stepwise procedure (Vrooman and Hoff, 2013). The interpretation of the results includes, among others, evaluation of the fit (how well the solution fits the optimally quantified data with respect to the association between the sets), the loss value (the proportion of variation in the object scores that cannot be accounted), weights, component loadings, as well as the interpretation of the graphical representation. The analysis was completed in 17 iterations and some of the results are presented in Table 5.
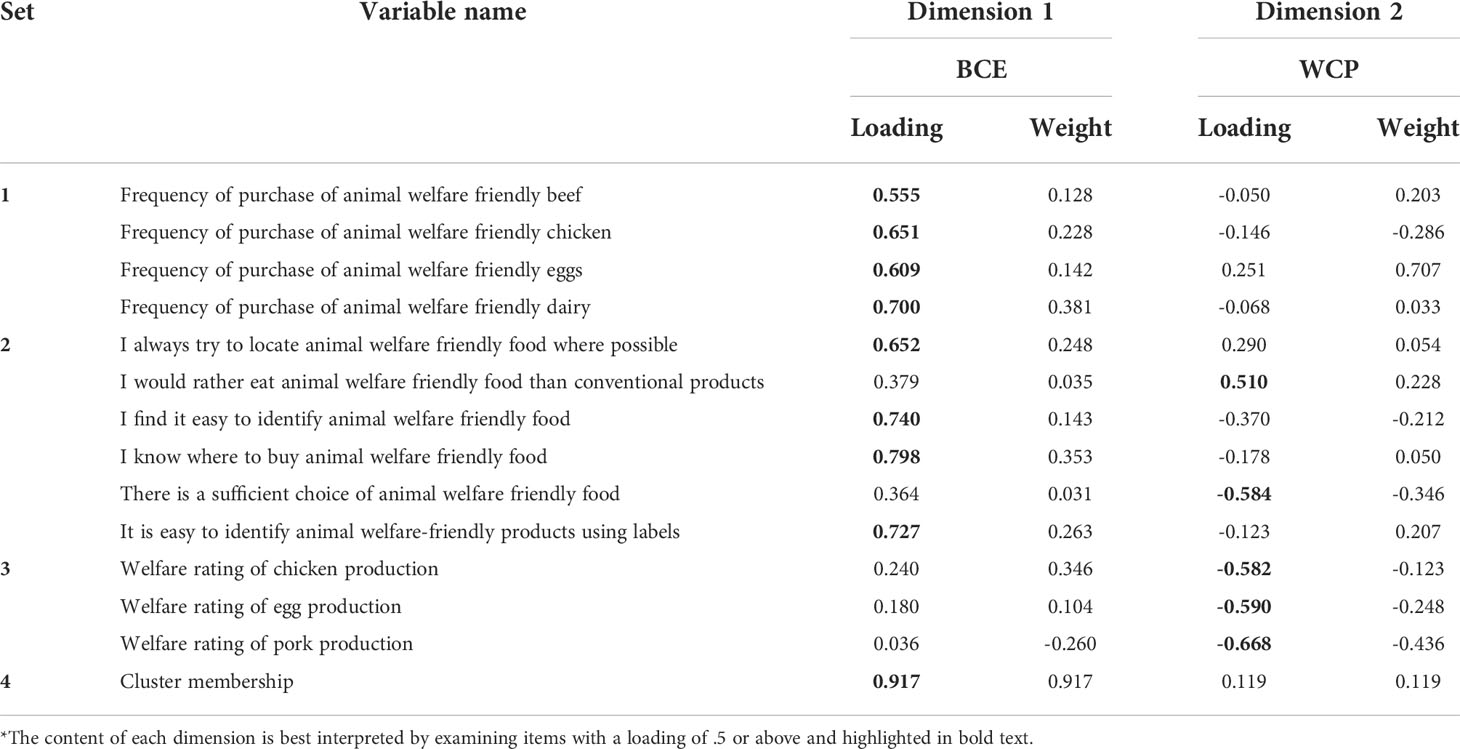
Table 5 Sets of variables, variables name and NLCCA dimension weights and loadings .
Component loadings in OVERALS are similar to factor loadings in a factor analysis. Weights are similar to standardized regression coefficients (Garson, 2012; van Bergen et al., 2017). In large samples (n > 300) component loadings ± 0.11 and ± 0.15 are deemed significant at the 1% and 5% significance levels respectively (Hair et al., 1998; McGarigal et al., 2000). However, a more rigorous approach is adopted where the more significant component loadings are adjudged as ± 0.45 and used as a cut-off for variable inclusion in the final model (Tabachnick et al., 2007; McGarigal et al., 2000). Additionally, it is assumed that a variable does not contribute substantially if its weight is below 0.10 (Garson, 2012; Vrooman and Hoff, 2013). A stepwise “backward” procedure is therefore implemented where iteratively one variable is omitted at a time if it failed to reach the criteria for components and/or weights outlined above (Garson, 2015). Consequently, many of the variables, and indeed sets, are dropped from the analysis.
The relationship between the sets obtained the best fit with a two dimensional solution. To interpret the two dimensions obtained, attributes with loadings of over 0.5 are inferred as most effective in explaining in relationships among variable sets because they were positioned far from the origin (denoting the mean) (González Ariza et al., 2019). The first dimension is defined by cluster membership, frequency of consumption of animal welfare produce, Q4r1 (I try to locate animal welfare friendly food where possible), Q6r1 (I find it easy to identify animal welfare friendly food), Q6r2 (I know where to buy animal welfare friendly food), Q6r6 (It is easy to identify animal welfare-friendly products using labels). It is consequently labelled “A clusters Behavioural Capacity and Execution” (BCE). The second dimension is defined by Q4r2 (I would rather eat animal welfare friendly food than conventional products), Q6r3 (There is insufficient choice of animal welfare friendly food) and the negative perceptions concerning the animal welfare of chicken, egg, and pork production. The second dimension is therefore labelled “Welfare Concern and Preference for animal welfare friendly produce” (WCP).
The first dimension (BCE) has a relatively high explanatory power with an eigenvalue of 0.621, while the second dimension (WCP) has a slightly lower eigenvalue of 0.433. The two dimensions produced a fit of 1.054 (the sum of the eigenvalues); a fit of greater than 0.5 is deemed acceptable (Van Der Geest et al., 2009; Chung and Song, 2018) The centroids of the optimally scaled categories of the segmentation variable are located in the canonical space in Figure 1.
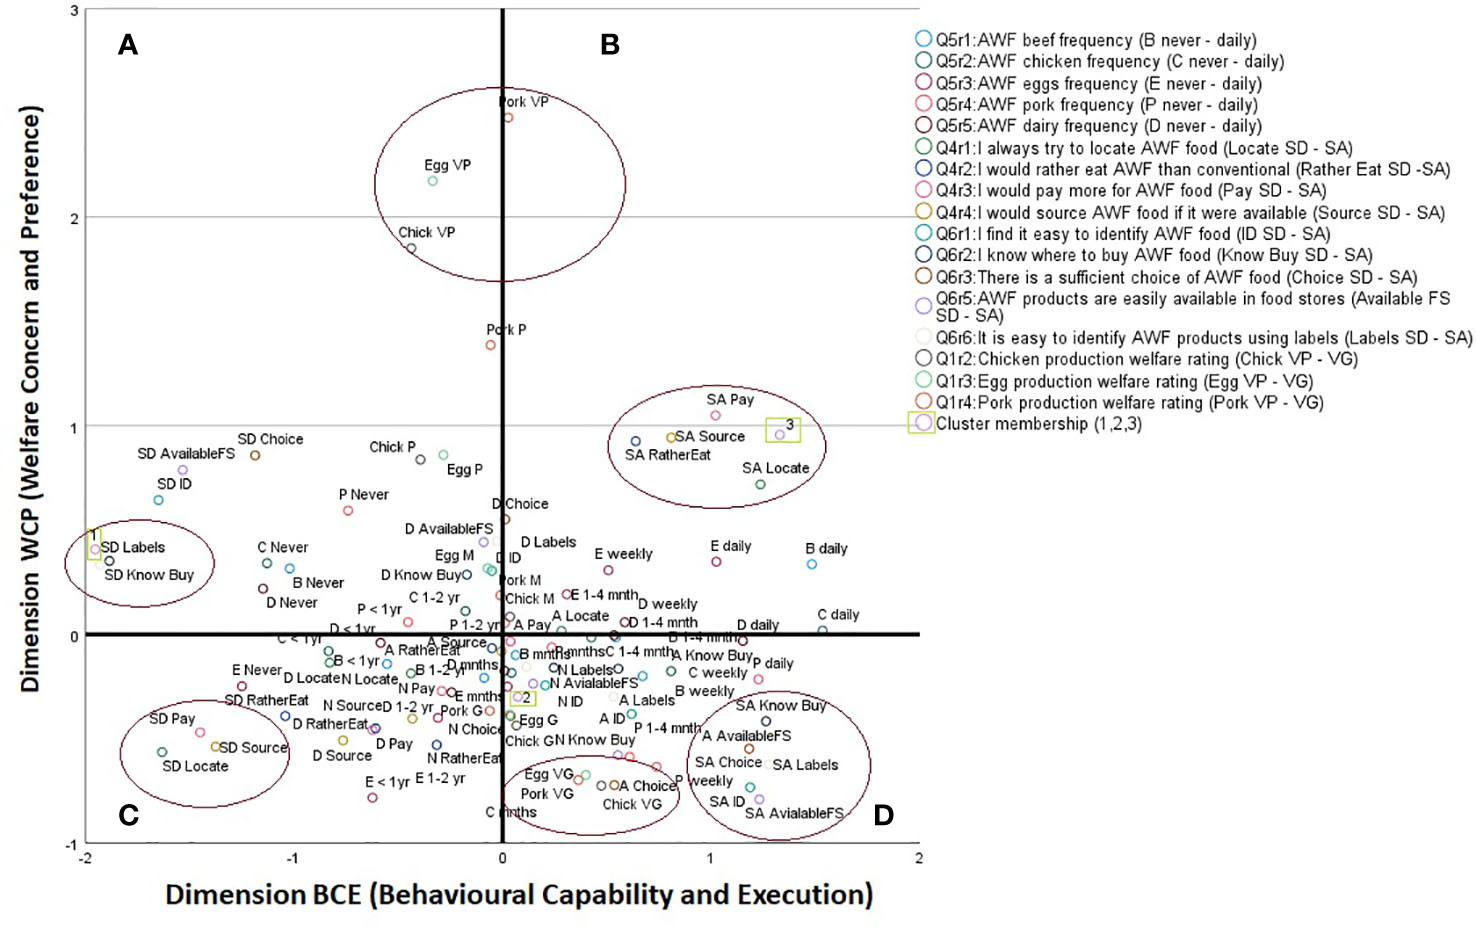
Figure 1 Multiple category centroid plot from NLCCA. Quadrant B represents the optimal positioning for daily purchase frequency of FAW friendly food. Food purchase frequency (Q5) of animal welfare friendly (AWF) products for each food group range on a seven point scale from never to daily. Attitudinal statements (Q4, Q6) range on a seven point scale of strongly disagree (SD) to strongly agree (SA). Cluster membership denoted where 1 represents the Struggling, 2 the Indifferent, and 3 the Engaged. The graph is interpreted by using four quadrants labeled (A–D). Category centroids are displayed in different quadrants.
Graphical representation of relationships
The graphical representations of the results can be interpreted through the following properties of NLCCA (Van der Burg et al., 1994; Hensher and King, 2002; Kourouxou et al., 2008; Ponnam and Balaji, 2014; Thanoon et al., 2015):
● Object scores form an orthogonal space on to which variables and objects can be projected.
● The coordinates of the projections of the variables, called component loadings, correspond with the correlations between transformed variables and object scores. They also represent the coordinates of varying points and can be interpreted easily through graphical representation.
● Preference of respondents towards a particular variable category increases in the direction the vector is pointing with the preference ordering determined by drawing perpendicular lines from the objects to the vector and read directly from the order of the projections.
● The distance between two vectors is related to the similarity between their profiles. A sharp angle indicates a positive relationship, an obtuse angle indicates a negative relationship, and a perpendicular angle indicates no relationship between two vectors.
● The length of a given vector indicates how much such a vector is explained by all canonical variates in total. The average variable is located near the center of the plot.
● Objects with a unique profile (or very low frequencies) will be located further away from the origin of the plot whereas objects with high frequencies will be located closer to the origin. Objects located near the origin represent the segments or groups with the least conspicuous pattern of attitudes.
NLCCA visualizes in Figure 1 each subcategory of the variables represented in the analysis with respect to how they associate with the dimensions outlined in Table 5. For instance, the subcategories of the variables capturing purchasing frequency of animal welfare specific foods (Q5r1-r5) are represented in the diagram as never purchasing such products (e.g. ‘B Never’ for never purchasing animal welfare friendly beef), less than once a year (e.g. ‘C < 1 yr’ for chicken), one to two times a year (e.g. ‘E 1-2 yr’ for eggs), every few months (e.g. ‘P mnths’ for pork), one to four times a month (i.e. ‘D 1-4 mnth’ for dairy), a few times a week (e.g. ‘B weekly’), and daily (e.g. ‘E daily’). Subcategories of variables using a Likert scale (Q4 and Q6 statements) are notified using labels ‘SD’ for strongly disagree, ‘D’ for disagree, ‘N’ for neutral, ‘A’ for agree, and ‘SA’ for strongly agree. For example, ‘SA Pay’ in Figure 1 signifies a strongly agreed response to statement Q4r3 ‘I would pay more for animal welfare friendly food’. Animal welfare rating subcategories (Q1r2-r4) per sector are defined in the diagram by ‘VP’ for very poor (i.e. ‘B VP’ for a very poor rating of beef animal welfare conditions), ‘P’ for poor, ‘M’ for medium, ‘G’ for good, and ‘VG’ for very good. Finally, cluster membership is denoted as numbers ‘1’, ‘2’, and ‘3’ for the Struggling, the Indifferent, and the Engaged respectively. Figure 1 therefore illustrates graphically how these subcategories of variables group with one another on the two dimensions identified (Table 5). Variable subcategories that bunch together signify strong associations between them particularity when positioned far from the origin.
Firstly, looking at cluster membership, The Struggling (Cluster 1) and the Engaged (Cluster 3) score higher on Dimension WCP, which reflects animal welfare concern and preference for animal welfare friendly produce, compared to The Indifferent (Cluster 2). However. The Struggling and The Engaged differ substantially in terms of their positioning on Dimension BCE; a clusters behavioral capacity and execution. Dimension BCE mostly captures differences between The Struggling and other clusters as evident in their positioning on Figure 1. As the diagram illustrates, Struggling consumers are located far from the other typologies. Conversely, Dimension WCP explains differences between The Indifferent and other clusters.
The diagram illustrates that Engaged membership is associated with strongly agreeing with motivational variables (Quadrant B). They also have stronger associations with daily consumption of animal friendly produce than other clusters (Quadrant B); specifically eggs and beef. Their placement in the diagram signifies strong behavioral capability and welfare concern and preference. Conversely, Struggling membership is associated with strongly disagreeing with statements concerning opportunity and capability, such as being able to use labels and knowing where to buy animal welfare friendly produce (Quadrant A). Unsurprising the cluster has stronger associations with never purchasing animal friendly foods compared to other clusters (positioned in the same quadrant); specifically chicken, beef, and dairy. Figure 1 illustrates that Indifferent membership is associated with lower concern and preference evident from lower positioning on Dimension WCP (Quadrant C). Despite this, this cluster still purchases animal welfare friendly foods more frequently than The Struggling as evident from their position on the x-axis.
The NCLLA also demonstrates that perceptions of very poor animal welfare conditions for pork, eggs, and chicken align with one another and score very high on Dimension WCP (positioned high on x-axis). As concern and preference lower (Dimension WCP) there is strong agreement that welfare conditions for animals are very good and agreement that there is sufficient choice (Quadrant C). This suggests that when consumers are not concerned about welfare they are content with the status quo. Strong agreements of one’s capability and opportunity to purchase welfare products are also positioned in Quadrant C (i.e. products are available in food stores, consumers know where to buy them, etc.). Critically, their placement in this quadrant signifies that strong feelings of opportunity and capability are not associated with concern for animal welfare but do align with behavioral capacity and execution. Finally, strong disagreement with willing to pay more, being able to source, and being able to locate animal welfare friendly products are associated with low concern and preference for animal welfare and low behavioral capacity and execution (Quadrant D). No cluster exhibits a strong relationship with any of the variable subcategories in Quadrant D.
Discussion
The demand for animal-source foods continues to rise globally; both in developed and developing countries (Henchion et al., 2021). Consumers in developed countries however are becoming more concerned about animal welfare and ethical issues surrounding meat consumption. It is therefore critical that the livestock industry appreciates and understands consumer’s perception of animal welfare and how it manifests itself in regard to consumer behavior (Heise and Theuvsen, 2017; Alonso et al., 2020; Boaitey and Minegishi, 2020; Yeh and Hartmann, 2021). This study aims to further understand consumer’s perception of FAW on the island of Ireland, particularly shedding light on the attitude-behavior gap (sometimes referred to as the ‘citizen-consumer disconnect’) that has been a common finding in the FAW consumer literature (Grunert, 2006; Clark et al., 2016). Three distinct classifications of consumers were identified from cluster analysis and labelled the Indifferent, the Engaged, and the Struggling. The three clusters and their respective defining characteristics are not unique to Ireland; other research has found similar typologies (e.g. Clark et al., 2016; Onwezen and van der Weele, 2016).
Members of the Struggling cluster act as citizens and may be trying to reduce cognitive dissonance by avoiding information and situations pertaining to welfare by not engaging with the issue (Rothgerber, 2020). While they are concerned about the welfare conditions of animals they are not motivated to act on this concern with respect to purchasing behavior. Interestingly, the Struggling were significantly less likely to have visited a farm compared to other clusters. Clark et al. (2016) reports that those who have visited a farm previously appear to be more knowledgeable about farm animal welfare and consequently less concerned with modern production. Their lack of familiarity of farming may however be an effort to avoid triggers to avert the requirement for behavioral adjustments, which could prove troublesome (Rothgerber, 2020). Consuming animal based products may appear to be a relatively uncontested behavior for those who are omnivores; after all most people do not, or intend to, follow an exclusively plant based diet. However, the ‘meat paradox’ corresponds to the discomfort some meat eaters experience when consumption is directly linked to animals but yet continue to consume animal products (Bastian and Loughnan, 2017). A growing body of research suggests that some meat eaters overcome inconsistent cognitions through strategic ignorance (Van der Weele, 2013; Onwezen and van der Weele, 2016; Rothgerber, 2020). The phenomenon depicts individuals who ignore information that does not conflate with their values; they do so to avoid mental anguish. The consumption of meat may consequently be problematic as it potentially defies concerns for animal welfare (Loughnan et al., 2010). As such, strategic ignorance can be conceptualized as a coping mechanism to overcome cognitive dissonance; an unpleasant emotional state arising from misaligned values and practices (Rothgerber, 2020). Rothgerber and Rosenfeld (2021) outline how consumers use a number of strategies to overcome meat related cogitative dissonance; these include avoidance and willful ignorance.
However, theories of human behavior change such as the COM-B model, the Motivation–Ability–Opportunity model and the Theory of Planned Behaviour all depict how capability, opportunity, and motivation are all interlinked to shape and define human decision-making and behavior (Ajzen, 1991; Siemsen et al., 2008; Michie et al., 2011). The Struggling’s overwhelming negative feelings towards opportunity and capability explain their behavior. The findings emphasizes while concern and preference for animal welfare friendly produce is relatively high for the cluster, they do not feel enabled to purchase such produce due to a variety of factors encompassing opportunity and capability. These represent significant barriers that may dampen motivation. Italian research also evoked a segment of consumers who ardently supported animal welfare but declared that they were unable to recognize associated products (Di Pasquale et al., 2016). Such hindrances have been documented in other studies where consumers depict labels difficult to comprehend and availability and choice concerning animal welfare foods to be lacking (Clark et al., 2016). Sweeney et al. (2022) in their related qualitative study of Irish and Northern Irish consumers found some individuals have grievances concerning identifying animal welfare products and are distrustful of labels and the information they portray. Many individuals in their study reported not making purchasing decisions based on labels mistrust, which was driven by confusion around what the labels actually represented. Similar to this study, other research has depicted how concerns for FAW do not correlate to purchasing behavior; sales of welfare friendly products are often lower than reported levels of concern (European Commission, 2007). This could imply a potential inconsistency between the role of citizen and consumer (Grunert, 2006), where citizens and consumers have contrasting priorities (Clark et al., 2016). Therefore, FAW may simply not be factored by some consumers when shopping. It remains unclear as to why members of this typology are significantly more likely to be from ROI; future research exploring the market availability and accessibility of FAW produce in both regions may provide answers.
Indifferent consumers’ lower sense of concern for animal welfare is in direct contrast to the Struggling and the Engaged. Nevertheless, their purchase frequency of animal welfare products is higher than that of the Struggling which serves to highlight the importance of capability and opportunity. Onwezen and van der Weele (2016) found that consumers classified as indifferent do not feel responsible, do not aim to learn about the issue, and do not experience high levels of cognitive dissonance. Their findings offer insights into possible antecedents and mediators of the thought processes that may characterize Indifferent consumers from this study. German research also found indifferent consumers with respect to organic poultry purchasing behavior (Schipmann-Schwarze and Hamm, 2020). Those who were indifferent regularly purchased in a supermarket and butchers. The authors hypothesize that supermarkets offer conventional poultry products, but often also have quite an extensive organic range. Therefore, it is conceivable that while the Indifferent cluster is not overtly concerned about animal welfare they purchase welfare goods as they are freely available where they shop. This could explain their higher purchasing frequency compared to members of the Struggling cluster. A recent Eastern European segmentation study on consumer’s attitudes towards animal welfare also elicited an indifferent grouping, finding that such consumers often faced financial burdens (Tomasevic et al., 2020). However, this was not evident in the findings from Ireland as over 50% of the group would pay more for animal welfare products and income did not differ significantly from the other clusters.
The Engaged grouping are highly motived, capable, and have ample opportunity to purchase animal welfare friendly foods. In strong contrast to the other clusters, they are more likely to purchase animal welfare foods on a daily basis. The typology has some significant demographic characteristics in that they are more likely to be female, aged 18-24, not have a child and not be married. Gender and age are commonly found to be predictors associated with FAW concern (Clark et al., 2016; Clark et al., 2017; Blanc et al., 2020). Amiot and Bastian (2017) conclude that women have greater compassion towards animals than men. However, the role of age may be more nuanced; animal welfare concern has been found to become more positive from childhood to adolescence but declines thereafter (Kellert, 1982; Kendall et al., 2006; Binngießer et al., 2013; Martens et al., 2019). Their lower age profile also explains why parenthood and marriage are not significant characteristics.
The NLCCA visually illuminates how Quadrant B is the optimal position for daily purchasing of animal welfare products. The quadrant is defined by high animal welfare concern and preference as well as behavioral capability. While the Engaged are already positioned in this quadrant the other clusters need different interventions for them to increase their respective purchasing frequency. The Indifferent typology has moderate rates of purchasing but call for an increase in animal welfare concern to reposition themselves in Quadrant B towards daily purchasing. Knowledge has been shown to play a central role in affecting and encouraging concern for animal welfare. Research postulates that knowledge of FAW issues and exposure to farm animals, for instance through direct agricultural experience, were linked with intensifying the degree of concern for welfare and towards associated behaviors (Cornish et al., 2016). The Struggling on the other hand require interventions that target behavioral capability if they are to position themselves in Quadrant B. Interventions that focus on enablement are particularly effective at increasing capability and opportunity. Enablement aims to increase an individual’s means to engage and/or to reduce barriers to increase capability or opportunity (Cornish et al., 2019). Consumers could be enabled to buy higher welfare products via the establishment of widely accessible and trusted front-of-pack labelling that assist consumers to differentiate animal products based on animal welfare conditions. However, Sweeney et al. (2022) suggest that any ROI or NI labelling scheme must be supported by understandable and evidence based quality assurance schemes that foster public trust. Public engagement measures that educate and empower consumers with information on farming and food production will be a vital intervention to support any future labelling strategies on FAW (Sweeney et al., 2022). Such interventions should enable the Indifferent and the Struggling typologies to engage more consciously and effectively in FAW with respect to their purchasing behavior.
There are a number of limitations to note in the current study. Survey research requires participants to self-report their perceptions and attitudes, and thus, a bias of social desirability arises. Furthermore, a recruitment bias can occur in that participants who hold existing interest in the topic may be more predisposed to take part in the studies. Nevertheless, the survey reflected the views of a large sample of the general population, representative of key demographics, thus providing rigor to the findings.
Conclusion
Positive attitudes concerning FAW do not always correspond to purchasing behavior, in many cases concern does not enact purchasing behavior. This disengagement is known as the citizen consumer disconnect. The analysis illustrates that concern for animal welfare doesn’t always align with the purchasing of animal welfare friendly products; evident by the Struggling cluster who act as consumers rather than the concerned citizens they are. It shows that behavioral capacity to purchase such products is much more important than concern and leads to more frequent purchases, as is the case with the Indifferent. The COM-B behavioral wheel specifies that interventions focused on education, training and enablement would be effective in increasing purchasing frequency of the Struggling. Meanwhile, Interventions that increase motivation would be particularly fruitful for the Indifferent, these include education and incentives for consumers to purchase animal welfare friendly foods.
Data availability statement
The original contributions presented in the study are included in the article/Supplementary Material. Further inquiries can be directed to the corresponding author.
Ethics statement
Ethical review and approval was not required for the study on human participants in accordance with the local legislation and institutional requirements. The patients/participants provided their written informed consent to participate in this study.
Author contributions
JH was responsible for the paper write up and statistical analyses conducted. SS was responsible for survey design and over-seeing data collection. ÁR was responsible for survey design, over-seeing data collection, data analysis, and paper write-up. CM aided in Northern Ireland focus group data collection, advised on survey design, and contributed to paper write-up. TB, SH, and MD advised on survey design and contributed to paper write-up. All authors contributed to the article and approved the submitted version.
Funding
This research is part of the Surveillance Welfare and Biosecurity of farmed animals (SWAB) project funded by the Irish Department of Agriculture, Food, and the Marine under the Research Stimulus Fund (Project no: RSF 17/S/230).
Conflict of interest
The authors declare that the research was conducted in the absence of any commercial or financial relationships that could be construed as a potential conflict of interest.
Publisher’s note
All claims expressed in this article are solely those of the authors and do not necessarily represent those of their affiliated organizations, or those of the publisher, the editors and the reviewers. Any product that may be evaluated in this article, or claim that may be made by its manufacturer, is not guaranteed or endorsed by the publisher.
Supplementary material
The Supplementary Material for this article can be found online at: https://www.frontiersin.org/articles/10.3389/fanim.2022.930930/full#supplementary-material
References
Abdi H. (2004)“Factor rotations in factor analyses,”. In: Encyclopedia of social sciences, research methods (Thousand Oaks: Sage). Available at: http://www.utdallas.edu/ (Accessed June 20, 2022).
Agnoli L., Capitello R., De Salvo M., Longo A., Boeri M. (2016). Food fraud and consumers’ choices in the wake of the horsemeat scandal. Br. Food J. 118(8), 1898–1913. doi: 10.1108/BFJ-04-2016-0176
Ajzen I. (1991). The theory of planned behavior. Organ. Behav. Hum. Decis. Process 50, 179–211. doi: 10.1016/0749-5978(91)90020-T
Alonso M. E., González-Montaña J. R., Lomillos J. M. (2020). Consumers’ concerns and perceptions of farm animal welfare. Animals 10, 385. doi: 10.3390/ani10030385
Amiot C. E., Bastian B. (2017). Solidarity with animals: Assessing a relevant dimension of social identification with animals. PloS One 12, e0168184. doi: 10.1371/journal.pone.0168184
Aschemann-Witzel J., Niebuhr Aagaard E. M. (2014). Elaborating on the attitude–behaviour gap regarding organic products: Young d anish consumers and in-store food choice. Int. J. Consum. Stud. 38, 550–558. doi: 10.1111/ijcs.12115
Bánáti D. (2011). Consumer response to food scandals and scares. Trends Food Sci. Technol. 22, 56–60. doi: 10.1016/j.tifs.2010.12.007
Barnett J., Begen F., Howes S., Regan A., McConnon A., Marcu A., et al. (2016). Consumers’ confidence, reflections and response strategies following the horsemeat incident. Food Control 59, 721–730. doi: 10.1016/j.foodcont.2015.06.021
Bastian B., Loughnan S. (2017). Resolving the meat-paradox: A motivational account of morally troublesome behavior and its maintenance. Personal. Soc Psychol. Rev. 21, 278–299. doi: 10.1177/1088868316647562
Bijleveld C. C. (2007). “Analysis of longitudinal categorical data using optimal scaling techniques,” in Handbook of Longitudinal Research: Design, Measurement, and Analysis. Academic Press, UK, ed. Menard S. (Oxford, UK.: Elsevier), 333–356.
Binngießer J., Wilhelm C., Randler C. (2013). Attitudes toward animals among German children and adolescents. Anthrozoos 26, 325–339. doi: 10.2752/175303713X13697429463475
Blanc S., Massaglia S., Borra D., Mosso A., Merlino V. M. (2020). Animal welfare and gender: A nexus in awareness and preference when choosing fresh beef meat? Ital. J. Anim. Sci. 19, 410–420. doi: 10.1080/1828051X.2020.1747952
Boaitey A., Minegishi K. (2020). Who are farm animal welfare conscious consumers? Br. Food J. 122 (12), 3779–3796. doi: 10.1108/BFJ-08-2019-0634
Botreau R., Veissier I., Butterworth A., Bracke M. B. M., Keeling L. J. (2007). Definition of criteria for overall assessment of animal welfare. Anim. Welfare-Potters Bar Then Wheathampstead 16, 225.
Burns R., Burns R. P. (2008). Business research methods and statistics using SPSS (London, UK:Sage Publications Limited).
Carrington M. J., Neville B. A., Whitwell G. J. (2010). Why ethical consumers don’t walk their talk: Towards a framework for understanding the gap between the ethical purchase intentions and actual buying behaviour of ethically minded consumers. J. Bus. ethics 97, 139–158. doi: 10.1007/s10551-010-0501-6
Chung Y., Song T.-J. (2018) Safety analysis of motorcycle crashes in Seoul metropolitan area, south Korea: An application of nonlinear optimal scaling methods. Int. J. Environ. Res. Public Health 15, 2702–2902. doi: 10.3390/ijerph15122702
Clark B., Stewart G. B., Panzone L. A., Kyriazakis I., Frewer L. J. (2016). A systematic review of public attitudes, perceptions and behaviours towards production diseases associated with farm animal welfare. J. Agric. Environ. Ethics 29, 455–478. doi: 10.1007/s10806-016-9615-x
Clark B., Stewart G. B., Panzone L. A., Kyriazakis I., Frewer L. J. (2017). Citizens, consumers and farm animal welfare: A meta-analysis of willingness-to-pay studies. Food Policy 68, 112–127. doi: 10.1016/j.foodpol.2017.01.006
Cornish A., Jamieson J., Raubenheimer D., McGreevy P. (2019). Applying the behavioural change wheel to encourage higher welfare food choices. Animals 9, 524. doi: 10.3390/ani9080524
Cornish A., Raubenheimer D., McGreevy P. (2016). What we know about the public’s level of concern for farm animal welfare in food production in developed countries. Animals 6, 74. doi: 10.3390/ani6110074
Cronbach L. J. (1951). Coefficient alpha and the internal structure of tests. Psychometrika 16, 297–334. doi: 10.1007/BF02310555
De Bakker E., Dagevos H. (2012). Reducing meat consumption in today’s consumer society: Questioning the citizen-consumer gap. J. Agric. Environ. Ethics 25, 877–894. doi: 10.1007/s10806-011-9345-z
Degeling C., Johnson J. (2015). Citizens, consumers and animals: What role do experts assign to public values in establishing animal welfare standards? J. Agric. Environ. Ethics 28, 961–976. doi: 10.1007/s10806-015-9571-x
De Jonge J., van Trijp H. (2013). Meeting heterogeneity in consumer demand for animal welfare: A reflection on existing knowledge and implications for the meat sector. J. Agric. Environ. ethics 26, 629–661. doi: 10.1007/s10806-012-9426-7
Devlin U. M., McNulty B. A., Nugent A. P., Gibney M. J. (2012). The use of cluster analysis to derive dietary patterns: Methodological considerations, reproducibility, validity and the effect of energy mis-reporting. Proc. Nutr. Soc. 71, 599–609.
Di Pasquale J., Nannoni E., Adinolfi F., Del Duca I., Capitanio F., Sardi L., et al. (2016). A case-study on profiling Italian consumers of animal-friendly foods. Ital. J. Anim. Sci. 15, 294–302. doi: 10.1080/1828051X.2016.1180963
European Commission (2007). Attitudes of EU citizens towards animal welfare. Brussels, Belgium:European Commission.
European Commission (2016). Special eurobarometer: Attitudes of europeans towards animal welfare (Brussels, Belgium:European Commission).
Fazey I., Bunse L., Msika J., Pinke M., Preedy K., Evely A. C., et al. (2014). Evaluating knowledge exchange in interdisciplinary and multi-stakeholder research. Glob. Environ. Change 25, 204–220. doi: 10.1016/j.gloenvcha.2013.12.012
Formann A. K. (1984). Die latent-class-analyse: Einführung in die theorie und anwendung [Latent class analysis: Introduction to theory and application (Beltz: Weinheim, Germany).
Garson G. D. (2015). GLM multivariate, MANOVA, & canonical correlation: Blue book series 11 (Raleigh, NC: Statistical Associates Publishers).
González Ariza A., Arando Arbulu A., Navas González F. J., Ruíz Morales F., de A., León Jurado J. M., et al. (2019). Sensory preference and professional profile affinity definition of endangered native breed eggs compared to commercial laying lineages’ eggs. Animals 9, 920. doi: 10.3390/ani9110920
Grunert K. G. (2006). Future trends and consumer lifestyles with regard to meat consumption. Meat Sci. 74, 149–160. doi: 10.1016/j.meatsci.2006.04.016
Hair J. F., Anderson R. E., Tatham R. L., Black W. C. (1998). Multivariate data analysis (Upper Saddle River, NJ: Prentice Hall International).
Härdle W. K., Simar L. (2019). Applied multivariate statistical analysis (Cham, Switzerland:Springer).
Heise H., Theuvsen L. (2017). What do consumers think about farm animal welfare in modern agriculture? Attitudes and shopping behaviour. Int. Food Agribus. Manage. Rev. 20, 379–399. doi: 10.22434/IFAMR2016.0115
Henchion M., Moloney A. P., Hyland J., Zimmermann J., McCarthy S. (2021). Review: Trends for meat, milk and egg consumption for the next decades and the role played by livestock systems in the global production of proteins. Animal 15, 100287. doi: 10.1016/j.animal.2021.100287
Hensher D. A., King J. (2002). Mapping stakeholder perceptions of the importance of environmental issues and the success in delivery: A university case study. Environ. Educ. Res. 8, 199–224. doi: 10.1080/13504620220128257
IUNA (2011) National adult nutrition survey. Available at: http://www.iuna.net/ (Accessed May 30, 2016).
Janssens W., De Pelsmacker P., Wijnen K., Van Kenhove P. (2008). Marketing research with SPSS (New York, USA:Prentice Hall).
Kaplan D. (2004). The sage handbook of quantitative methodology for the social sciences (California, USA:sage).
Kellert S. R. (1982). Knowledge, affection and basic attitudes toward animals in American society (Washington, USA:US Department of the Interior, Fish and Wildlife Service).
Kendall H. A., Lobao L. M., Sharp J. S. (2006). Public concern with animal well-being: Place, social structural location, and individual experience. Rural Sociol. 71, 399–428. doi: 10.1526/003601106778070617
Kourouxou M., Siardos G., Iakovidou O., Kalburtji K. (2008). Organic farmers in islands: Agricultural management and attitude towards the environment. Int. J. Sustain. Dev. World Ecol. 15, 553–564. doi: 10.1080/13504500809469851
Loughnan S., Haslam N., Bastian B. (2010). The role of meat consumption in the denial of moral status and mind to meat animals. Appetite 55, 156–159. doi: 10.1016/j.appet.2010.05.043
MacDonald P. L., Gardner R. C. (2000). Type I error rate comparisons of post hoc procedures for I j chi-square tables. Educ. Psychol. Meas. 60, 735–754. doi: 10.1177/00131640021970871
Manisera M., van der Kooij A. J., Dusseldorp E. (2010). Identifying the component structure of satisfaction scales by nonlinear principal components analysis. Qual. Technol. Quant. Manage. 7, 97–115. doi: 10.1080/16843703.2010.11673222
Martelli G. (2009). Consumers’ perception of farm animal welfare: An Italian and European perspective. Ital. J. Anim. Sci. 8, 31–41. doi: 10.4081/ijas.2009.s1.31
Martens P., Hansart C., Su B. (2019). Attitudes of young adults toward animals–the case of high school students in Belgium and the Netherlands. Animals 9, 88. doi: 10.3390/ani9030088
McCarthy M., De Boer M., O’Reilly S., Cotter L. (2003). Factors influencing intention to purchase beef in the Irish market. Meat Sci. 65, 1071–1083. doi: 10.1016/S0309-1740(02)00325-X
McFadden D. T., Deselnicu O., Costanigro M. (2013). How consumers respond to corporate social responsibility initiatives: A cluster analysis of dairy consumers. J. Food Distrib. Res. 44, 17–24. doi: 10.22004/ag.econ.158774
McGarigal K., Stafford S. G., Cushman S. (2000). Multivariate Statistics for Wildlife and Ecology Research , (Berlin:Springer).
Meehan H., Cowan C., McIntyre B. (2002). Food choice and consumer concerns about animal welfare in Ireland (Dublin, Ireland:Teagasc).
Mesić Ž., Petljak K., Borović D., Tomić M. (2021). Segmentation of local food consumers based on altruistic motives and perceived purchasing barriers: a Croatian study. Econ. Res. Istraživanja 34, 221–242. doi: 10.1080/1331677X.2020.1782243
Michailidis G., De Leeuw J. (1998). The gifi system of descriptive multivariate analysis. Stat. Sci., 307–336.
Michie S., Van Stralen M. M., West R. (2011). The behaviour change wheel: a new method for characterising and designing behaviour change interventions. Implement. Sci. 6, 1–12. doi: 10.1186/1748-5908-6-42
Mooi E., Sarstedt M. (2011). A concise guide to market research (Berlin, Heidelberg: Springer Berlin Heidelberg).
Nunnally J. C., Bernstein I. H., Berge J. M. F. (1967). Psychometric theory (New York, USA:McGraw-Hill New York).
OIE (2019)Article 7.1.1. of the terrestrial animal health code. In: Terrestrial animal health code (Paris. France: World Organisation for Animal Health). Available at: https://www.oie.int/fileadmin/Home/eng/Health_standards/tahc/2016/en_chapitre_aw_introduction.htm (Accessed March 15, 2022).
Onwezen M. C., van der Weele C. N. (2016). When indifference is ambivalence: Strategic ignorance about meat consumption. Food Qual. Prefer. 52, 96–105. doi: 10.1016/j.foodqual.2016.04.001
Pallant J. (2010). SPSS Survival manual: A step by step guide to data analysis using SPSS (London, UK:Open University Press).
Pejman N., Kallas Z., Dalmau A., Velarde A. (2019). Should animal welfare regulations be more restrictive? A case study in eight European union countries. Animals 9, 195. doi: 10.3390/ani9040195
Ponnam A., Balaji M. S. (2014). Matching visitation-motives and restaurant attributes in casual dining restaurants. Int. J. Hosp. Manage. 37, 47–57. doi: 10.1016/j.ijhm.2013.10.004
PwC (2019). 2019 PwC Irish Retail & Consumer Report: Investing in Experience. (Dublin, Ireland:PwC).
Reedy J., Wirfält E., Flood A., Mitrou P. N., Krebs-Smith S. M., Kipnis V., et al. (2010). Comparing 3 dietary pattern methods–cluster analysis, factor analysis, and index analysis–with colorectal cancer risk: The NIH-AARP diet and health study. Am. J. Epidemiol. 171, 479–487. doi: 10.1093/aje/kwp393
Rothgerber H. (2020). Meat-related cognitive dissonance: A conceptual framework for understanding how meat eaters reduce negative arousal from eating animals. Appetite 146, 104511. doi: 10.1016/j.appet.2019.104511
Rothgerber H., Rosenfeld D. L. (2021). Meat-related cognitive dissonance: The social psychology of eating animals. Soc Personal. Psychol. Compass 15, e12592. doi: 10.1111/spc3.12592
Scarborough P., Kaur A., Cobiac L., Owens P., Parlesak A., Sweeney K., et al. (2016). Eatwell guide: Modelling the dietary and cost implications of incorporating new sugar and fibre guidelines. BMJ Open 6, e013182. doi: 10.1136/BMJOPEN-2016-013182
Schipmann-Schwarze C., Hamm U. (2020). Exploring drivers and barriers for organic poultry consumption. Br. Food J. 122 (12), 3679–3693. doi: 10.1108/BFJ-11-2018-0787
Sharpe D. (2015). Your chi-square test is statistically significant: Now what? Pract. Assess. Res. Eval., 20 (8), 1–10. doi: 10.7275/tbfa-x148
Siemsen E., Roth A. V., Balasubramanian S. (2008). How motivation, opportunity, and ability drive knowledge sharing: The constraining-factor model. J. Oper. Manage. 26, 426–445. doi: 10.1016/j.jom.2007.09.001
Stewart C., Piernas C., Cook B., Jebb S. A. (2021). Trends in UK meat consumption: analysis of data from years 1ââ, ¬â€œ11 (2008ââ, ¬â€œ09 to 2018ââ, ¬â€œ19) of the national diet and nutrition survey rolling programme. Lancet Planet. Heal. 5, e699–e708. doi: 10.1016/S2542-5196(21)00228-X
Sweeney S., Regan Á., McKernan C., Benson T., Hanlon A., Dean M. (2022). Current consumer perceptions of animal welfare across different farming sectors on the island of Ireland. Animals 12, 185. doi: 10.3390/ani12020185
Tabachnick B. G., Fidell L. S., Ullman J. B. (2007). Using multivariate statistics (Pearson Boston, MA:Pearson).
Thanoon T. Y., Adnan R., Safari S. E. (2015). Generalized nonlinear canonical correlation analysis with ordered categorical and dichotomous data. J. Teknol. 75, 91–99. doi: 10.11113/jt.v75.3602
Tomasevic I., Bahelka I., Čítek J., Čandek-Potokar M., Djekić I., Getya A., et al. (2020). Attitudes and beliefs of Eastern European consumers towards animal welfare. Anim. 10, 1220. doi: 10.3390/ANI10071220
van Bergen A. P. L., Hoff S. J. M., Schreurs H., van Loon A., van Hemert A. M. (2017). Social exclusion index-for health surveys (SEI-HS): A prospective nationwide study to extend and validate a multidimensional social exclusion questionnaire. BMC Public Health 17, 1–13. doi: 10.1186/s12889-017-4175-1
Van Der Burg E., de Leeuw J. (1983). Non-linear canonical correlation. Br. J. Math. Stat. Psychol. 36, 54–80. doi: 10.1111/j.2044-8317.1983.tb00765.x
Van der Burg E., De Leeuw J., Dijksterhuis G. (1994). OVERALS: Nonlinear canonical correlation with k sets of variables. Comput. Stat. Data Anal. 18, 141–163. doi: 10.1016/0167-9473(94)90136-8
Van Der Geest V., Blokland A., Bijleveld C. (2009). Delinquent development in a sample of high-risk youth: Shape, content, and predictors of delinquent trajectories from age 12 to 32. J. Res. Crime Delinq. 46, 111–143. doi: 10.1177/0022427808331115
Van der Weele C. (2013). Meat and the benefits of ambivalence, Röcklinsberg H., Sandin P. (Eds.), The Ethics of Consumption; The Citizen, The Market and The Law, (Wageningen:Wageningen Academic Publishers)
Vanhonacker F., Verbeke W., Van Poucke E., Tuyttens F. A. M. (2007). Segmentation based on consumers’ perceived importance and attitude toward farm animal welfare. Int. J. Sociol. Agric. Food 15, 91–107. doi: 10.48416/ijsaf.v15i3.286
Vecchio R., Annunziata A. (2012). Italian Consumer awareness of layer hens’ welfare standards: a cluster analysis. Int. J. Consum. Stud. 36, 647–655.
Vrooman J. C., Hoff S. J. M. (2013). The disadvantaged among the Dutch: A survey approach to the multidimensional measurement of social exclusion. Soc Indic. Res. 113, 1261–1287. doi: 10.1007/s11205-012-0138-1
Yazici A. C., Öğüş E., Ankarali H., Gürbüz F. (2010). An application of nonlinear canonical correlation analysis on medical data. Turkish J. Med. Sci. 40, 503–510. doi: 10.3906/sag-0803-47
Keywords: animal welfare, consumers, purchase behavior, agriculture, policy
Citation: Hyland JJ, Regan Á, Sweeney S, McKernan C, Benson T and Dean M (2022) Consumers attitudes toward animal welfare friendly produce: An island of Ireland study. Front. Anim. Sci. 3:930930. doi: 10.3389/fanim.2022.930930
Received: 28 April 2022; Accepted: 12 August 2022;
Published: 05 September 2022.
Edited by:
Linda Jane Keeling, Swedish University of Agricultural Sciences, SwedenReviewed by:
Daniel Nenene Qekwana, University of Pretoria, South AfricaAgata Malak-Rawlikowska, Warsaw University of Life Sciences, Poland
Copyright © 2022 Hyland, Regan, Sweeney, McKernan, Benson and Dean. This is an open-access article distributed under the terms of the Creative Commons Attribution License (CC BY). The use, distribution or reproduction in other forums is permitted, provided the original author(s) and the copyright owner(s) are credited and that the original publication in this journal is cited, in accordance with accepted academic practice. No use, distribution or reproduction is permitted which does not comply with these terms.
*Correspondence: John J. Hyland, John.Hyland@teagasc.ie