Comparative performance analysis of three machine learning algorithms applied to sensor data registered by a leg-attached accelerometer to predict metritis events in dairy cattle
 Gema Vidal
 James Sharpnack2
  Beatriz Martínez-López
- 1Center for Animal Disease Modeling and Surveillance, School of Veterinary Medicine, University of California, Davis, Davis, California, CA, United States
- 2Department of Statistics, College of Letters and Science, University of California, Davis, Davis, California, CA, United States
- 3Department of Animal Sciences, College of Agricultural Sciences, Colorado State University, Fort Collins, CO, United States
- 4Department of Animal and Food Sciences, College of Agriculture, Food and Environment, University of Kentucky, Lexington, KY, United States
Routinely collected sensor data could be used in metritis predictive modeling but a better understanding of its potential is needed. Our objectives were 1) to compare the performance of k-nearest neighbors (k-NN), random forest (RF), and support vector machine (SVM) classifiers on the detection of behavioral patterns associated with metritis events measured by a leg-attached accelerometer (TrackaCow, ENGS, Hampshire, UK); 2) to study the impact of farm scheduled activities on model performance; and 3) to identify which behaviors yield the highest F1 score for metritis prediction as a function of the number of time window and time-lags. A total of 239 metritis events (188 non-metritis and 51 metritis events) were retrospectively created based on changes in two consecutive uterine evaluations from a dataset containing sensor and clinical data during the first 21 days postpartum between June 2014 and May 2017. These events were associated with a total of 10,874 - 14,138 data points corresponding to hourly measurements of lying time, lying bouts, steps, intake, and intake visits. Sensor data corresponding to the 3 days before each metritis event were aggregated every 24-, 12-, 6-, and 3-hour time windows. Multiple time-lags were also used to determine the optimal number of past observations needed for optimal classification. Similarly, different decision thresholds were compared. Depending on the classifier, algorithm hyperparameters were optimized using grid search (RF, k-NN, SVM) and random search (RF). All behaviors changed throughout the study period and showed distinct daily patterns. From the three algorithms, RF had the highest F1 score, with no impact of scheduled farm activities on classifier performance. Furthermore, 3- and 6-hour time windows had the best balance between F1 scores and number of time-lags. We concluded that steps and lying time can be used to predict metritis using data from 2 to 3 days before a metritis event. Findings from this study will be used to develop more complex prediction models that could identify cows at higher risk of experiencing metritis.
1 Introduction
Metritis is a common disease that is diagnosed in 30 to 50% of dairy cows (LeBlanc, 2010). Combined with other metabolic diseases such as hypocalcemia or hyperketonemia, post-partum infectious diseases have short- and long-term effects on welfare, reproductive health, and antibiotic use (LeBlanc, 2010). Sick animals experience an adaptative response known as sickness behavior that helps them to cope with a given stressor. Most sickness behaviors are associated with depression, loss of appetite, and weight loss (Tizard, 2008), which can be measured with precision dairy monitoring (PDM) technologies such as sensor devices. These technologies have experienced a rapid growth due to increasing herd sizes and labor cost, combined with lower ratios of farm staff to animals (de Koning, 2010; Rutten et al., 2013).
Machine learning (ML) is a group of statistical models used on data collected with PDM technologies with the goal of finding predictive patterns in the data. Therefore, ML algorithms can be used on sensor data to develop predictive models to identify which cows are at higher risk of becoming clinically ill. Given the high frequency at which changes in behavioral patterns can be analyzed when PDM technologies and ML algorithms are combined, there is potential for earlier disease diagnosis compared with traditional diagnostic methods. As result, earlier clinical or management interventions could prevent or mitigate the impact of stress and clinical disease on animals (Weary et al., 2009; LeBlanc, 2010; Dittrich et al., 2019). Despite its potential, precision farming on metritis detection has been understudied, with only an estimated 13% of the precision farming literature being related with disease around parturition compared with other research areas such as fertility (32%), locomotion problems (30%), or mastitis (25%) (Rutten et al., 2013). Among the studies with a focus on metritis during the transition period, researchers have found reduced behaviors such as lying time (Urton et al., 2005; Sepúlveda-Varas et al., 2014; Neave et al., 2018), feeding, and rumination duration associated with the disease (Stangaferro et al., 2016b; Steensels et al., 2017; Neave et al., 2018). However, common limitations of these studies are the lack of control for concurrent postpartum diseases, behavioral data aggregation before and after disease diagnosis resulting in loss of temporal relationships, poor description of sensor data pre-processing strategies, and lack of consideration of within-same-day behavior variability due to farm scheduled activities (Huzzey et al., 2007; Stoye et al., 2012).
The objective of the present study was to compare the performance of three ML classification algorithms (k-nearest neighbors, random forest, and support vector machine) on the detection of behavioral patterns measured with a leg-attached accelerometer, associated with changes in metritis score throughout the post-partum period in dairy cows. A second goal was to identify whether farm scheduled activities had an impact on ML classification algorithm performance. A third goal was to determine which animal behaviors yield the highest F1 score for metritis prediction, to estimate the optimal time aggregation for the raw sensor data, and to estimate the optimal number of time-lags that are necessary to analyze for metritis prediction. Our findings will provide a base for the development of more complex prediction models that, eventually, could be integrated in the farm management software to indicate farm personnel which cows are at higher risk of developing metritis while optimizing the use of sensor data.
2 Materials and method
The data used in this study was part of a large study designed to quantify physiological and behavioral changes associated with mastitis, lameness, estrus, and postpartum diseases, using multiple PDM technologies (Tsai, 2017; Lee, 2018). The larger study included data from 138 lactating cows at the University of Kentucky Coldstream Dairy (Lexington, KY, USA) that were enrolled in the study during two different periods: the first period, from June 2014 to October 2015, and the second, from July 2016 to May 2017 under Institutional Animal Care and Use Committee #2013-119 and 2016-2368, respectively.
2.1 Population data
From the original dataset, a total of 35 dairy cows that either did not experience any disease postpartum or were only affected by metritis were retrospectively selected. Cows were enrolled in the study after parturition and were followed for 21 days. Data from two cows that died or were culled from the herd before 21 days in milk (DIM) had been excluded in the original dataset and were not available for this study.
Details about animal management and study design are provided somewhere else (Tsai, 2017; Lee, 2018). Briefly, cows were moved to a close-up dry pen a month before the expected calving date and moved again to a fresh cow pen upon parturition. Lactating cows were housed in two free-stall barns and were provided ad libitum access to fresh water in each barn. Lactating cows were fed the same TMR between 6:00 to 10:00 h and 12:30 to 15:00 h. The lactating diet consisted of forage, alfalfa hay, concentrate mix, alfalfa haylage, whole cottonseed mineral and vitamin supplement. During the second study period, feed was pushed up 22 times per day by an automated feed pusher (Lely Juno, Ley Robots, Masslius, the Netherlands). Cows were milked two times per day in a double 2 X 2 tandem-milking parlor at 4:30 to 5:30 h and 15:30 to 16:30 h.
2.2 Clinical data
Disease definitions and the health-monitoring program used in the study are provided in detail somewhere else (Tsai, 2017; Lee, 2018). In short, fresh cows were monitored daily from 7:00 to 10:00 h for the first 21 days of lactation. A MetriCheck (Simero Tech Ltd, Hamilton, New Zealand) device was used to obtain a uterine discharge sample and scored on a 1 to 3 scale using a scale modified from Sheldon et al. (2006). Briefly, score 1: thick, viscous discharge, clear, opaque or red to brown in color, no odor or mild; score 2: white or yellow pus, moderate to thick discharge, mild odor; score 3: pink, red, dark red, or black watery discharge, detectable offensive odor, possibly intolerable. Cows with score > 2 were classified as metritis cases (Tsai, 2017; Lee, 2018). Uterine discharge was scored on 3, 5, 7, 9, 11, 17, 19, and 21 DIM, and during the first study period, an additional sample was scored on 14 DIM, while during the second study period additional samples were taken on 13 and 15 DIM. Differences in additional sampling days between first and second study periods were due to other ongoing research activities and availability of farm personnel. Cows were also monitored for hypocalcemia, hyperketonemia, mastitis, lameness, and retained placenta. Hypocalcemia was defined as calcium level in blood serum< 8.6 mg/dL (Chapinal et al., 2011), collected by caudal venipuncture on 3, 7, 14, and 21 DIM. Hyperketonemia was defined as beta-hydroxybutyrate (BHBA) concentration in blood > 1.2 mmol/L (Kaufman et al., 2016) measured with Precision Xtra electronic handheld device (Abbott Laboratories, Chicago, IL, USA) on days 3, 7, 14, and 21 DIM, and BHBCheck (PortaCheck Inc., Moorestown NJ, USA) on days 1, 2, 3, 4, 5, 6, 7, 10, 14, and 21 DIM for the first and second study periods, respectively. Cows were diagnosed with clinical mastitis using the following criteria: watery, thickened, and discolored milk; milk containing blood, pus, flakes, or clots; edema, erythema; or pain in the associated quarter (Royster and Wagner, 2015) between 1 and 21 DIM by trained milkers. Furthermore, subclinical mastitis was assessed measuring somatic cell count (SCC) on days 4 + 2 DIM and 9 + 2 DIM via flow cytometry in quarter milk samples. Cows with SCC > 200,000 cells/mL in one or more quarters were considered positive for subclinical mastitis. Finally, locomotion scores were recorded on days 1, 7, 14, and 21 postpartum on a 1 to 3 scale (Schlageter-Tello et al., 2014). Retained placenta was recorded if fetal membranes were retained for > 24 hours (Sheldon et al., 2006).
For any given cow and day, a metritis event was assigned when a cow developed metritis (score increased from 1 to either 2 or 3) or remained with metritis (scores 2 or 3 remained higher or equal than 2) between two consecutive uterine discharge evaluations. Similarly, for any given cow and any given day, a non-metritis event was assigned when a cow recovered from metritis or remained healthy, this is, when the metritis score decreased to 1, or when the score remained as 1, between two consecutive uterine discharge evaluations. Only those cows that either did not experience any disease postpartum or were only affected by metritis during the 21 days following parturition were selected for further analysis. Among those, some events were classified as either non-metritis or metritis events.
2.3 Sensor data and data pre-processing
For this study, each cow was equipped with a leg-attached accelerometer (Trackacow, ENGS, Hampshire, UK) from parturition (day 1) to 21 days postpartum. For each animal, the device registered the number of minutes per hour a given behavior was classified as either lying (minutes per hour), lying bouts (number per hour), steps (number per hour), intake (minutes per hour), and intake visit (number of visits to the feedbunk per hour). Five parallel time series were generated for each behavior for any given time period. Trackacow device has been previously validated by (Chapinal et al., 2007; Borchers, 2015; Borchers et al., 2016).
To remove seasonality in the time series data, we differentiated the time series for each cow and behavior by subtracting from each time step the value registered by the device in time step corresponding to the previous 24 hours. Sensor data were then combined with the clinical data. First, for a given cow, we assigned the time of diagnosis at 6:00 h on each one of the days when a metritis event was assigned, and only the time steps from the sensor data corresponding to the previous 72 hours before a given metritis event were considered for further data manipulation. Therefore, the 6:00 h time was used as offset during the pre-processing of the time series sensor data (all_day models). The time series data for each metritis event at time was then defined by where was the time step corresponding to the differenced hourly sensor measurement for behavior and time step being and the time step within a 72-hour period. Next, we aggregated the time steps using the mean over 4 different time windows that had different widths: 3, 6, 12, and 24 h. As result, the new time series data for each behavior and metritis event at time was defined by where as the mean sensor value for behavior and time window being time window width and the time step within a 72-hour period. The number of time steps that could be included within this period was a function of the width of the time window Lastly, to estimate the number of optimal time-lags for model performance, transformed time series with different number of time steps were used for each behavior within a 72-hour period. Model inputs were then defined by where each feature was the mean sensor value for behavior and time window and time-lag being the number of time steps included as features within a 72-hour period before a given metritis event. The number of time-lags that could be included within a 72-hour period was a function of For example, for behavior registered as lying, time window and time-lag 1, the number of features included in the model were corresponding to the mean hourly lying time in the 24 hours right before a given metritis event. Similarly, for behavior registered as lying, time window and time-lag 3, the number of features included in the model were corresponding to the mean hourly lying time in the 18 hours right before a given metritis event.
To identify whether farm scheduled activities had an impact on ML classification algorithm performance, same data pre-processing steps described above (aggregation of time steps using the mean over 4 different time windows, use of different number of time steps to study the optimal time-lags) were repeated using only sensor data from 17:00 to 3:00 h, being the time of diagnosis t assigned at 17:00 h on each one of the days when a metritis event was assigned (evening-night models). In this case, the 17:00 h time was used as offset for data manipulation during data pre-processing.
2.4 Model fitting
In this paper, we evaluate the ability of 3 supervised ML classifiers (k-nearest neighbors, random forest, and support vector machines) to discriminate among 2 possible distinct patterns (metritis and non-metritis events) in 5 animal behaviors as independent variables (Alpaydin, 2010). These classifiers are amongst the most used ones in PDM literature and are conceptually different, making them a sensible choice to compare performance (Kohavi et al., 1997). For each combination of behavior ML classifier, time window and time-lag within the 72 hours before a given metritis event, one model was fitted on the sensor data. The process was performed twice: in the first one, all sensor data was used (all_day models) while in the second time, sensor data between 17:00 and 3:00 h were used (evening-night models). In those cases where differences in the behavior distribution between cows of different parities were significantly different, models were fitted a third time, with separate models for primiparous and multiparous cows.
All classifiers used in this study have been described elsewhere. Briefly, k-nearest neighbors (k-NN) relies on the assumption that similar data points exist in close proximity and estimates the closeness using Euclidean distance for each data point to the rest of the data points (Fix and Hodges, 1951; Dasarathy, 1991; Hastie et al., 2009). Random forest (RF) is made up from many decision trees, a flowchart of questions asked about the data that leads to a predicted class (metritis or non-metritis events) with the greatest reduction in Gini Impurity, or the probability that a randomly chosen sample in a set of data points or node would be correctly labeled if it was labeled by the distribution of samples in the node (Breiman, 2001; Hastie et al., 2009). In contrast, support vector machines (SVM) estimate the optimal hyperplane, or decision hyperplane, that separates the different classes while maximizing the distance, or margin, to the closest point from either class, also called support vectors. One of the advantages of SVM is the use of the kernel function, a mathematical function that transforms the feature space to deal with cases in which classes are not linearly separated (Vapnick, 1995; Hastie et al., 2009).
2.5 Model performance assessment
To assess model performance, we used group fivefold cross-validation (5-FCV) to set aside a validation set and use it to assess the performance of the prediction model, using cow ID as grouping variable. Specifically, for any given model, 4/5ths of the data were used to fit the model, whereas the other 1/5th was used to calculate the prediction error of the fitted model (validation set). This process was repeated each time until all 5 folds had been used for both, fitting the model and validation, resulting in an average prediction error. The use of cow ID as grouping variable prevented that events corresponding to the same cow could end up in both, train and validation sets, as multiple events were recorded for each cow during the study period.
Grid Search (GS) was used to optimize classifier hyperparameters, except for RF classifier, where GS was performed after Randomized Search (RS) to reduce the grid search so computing time was manageable. Optimal values that were found to allow for best mean cross-validation accuracy were used to train the final model. Optimized hyperparameters for RF were bootstrap, maximum depth, minimum samples leaf, minimum samples split, and number of estimators. The optimization of SVM were gamma and C. We repeated model evaluation with kernels linear, radial, polynomial, and sigmoid. For k-NN, parameter k was optimized. A complete description of the values used for each one of the hyperparameters and the list of models used during optimization can be found in Table 1.
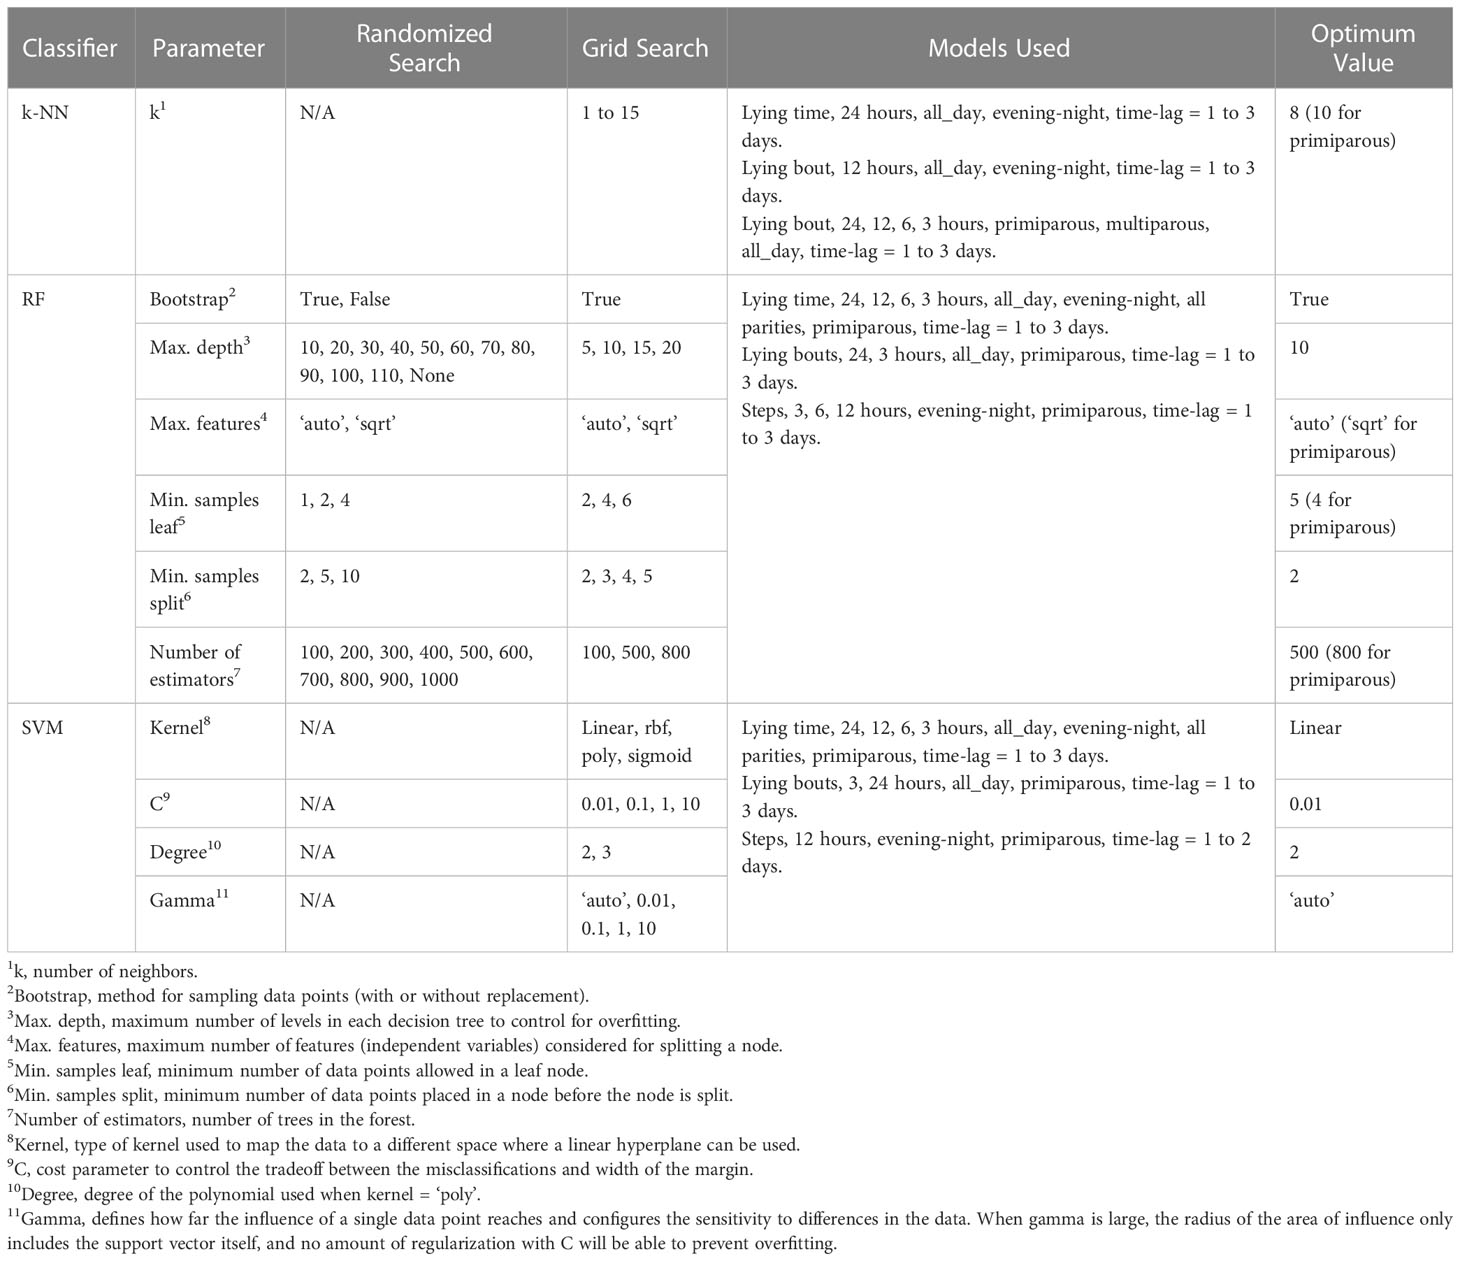
Table 1 Hyperparameter values used for optimization of k-nearest neighbors (k-NN), random forest (RF), and support vector machine (SVM) classification algorithms used on behavior variables measured with a leg-attached 3-axis accelerometer (Trackacow, ENGS, Hampshire, UK).
After model fitting, the prediction class probability for each health event of being classified as metritis was obtained and ranked from highest to lowest, and the top 20, 30, and 40% class probabilities were used as different cut-off points instead of using the default 0.50 class probability. For each cut-off point (20, 30, 40%), classification performance was evaluated using averaged estimates of 5-FCV sensitivity (Se or recall), specificity (Sp), positive predictive value (PPV or precision), negative predictive value (NPV), accuracy (Ac), F1 score, the area under the curve (AUC) for the receiver operating characteristic (ROC) curve and Precision Recall (PR)-curves. Sensitivity was estimated as the ratio of correctly predicted positive observations to all observations in the actual class (metritis event) in each one of the 5 cross-validation folds. Specificity was estimated as the ratio of correctly predicted negative observations to all observations in the actual class (non-metritis event) in each one of the 5 cross-validation folds. Positive predictive value was the ratio of correctly predicted positive observations to all predicted positive observations in each cross-validation fold. Similarly, NPV was the ratio of correctly predicted negative observations to all predicted negative observations in each fold. Accuracy was the ratio of correct predictions to all number of observations in each fold. F1 score is the weighted average of PPV and Se, considering both false positives and false negatives. It is used in classification problems where the distribution of the observations in each class is unbalanced (Saito and Rehmsmeier, 2015). F1 score was computed as (1 + β2)*(PPV * Se)/((β2 * PPV) + Se), where β = 1 (Saito and Rehmsmeier, 2015).
Open-source software was used for feature extraction, classifier implementation, and parameter optimization (pandas, numpy, scikit-learn. Python version 2.7. Python Software Foundation, http://www.python.org) (Pedregosa et al., 2011). Plots were done using ggplot2 library (Wickham, 2009), using R open-source statistical software (R Core Team, 2017).
3 Results
3.1 Metritis events
Based on the changes of metritis score between two consecutive evaluations, 239 health events were created. Among those, 188 were labeled as non-metritis class, while 51 were labeled as metritis class. The resulting dataset was unbalanced given the greater number of non-metritis events compared to the metritis events. All events were generated from the clinical evaluations from 35 dairy cows (Jersey = 20; Holstein = 15; primiparous = 17; multiparous = 18) that had been retrospectively selected from the original dataset (n = 138). The number of hourly sensor records ranged from 10,874 (intake and intake visit) to 14,138 (lying, lying bouts, and steps).
Average + SD milk yield was 36.1 kg. + 15.6. Of the 35 cows selected, 13 did not have any metritis events during the study period, while 22 were diagnosed at least once with metritis (score >1), occurring at 12 DIM (12.02 + 4.72 DIM). Among these, 2 cows had retained fetal membranes and were kept for data analysis. None of the selected animals had hyperketonemia, mastitis, or hypocalcemia. The proportion of metritis events for primiparous and multiparous were 20% and 23%, respectively.
3.2 Sensor data
Cows showed high variability in their behaviors during the study period, especially regarding number of steps (98.8 ± 72.51 number/h) and lying time (21.74 ± 21.06 min/h), followed by intake (7.54 ± 12 min/h). This trend was constant regardless of the level of sensor data aggregation and time of the day (Table 2). Furthermore, the distributions for lying bouts, steps, intake, and intake visits were right-skewed, and differences in the mean values by parity were greater during the evening-night hours for lying and steps (Figure 1).
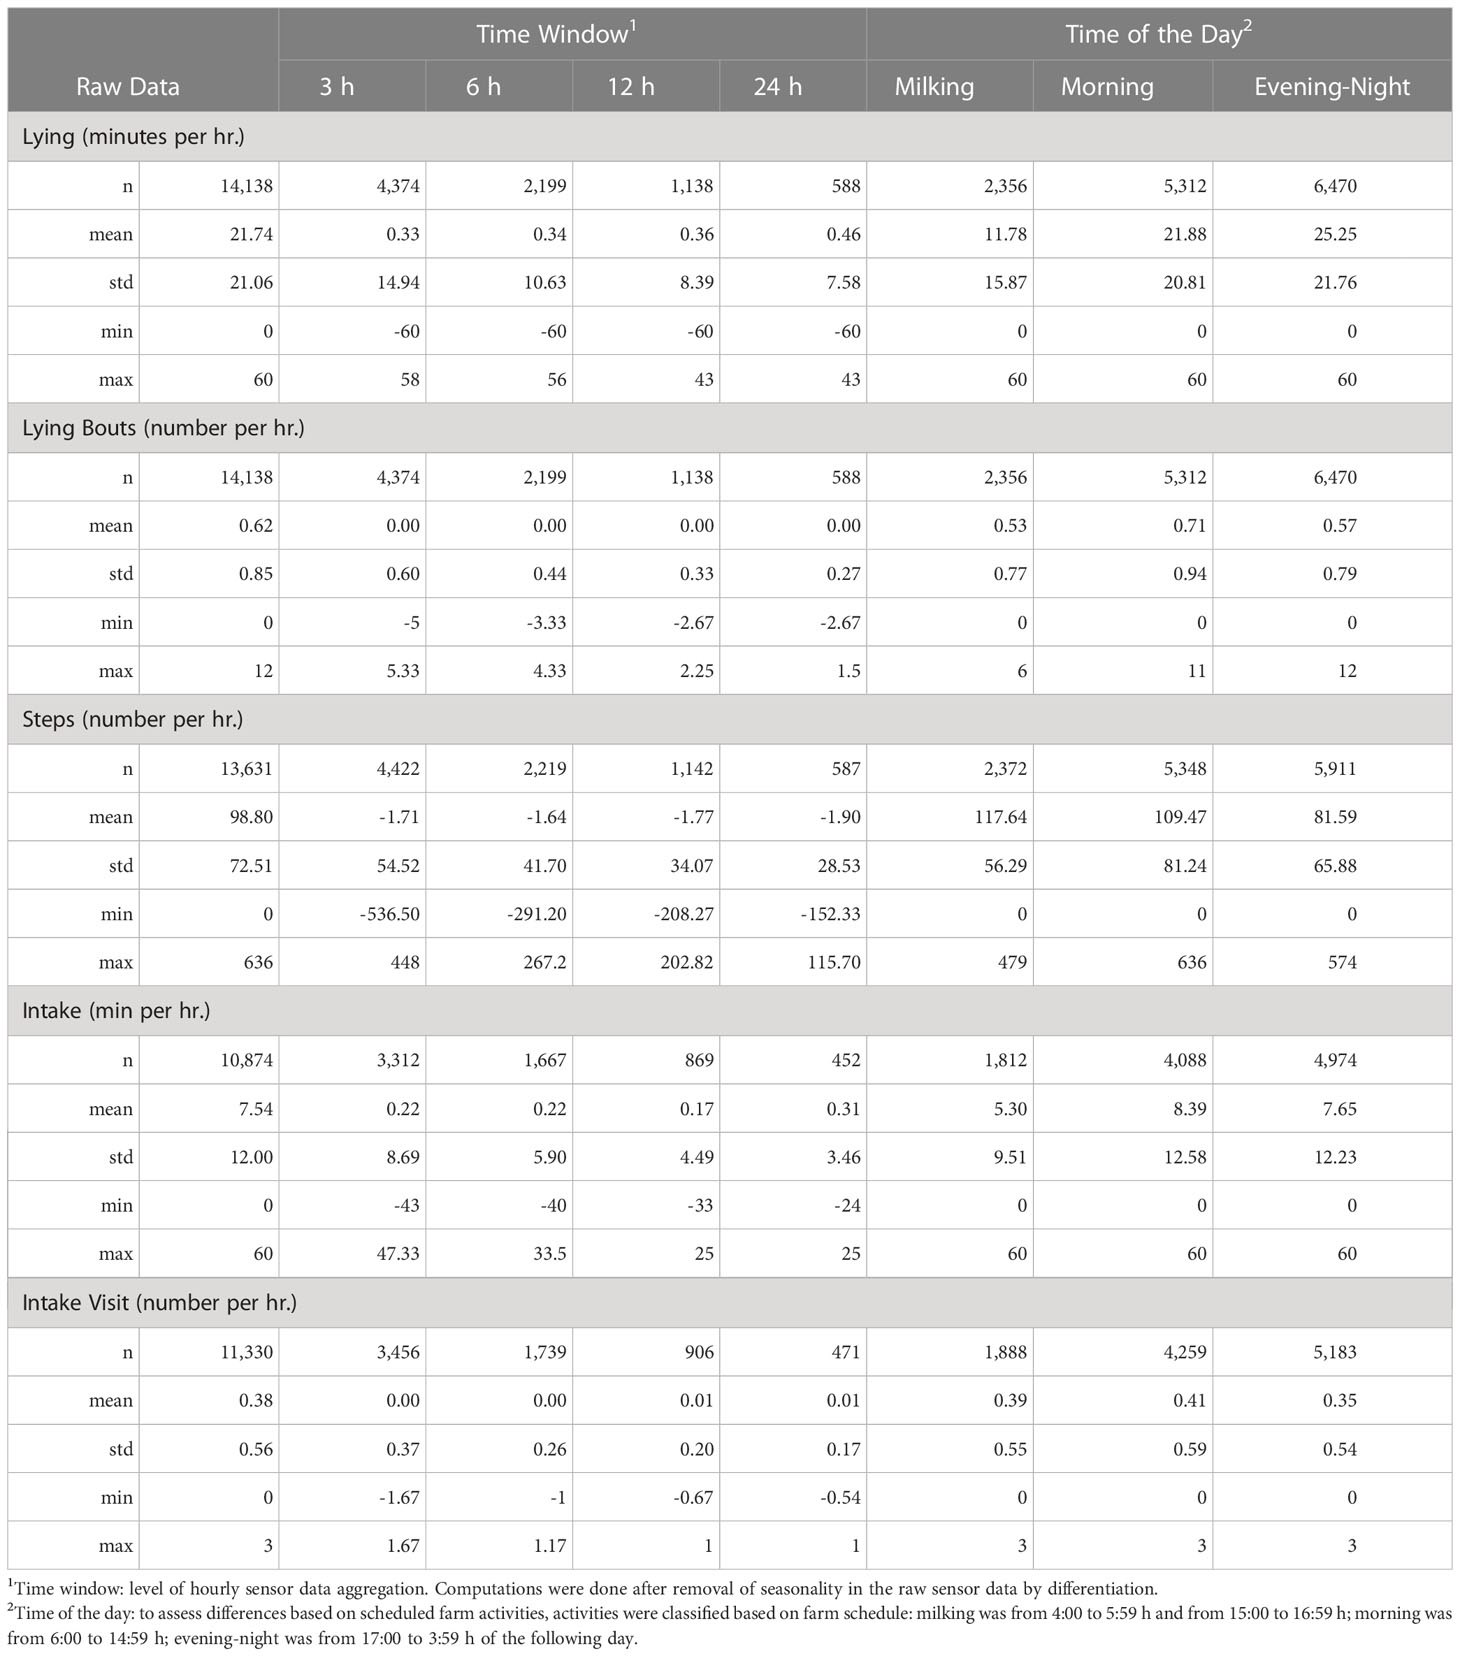
Table 2 Descriptive statistics for the five behavior variables measured with a leg-attached 3-axis accelerometer (Trackacow, ENGS, Hampshire, UK).
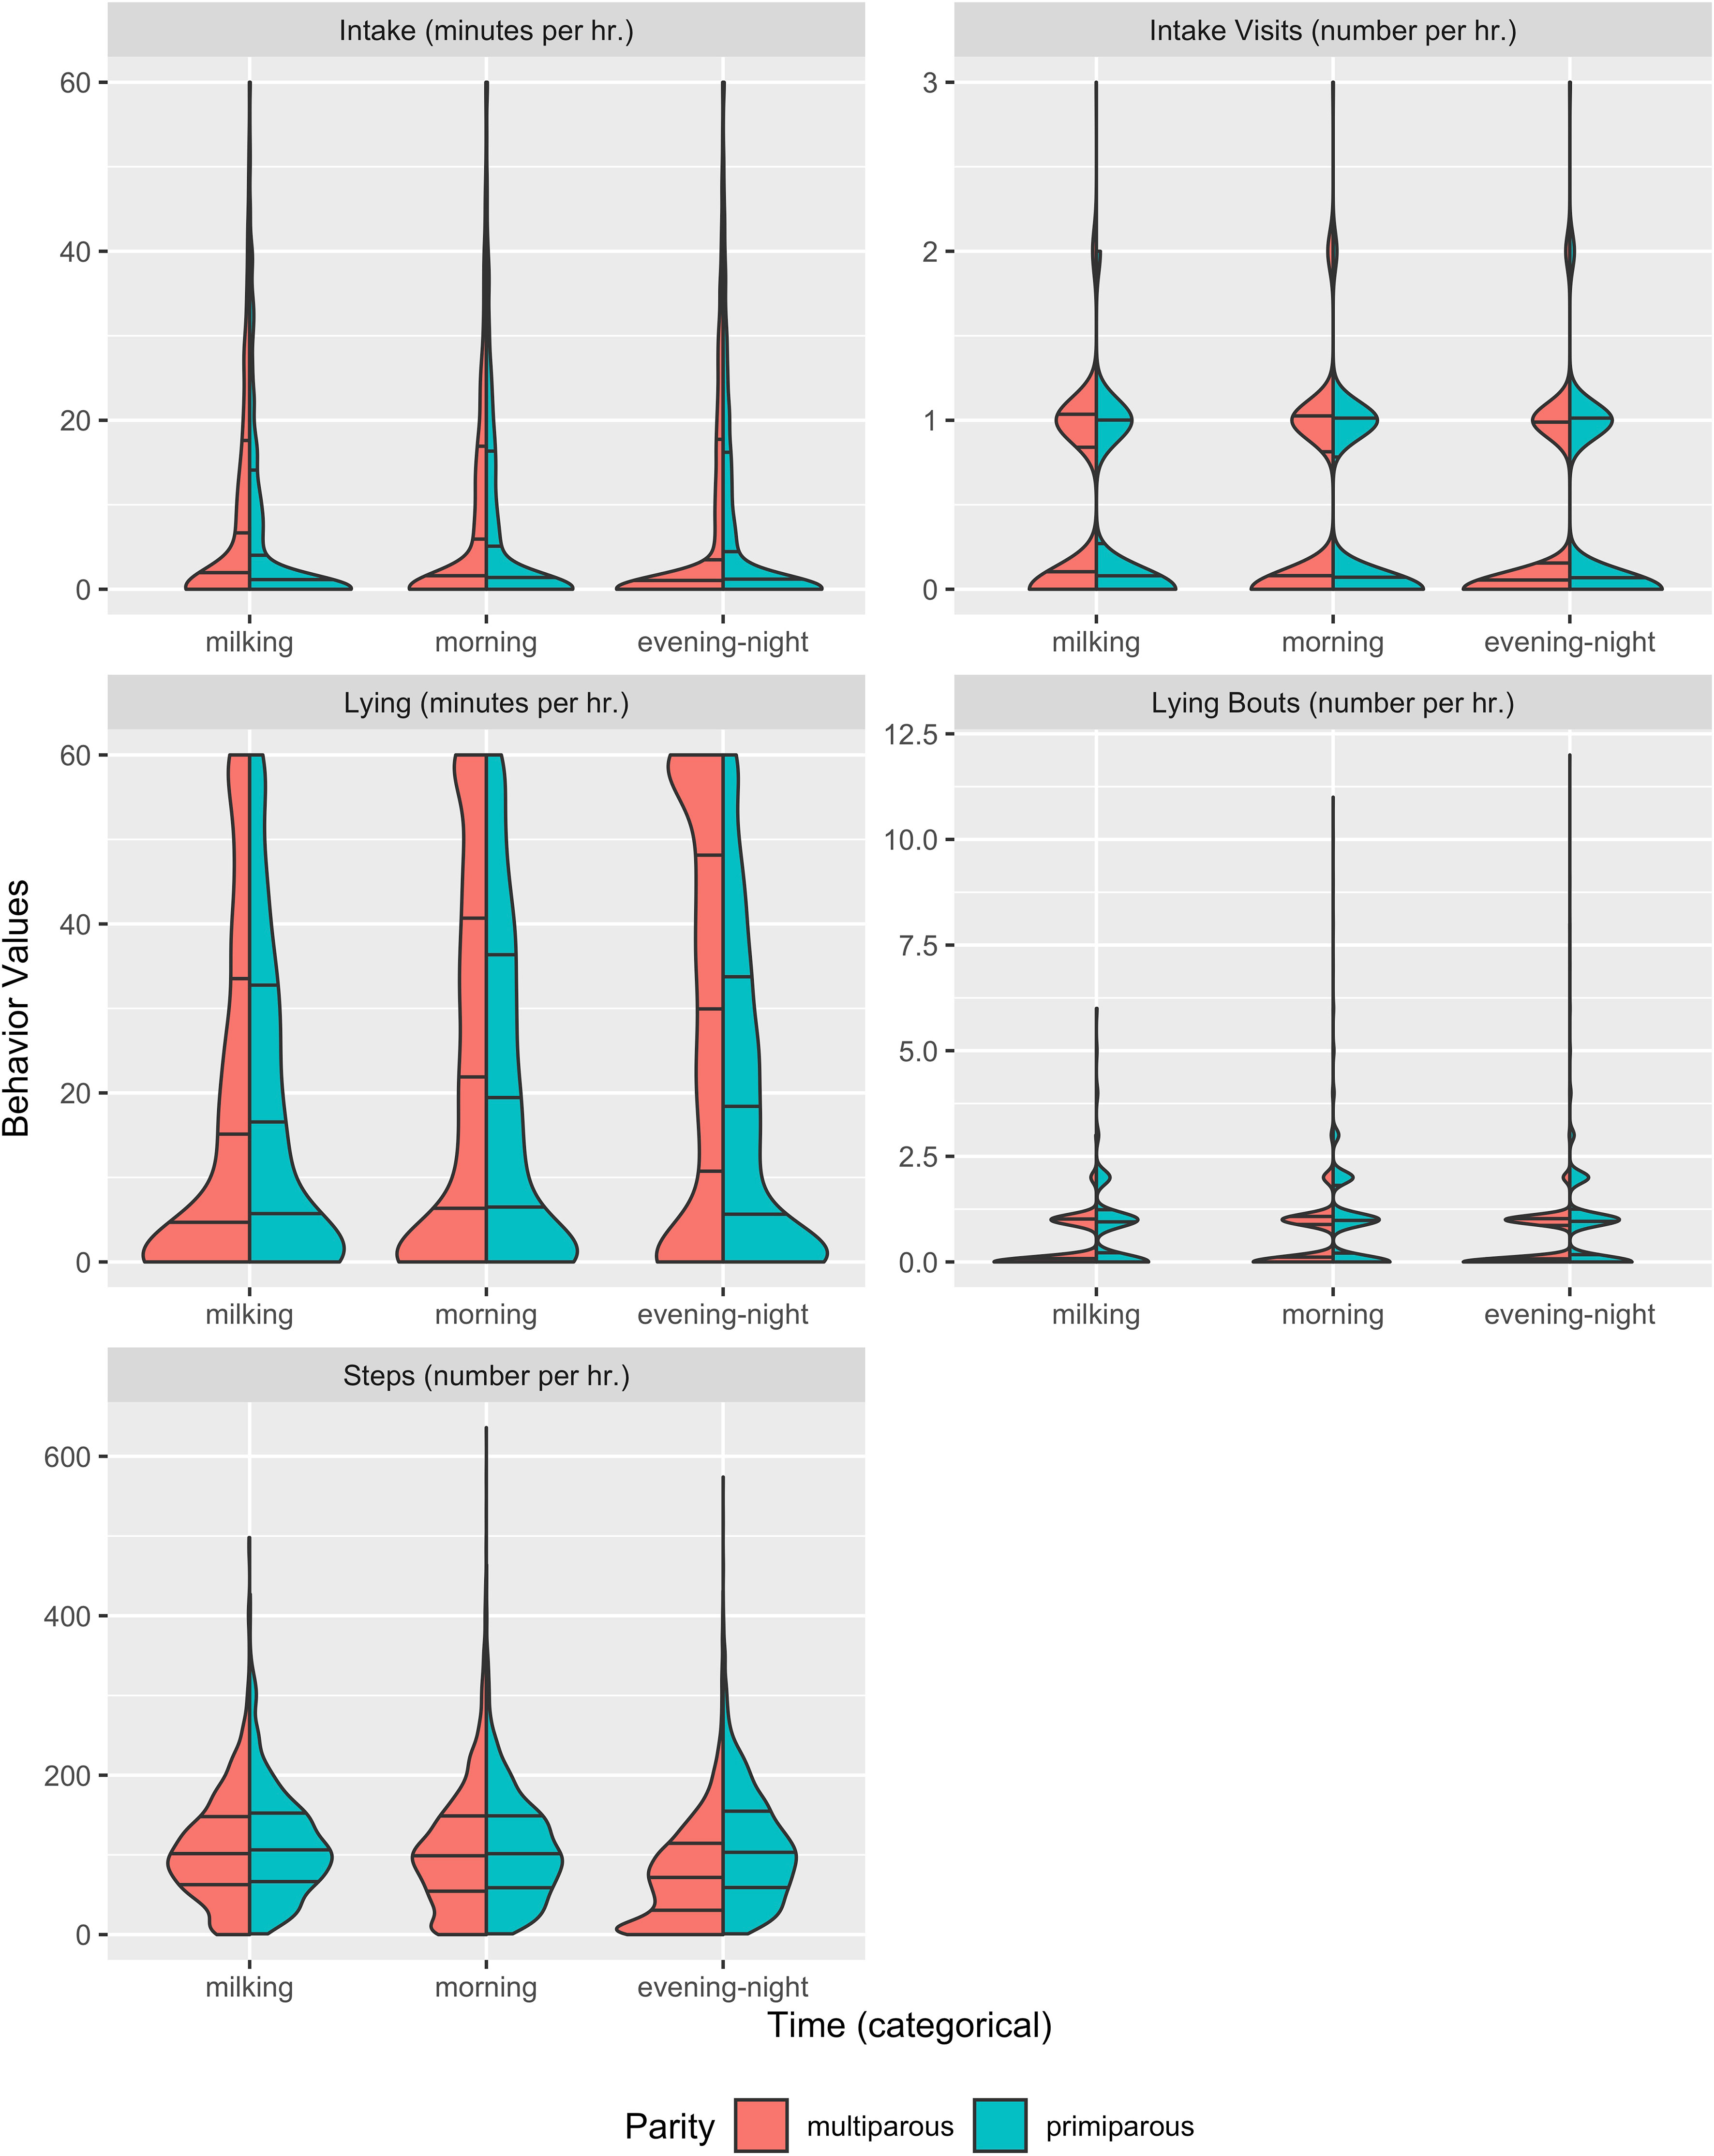
Figure 1 Distribution and density of raw sensor data stratified by parity and time of the day for the five behaviors registered by a leg-attached 3-axis accelerometer (TrackaCow, ENGS, Hampshire, UK). Horizontal lines indicate mean and standard deviation. Milking is from 4:00 to 5:59 h and from 15:00 to 16:59 h; morning is from 6:00 to 14:59 h; evening-night is from 17:00 to 3:59 h in the following day.
Animal behavior changed throughout the study period, with significant changes in the first 3 days post-partum for lying time, lying bouts, and steps (Figure 2). During the first 3 DIM, lying time increased while number of lying bouts and steps decreased. Overall, intake time showed an upward trend throughout the study period. When behaviors were stratified by parity, multiparous cows showed significantly lower number of lying bouts than primiparous cows throughout the study period, while significant differences in number of steps by parity occurred around 7 and 14 DIM. During the whole study period, primiparous cows tended to spend less time lying down with greater number of steps than multiparous cows. When looking at the variability of each behavior throughout the 24 hours of any given day, lying time and steps had inverse trends, with greater number of steps during milking times and at 10:00 h, time at which lying bouts were also the greatest (Figure 3). Intake and intake visits showed similar trends, with greater values right after milking times. Differences by parity were observed for lying bouts throughout the day, while differences by parity regarding lying and steps were observed during the evening-night hours, when multiparous spent more time lying down and took fewer steps than primiparous.
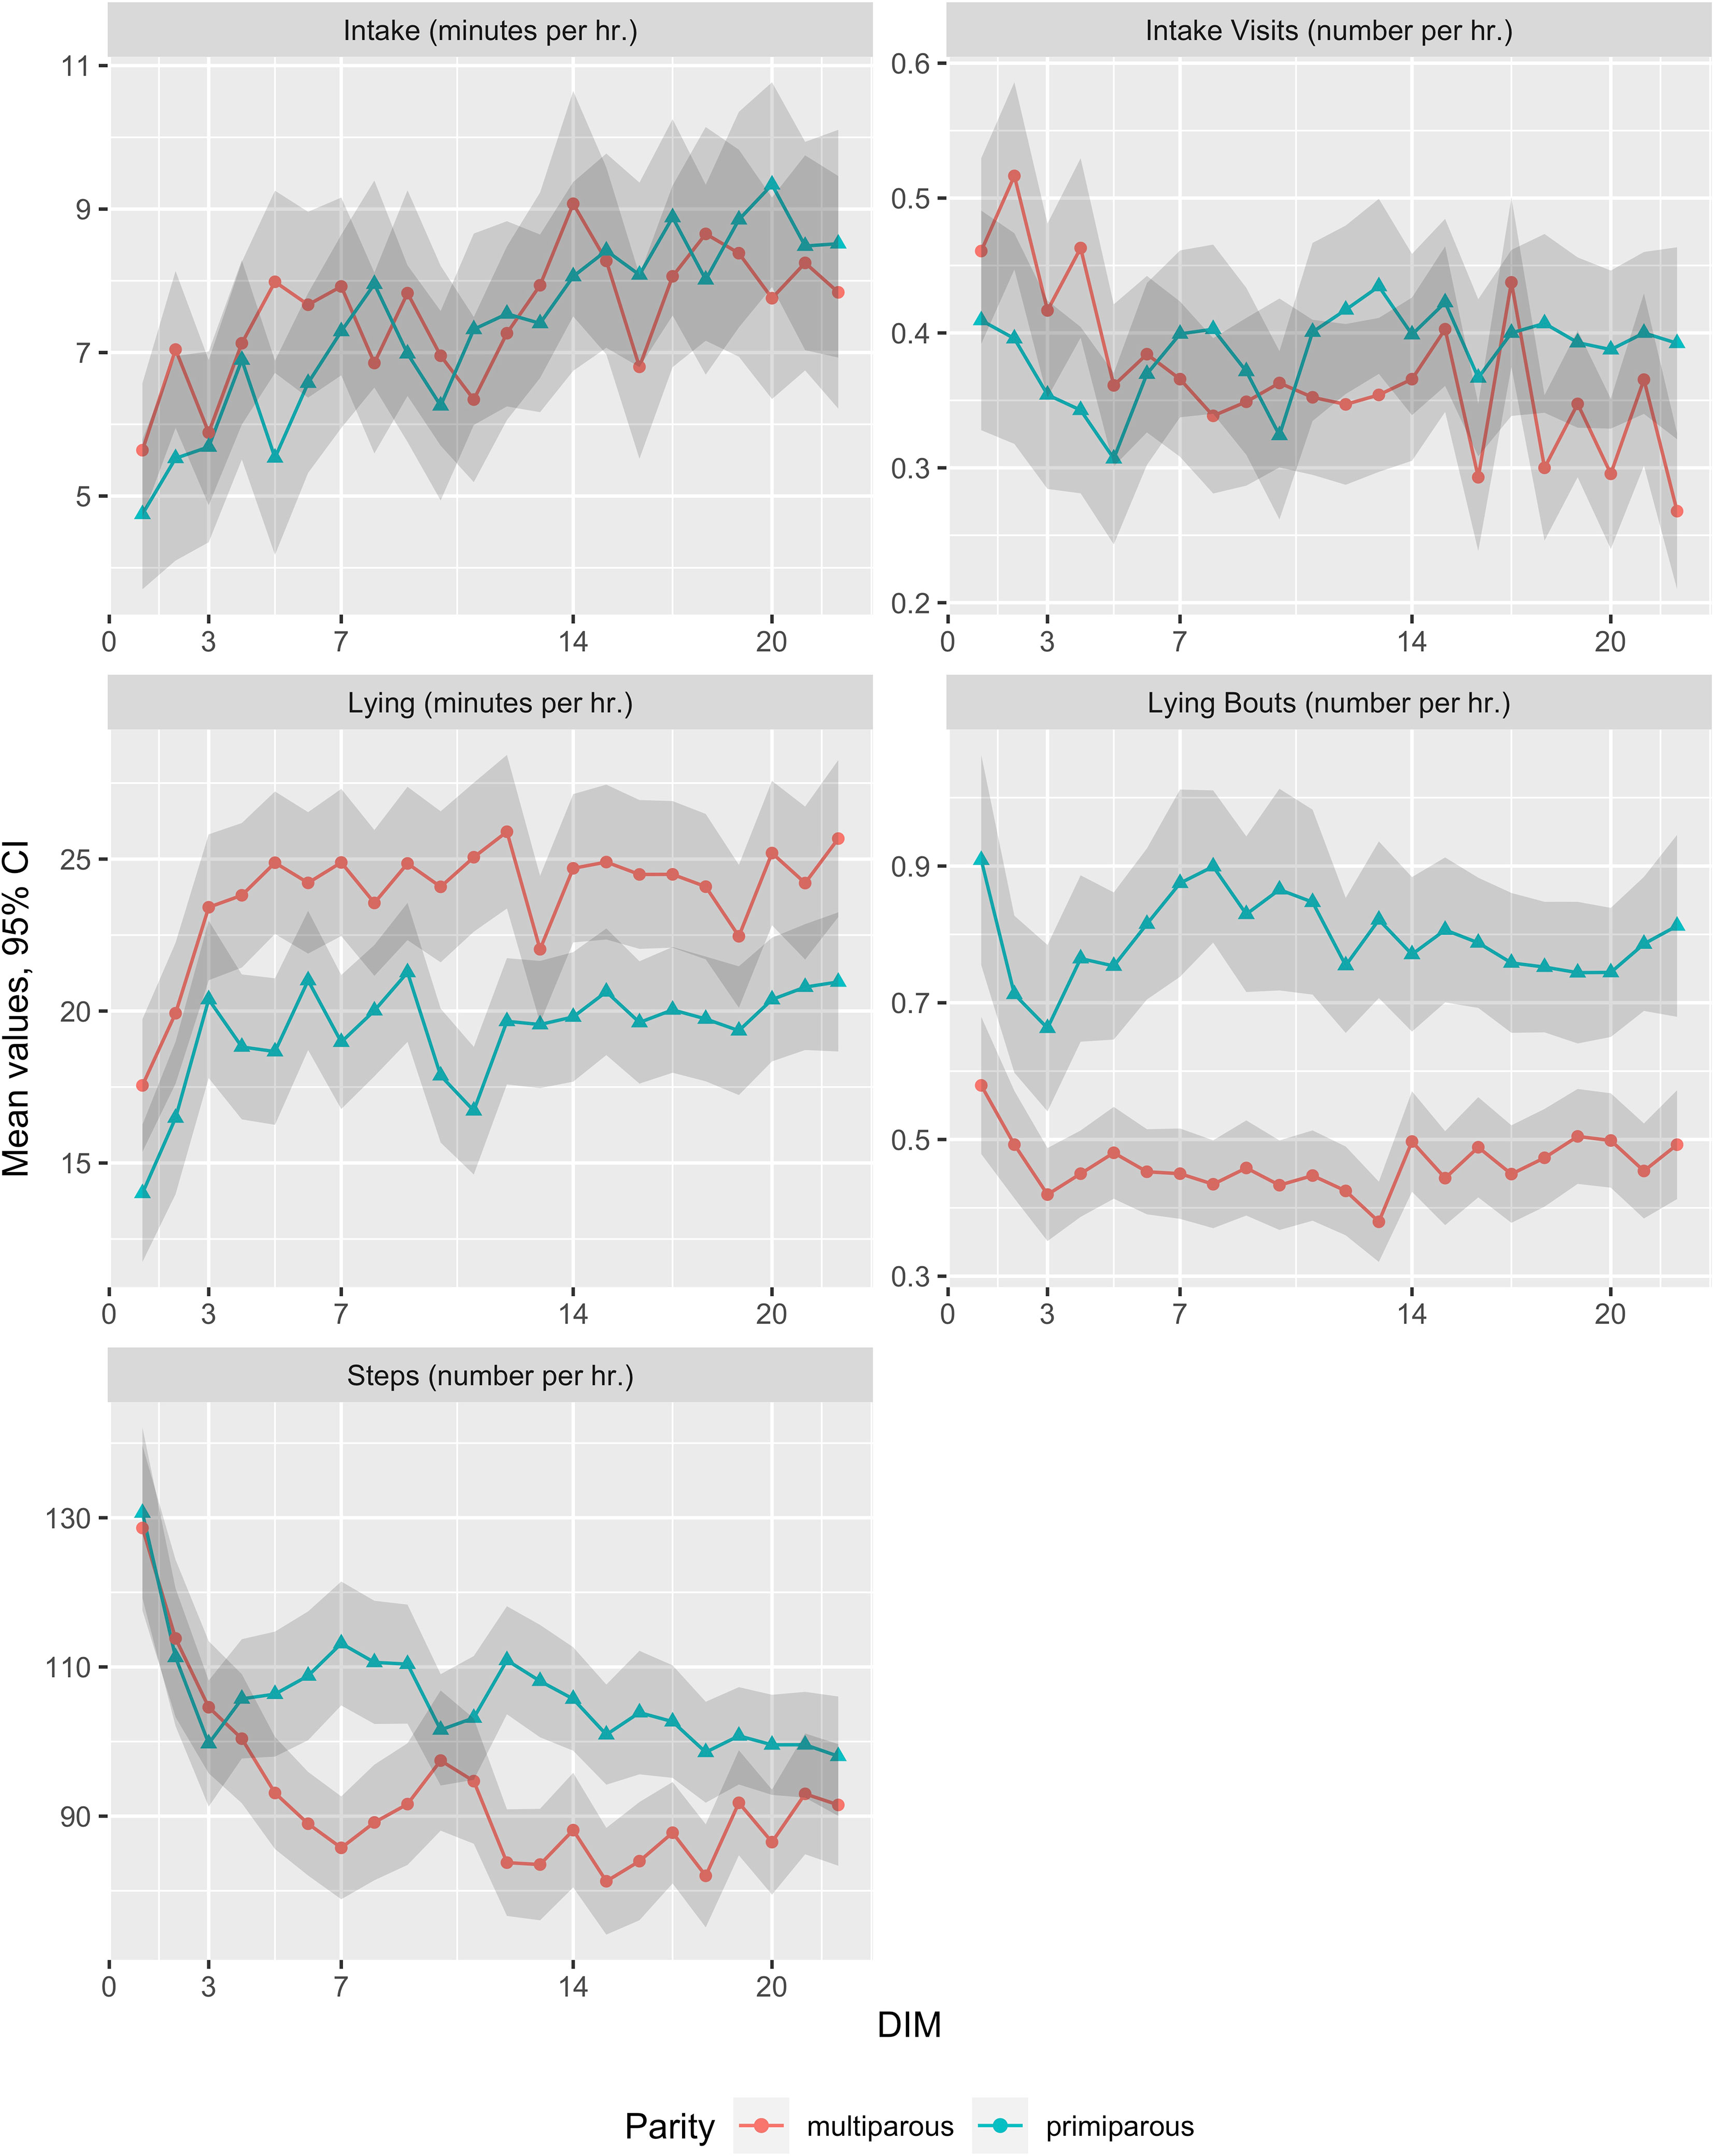
Figure 2 Mean raw sensor data and 95% C.I. for the mean by days in milk (DIM) stratified by parity for the five behavior variables measured with a leg-attached 3-axis accelerometer (TrackaCow, ENGS, Hampshire, UK).
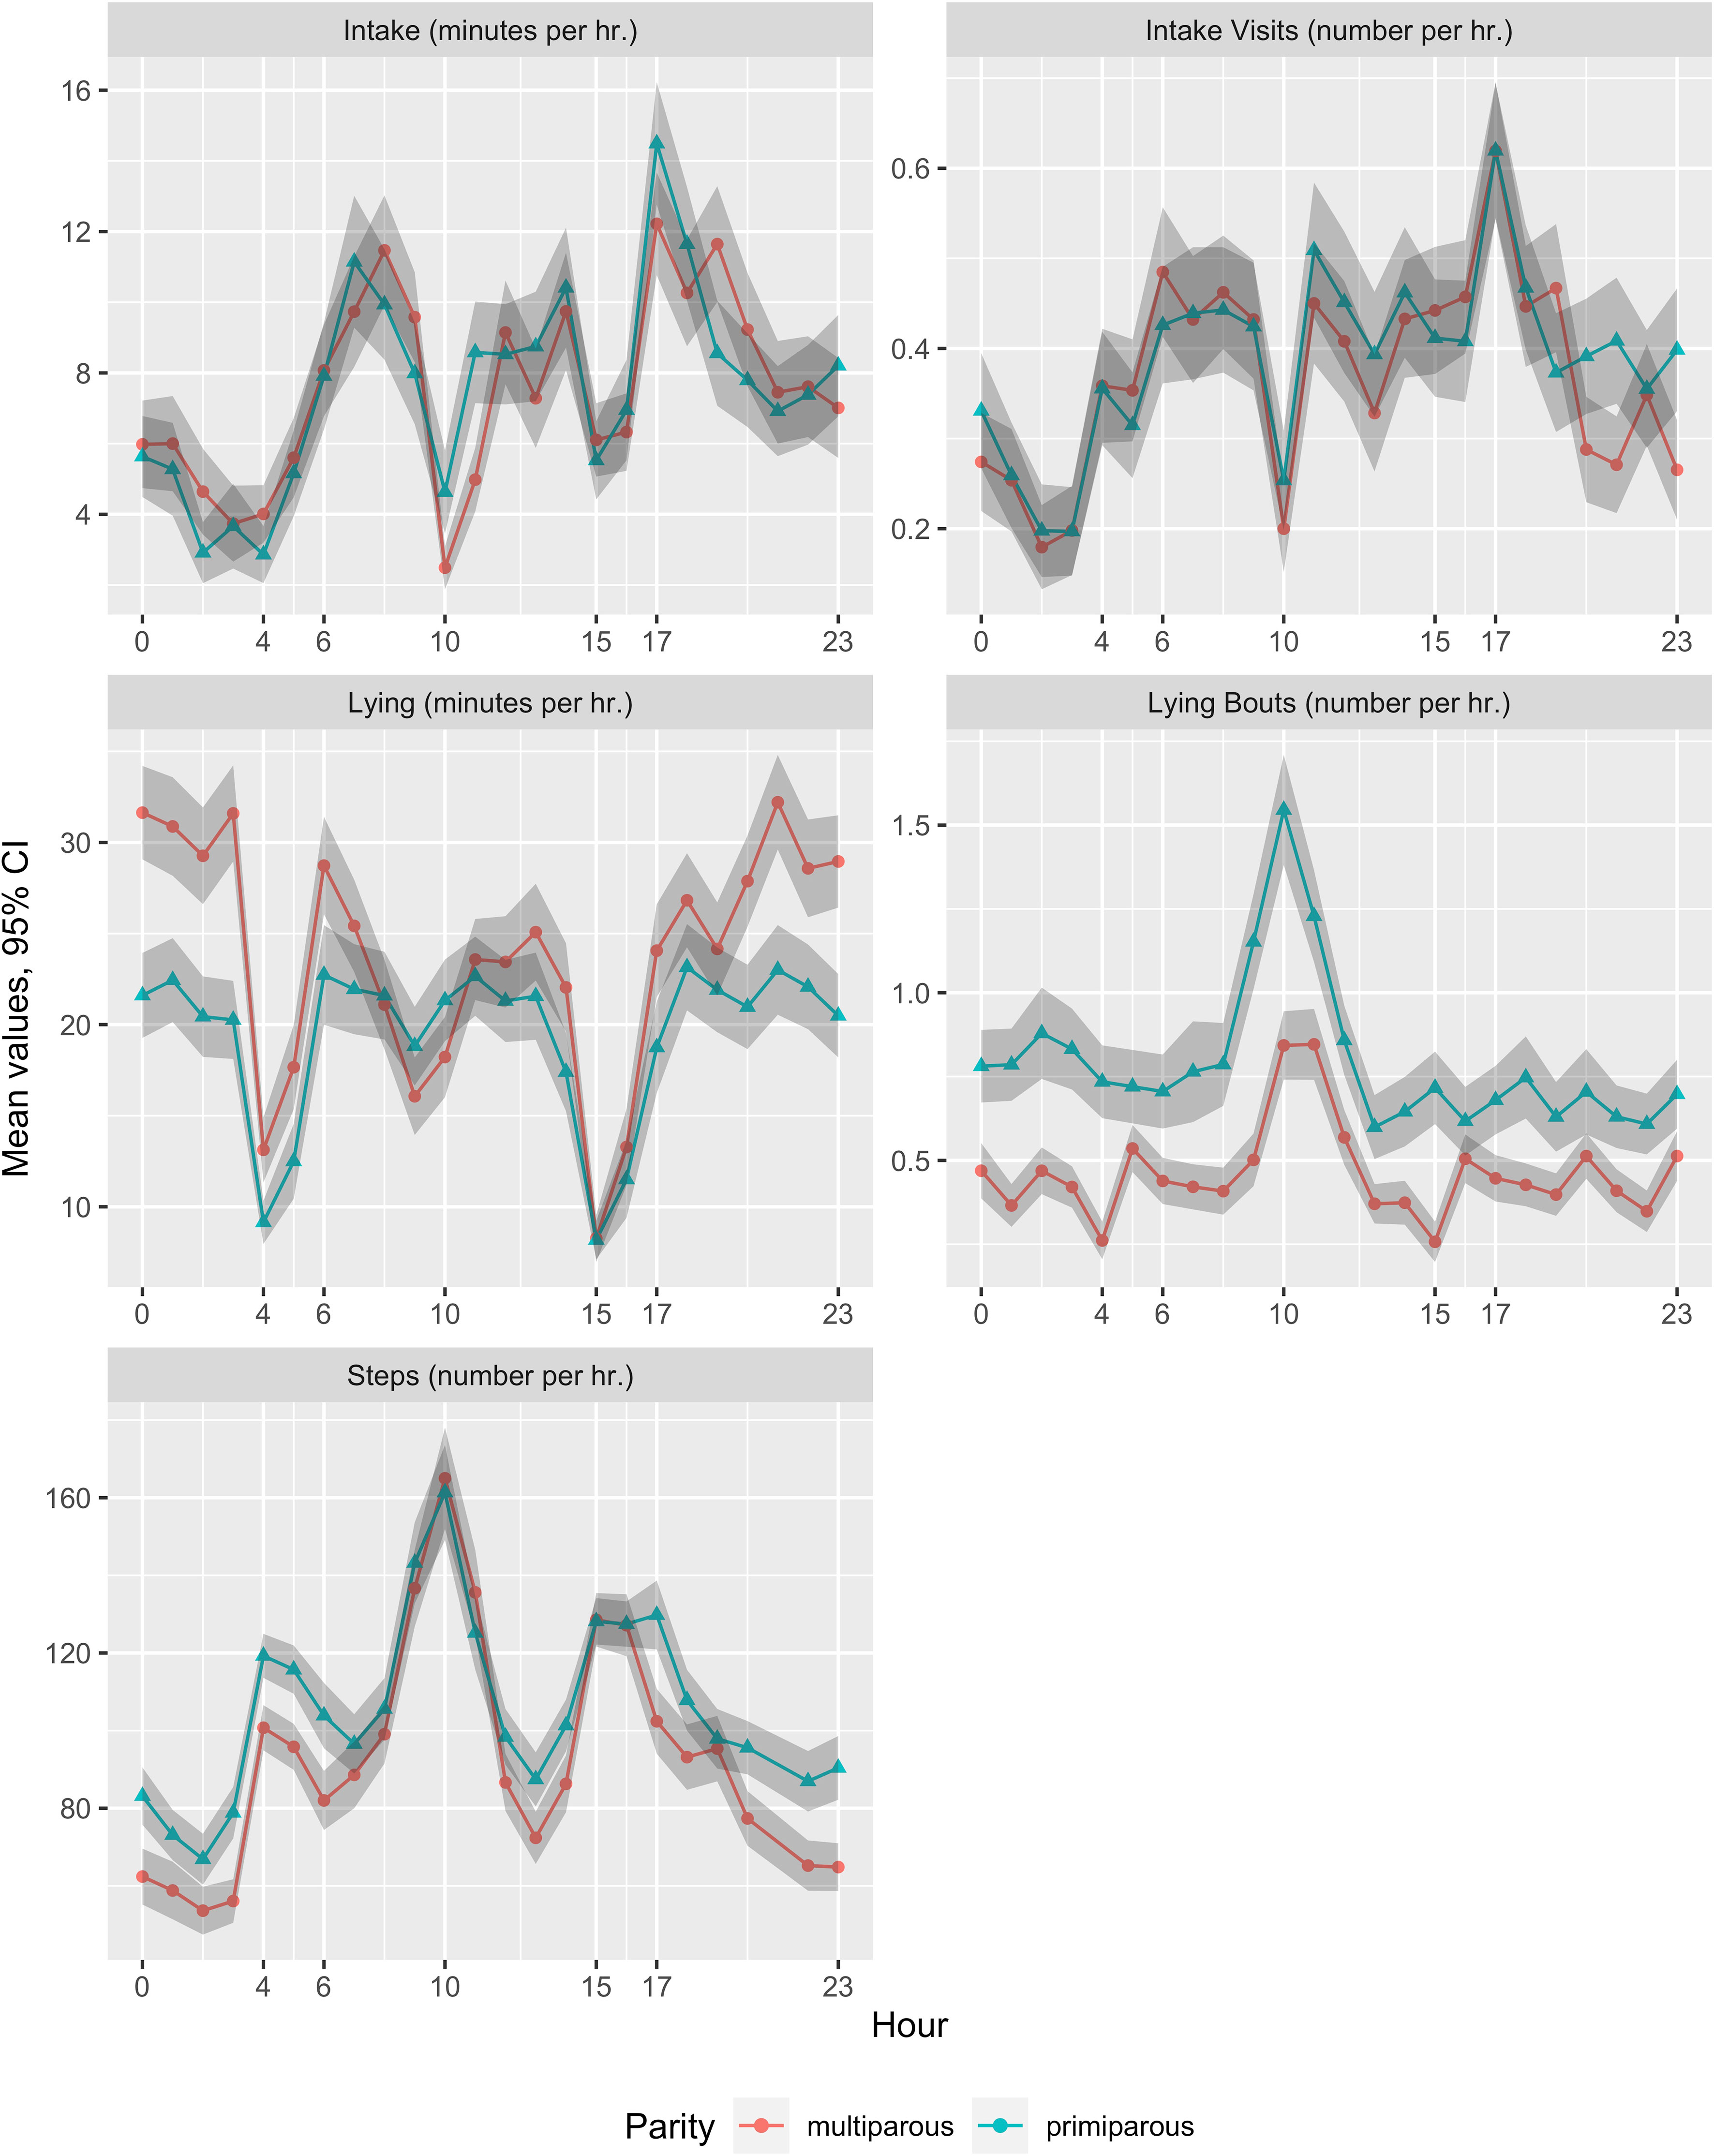
Figure 3 Mean raw sensor data and 95% C.I. for the mean within 24 hours for any given day of the study period stratified by parity for the five behavior variables measured with a leg-attached 3-axis accelerometer (TrackaCow, ENGS, Hampshire, UK).
To further explore the changes of the different behaviors across the study period, we also looked at the variation for any given 24-hour period for different postpartum periods: convalescent (from parturition to 3 DIM), first week (4 to 7 DIM), second week (8 to 14 DIM), and third week (15 to 21 DIM). No significant differences were observed across the different periods, however, intake and lying tended to be greater while steps tended to be lower during the third week compared with the convalescent period. Such trends became unnoticeable during milking times and, in some cases, when cows were locked in their pens for health checks at 10:00 h (Figure 4).
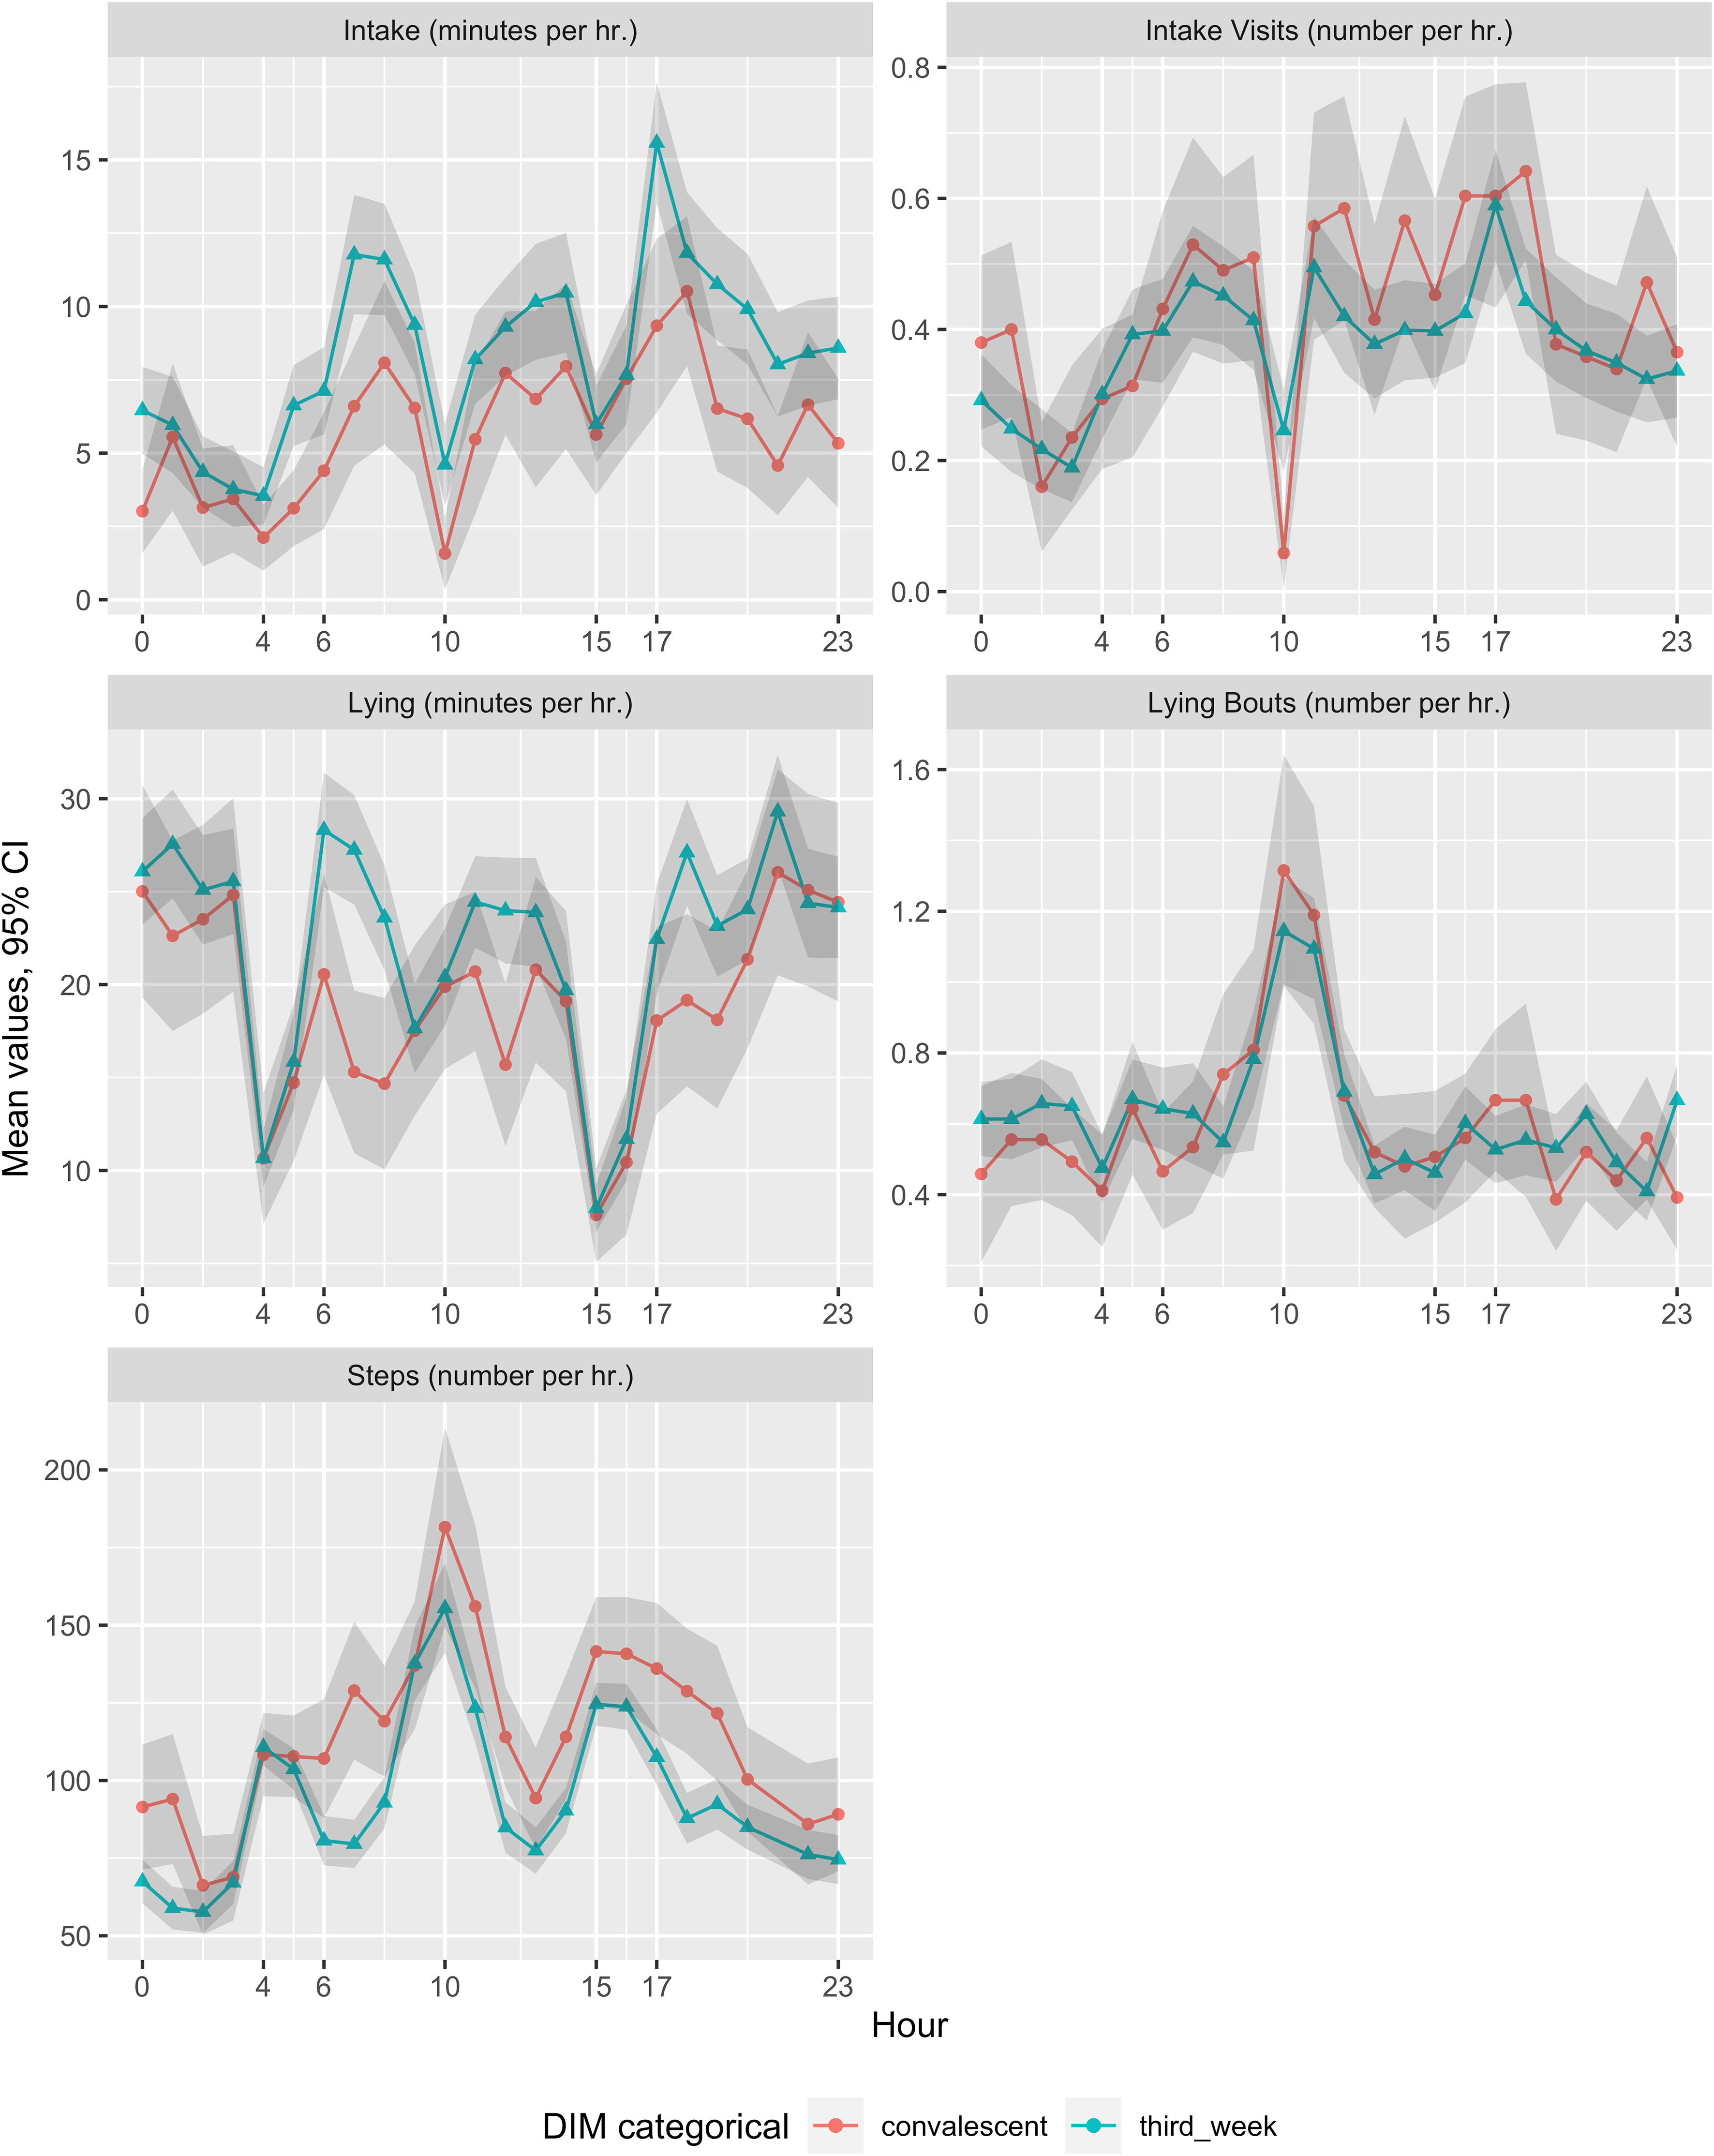
Figure 4 Mean raw sensor data and 95% C.I. for the mean for each behavioral variable measured with a leg-attached 3-axis accelerometer (TrackaCow, ENGS, Hampshire, UK) in a 24-hour period stratified by parity and days in milk (DIM) categorized as convalescent (parturition to 3 DIM), first week (4 – 7 DIM), second week (8 – 14 DIM), and third week (15 – 21 DIM). Only convalescent and third week are shown for comparison purposes.
3.3 Performance comparison of three ML classifiers
A total of 1,386 models were fitted representing all possible combinations of ML algorithm (k-NN, RF, SVM), behavior (lying, lying bouts, steps, intake, intake visit), time window (3, 6, 12, 24 h), time-lag (between 3 and 72 h before any given event), time of the day (all_day, evening-night), and parity (primiparous, multiparous). We only fitted models for each parity in those behaviors where differences between primiparous and multiparous have been observed (lying, lying bouts, steps). To select the best models, 5-FCV F1 score was used for comparison across all cut-offs (20, 30, 40%).
To assess the effect of farm scheduled activities on ML performance, we compared the distribution of the 5-FCV F1 score for each classifier. Our results showed that, for all three classifiers, higher F1 scores were obtained when all sensor data were used regardless of the time of the day (all_day models) and using the 20% cut-off. Random forest had the highest and most consistent F1 scores across multiple time windows and time-lags, followed by k-NN and SVM (Figure 5). Detailed performance metrics can be found in the supplemental materials for all models.
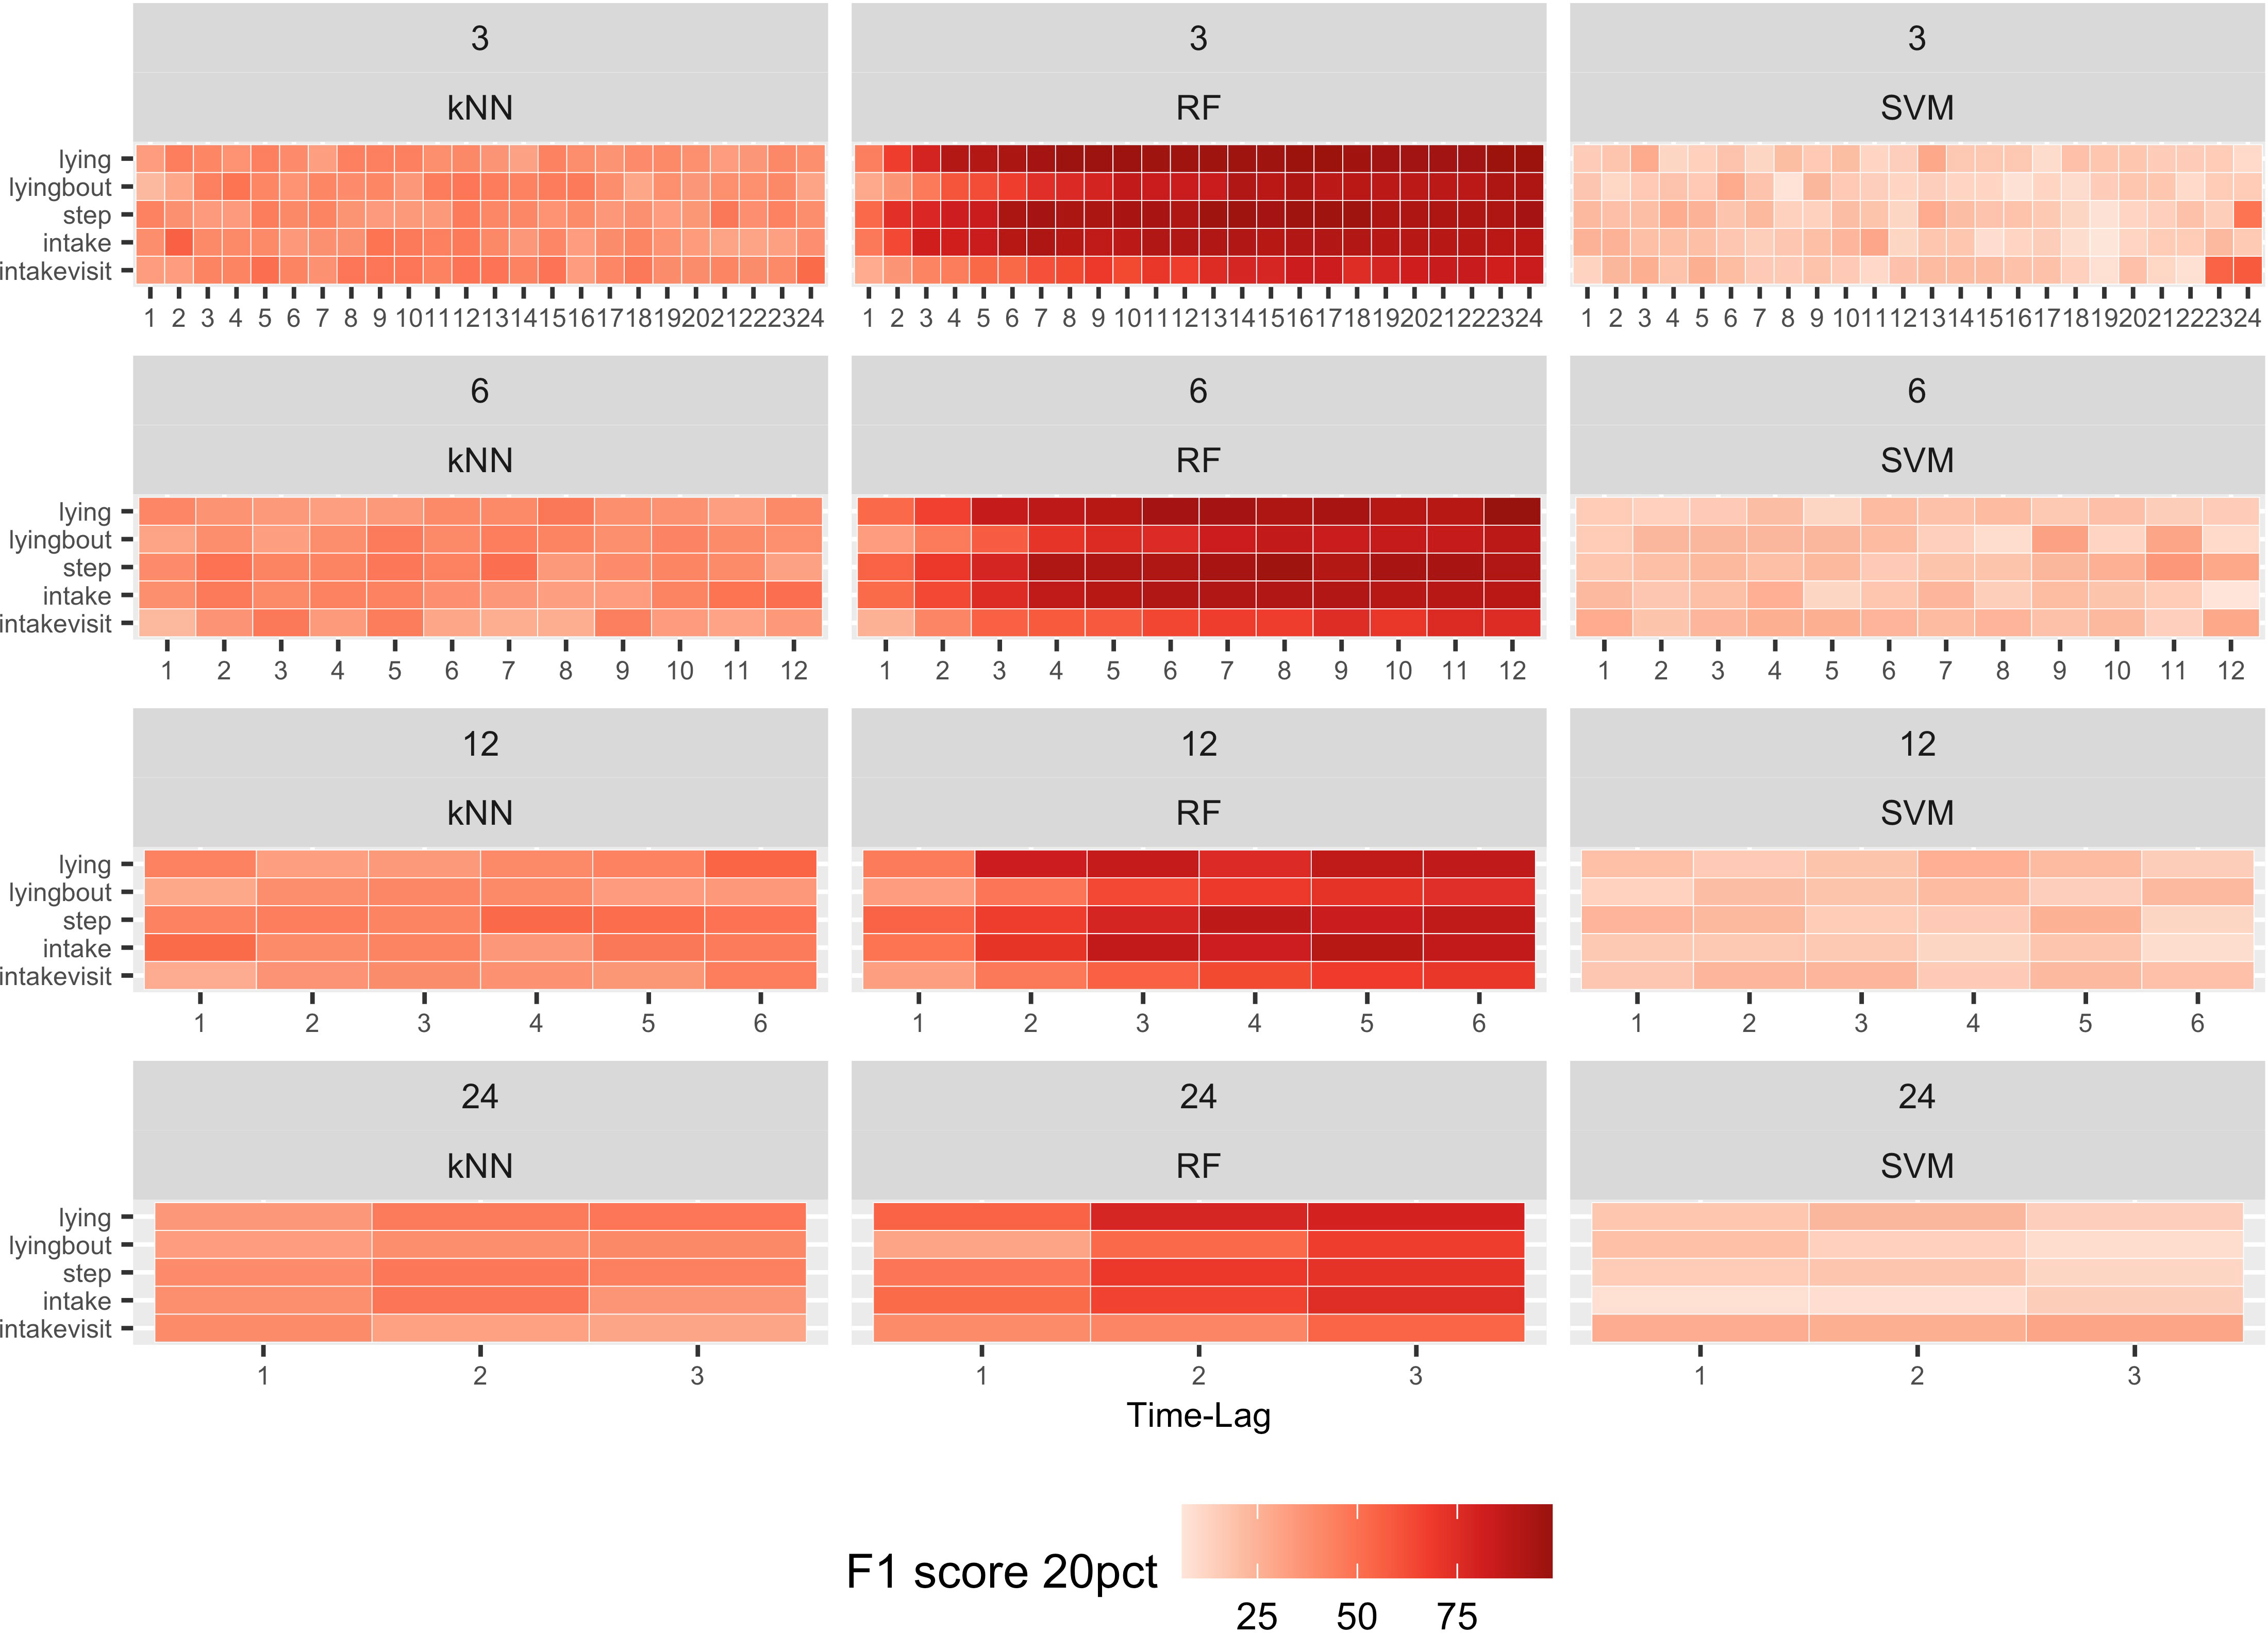
Figure 5 F1 scores (%) using the 20% highest class probabilities as cut-off when sensor data registered by a leg-attached 3-axis accelerometer (TrackaCow, ENGS, Hampshire, UK) were aggregated using time windows of 24, 12, 6, and 3 hours. F1 scores are shown for those models where all sensor data were used to fit the models and parity was not taken into account. F1 scores are shown for different time-lags and for each one of the classifiers: k-nearest neighbors (k-NN), random forest (RF), and support vector machine (SVM).
To manage the large number of models fitted in this study, we further identified the best models for each ML classifier based on an upper quartile F1 score at the 20% cut-off for all_day models. For RF, the upper quartile F1 scores were between 92.86% and 100%, while for k-NN they were between 44.94% and 63.16%. In contrast, SVM had lower F1 scores, with the upper quartile values between 23.26% and 65%. Those behaviors for which separate models were fitted by parity, higher number of models for primiparous cows ranked in the top quartile of the F1 score distribution (20% cut-off and RF classifier).
3.4 Optimal time windows and time-lags for best behavioral variables
Our results confirmed that, among the three classifiers, RF had the best performance. As the level of sensor data aggregation became smaller (3- and 6-hour time windows), a greater number of behaviors had slightly higher F1 score values and ranked in the upper quartile for each ML classifier. However, when data were aggregated using 24-hour time window , the predominant behaviors were lying and intake visit when using k-NN or SVM. When sensor data were aggregated using 12-hour time window , steps were the predominant behavior, followed by intake and intake visit using k-NN and SVM classifiers. When sensor data were aggregated using 6- or 3-hour time windows, lying and steps were the predominant behaviors when RF was used. In contrast, for the same time windows, intake visit was the predominant behavior when k-NN or SVM were used, while lying was the least predominant behavior (Figure 6). For those behaviors for which separate models were fitted by parity, best time windows were 3-, 6-, or 12-hours, and best time-lags were those corresponding to all sensor data up to 25 – 72 hours before a given event.
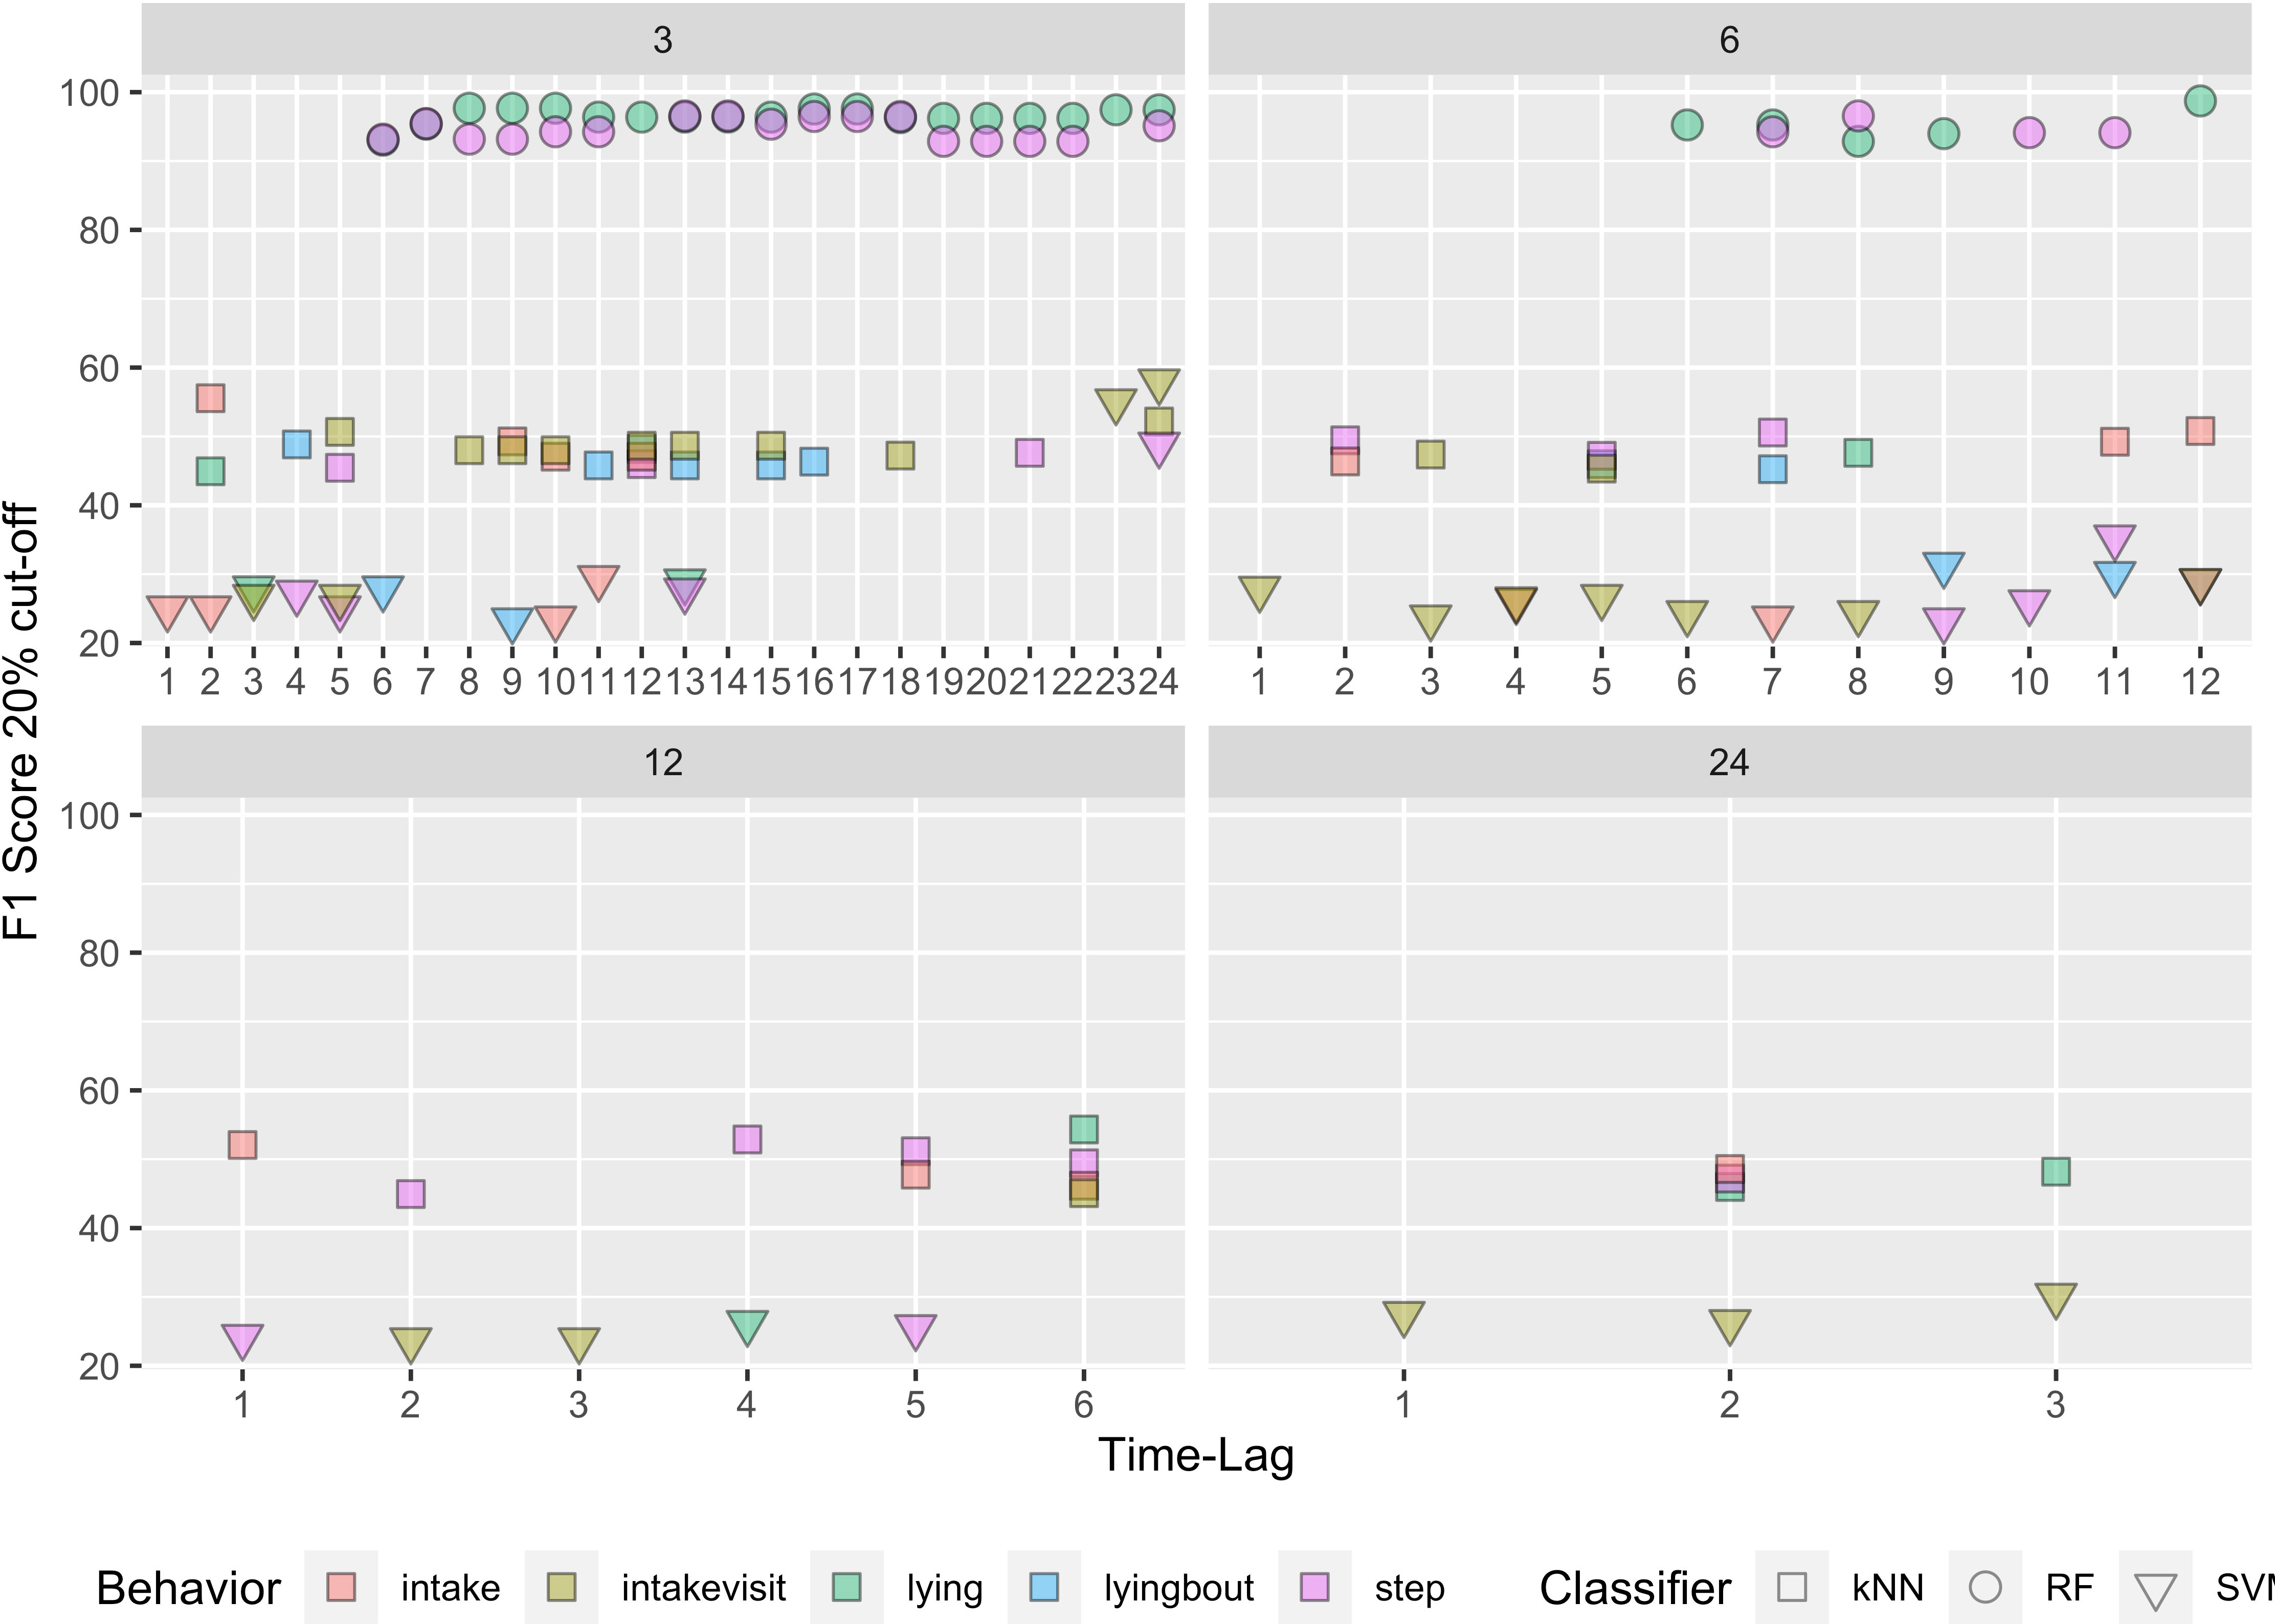
Figure 6 Distribution of F1 scores (%) at the 20% cut-off from the upper quartile by behavior and classifier when sensor data registered by a leg-attached 3-axis accelerometer (TrackaCow, ENGS, Hampshire, UK) were aggregated using 24-, 12-, 6-, and 3-hour time windows, and sensor data from all day were used. F1 scores are shown for different times-lags and for each one of the classifiers: k-nearest neighbors (KNN), random forest (RF), and support vector machine (SV).
Our study found that RF showed the best balance between high F1 score values and consistency regarding the number of time-lags a given behavior ranked amongst the best models. Best results were obtained when sensor data were aggregated using 6- or 3-hour time windows. For time window , best models were found between 31 to 72 hours before the event (time-lags from 6 to 12). Similarly, for time window , the best models were found between 16 to 72 hours before the event (number of time-lags from 6 to 24) (Figure 6). Tables 3 and 4 show the performance metrics for the selected best models at two different cut-off points (20 and 30%). For the selected time-lags and the 20% cut-off, Se and PPV increased as we increased the time-lags, with PPV always higher than the Se. However, adding more time steps did not always improve model performance.
Table 3 Results from models’ performance (%) where random forest (RF) classifier was used on sensor data registered by a leg-attached 3-axis accelerometer (TrackaCow, ENGS, Hampshire, UK) from all day were aggregated using a 6-hour time window and the 20% cut-off as decision threshold after ranking the classification probabilities from high to low.
Table 4 Results from model’s performance (%) where random forest (RF) classifier was used on sensor data registered by a leg-attached 3-axis accelerometer (TrackaCow, ENGS, Hampshire, UK) from all day aggregated using time windows of 3 hours and the 20% cut-off as decision threshold after ranking the classification probabilities from high to low.
For example, the PPV for lying behavior and time window peaked at time-lag 8 (100% PPV) and plateaued afterwards. Similarly, the PPV for step and time window peaked at time-lag 8 (100% PPV), decreasing afterwards. For behavior steps, the highest F1 scores were obtained at 1.5 – 2 days before any given event (13 time-lags and 8 time-lags corresponding and time windows, respectively). In contrast, the highest F1 score for lying time was found at time-lags 8 and 6 for time windows (24 hours before an event) and (36 hours before an event), respectively.
Using the estimated predicted probabilities, we compared the metritis events identified by RF with the clinical data. We found that the number of missed events ranged between 1 and 4, increasing as we increased the number of time steps before the health event, and none of them were two consecutive missed events, this is, the metritis had either been diagnosed before, or it was diagnosed at the following metritis evaluation.
4 Discussion
In this study, we developed a predictive model for early detection of metritis events using behavioral data collected from a leg-attached accelerometer. The study compared the performance of three ML classification algorithms to develop the predictive model, using F1 score to compare across models. We also studied the appropriate time windows and time-lags for optimal model performance, taking into account the potential effect of farm scheduled activities and decision thresholds on classifier performance.
4.1 Sensor data
Our results confirmed that behavior data can be highly variable. From the results summarized in Table 2 stands out that cows spent, on average, 8.7 hours/day lying down (21.74 + 21.06 min/h), had 14.88 lying bouts per day (0.62 + 0.85 per h), and took 2,371.2 steps per day (98.80 + 72.51 per h). Our findings are similar to those found by others, although mean lying time was found to be in the lower of what is recommended (Bewley et al., 2010; Gomez and Cook, 2010). Differences in the mean values across studies could be due to differences in the devices used or the average DIM of the animals. Most of the studies that report descriptive statistics of different behaviors are validation studies where cows across the whole lactation were used, increasing the average DIM of the animals in the study. This is particularly relevant since cow’s behavior is constantly changing postpartum. Furthermore, differences in management practices such as high frequency feed delivery will translate into differences in lying time and lying bouts across studies (Mattachini et al., 2019).
In this study, animal behavior changed according to DIM. During the first 3 DIM, lying bouts and steps behaviors had a downward trend while lying time had an upward trend. Overall, intake had an upward trend for the whole study period. We also found that multiparous had a lower number of lying bouts and steps than primiparous, while the amount of time lying was greater than that found in primiparous, particularly during evening-night hours. The trends observed during the study period agree with those found by other authors. Lying time has been reported to decrease in the days following parturition, with increasing lying time as DIM increased (Chaplin and Munksgaard, 2001; Bewley et al., 2010). Udder discomfort or high demand for food have been proposed as explanations for this trend (Chaplin and Munksgaard, 2001). Feeding behavior has been found to decrease by 35% over the 2 weeks before calving and to increase by 99% over the 3 weeks following parturition (Urton et al., 2005). Differences by parity regarding lying bouts, lying time, and number of steps have been found in other studies, where primiparous cows have shown increased lying times among grazing dairy cows (Sepúlveda-Varas et al., 2014), as well as in free-stall housed cows (Vasseur et al., 2012; Barragan et al., 2018; Neave et al., 2018). In contrast, multiparous cows had greater lying times in our study, a finding supported by Piñeiro et al. (2019). It is not clear why different studies yield contradictory results for the interaction between parity and lying time, but it is possible that different findings may be attributed to inflammatory response differences by parity (Humblet et al., 2006; Piñeiro et al., 2019), or to social dominance dynamics between primiparous and older cows (Sepúlveda-Varas et al., 2014). Nevertheless, we found that classifier performance for lying time by parity was not superior to that one in which data from all cows were pooled together.
The studied behaviors also changed according to the time of the day. When behaviors were observed in a 24-hour period, cows showed inverse trends regarding lying and steps. Lying time is a resting state that was higher during night hours, followed by the hours between morning and afternoon milking. In contrast, behavior steps is an activity state that was higher during milking times and at 10:00 h, time at which cows were being moved to be treated or checked. These trends are supported by circadian cycle research (Ruckebusch, 1972) and similar findings have also been reported by other authors, although small differences can be found across studies due to differences in milking times, feeding management, or environmental temperature (Overton et al., 2002; DeVries and von Keyserlingk, 2005). Differences by parity were only observed during the evening-night hours, a finding that could support the hypothesis that when left alone by farm personnel, cows may have greater opportunities to express their natural behavior. Therefore, restricting the use of sensor data to the evening-night hours could improve classifier performances. Our findings regarding model performance comparing all_day versus evening-night models did not support this hypothesis. Nevertheless, future studies should evaluate classifier performance under different scenarios on a case basis, as there are some behaviors that may not be worth considering given certain times of the day such as milking times, where animals will not lay down or eat.
To better understand the dynamics of cow behavior throughout the study period, we looked at the behaviors in a 24-hour period when DIM were categorized. Based on our results, we did not find significant differences across mean values for each hour of the day. However, based on our results, we propose that the inclusion or exclusion of data from the first 3 DIM should be routinely evaluated in these types of studies, since results may change depending on the type of sensor device used and the nature of behavioral data being collected.
4.2 Performance comparison of three ML classifiers
Based on the F1 score distribution and consistency of results at the 20% cut-off, RF had the best performance, followed by k-NN and SVM, with slightly higher F1 scores as the level of time aggregation became smaller, a finding also reported in other studies (Martiskainen et al., 2009). In this study, amongst those models with best performance, k-NN achieved an F1 score with values between 44.94 – 63.16%, while SVM yielded an F1 score between 23.26 – 65.00%. In contrast, the best RF models had F1 scores in the range between 92.86 – 100%. Random forest is based on decision trees, a classification method that has been used in the precision dairy farming with great success to study grazing cattle behavior (Williams et al., 2016), to predict fertility and improve heat detection in dairy cows (Caraviello et al., 2006; Vanrell et al., 2014), to predict mastitis (Kamphuis et al., 2010), or to understand complex relationships between metabolic diseases postpartum and culling risk (Probo et al., 2018). Random forest can handle large data sets with a high number of features; however, the decision trees the RF is made of are not intuitive, making it harder to grasp the relationship existing in the input data when compared with other methods.
We also found that, even though intake and intake visit did not yield high F1 scores, SVM and k-NN classifiers performed better with behaviors intake and intake visit while RF performed better with behaviors lying and steps. This supports the idea that some ML classifiers may work better than others for certain behaviors, and alternative ML algorithms for feeding related behaviors measured with Trackacow device should be explored.
4.3 Optimal time windows and time-lags for best behavioral variables
In dairy cattle, increased physical activity is a sign of estrus (Firk et al., 2002) and a sign of sickness behavior when decreased around metritis diagnosis (Liboreiro et al., 2015; Stangaferro et al., 2016a; Steensels et al., 2017). In our study, number of steps had a Se that ranged between 88.37 to 93.33%, PPV between 92.86 and 100%, and F1 score between 90.7 and 96.55%, being these estimates using the 20% cut-off and RF classifier. These results were similar when sensor data were aggregated either every 6- or 3-hour time windows. These performance metrics were greater than those reported by (Mayo et al., 2019) for heat detection, although their sample size was smaller, and they did not use a ranked-based approach to evaluate model performance. Our estimates were also higher than those reported by Stangaferro et al. (2016b), with average Se of 53% and a maximum of 70% Se for those cows with rectal temperature ≥ 40.0°C. However, comparison is not straightforward since performance metrics provided by other authors were for the associations between metritis diagnosis and a health index, computed with proprietary algorithms that combined rumination and activity measured in arbitrary units per day. Furthermore, no values for PPV were reported since no specific disease was provided in the alert generated by their device.
Among behaviors considered as resting state, lying time has a critical role in the production potential and welfare status of dairy cattle. Associated with disease, increased lying time has been found in animals with metritis as a consequence of depression (Barragan et al., 2018), while it has been found to decrease associated with mastitis due to discomfort while lying down (Siivonen et al., 2011). In this study, lying time Se, Sp, PPV, F1 score, and Ac were 87.8 – 97.5%, 98.08 – 100%, 92.31 – 100%, 90 – 98.73%, and 95.94 – 99.49%, respectively, with slightly greater values when sensor data were aggregated using a time window of 6 hours. Our performance metrics are higher than those found in accelerometer device validation studies, with Se, PPV, and Ac of 80%, 83%, and 84%, respectively (Martiskainen et al., 2009), as well as higher than those found using lying time 1 week before calving to predict metritis post-partum, with reported Se and Sp of 75% and 66.67%, respectively (Patbandha et al., 2012).
The number of models that ranked amongst the best ones changed based on the different time windows. Based on our findings, best results were obtained with sensor data aggregated using 6- or 3-hour time windows, being the 6-hour time window slightly better for steps, while the 3-hour time window resulted in slightly better performance for lying bouts. For optimal performance, sensor data from the previous 36 – 72 hours before the event were needed when sensor data with 6-hour time windows were used, although when data were aggregated using 3-hour time windows, data from the previous 18 hours before an event did suffice. This is in agreement with what has been found by other authors: steps have been found to change 2 days before diagnosis of metritis (Steensels et al., 2017), metabolic, or digestive problems (Edwards and Tozer, 2004). Similarly, lying bouts have been found to change 2 to 3 days before metritis diagnosis (Neave et al., 2018; Piñeiro et al., 2019). Nevertheless, the appropriate combination of number of observations used as cut-off, time window, and time-lags should be chosen on a farm case basis and should be dynamically adjusted to reflect changes in the incidence of metritis cases, costs for medical treatments, and cost of missed metritis cases.
4.4 Model generalization
Studying metritis events is challenging due to the multifactorial causes of common diseases during the transition period in dairy cattle. Three weeks before and after parturition, dairy cattle undergo a negative energy balance, which is a risk factor for diseases such as metritis, hypocalcemia, or hyperketonemia (LeBlanc, 2010). There is also no clear ML algorithm that can be used for detecting metritis events, and contradictory findings are found in the literature. It is difficult to generalize feature-based models to unseen data, as causes and incidence of health problems as well as differences in animal behavior often differ between herds. One explanation of differences between farms could be linked to farm-specific factors that have an impact on animal behavior such as differences in feeding and milking times, stall stock density, type of housing system, type of lying material, standing surface, weather and climate (Tucker et al., 2021). Similarly, the use of different metritis scoring systems and diagnostic techniques could result in different findings as those presented in this study. Besides, meaningful model inputs can be hard to identify due to an overall lack of methodological study and reporting of sensor data pre-processing in the literature. It could be possible to overcome the generalization problem by continuously implementing the model on farms, resulting in improved model performance over time. Furthermore, a larger dataset containing more animals and multiple farms may facilitate the extraction of model variables that do not farm-specific.
Overfitting is another common problem in machine learning that impacts the generalization of the models. In fact, better performance at shorter time windows (e.g., time windows versus ) or longer time-lags (e.g., 3 versus 24 with time window ) could be due to overfitting. In those cases where changes in performance are not statistically significantly different, simpler models should be preferred.
4.5 Conclusions
The findings of this study have several implications. Our results indicate that rank-based methods for model fitting yields superior results to those studies where data were artificially balanced. Therefore, rank-based methods should be preferred when developing predictive models that deal with unbalanced datasets that may be implemented in the future. We also found that data from the last two days regarding steps and lying time measured with Trackacow device could be used to predict metritis events with RF classifier when sensor data were aggregated using either 6- or 3-hour time windows.
Data availability statement
The original contributions presented in the study are included in the article/Supplementary Material. Further inquiries can be directed to the corresponding author.
Ethics statement
The animal study was reviewed and approved by Institutional Animal Care and Use Committee IACUC protocol number 2013-1199 and 2016-2368.
Author contributions
GV, JS, and BM-L contributed to conception and design of the study. GV, IT and AL organized the different datasets. GV performed the statistical analysis. GV wrote the first draft of the manuscript. All authors contributed to the article and approved the submitted version.
Funding
This work was partially supported by the National Science Foundation awards IIS-BigData-AI-1838207 and OIA-2134901. JS was partially supported by the National Science Foundation DMS 1712996.
Acknowledgments
The authors would like to thank the University of Kentucky Coldstream dairy staff, and to all the students who helped with the fresh cow exam and data collection. We would also like to thank Jeffrey Bewley for facilitating data sharing.
Conflict of interest
The authors declare that the research was conducted in the absence of any commercial or financial relationships that could be construed as a potential conflict of interest.
Publisher’s note
All claims expressed in this article are solely those of the authors and do not necessarily represent those of their affiliated organizations, or those of the publisher, the editors and the reviewers. Any product that may be evaluated in this article, or claim that may be made by its manufacturer, is not guaranteed or endorsed by the publisher.
Supplementary material
The Supplementary Material for this article can be found online at: https://www.frontiersin.org/articles/10.3389/fanim.2023.1157090/full#supplementary-material
References
Barragan A. A., Piñeiro J. M., Schuenemann G. M., Rajala-Schultz P. J., Sanders D. E., Lakritz J., et al. (2018). Assessment of daily activity patterns and biomarkers of pain, inflammation, and stress in lactating dairy cows diagnosed with clinical metritis. J. Dairy Sci. 101, 8248–8258. doi: 10.3168/jds.2018-14510
Bewley J. M., Boyce R. E., Hockin J., Munksgaard L., Eicher S. D., Einstein M. E., et al. (2010). Influence of milk yield, stage of lactation, and body condition on dairy cattle lying behaviour measured using an automated activity monitoring sensor. J. Dairy Res. 77, 1–6. doi: 10.1017/S0022029909990227
Borchers M. R. (2015). An evaluation of precision farming technology adoption, perception, effectiveness and use. Thesis and Dissertations – Animal and Food Sciences. 45.
Borchers M. R., Chang Y. M., Tsai I. C., Wadsworth B. A., Bewley J. M. (2016). A validation of technologies monitoring dairy cow feeding, ruminating, and lying behaviors. J. Dairy Sci. 99, 7458–7466. doi: 10.3168/jds.2015-10843
Caraviello D. Z., Weigel K. A., Craven M., Gianola D., Cook N. B., Nordlund K. V., et al. (2006). Analysis of reproductive performance of lactating cows on large dairy farms using machine learning algorithms. J. Dairy Sci. 89, 4703–4722. doi: 10.3168/jds.S0022-0302(06)72521-8
Chapinal N., Carson M., Duffield T. F., Capel M., Godden S., Overton M., et al. (2011). The association of serum metabolites with clinical disease during the transition period. J. Dairy Sci. 94, 4897–4903. doi: 10.3168/jds.2010-4075
Chapinal N., Veira D. M., Weary D. M., von Keyserlingk M. A. G. (2007). Technical note: validation of a system for monitoring individual feeding and drinking behavior and intake in group-housed cattle. J. Dairy Sci. 90, 5732–5736. doi: 10.3168/jds.2007-0331
Chaplin S., Munksgaard L. (2001). Evaluation of a simple method for assessment of rising behaviour in tethered dairy cows. Anim. Sci. 72, 191–197. doi: 10.1017/S1357729800055685
Dasarathy B. (1991). Nearest neighbor pattern classification techniques (Los Alamitos, CA: IEEE Computer Society Press).
de Koning C. J. A. M. (2010). “Automatic milking - common practice on dairy farms,” in Proceedings First North America conference Precision Dairy Management, Toronto, Canada. 52–67.
DeVries T. J., von Keyserlingk M. A. G. (2005). Time of feed delivery affects the feeding and lying patterns of dairy cows. J. Dairy Sci. 88, 625–631. doi: 10.3168/jds.S0022-0302(05)72726-0
Dittrich I., Gertz M., Krieter J. (2019). Alterations in sick dairy cows’ daily behavioural patterns. Heliyon 5, e02902. doi: 10.1016/j.heliyon.2019.e02902
Edwards J. L., Tozer P. R. (2004). Using activity and milk yield as predictors of fresh cow disorders. J. Dairy Sci. 87, 524–531. doi: 10.3168/jds.S0022-0302(04)73192-6
Firk R., Stamer E., Junge W., Krieter J. (2002). Automation of oestrus detection in dairy cows: a review. Livest Prod Sci. 75, 219–232. doi: 10.1016/S0301-6226(01)00323-2
Fix E., Hodges J. L. (1951). Discriminatory analysis – nonparametris discrimination: consistency properties, U.S. Air Force, School of Aviation Medicine, Randolph Field, TX.
Gomez A., Cook N. B. (2010). Time budgets of lactating dairy cattle in commercial freestall herds. J. Dairy Sci. 93, 5772–5781. doi: 10.3168/jds.2010-3436
Hastie T., Tibshirani R., Friedman J. (2009). “The elements of statistical learning,” in Data mining, inference, and prediction, 2nd Edition (New York: Springer). doi: 10.1007/b94608
Humblet M. F., Guyot H., Boudry B., Mbayahi F., Hanzen C., Rollin F., et al. (2006). Relationship between haptoglobin, serum amyloid a, and clinical status in a survey of dairy herds during a 6-month period. Vet. Clin. Pathol. 35, 188–193. doi: 10.1111/j.1939-165X.2006.tb00112.x
Huzzey J. M., Veira D. M., Weary D. M., von Keyserlingk M. A. G. (2007). Prepartum behavior and dry matter intake identify dairy cows at risk for metritis. J. Dairy Sci. 90, 3220–3233. doi: 10.3168/jds.2006-807
Kamphuis C., Mollenhorst H., Heesterbeek J. A. P., Hogeveen H. (2010). Detection of clinical mastitis with sensor data from automatic milking systems is improved by using decision-tree induction. Journal of Dairy Science. 93 (8), 3616–3627. doi: 10.3168/jds.2010-3228
Kaufman E. I., LeBlanc S. J., McBride B. W., Duffield T. F., DeVries T. J. (2016). Association of rumination time with subclinical ketosis in transition dairy cows. J. Dairy Sci. 99, 5604–5618. doi: 10.3168/jds.2015-10509
Kohavi R., Sommerfield D., Dougherty J. (1997). Data mining using MLC++ a machine learning library in c++. Int. J. Artif. Intell. Tools 6, 537–566. doi: 10.1142/S021821309700027X
LeBlanc S. (2010). Monitoring metabolic health of dairy cattle in the transition period introduction–metabolic challenges in peripartum dairy cows and their associations with reproduction. J. Reprod. Dev. 56, 29–35. doi: 10.1262/jrd.1056S29
Lee A. R. (2018). An evaluation of physiological and behavioral indicators of postpartum diseases and heat stress in dairy cows. Theses Dissertations - Anim. Food Sci. 91. doi: 10.13023/etd.2018.379
Liboreiro D. N., Machado K. S., Silva P. R. B., Maturana M. M., Nishimura T. K., Brandão A. P., et al. (2015). Characterization of peripartum rumination and activity of cows diagnosed with metabolic and uterine diseases. J. Dairy Sci. 98, 6812–6827. doi: 10.3168/jds.2014-8947
Martiskainen P., Järvinen M., Skön J. P., Tiirikainen J., Kolehmainen M., Mononen J. (2009). Cow behaviour pattern recognition using a three-dimensional accelerometer and support vector machines. Appl. Anim. Behav. Sci. 119, 32–38. doi: 10.1016/j.applanim.2009.03.005
Mattachini G., Pompe J., Finzi A., Tullo E., Riva E., Provolo G. (2019). Effects of feeding frequency on the lying behavior of dairy cows in a loose housing with automatic feeding and milking system. Animals 9. doi: 10.3390/ani9040121
Mayo L. M., Silvia W. J., Ray D. L., Jones B. W., Stone A. E., Tsai I. C., et al. (2019). Automated estrous detection using multiple commercial precision dairy monitoring technologies in synchronized dairy cows. J. Dairy Sci. 102, 2645–2656. doi: 10.3168/jds.2018-14738
Neave H. W., Lomb J., Weary D. M., LeBlanc S. J., Huzzey J. M., von Keyserlingk M. A. G. (2018). Behavioral changes before metritis diagnosis in dairy cows. J. Dairy Sci. 101, 4388–4399. doi: 10.3168/jds.2017-13078
Overton M. W., Sischo W. M., Temple G. D., Moore D. A. (2002). Using time-lapse video photography to assess dairy cattle lying behavior in a free-stall barn. J. Dairy Sci. 85, 2407–2413. doi: 10.3168/jds.S0022-0302(02)74323-3
Patbandha T. K., Mohanty T. K., Layek S. S., Kumaresan A., Behera K. (2012). Application of pre-partum feeding and social behaviour in predicting risk of developing metritis in crossbred cows. Appl. Anim. Behav. Sci. 139, 10–17. doi: 10.1016/j.applanim.2012.03.014
Pedregosa F., Varoquaux G., Gramfort A., Michel V., Thirion B., Grisel O., et al. (2011). Scikit-learn: machine learning in Python. J. Mach. Learn. Res. 12, 2825–2830.
Piñeiro J. M., Menichetti B. T., Barragan A. A., Relling A. E., Weiss W. P., Bas S., et al. (2019). Associations of pre- and postpartum lying time with metabolic, inflammation, and health status of lactating dairy cows. J. Dairy Sci. 102, 3348–3361. doi: 10.3168/jds.2018-15386
Probo M., Pascottini O. B., LeBlanc S., Opsomer G., Hostens M. (2018). Association between metabolic diseases and the culling risk of high-yielding dairy cows in a transition management facility using survival and decision tree analysis. J. Dairy Sci. 101, 9419–9429. doi: 10.3168/jds.2018-14422
R Core Team (2017). R: A language and environment for statistical computing. Vienna, Austria: R Foundation for Statistical Computing.
Royster E., Wagner S. (2015). Treatment of mastitis in cattle. Veterinary Clinics North America - Food Anim. Pract. 31, 17–46. doi: 10.1016/j.cvfa.2014.11.010
Ruckebusch Y. (1972). The relevance of drowsiness in the circadian cycle of farm animals. Anim. Behav. 20, 637–643. doi: 10.1016/S0003-3472(72)80136-2
Rutten C. J., Velthuis A. G. J., Steeneveld W., Hogeveen H. (2013). Invited review: sensors to support health management on dairy farms. J. Dairy Sci. 96, 1928–1952. doi: 10.3168/jds.2012-6107
Saito T., Rehmsmeier M. (2015). The precision-recall plot is more informative than the ROC plot when evaluating binary classifiers on imbalanced datasets. PloS One 10, 1–21. doi: 10.1371/journal.pone.0118432
Schlageter-Tello A., Bokkers E. A. M., Groot Koerkamp P. W. G., van Hertem T., Viazzi S., Romanini C. E. B., et al. (2014). Effect of merging levels of locomotion scores for dairy cows on intra- and interrater reliability and agreement. J. Dairy Sci. 97, 5533–5542. doi: 10.3168/jds.2014-8129
Sepúlveda-Varas P., Weary D. M., von Keyserlingk M. A. G. (2014). Lying behavior and postpartum health status in grazing dairy cows. J. Dairy Sci. 97, 6334–6343. doi: 10.3168/jds.2014-8357
Sheldon I. M., Lewis G. S., LeBlanc S., Gilbert R. O. (2006). Defining postpartum uterine disease in cattle. Theriogenology 65, 1516–1530. doi: 10.1016/j.theriogenology.2005.08.021
Siivonen J., Taponen S., Hovinen M., Pastell M., Lensink B. J., Pyörälä S., et al. (2011). Impact of acute clinical mastitis on cow behaviour. Appl. Anim. Behav. Sci. 132, 101–106. doi: 10.1016/j.applanim.2011.04.005
Stangaferro M. L., Wijma R., Caixeta L. S., Al-Abri M. A., Giordano J. O. (2016a). Use of rumination and activity monitoring for the identification of dairy cows with health disorders: part i. metabolic and digestive disorders. J. Dairy Sci. 99, 7395–7410. doi: 10.3168/jds.2016-10907
Stangaferro M. L., Wijma R., Caixeta L. S., Al-Abri M. A., Giordano J. O. (2016b). Use of rumination and activity monitoring for the identification of dairy cows with health disorders: part III. metritis. J. Dairy Sci. 99, 7422–7433. doi: 10.3168/jds.2016-11352
Steensels M., Maltz E., Bahr C., Berckmans D., Antler A., Halachmi I. (2017). Towards practical application of sensors for monitoring animal health: the effect of post-calving health problems on rumination duration, activity and milk yield. J. Dairy Res. 84, 132–138. doi: 10.1017/S0022029917000176
Stoye S., Porter M. A., Stamp Dawkins M. (2012). Synchronized lying in cattle in relation to time of day. Livest Sci. 149, 70–73. doi: 10.1016/j.livsci.2012.06.028
Tizard I. (2008). Sickness behavior, its mechanisms and significance. Anim. Health Res. Rev. / Conf. Res. Workers Anim. Dis. 9, 87–99. doi: 10.1017/S1466252308001448
Tsai I. C. (2017). Differences in behavioral and physiological variables measured with precision dairy monitoring technologies associated with postpartum diseases. Thesis Dissertations - Anim. Food Sci. 69. doi: 10.13023/ETD.2017.014
Tucker C. B., Jensen M. B., de Passillé A. M., Hänninen L., Rushen J. (2021). Invited review: lying time and the welfare of dairy cows. J. Dairy Sci. 104, 20–46. doi: 10.3168/jds.2019-18074
Urton G., von Keyserlingk M. A. G., Weary D. M. (2005). Feeding behavior identifies dairy cows at risk for metritis. J. Dairy Sci. 88, 2843–2849. doi: 10.3168/jds.S0022-0302(05)72965-9
Vanrell S. R., Chelotti J. O., Galli J. R., Rufiner H. L., Milone D. H. (2014). 3D acceleration for heat detection in dairy cows. Sexto Congreso Argentino Agroinformatica 64–73, 121–134.
Vasseur E., Rushen J., Haley D. B., de Passillé A. M. (2012). Sampling cows to assess lying time for on-farm animal welfare assessment. J. Dairy Sci. 95, 4968–4977. doi: 10.3168/jds.2011-5176
Weary D. M., Huzzey J. M., von Keyserlingk M. A. G. (2009). Board-invited review: using behavior to predict and identify ill health in animals. J. Anim. Sci. 87, 770–777. doi: 10.2527/jas.2008-1297
Keywords: predictive modeling, classification algorithm, precision dairy technology, postpartum period, dairy cattle behavior
Citation: Vidal G, Sharpnack J, Pinedo P, Tsai IC, Lee AR and Martínez-López B (2023) Comparative performance analysis of three machine learning algorithms applied to sensor data registered by a leg-attached accelerometer to predict metritis events in dairy cattle. Front. Anim. Sci. 4:1157090. doi: 10.3389/fanim.2023.1157090
Received: 02 February 2023; Accepted: 13 April 2023;
Published: 28 April 2023.
Edited by:
Suresh Neethirajan, Farmworx Research Institute, NetherlandsReviewed by:
Stefan Thurner, Institute for Agricultural Engineering and Animal Husbandry, GermanyManod Williams, Aberystwyth University, United Kingdom
Copyright © 2023 Vidal, Sharpnack, Pinedo, Tsai, Lee and Martínez-López. This is an open-access article distributed under the terms of the Creative Commons Attribution License (CC BY). The use, distribution or reproduction in other forums is permitted, provided the original author(s) and the copyright owner(s) are credited and that the original publication in this journal is cited, in accordance with accepted academic practice. No use, distribution or reproduction is permitted which does not comply with these terms.
*Correspondence: Gema Vidal, gema.vidal@sva.se