Comparative study between scan sampling behavioral observations and an automatic monitoring image system on a commercial fattening pig farm
 Queralt Allueva Molina
 Heng-Lun Ko
 Yaneth Gómez
 Xavier Manteca
 Pol Llonch
- Department of Animal and Food Science, School of Veterinary Science, Universitat Autònoma de Barcelona, Cerdanyola del Vallès, Barcelona, Spain
Automation is an important element in modern livestock farming. Image computer analysis is the automation technology aiming to monitor farm animals by recording continuous images. Further analysis can be carried out to assess more precisely and effectively farm animals’ welfare. The aim of this study was to determine the applicability of the commercial multi-sensor device (Peek Analytics) developed by Copeeks SAS (France), in comparison to human-based observations used to assess behaviors in pigs, including posture (standing/resting), area within the pen (feeding/drinking/resting/enrichment), and activity level (number of active pigs). Two Peek Analytics (Peek 3 and Peek 4) were installed on a commercial fattening pig farm in Murcia (Spain). Each device recorded data of two pens (39 pigs in four pens in total). Scan sampling was the human-based behavioral observation method used in this study. Data was collected for five consecutive days, in the following intervals: 09:00-11:00, 13:00-15:00, and 16:00-18:00 (30 hours of observation in total). Every pig was observed six times per hour and hence the information analyzed includes 7020 observations (180 observations/pig). The comparison between data from human observation and Peek Analytics was performed by using Pearson correlation tests. Posture, areas of interest, and activity level were analyzed separately, as well as data recorded by Peek 3 and 4. Results indicated that Peek Analytics showed a better agreement with human observation, when recording posture(r=0.77, P<0.01) and area within the pen (r=0.77, P<0.01), than when recording activity level (r=0.35, P<0.01). Two devices performed differently in general, with Peek 3 having better agreement than Peek 4 with human observation, regardless of posture, area within the pen, and activity level. The better agreement in Peek 3 may be attributed to the smaller number of pigs in Peek 3 (18) compared to Peek 4 (22). We can conclude from the study that image computer analysis may be reliable in assessing posture and area within the pen of pigs. On the other hand, a moderate agreement in activity level between human observation and computer vision can be due to different methodologies of recording the activity, rather than due to low accuracy of Peek Analytics.
1 Introduction
Over the last few decades, the pig farming industry has experienced major changes such as intensification and an increasing use of technology that reflect the increasing meat demand and the decreasing number of farmers (FAO, 2020). Bigger farm sizes often compromise welfare assessment as the observation of individuals becomes more difficult and time-consuming, which may ultimately impair animal welfare (Norton et al., 2019). The expansion of farm intensification therefore demands more developed data monitoring and management (Hostiou et al., 2017).
Additionally, concerns about animal welfare in intensive farming systems have increased over the years. In addition to being an ethical concern, welfare in animal production is nowadays important as a matter of consumers’ demands. Moreover, it has been proved that poor welfare has an impact on animals’ health and productivity and consequently on the sustainability of their production (Matthews et al., 2016).
Current in-person animal welfare assessment protocols can be time-consuming, subjective, and impractical (Matthews et al., 2016). These challenges may be tackled through the application of precision livestock farming (PLF) technologies. PLF facilitates a management system based on continuous automatic real-time monitoring of the production, reproduction, health, welfare, and the environmental impact of livestock production (Berckmans, 2014). The use of PLF technologies can prevent disease outbreaks and improve farm management (Larsen et al., 2021).
The most used PLF technologies for pigs are water meters, animal weight sensors, feed supply monitors, camera systems to measure animal activity and distribution, and sound monitoring for respiratory diseases (Gómez et al., 2021). PLF technologies are relatively new in the pig industry, and they have been mostly used in experimental situations rather than on commercial farms (Gómez et al., 2021). To transpose PLF technologies from research to commercial operations in pigs, one of the biggest current challenges is to convert the data into useful information, so producers can use it to reach better decisions and ensure an improved real-time welfare management (Vranken and Berckmans, 2017). Another focus is to develop PLF technologies that can collect animal-based measures (e.g., behavioral changes) as they can provide the most direct insight into the welfare status of the animals (Tzanidakis et al., 2021). Additionally, before implementing new PLF systems into commercial operations, they need to be cross-checked with gold standards (i.e., methods conducted by the presence of humans) in commercial environments. As stated by Gómez et al. (2021), few PLF technologies have been externally validated in pig farming, which impacts the trust in this sector.
In the present study, we used a commercially available PLF sensor called Peek Analytics (Copeeks SAS, France), which can collect information about the environment and the animals at the pen level. The information on the animals includes posture (i.e., standing and resting), preference for pre-defined areas within a pen, and activity level. More details regarding the product features are described in the next section. Change in activity level and resting pattern are known to be associated with the health and welfare status of pigs (Ott et al., 2014; Chapa et al., 2020; Oczak et al., 2022). Studies have found a significant change of activity level in pigs after infection (Escobar et al., 2007; Reiner et al., 2009), after an outbreak of tail-biting (Statham et al., 2009), and after a stressful event (Salak-Johnson et al., 2004). When pigs are sick or lame, their physical activities are reduced, including exploration, feeding, drinking, social behavior, and locomotion (Oczak et al., 2022). It is, therefore, interesting to investigate the animal-based information measured by Peek Analytics and to contrast it with human observation. The main objective of this study was therefore to compare two methods of behavior observation: scan sampling observations (by human) and computer vision (by Peek Analytics) on the following animal-based parameters: posture, area within the pen, and activity level.
2 Materials and methods
2.1 Animals and housing
The study was conducted in a fattening unit of the research farm of University of Murcia (Murcia, Spain). The study lasted for 5 days, from April 19th to 23rd 2021. There were two fattening units with approximately 600 pigs housed per unit. During the study period, the pigs were 5- to 6-month-old and weighted around 70-90 kg. The pen measured 3 m x 3 m, and each pen housed 9 to 11 pigs of both sexes, providing a stocking density of 0.82-1 m2 per pig. The pen had a feeding area of 1.1 m x 1 m, a drinking area with one nipple drinker, and a wood log as an enrichment tool. The temperature of the room was controlled between 20 and 22 °C. Each room had four windows for natural ventilation and a fan at the end.
2.2 Experimental design
2.2.1 Establishment of the areas within the pen
A commercially available device, Peek Analytics (Copeeks SAS, France), was used in the study. Peek Analytics is a multi-sensor device that monitors the environment (temperature, humidity, CO2, and NH3) and different animal-based parameters. For the animal-based parameters, Peek Analytics recorded the posture (number of ‘standing’ or ‘resting’ animals), areas of interest (number of animals in a pre-defined area of the pen), and activity level of the animals through a camera. The camera recorded videos of 10 seconds and took pictures at a pre-established frequency, which was set every 10 minutes. The videos and images were enhanced with artificial intelligence including analysis of images by deep learning algorithms and customizable settings on Copeeks’ cloud platform. The data was integrated into Copeeks’ platform, where an algorithm automatically estimated the values of the activity level of the pigs, the number of animals in the areas of interest, and generated graphics that could be easily interpreted.
In the present study, two Peek Analytics (hereafter named as Peek 3 and Peek 4 to differentiate between both devices) were used. They were installed in the opposite side of the room. Each device recorded information of two pens, and therefore four pens (n=39) were included: pen 1 and 2 had nine pigs each and were recorded by Peek 3, whereas pen 3 and 4 had eleven pigs each and were recorded by Peek 4. A pig in pen 3 died for unknown reason after the first day when the study started. The set-up of the two Peek Analytics is illustrated in Figure 1.
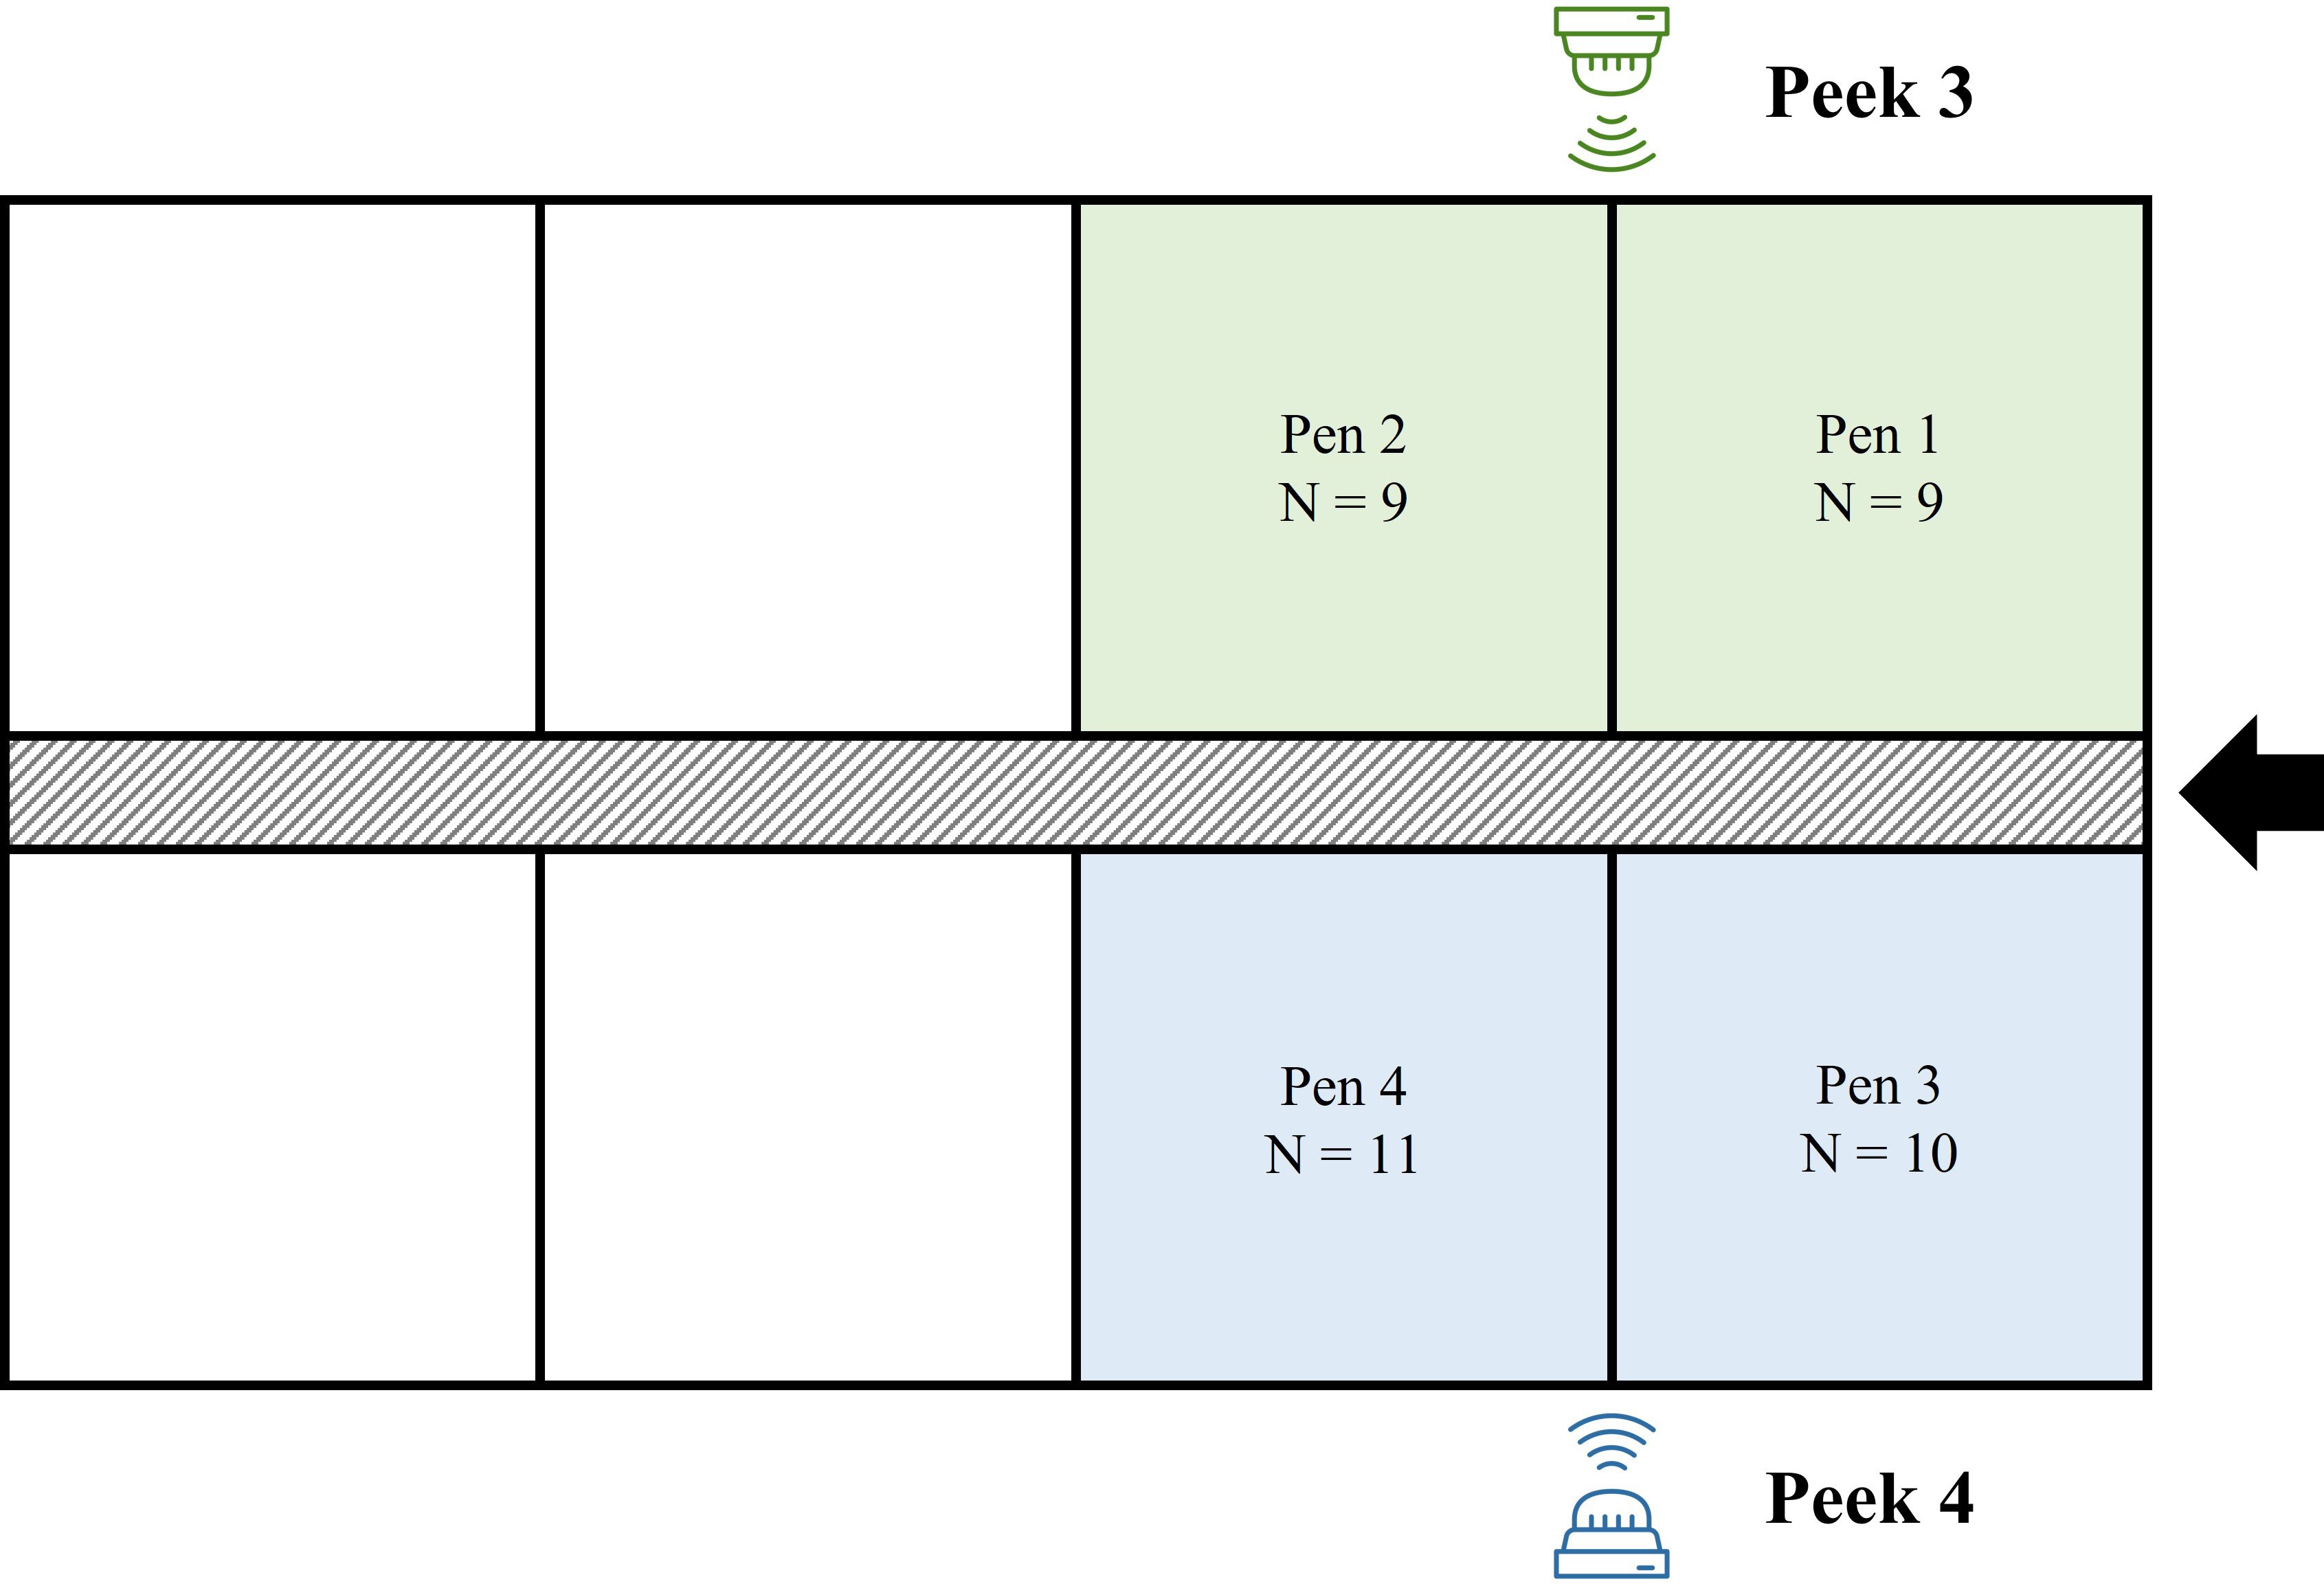
Figure 1 Location of Peek Analytics (Peek 3 and Peek 4) and the pens, and the number of pigs in each pen monitored by the sensors. Squares indicate the pens, the square with the upward diagonal pattern indicates the passageway, and the arrow indicates the entrance. Peek 3 monitored the pens with green filling (pen 1 and 2) and Peek 4 monitored the pens with blue filling (pen 3 and 4). Camera visons of Peek Analytics can be found in Figures 2A and B Sensor icon made by Good Ware from www.flaticon.com.
Areas of interest of a pen were defined prior to the study: (1) feeding area, (2) resting area, (3) drinking area, and (4) the enrichment tool. The areas of interest of Peek 3 were specified in Figure 2A and that of Peek 4 in Figure 2B.
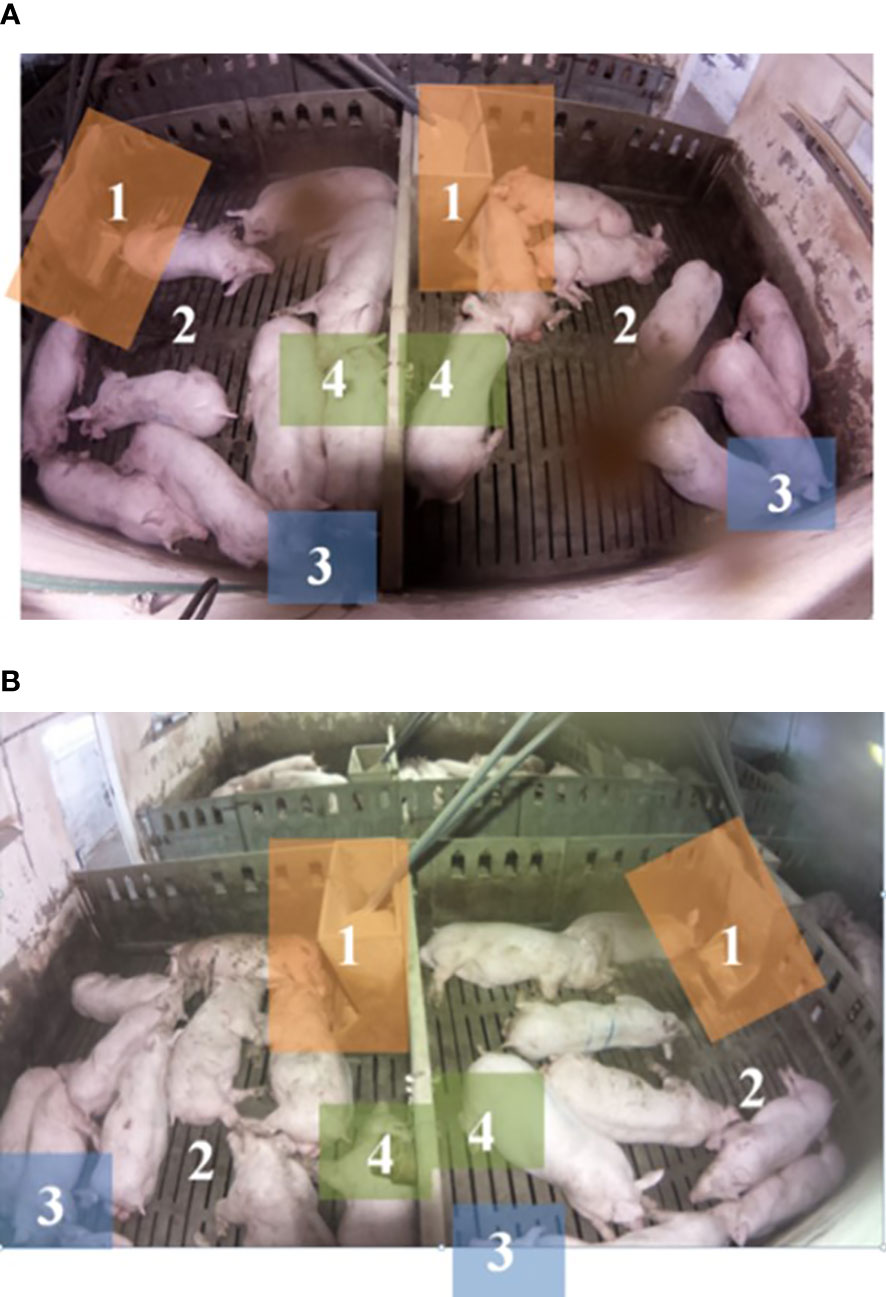
Figure 2 Areas of interest for behavioral observation in fattening pigs from (A) Peek 3 (left: pen 1; right: pen 2), and (B) Peek 4 (left: pen 4; right: pen 3). The areas of interest include: (1) feeding area: the orange squares with number 1, (2) drinking area: the blue squares with number 3, (3) enrichment tool: the green squares with number 4, and finally, the rest of the area with number 2 indicate the resting area.
2.2.2 Behavioral observations
Thirty minutes before the first observation every day (i.e., at 08:30), the health conditions of the pigs were checked, and pigs were identified with a number on the back marked by a spray. After spray marking the pigs, the observer left the room and re-entered once the observation started (i.e., at 09:00). Behavioral observations (both scan sampling by human and computer vision) of each pen took 2 minutes and were collected every 10 minutes from outside the pen. Behavioral observation was conducted for 5 days continuously from 09:00 to 11:00, 13:00 to 15:00, and 16:00 to 18:00. The objective of the observations was to record the overall activity of each pen, and the location of the pigs within the different areas of the pen, and then compare the results with the information obtained through Peek Analytics. The ethogram of posture and active behaviors is shown in Table 1.
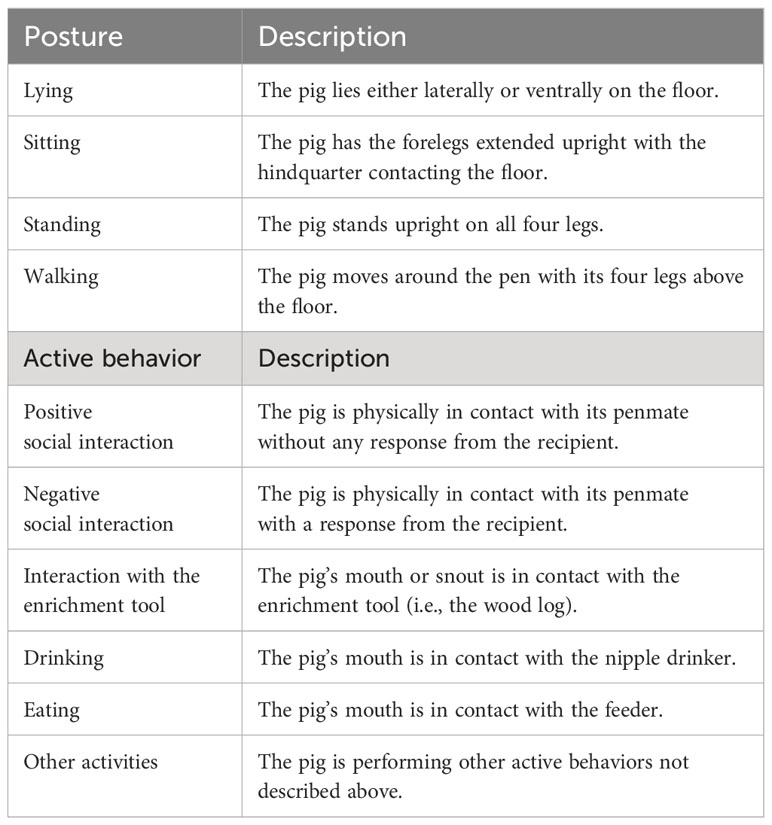
Table 1 Ethogram to record the posture and active behaviors in human observation.
2.3 Statistical analysis
Data were analyzed in RStudio version 2023.03.0 (R Foundation, Austria). Data of the two adjacent pens were the experimental unit, as the vision of one Peek Analytics (Peek 3 or Peek 4) monitored two adjacent pens together. Statistical significance was accepted when P<0.05 and a tendency was considered when 0.05<P≤0.10. Numeric values obtained via human observation and computer vision were compared by Pearson correlation tests. Results were reported in Pearson’s correlation coefficients (r) as the level of agreement between two observation methods.
To compare the posture data between human observation and computer vision, ‘sitting’ and ‘lying’ recorded through scan sampling were combined together as ‘resting’, and ‘standing’ and ‘walking’ were combined together as ‘standing.’.
The activity level measured by Peek Analytics was a numeric value without a unit and did not have a reference range. It was calculated by an algorithm, a protected knowledge of the company, which tracked the dots plotted on every pig in a given time range. To compare the activity data between human observation and computer vision, different models were made to integrate different active behaviors collected from scan sampling. Model 1 included all the listed active behaviors, whereas Models 2 and 3 were more restrictive with some specific active behaviors, and Model 4 was a weighted scale of different active behaviors. All the models excluded ‘other activities’ (Table 2).
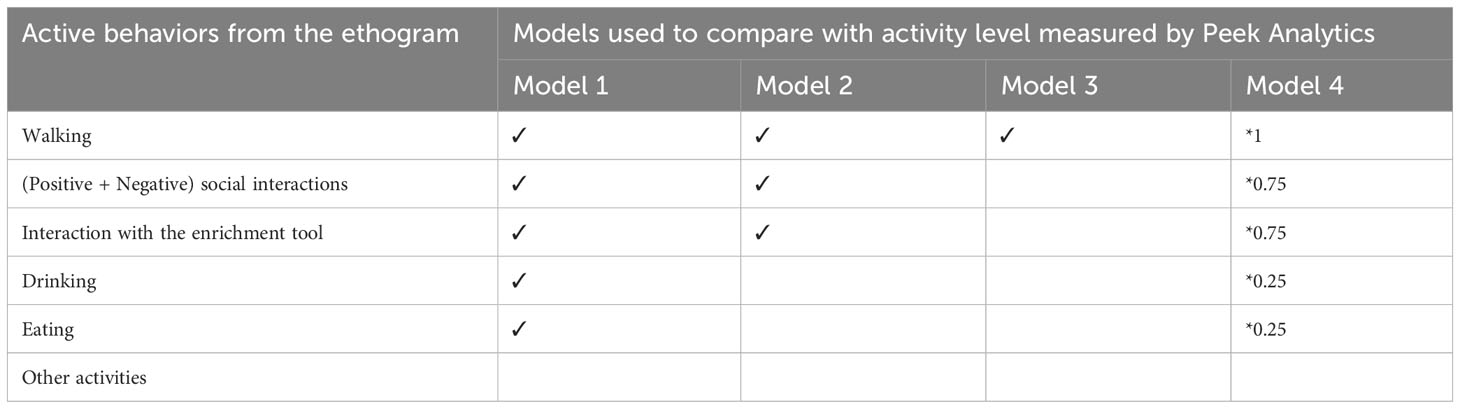
Table 2 Four models integrating or weighting different active behaviors listed in the ethogram, with the numbers of pigs performing these active behaviors collected from scan sampling, to compare the models with the activity level calculated by Peek Analytics.
Table 3 presents the outputs of the animal-based parameters (i.e., posture, area within the pen, and activity of pigs) measured by scan sampling and Peek Analytics for comparison.
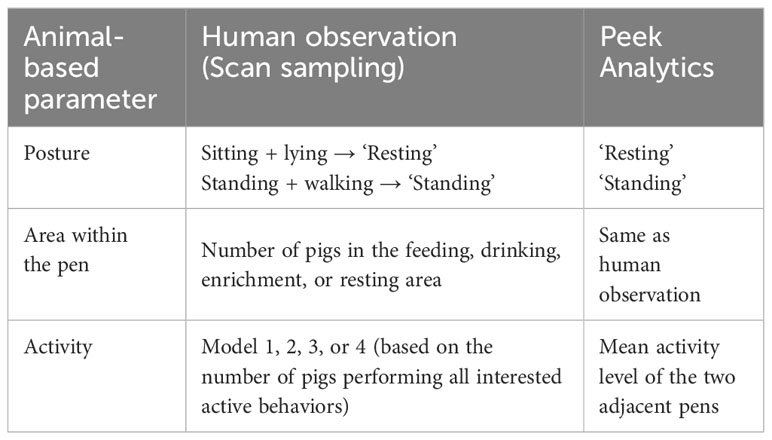
Table 3 Summary of the output of each animal-based parameter measured by human observation (through scan sampling) or Peek Analytics (a camera with an automatic monitoring image system) for Pearson correlation tests.
3 Results
The agreements (correlation coefficients obtained from correlation tests) between human observation and computer vision are presented according to posture, area within the pen, and activity level.
3.1 Posture
The overall agreement between human observation and computer vision on posture in pigs is high (r=0.77, P<0.01). A detailed comparison at the pen level in standing and resting postures is presented in Table 4. The agreement between human observation and computer vision on resting posture (r=0.79) is higher than standing posture (r=0.32). In addition, Peek 3 showed slightly better correlations with human observation than Peek 4 (r=0.80 and 0.75, respectively).
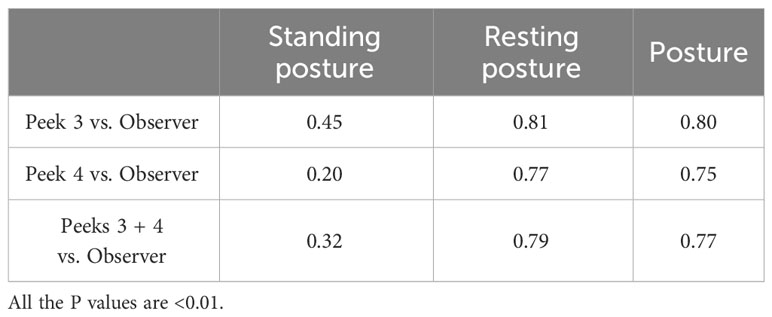
Table 4 Agreements (correlation coefficients) between human observation and computer vision on standing posture, resting posture, and posture in general at the pen level.
3.2 Area within the pen
The overall agreement between human observation and computer vision on area within the pen is also high (r=0.77, P<0.01). A detailed comparison at the pen level in the number of pigs in the resting, feeding, drinking, and enrichment areas is presented in Table 5. The agreement on the number of pigs in the resting area (r=0.77, P<0.01) is the highest, followed by the feeding area (r=0.32, P<0.01), the enrichment area (r=0.29, P<0.01), and then finally the drinking area (r=0.21, P<0.01). Peek 4 calculated the number of pigs in the drinking area poorly. Like in posture detection, Peek 3 generally performed better than Peek 4 in detecting the number of pigs in a specific area (r=0.80 and 0.75, respectively).
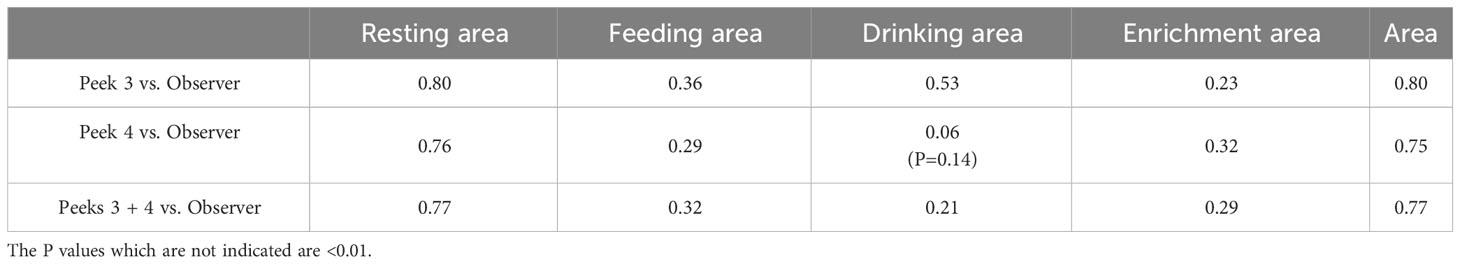
Table 5 Agreements (correlation coefficients) between human observation and computer vision on the number of pigs in the resting, feeding, drinking, and enrichment areas at the pen level.
3.3 Activity level
Regardless of the models, the agreement between human observation and computer vision on activity level is moderate (Model 1: r=0.39; Model 2: r=0.32; Model 3: r=0.21; Model 4: r=0.35, P<0.01), as presented in Table 6. Model 1 showed the best agreement with human observation, which was followed by Models 4, 2, and 3 respectively, in both Peek 3 and Peek 4. Moreover, like posture and area within the pen, Peek 3 in general showed a higher agreement with human observation results than Peek 4.
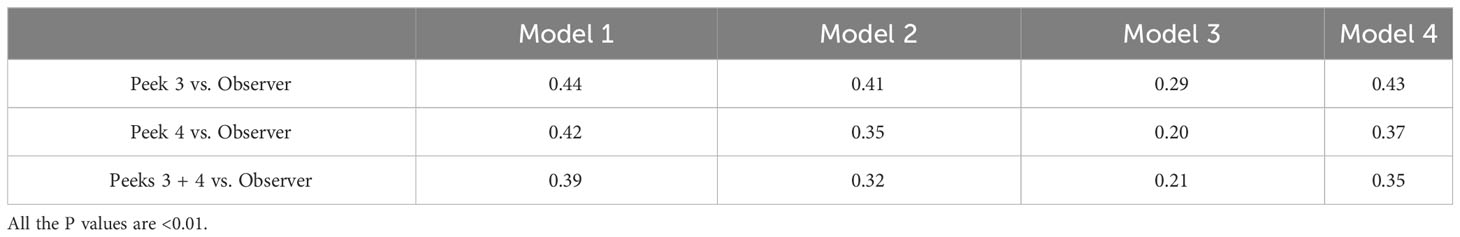
Table 6 Agreements (correlation coefficients) between human observation and computer vision on activity level in different models at the pen level.
4 Discussion
Precision livestock farming (PLF) relies on continuous animal welfare monitoring with sensor technology and artificial intelligence to flag early warnings and assist the producers with daily management decisions (Vranken and Berckmans, 2017). However, to enjoy the benefits of PLF technology, understanding how PLF sensors operate and externally validating the outputs from the sensors are necessary (Gómez et al., 2021). Lack of validation may lead to low willingness of producers to implement and wrong decision suggestions for the producers (Schillings et al., 2021). Larsen et al. (2021) found that only 23% of publications regarding PLF in pigs were properly validated, whereas only 5% were externally validated in their list of commercial PLF sensors in pigs as indicated by Gómez et al. (2021). A need of external validation of PLF sensors is therefore required.
In the present study, we compared the outputs of animal-based parameters measured by automatic image analysis from a camera-based PLF commercial sensor with the values of scan sampling by human. The parameters were posture, area within the pen, and activity level. In contrast with a traditional approach, which is to monitor environmental parameters, these animal-based parameters reflect direct information on the welfare status of pigs. Animal-based parameters reveal a closer need of an animal as the behaviors are the outcome of how it is coping with the environment (Broom, 2010). Posture (i.e., standing and resting in our case) can be an indicator for thermal comfort (Shao and Xin, 2008) and depending on the production stage, it can also be used to observe nursing behavior in lactating sows (Yang et al., 2020). In addition, posture, preferred area within the pen, and activity level altogether can show a better picture of the diurnal behavioral pattern of pigs (Kim et al., 2017). Changes in posture or activity in pigs can be used as health-related indicators or indices of an unwanted behavioral outbreak (Gómez et al., 2021). For instance, a significant change of activity can be associated to disease (acute respiratory infection in Escobar et al., 2007; parasitic disease in Reiner et al., 2009; African Swine Fever in Fernández-Carrión et al., 2017), tail-biting outbreak (Larsen et al., 2016; D’Eath et al., 2018), and post-stress induction (Salak-Johnson et al., 2004). Given the welfare implications of these animal-based parameters, the necessity of validating these outputs with human observations is recognized.
Overall, there were good agreements on posture and area within the pen (all the Pearson correlation coefficients (r) ≥ 0.75), but not activity level (r = 0.35~0.43). Furthermore, a better agreement was shown in Peek 3 than Peek 4 compared to human observation. Detection of pig postures in deep learning approach has been successful in many studies, especially when distinguishing between standing and resting [sows in Lao et al. (2016) and Leonard et al. (2019); nursery and fattening pigs in Nasirahmadi et al. (2019)]. One of the limitations of Peek Analytics when detecting pig postures may be the inability to detect the (dog-)siting posture, in which performing excessive sitting postures can indicate frustration due to a lack of space (Jarvis et al., 2002). A slightly different correlation between Peek 3 and Peek 4 may be due to, among other factors, the fact that the devices detected one animal in two different areas at the same time (see Figure 3 and the following explanation).
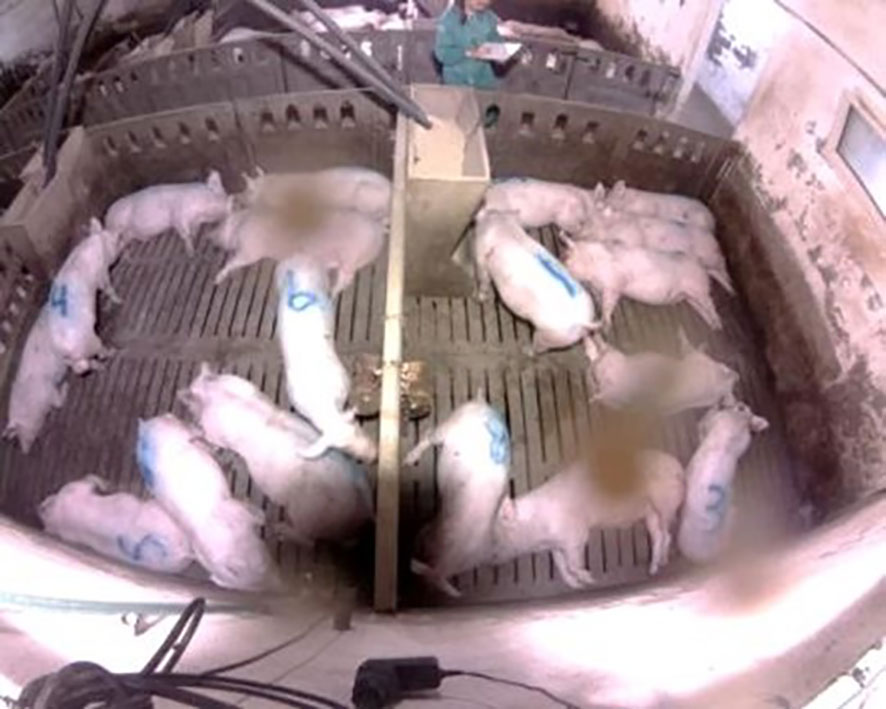
Figure 3 Resting and standing pigs within pen 1 (n=9, left side) and pen 2 (n=9, right side) captured by Peek Analytics on April 19th at 10:50.
In the present study, Peek 3 detected a total of 29 pigs in the two pens but there were only 18. Peek 3 (and human observation in the parentheses) observed three (five) standing and seven (four) resting pigs in the resting area, one (one) standing and one (three) resting pig in the feeding area, one (zero) standing and two (three) resting pigs in the drinking area, and one (zero) standing pig (and two resting pigs) in the enrichment area. There were some pigs in Figure 3 that were clearly in one specific area but in some cases, it was unclear. There was an added complication in pens 1 and 3, depending on the position of the pigs they may be simultaneously counted as being in the drinking area and the enrichment area. For example, the sensor detected three pigs in the drinking area and one in the enrichment area. However, the reality was that only a minor part of the body of two pigs was in the drinking area, but the sensor recognized three pigs in this area. Additionally, the sensor also had difficulties assessing standing and resting pigs sometimes. For example, in pen 1, there were only two standing pigs, but the sensor detected six standing pigs.
Moreover, the drinking areas of pens 3 and 4 were hardly examined through Peek 4 so the assessment of the posture in these areas may be challenging. This problem may be solved through the proper installation of the sensors but in this case, it could be one of the causes of the relatively lower correlation in Peek 4. Peek Analytics detected more pigs than there really were, in some cases, maybe because the device duplicated information of different areas of interest. This limitation could be solved by establishing less and bigger areas of interest within a pen. Another challenge of applying PLF technology on farm is to maintain the cleanliness of camera lenses, which can also contribute to wrong recognition of postures or number of pigs in a certain area. As for the activity level, one of the most difficult challenges was the inability to access to how Peek Analytics measured activity level due to the protected knowledge. The values obtained via scan sampling were the frequency and percentage of a certain behavior performed, whereas Peek Analytics measured it via summing vectors of each moving pig per unit of time. Both methods of measuring activity level differed and therefore could not be compared.
The welfare implication from the present study is that the commercial sensor, Peek Analytics, is effective at recording posture and areas of interest within a pen in fattening pigs in commercial conditions. In terms of activity level, we did not find a good agreement between scan sampling of human observation and automatic image analysis of computer vision. This rather moderate agreement can be simply due to a different way of recording the activity level of pigs between human and computer vision. The present study suggests that PLF sensors can substitute human observations and can be a reliable tool to detect postures and areas of interest. Further research is needed to externally validate how Peek Analytics or other current existing sensors measure activity level; and how PLF technology measures animal behavior information differently than human observations can impact our current understanding on applied ethology. Moreover, research to use these animal-based parameters to assist us in building up and understand a more complete behavioral pattern of pigs in indoor intensive conditions, for example, a diurnal resting pattern, different areas of interest during a day, or activity level at different production stages, is suggested. Finally, research to cross-check these animal-based parameters with other gold standards (e.g., physiological indicators and Welfare Quality® assessment protocol) and interpreting the information related to animal welfare is warranted. For instance, high activity level may be favored in nursery pigs (i.e., more play behavior in young animals) but perhaps not in fattening pigs, which may imply more agonistic behavior or damaging behavior like tail-biting.
5 Conclusion
This comparative study between human observation and computer vision provided evidence to conclude that the commercial sensor, Peek Analytics, measures ‘posture’ and ‘area within a pen’ in pigs accurately. It is therefore feasible to install Peek Analytics in fattening farms which house 10-20 pigs per pen to monitor two adjacent pens together to collect information on pig’s posture and area within the pen. One of the main challenges for Peek Analytics is to count the exact number of animals.
More studies can be developed in farms with different characteristics from this study to determine the applicability of Peek Analytics in different pig farming conditions. Further investigation is needed to determine the accuracy of activity level measured by the sensor. The moderate agreement of activity level between human observation and computer vision is due to the fundamental reason, which is different methods of recording behaviors. Therefore, we can neither determine the accuracy nor the applicability of activity level from this study.
Data availability statement
The raw data supporting the conclusions of this article will be made available by the authors, without undue reservation.
Ethics statement
The animal study was approved by Autonomous University of Barcelona (code P1 – 5754). The study was conducted in accordance with the local legislation and institutional requirements.
Author contributions
QAM, YG, XM, and PL contributed to conception and design of the study. QAM performed the study. QAM and H-LK organized the database and performed the statistical analysis. QAM wrote the first draft of the manuscript. H-LK wrote sections of the manuscript. All authors contributed to the article and approved the submitted version.
Funding
The author(s) declare financial support was received for the research, authorship, and/or publication of this article. The study is part of the ongoing project called ClearFarm, which is funded by the European Union’s Horizon 2020 research and innovation programme under grant agreement No. 862919.
Conflict of interest
The authors declare that the research was conducted in the absence of any commercial or financial relationships that could be construed as a potential conflict of interest.
Publisher’s note
All claims expressed in this article are solely those of the authors and do not necessarily represent those of their affiliated organizations, or those of the publisher, the editors and the reviewers. Any product that may be evaluated in this article, or claim that may be made by its manufacturer, is not guaranteed or endorsed by the publisher.
References
Berckmans D. (2014). Precision livestock farming technologies for welfare management in intensive livestock systems. Rev. - Off. Int. Epizoot. 33 (1), 189–196. doi: 10.20506/rst.33.1.2273
Broom D. (2010). “Welfare of animals: behavior as a basis for decisions,” in Encyclopedia of Animal Behavior. Eds. Breed M. D., Moore J. (Cambridge, Massachusetts: Academic Press), 580–584. doi: 10.1016/B978-0-08-045337-8.00080-2
Chapa J. M., Maschat K., Iwersen M., Baumgartner J. (2020). Accelerometer systems as tools for health and welfare assessment in cattle and pigs – A review. Behav. Processes 181, 104262. doi: 10.1016/j.beproc.2020.104262
D’Eath R. B., Jack M., Futro A., Talbot D., Zhu Q., Barclay D., et al. (2018). Automatic early warning of tail biting in pigs: 3D cameras can detect lowered tail posture before an outbreak. PloS One 13 (4), e0194524. doi: 10.1371/journal.pone.0194524
Escobar J., Van Alstine W. G., Baker D. H., Johnson R. W. (2007). Behaviour of pigs with viral and bacterial pneumonia. Appl. Anim. Behav. Sci. 105 (1-3), 42–50. doi: 10.1016/j.applanim.2006.06.005
FAO (2020). Food Outlook – Biannual Report on Global Food Markets. (Rome: FAO). doi: 10.4060/ca9509en
Fernández-Carrión E., Martínez-Avilés M., Ivorra B., Martínez-López B., Ramos Á.M., Sánchez-Vizcaíno J. M. (2017). Motion-based video monitoring for early detection of livestock diseases: The case of African swine fever. PloS One 12 (9), e0183793. doi: 10.1371/journal.pone.0183793
Gómez Y., Stygar A. H., Boumans I. J., Bokkers E. A., Pedersen L. J., Niemi J. K., et al. (2021). A systematic review on validated precision livestock farming technologies for pig production and its potential to assess animal welfare. Front. Vet. Sci. 8. doi: 10.3389/fvets.2021.660565
Hostiou N., Fagon J., Chauvat S., Turlot A., Kling F., Boivin X., et al. (2017). Impact of precision livestock farming on work and human- animal interactions on dairy farms. A review. Biosci. Biotechnol. Biochem. 21, 1–8.
Jarvis S., Calvert S. K., Stevenson J., Lawrence A. B. (2002). Pituitary-adrenal activation in pre-parturient pigs (Sus scrofa) is associated with behavioural restriction due to lack of space rather than nesting substrate. Anim. Welf. 11 (4), 371–384. doi: 10.1017/S0962728600025100
Kim J., Chung Y., Choi Y., Sa J., Kim H., Chung Y., et al. (2017). Depth-based detection of standing-pigs in moving noise environments. Sensors 17 (12), 2757. doi: 10.3390/s17122757
Lao F., Brown-Brandl T., Stinn J. P., Liu K., Teng G., Xin H. (2016). Automatic recognition of lactating sow behaviors through depth image processing. Comput. Electron. Agric. 125, 56–62. doi: 10.1016/j.compag.2016.04.026
Larsen M. L. V., Andersen H. M. L., Pedersen L. J. (2016). Can tail damage outbreaks in the pig be predicted by behavioural change? Vet. J. 209, 50–56. doi: 10.1016/j.tvjl.2015.12.001
Larsen M. L. V., Wang M., Norton T. (2021). Information technologies for welfare monitoring in pigs and their relation to Welfare Quality®. Sustain 13 (2), 692. doi: 10.3390/su13020692
Leonard S. M., Xin H., Brown-Brandl T. M., Ramirez B. C. (2019). Development and application of an image acquisition system for characterizing sow behaviors in farrowing stalls. Comput. Electron. Agric. 163, 104866. doi: 10.1016/j.compag.2019.104866
Matthews S. G., Miller A. L., Clapp J., Plötz T., Kyriazakis I. (2016). Early detection of health and welfare compromises through automated detection of behavioural changes in pigs. Vet. J. 217, 43–51. doi: 10.1016/j.tvjl.2016.09.005
Nasirahmadi A., Sturm B., Edwards S., Jeppsson K. H., Olsson A. C., Müller S., et al. (2019). Deep learning and machine vision approaches for posture detection of individual pigs. Sensors 19 (17), 3738. doi: 10.3390/s19173738
Norton T., Chen C., Larsen M. L. V., Berckmans D. (2019). Review: Precision livestock farming: building ‘digital representations’ to bring the animals closer to the farmer. Animal 13 (12), 3009–3017. doi: 10.1017/s175173111900199x
Oczak M., Bayer F., Vetter S., Maschat K., Baumgartner J. (2022). Comparison of the automated monitoring of the sow activity in farrowing pens using video and accelerometer data. Vet. J. 192, 106517. doi: 10.1016/j.compag.2021.106517
Ott S., Moons C. P. H., Kashiha M. A., Bahr C., Tuyttens F. A. M., Berckmans D., et al. (2014). Automated video analysis of pig activity at pen level highly correlates to human observations of behavioural activities. Livest. Sci. 160, 132–137. doi: 10.1016/j.livsci.2013.12.011
Reiner G., Hübner K., Hepp S. (2009). Suffering in diseased pigs as expressed by behavioural, clinical and clinical–chemical traits, in a well defined parasite model. Appl. Anim. Behav. Sci. 118 (3), 222–231. doi: 10.1016/j.applanim.2009.02.010
Salak-Johnson J. L., Anderson D. L., McGlone J. J. (2004). Differential dose effects of central CRF and effects of CRF astressin on pig behavior. Physiol. Behav. 83 (1), 143–150. doi: 10.1016/j.physbeh.2004.08.005
Schillings J., Bennett R., Rose D. C. (2021). Exploring the potential of precision livestock farming technologies to help address farm animal welfare. Front. Anim. Sci. 2. doi: 10.3389/fanim.2021.639678
Shao B., Xin H. (2008). A real-time computer vision assessment and control of thermal comfort for group-housed pigs. Comput. Electron. Agric. 62 (1), 15–21. doi: 10.1016/j.compag.2007.09.006
Statham P., Green L., Bichard M., Mendl M. (2009). Predicting tail-biting from behaviour of pigs prior to outbreaks. Appl. Anim. Behav. Sci. 121 (3-4), 157–164. doi: 10.1016/j.applanim.2009.09.011
Tzanidakis C., Simitzis P., Arvanitis K., Panagakis P. (2021). An overview of the current trends in precision pig farming technologies. Livest. Sci. 249, 104530. doi: 10.1016/j.livsci.2021.104530
Vranken E., Berckmans D. (2017). Precision livestock farming for pigs. Anim. Front. 7 (1), 32–37. doi: 10.2527/af.2017.0106
Keywords: behavior, pig farming, precision livestock farming, sensor, welfare, activity, posture, area of interest
Citation: Allueva Molina Q, Ko H-L, Gómez Y, Manteca X and Llonch P (2023) Comparative study between scan sampling behavioral observations and an automatic monitoring image system on a commercial fattening pig farm. Front. Anim. Sci. 4:1248972. doi: 10.3389/fanim.2023.1248972
Received: 27 June 2023; Accepted: 28 November 2023;
Published: 13 December 2023.
Edited by:
Dan Børge Jensen, University of Copenhagen, DenmarkReviewed by:
Panagiotis E. Simitzis, Agricultural University of Athens, GreeceSeveriano Silva, Universidade de Trás-os-Montes e Alto, Portugal
Copyright © 2023 Allueva Molina, Ko, Gómez, Manteca and Llonch. This is an open-access article distributed under the terms of the Creative Commons Attribution License (CC BY). The use, distribution or reproduction in other forums is permitted, provided the original author(s) and the copyright owner(s) are credited and that the original publication in this journal is cited, in accordance with accepted academic practice. No use, distribution or reproduction is permitted which does not comply with these terms.
*Correspondence: Heng-Lun Ko, henglun.ko@uab.cat
†These authors have contributed equally to this work and share first authorship