Waveguides for neurostimulation in the cochlea
 Matthew Kim1
  Joaquin Cury1 Lexie Kessler1
  Michael Triplett2 Sarah Sahota2 Komal Kampasi2
  Xiaodong Tan1 Razi-ul Haque2
  Claus-Peter Richter1,3,4,5*
- 1Department of Otolaryngology, Northwestern University Feinberg School of Medicine, Chicago, IL, United States
- 2Center for Bioengineering, Materials Engineering Division, Lawrence Livermore National Laboratory, Livermore, CA, United States
- 3Department of Biomedical Engineering, Northwestern University, Evanston, IL, United States
- 4Department of Communication Sciences and Disorders, Northwestern University, Evanston, IL, United States
- 5The Hugh Knowles Center, Northwestern University, Evanston, IL, United States
Introduction: Optical stimulation has been suggested for neural stimulation to improve cochlear implants. Light allows for more spatially selective activation of neuron populations than electrical current, offering more independent frequency bands along the spiral ganglion. These bands are available to encode acoustic information with anticipated better frequency resolution, improving cochlear implant user performance in noisy listening environments, tonal languages, and music perception.
Methods: Optical cochlear implants (oCIs) can deliver light either directly via small emitters within the cochlea or via waveguides from external optical sources. We investigated three waveguide designs made from OrmoComp®, a polymer that cures through ultraviolet (UV) radiation. Waveguides were fabricated via injection molding and coated using dip-coating or thermal reflow, or through aspiration of OrmoComp® into polyimide tubing that served as the cladding of the waveguide. The choice of fabrication technique directly determined the waveguides' total diameter: thermal reflow yielded ≈940 μm, dip-coating produced ≈306 μm, and aspiration resulted in ≈132 μm core diameter waveguides. Given the human cochlea's small size, we focused on analyzing the 306-μm and 132-μm waveguides, evaluating their optical performance (propagation and bending losses) and mechanical properties (bending stiffness and insertion forces). Furthermore, we evaluated some of these designs in in-vivo guinea pigs experiments.
Results: For the 100-μm core diameter waveguides, the propagation losses were 12.34 ± 1.26, 1.18 ± 0.88, 1.49 ± 0.58, and 3.43 ± 0.68 dB/cm at 534, 1,375, 1,460, and 1,550 nm, respectively. The respective bending losses at a 2 mm radius of curvature were 5.50 ± 1.32, 0.56 ± 0.26, 0.79 ± 0.18, and 0.64 ± 0.23 dB, and at 1 mm 8.54 ± 1.30, 2.05 ± 0.84, 2.11 ± 0.50, and 1.44 ± 0.37 dB. The bending stiffness of a 1 mm segment of the 100-μm-diameter waveguides was 18.9 ± 2.2 N/m. Insertion forces for the 100-μm-diameter waveguides into an acrylic human-size scala tympani model were < 25 mN. For the waveguides with 306 and 940 μm total diameter, the propagation losses ranged between 0.43 and 2.40 dB/cm at 534, 680, 1,375, and 1,550 nm, between 2.19 and 3.78 dB/cm at 450 and 1,460 nm. Bending losses for 360 degrees at 1,375 nm were 5.0, 2.4, and 0.46 for a bending radius of 2.5-, 3-, and 4-mm.
Discussion: Our study demonstrated that the polymer OrmoComp® is suitable for fabricating waveguides to transmit near-infrared radiation. In-vivo experiments showed optically evoked auditory responses originating from optical stimulation in the guinea pigs' first cochlear turn while radiation was delivered. Incoming experiments will focus on evaluating long-term performance of these waveguides in guinea pigs and cats. This study will be designed to provide insights into the waveguides' performance and biocompatibility over extended periods, essential for their potential clinical application in future oCIs.
1 Introduction
In the mammalian inner ear, outer hair cell action increases acoustically induced basilar membrane vibrations, and inner hair cells convert the mechanical vibrations into a series of action potentials (APs). The timing and rate of the APs encode the acoustic information, which is then sent to the brain. The cochlea also works as a frequency analyzer by separating the spectrum of a complex acoustic signal into small frequency bands with the help of the basilar membrane, encoding each frequency band at a different site along the spiral ganglion. High frequencies cause the largest vibrations toward the cochlear base and low frequencies toward the cochlear apex.
In severely-to-profoundly deaf individuals, outer hair cells are lost, and the mechano-electrical transduction no longer works. Cochlear implants (CIs) restore some hearing by stimulating the remaining auditory neurons in the spiral ganglion directly with electrical current pulses. Despite the CIs' overall success, individual user performance varies largely (Helms et al., 1997; Dunn et al., 2008; Noble et al., 2008; Tyler et al., 2008; Wilson, 2015). Some patients master challenging hearing tasks, such as communicating over the phone in different languages, while others receive little benefit from CIs. Challenges for all users are noisy listening environments, tonal languages, and music perception (Wilson and Dorman, 2008; Webb et al., 2015).
Psychophysical studies have shown that normal-hearing listeners have 50 to 100 independent channels to process complex acoustic signals (Shannon et al., 2004; Mehta et al., 2020). In contrast to normal hearing listeners, in CI users, the interaction between neighboring CI electrode contacts reduced the number of independent stimulation sites to about 7–10 (Brill et al., 1997; Fishman et al., 1997; Friesen et al., 2001; Liu et al., 2004). The low number of channels for cochlear implant users to process information originates in the current spreading from the electrodes to the surrounding tissue. It limits the spatial precision of stimulation, compromising CI performance in pitch perception. It has been argued that the increase in the number of independent stimulation sites will improve CI user experience in noisy listening environments, tonal languages, and music (Fu and Nogaki, 2005; Smith et al., 2013; Feng and Oxenham, 2018). To increase the number of independent channels for stimulation, CI electrodes were placed closer to the neurons (Doshi et al., 2015; Stieghorst and Doll, 2016; Dhanasingh, 2018; Yilmaz-Bayraktar et al., 2022); multipolar stimulation was applied “to steer” the electrical current toward the spiral ganglion neurons (Firszt et al., 2007; Koch et al., 2007; Berenstein et al., 2008; Bonham and Litvak, 2008; Buechner et al., 2008; Brendel et al., 2009; Luo et al., 2010, 2021; Srinivasan et al., 2012; Luo and Garrett, 2020). Efforts are still on the way to achieve the desired increase in independent channels.
Reducing the interaction between adjacent channels during electrical stimulation in CIs remains a significant challenge. In this context, optical stimulation emerges as a promising alternative. The method uses transient light pulses for neural modulation or stimulation and has been particularly noted for its ability to target small, specific neuron populations (Izzo et al., 2006; Hernandez et al., 2014; Richter and Tan, 2014; Jeschke and Moser, 2015). Building on these findings, Matic et al. (2011) and Dieter et al. (2020) showed that optical radiation could be delivered more selectively than electrical current to groups of auditory neurons in the cochlea. Increased spatial selectivity in stimulation could offer a significant leap in the performance of CIs, promising neural prosthesis with enhanced spatial precision and reduced interference between channels. Optogenetics (OG) and infrared neural stimulation (INS) are two optical techniques currently under consideration (Richter and Tan, 2014; Littlefield and Richter, 2021). The light delivery to the cochlea is a critical step in each optical stimulation method. It can be delivered by an array of optical sources inserted into scala tympani along the cochlear spiral ganglion or by bundles of optical waveguides similarly inserted. In a similar approach to conventional cochlear electrodes, in which a single electrode targets an area of the cochlea, each light source in the array or waveguide in the bundle will optically aim at a specific section along the cochlea.
Recent research on optical waveguides has seen significant developments. For instance, studies on polymer-based waveguides have been conducted (Helke et al., 2022; Triplett et al., 2022). Additionally, there have been advancements in high-density micro-LEDs cochlear probes (Klein et al., 2018), incorporating up to 144 light sources. The light delivery system's (LDS) size and stiffness are critical for both methods. It must be stiff enough to sustain the insertion forces without curling. Still, it must also be compliant enough to follow scala tympani during insertion without damaging or penetrating the basilar membrane. The LDS size is also determined by the optical power to be delivered. The size is typically larger for the optical sources with the higher radiant power.
While the LDSs can be used for optogenetic or stimulation with infrared light, we focus on INS because it does not require the expression of light-sensitive channels (opsins) in the auditory neurons. INS works through spatiotemporal heating of a target volume (Shapiro et al., 2012). We have shown that arrays of optical sources are feasible with similar dimensions, bending stiffness, and insertion force values of commercially available CI electrodes (Xu et al., 2018). However, the challenge for active sources in the cochlea is their poor electrical-to-optical energy conversion efficiency, with most of the energy not converted into emissions converted into heat. Consequently, a limiting factor for the insertion of active optical sources into the cochlea is the self-heating of the dies. For example, the conversion efficiency of the bare laser diode die, CHP-176 (SemiNex, Peabody, PA, United States), is 14%. Its emission wavelength is 1,315 nm, and its cavity length is 1,250 μm. The conversion efficiency of a similar die with twice the cavity length of 2,500 μm is 28%. While larger optical sources have a better electrical-to-optical energy conversion efficiency, the size of the scala tympani poses a constraint, particularly for larger dies. On the other hand, larger, more efficient light sources can be placed outside the cochlea, with waveguides delivering the radiation to the cochlea. Placing the active source outside the cochlea has the advantage that no active optical sources are in the cochlea, reducing unnecessary heat delivery and potential cochlear damage. Furthermore, a different risk of active optical sources inserted into the cochlea is the current delivered to the light sources. An accidental “current leak” into the tissue from a defective wire or insulation can cause tissue damage. It should be noted that the literature currently lacks data evaluating the long-term performance of optical sources within implantable devices. With the possible progression toward optical CIs, the precise positioning of the light sources—whether inside the cochlea or externally (using bundles of waveguides for effective light transmission)—will become a critical consideration.
Waveguides can be optical fibers fabricated from low H2O-containing glass. These glasses, often silica-based, are engineered to minimize attenuation losses. In terms of mechanical properties, pure silica fibers typically possess a tensile strength ranging between 2.4 to 4.8 GPa. Depending on the fabrication process, their modulus of elasticity is around 72 GPa. These glass fibers exhibit rigidity when bundled, making them prone to breakage (Balster et al., 2014).
Polymeric waveguides emerge as promising alternatives due to their mechanical properties (Helke et al., 2022; Triplett et al., 2022). However, alongside their benefits, waveguides also face challenges. They experience optical losses influenced by two main factors: material properties, which determine propagation losses, and the precision in fiber surface preparation and connections, which contribute to coupling losses. Moreover, when forming bundles of waveguides, the increased stiffness could pose a challenge during their insertion into the cochlea, requiring careful navigation of delicate inner ear structures. Today, exploring polymeric waveguides for CIs is an active area of research, focusing on identifying the most suitable materials that can balance mechanical flexibility with optimal optical properties. To further explore the opportunities of waveguides in the design of neural modulation devices, in this study, we introduced and tested waveguides made of OrmoComp®, a polymer. We characterized these waveguides mechanically and optically to determine their performance, focusing on their application in future optical CIs.
2 Methods
2.1 Ethics statement
Care and use of animals followed the National Institutes of Health's Guide for Care and Use of Laboratory Animals. Northwestern University's Animal Care and Use Committee approved the use of guinea pigs and all animal procedures (#IS00012338). The guinea pigs were housed in groups of up to four animals; food and water were provided ad libitum; enrichments, nesting materials, and shelters were given. All methods are reported and are in accordance with ARRIVE guidelines.
2.2 Waveguide fabrication
Injection molding is one method for fabricating waveguides. The viscous (2 ± 0.5 Pa*s) polymer OrmoComp® (Kayaku Advanced Materials, Westborough, MA, United States) was injected into a mold made of silicone tubing (AlliedSil, PAT-01, Implantech, United States) and cured with ultraviolet (UV) light within 5 min. The cure time depended on the diameter of the waveguide, the mold's thickness, and the UV light's extinction. After removing the waveguides from the mold, some were coated using thermal reflow with Carbothane PC-3575A, which is a clear polycarbonate-based aliphatic thermoplastic polyurethane with a refractive index nCarbothane = 1.49. On the other hand, some waveguides were dip-coated with the amorphous fluoropolymer CYTOP (AGC Inc. Chemicals Company, Tokyo, Japan), with a refractive index of nCytop = 1.34 (Leosson and Agnarsson, 2012).
The thermal reflow technique (Marinins et al., 2018) involves a controlled heating process in which layers of material, such as Carbothane PC-3575A, becomes malleable and begin to flow. Driven by surface tension effects, this polycarbonate material reshapes to form a smooth, circular cladding around the previously cured OrmoComp® core. The reflowed material solidifies as it cools, ensuring a high-quality, rounded cladding that optimizes light confinement within the core (Figure 1A).
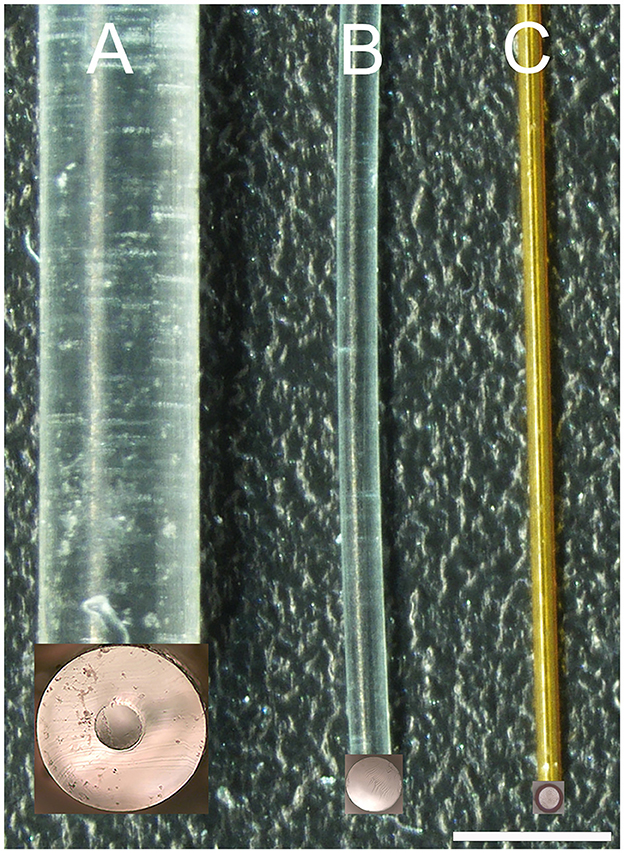
Figure 1. Image of three waveguides. (A, B) are 300 μm core diameter waveguides created by injection molding. The cladding in (A) was formed by thermal reflow with Carbothane and in (B) by dip-coating with CYTOP. (C) is the image of a 100-μm core diameter waveguide created by aspirating OrmoComp into polyimide tubing. The inserts at the bottom end of each waveguide show the uniform surface of the corresponding cross-sections of the waveguides after cutting with a sharp blade. The scale bar is 960 μm.
The dip-coating technique (Evertz et al., 2021) involves immersing the core material of the waveguide into a liquid solution containing the cladding material, in our case, the CYTOP, and then withdrawing it at a controlled speed to achieve uniform coating layers. As the core is lifted from the solution, a thin layer of the cladding material adheres to its surface. Figure 1B shows some of the waveguides coated with CYTOP. In our study, a specialized version of CYTOP (CTX109AE), designed for dip-coating, was used in a concentration of 9%.
The mold from the silicone tubing determined the waveguide's core diameter, about 300 μm. The cladding thickness, which was approximately 320 μm for the thermal reflow and ~3 μm for the dip coating, determined the total diameter of the waveguide. For our examples, dip-coated waveguides were about 306 μm; waveguides coated by thermal reflow had diameters of about 940 μm.
The total internal reflection angle (θ) for our waveguides was calculated based on the refractive index of cured OrmoComp® (nOrmoComp) at 589 nm, which is 1.52 (Micro Resist Technology GmbH, Berlin, Germany), and the refractive indices of the different cladding types. Applying Equations 1, 2, we found that θ is 61.8° for the dip-coated waveguides and 78.6° for the thermal reflow waveguides.
To reduce the core diameter of the waveguides, we used polyimide tubing (MicroLumen, Oldsmar, FL, United States) with an outer diameter of 132 μm and an inner diameter of 100 μm (Figure 1C). The polyimide tubing was the cladding for the waveguide. OrmoComp®, which formed the waveguide's core, was aspirated into the tubing and cured with ultraviolet light (λ = 450 nm). The aspiration technique involves attaching one end of the polyimide tubing to a small syringe while immersing the other end in OrmoComp®. The polymer is drawn into the tube when suction is applied using the syringe. This process can be monitored under a microscope. Once the required length of the waveguide is achieved, the polymer is cured using UV light. These waveguides were about 20 cm long and were shortened to 2–2.5 cm with a sharp razor blade before their mechanical and optical characterization. Given the refractive index of polyimide (npolyimide) spans from 1.39 to 1.45, as indicated by Linshang Technology Co., Ltd. (Shenzhen, China), the total internal reflection angle for our waveguide was between 66.1° and 72.5° (Equation 3).
2.3 Light sources, and coupling, propagation, and bending losses
To measure the 300-μm and 100-μm core diameter waveguide's optical properties, we directly placed, under visual control through a surgical microscope, a 200-μm or 100-μm optical fiber (P200-5-VIS NIR and P100-5-VIS NIR, Ocean Optics, Dunedin, FL) on the waveguide, respectively (Figure 2A). For the 100-μm core diameter waveguide, the optical fiber and the waveguide were aligned with a tightly fitting custom-made sleeve. The waveguide was inserted into one side, and the optical fiber into the other side of the sleeve. Before the optical fiber and waveguide insertion into the sleeve, both tips were dipped into OrmoComp®. After the optical glass fiber and the waveguide made contact, ultraviolet (UV) light at a wavelength λ = 365 nm cured the polymer. All optical measurements were conducted in air. To minimize light scattering at the optical fiber-waveguide interface from reaching the sensor, black silicone, and black tape were employed.
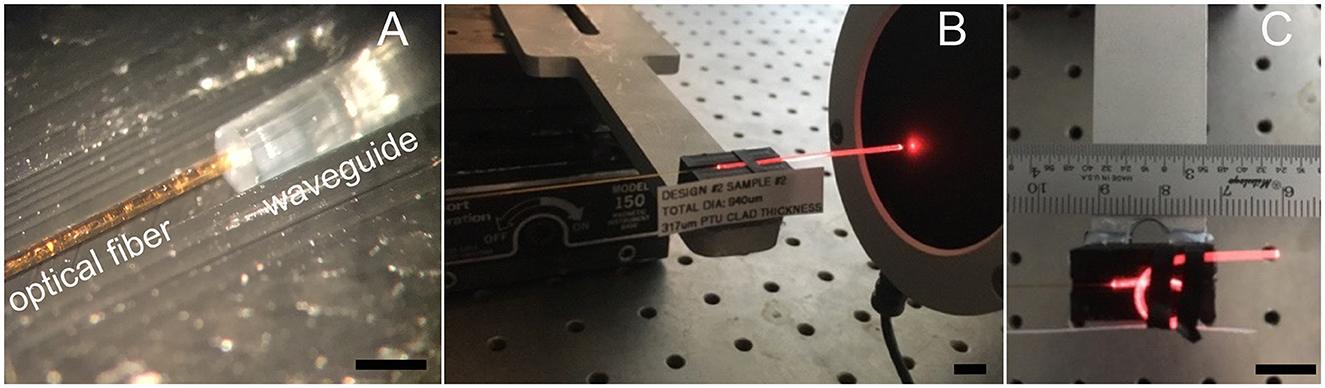
Figure 2. Optical transmission measurements. (A) Shows the 200-μm optical fiber after placing it on the 300 μm-core waveguide. (B) Shows the red pilot light of the infrared laser transmitted by the waveguide, which guides the energy sensor placement before conducting the measurements at the infrared radiation wavelengths. (C) Shows the configuration for determining the bending losses. Light emitting from the bent section will not produce a broader stimulated section because INS requires a focalized light beam in tissue. Light coming out in the bending part of the waveguide will be scattered everywhere. The scale bar in (A) is 1 mm. Scale bars in (B, C) equal 10 mm.
2.3.1 Optical sources
All light sources in our setup were diode lasers spanning a range of wavelengths. For visible light, we used lasers emitting at 450 nm (blue, 5.5 W, 12V CNC Laser Module, 3D Zaiku, Indonesia), 534 nm (green, LSR532H-FC-1.5, CivilLaser, China), and 680 nm (red, 05-LHP-121, Melles Griot, Carlsbad, CA). For the near-infrared (NIR) spectrum, we employed 4-pin fiber-coupled laser diodes from SemiNex, Peabody, MA, United States, which included wavelengths of 1,375 nm (model 4PN-117), 1,460 nm (model 4PN-101), and 1,550 nm (model 4PN-108). The pulse duration was 100 μs. Pulses were delivered at a rate of 5 pulses/second. While faster pulse repetition rates are possible, the slow pulse rate was selected to avoid interactions between subsequent pulses when measuring the neural responses. The NIR lasers were powered using the ILX Lightwave LDC-3724C Laser Diode Controller from IXL Lightwave (Newport Corporation, Bozeman, MT, United States), ensuring precise control over the laser operation.
2.3.2 Propagation losses
To determine the optical properties of the waveguides, we measured the radiant energy (Q) at the tip of the optical fiber and the tip of the waveguide after coupling the optical fiber to the opposite end of the waveguide. The radiant energy of the infrared light was measured using a thermopile J50LP-1A energy sensor connected to a 3 sigma power meter (Coherent, Portland, United States) (Figure 2B). For the visible light, we used a power meter PM100D in combination with the sensor S130VC (Thorlabs, Newton, NJ, United States). From the two measures, the total losses (Ltotal, Equation 4) were calculated and divided by the length of the waveguide (lwaveguide) in centimeters (cm).
After quantifying the total transmission loss, we shortened the waveguide by about one millimeter using a dual-edge sharp razor blade and measured the transmission loss of the “new waveguide” (Ding et al., 2019; Ferreira et al., 2023). It is important to note that careful measures were employed to minimize scattering and reflections at the waveguide's tip, such as positioning the blade perpendicularly to the waveguide to ensure a smooth interface and maintaining close contact between the waveguide and the power meter. To verify the quality of the cut interface, microscopic images of the waveguide cross-section were taken post-cut (Figure 1).
Plotting the lengths of the waveguides (abscissa) vs. the total loss (ordinate) allows data fitting with a linear function. The results provide the intercept as the coupling loss, Lcoupling, and the fit slope as the propagation loss, Lprop.
2.3.3 Bending losses
To determine the waveguide's bending losses, we measured the radiant energy (Q) at the tip of the waveguide while straight (Figure 2B) and compared the value with the radiant energy measured for the same waveguide while bent (Figure 2C). The procedure was performed at different curvature radii. With the two values, we calculated the bending losses (Lbending) using Equation 5.
2.4 Measuring mechanical properties and cochlear insertion forces for the waveguides
The bending stiffness of our OrmoComp® waveguides and the HiFocus 1J Advanced Bionics CI electrode arrays was evaluated to ensure that the waveguides are sufficiently flexible for safe insertion into the cochlea yet stiff enough to avoid folding and buckling. From these measurements, we calculated Young's moduli for the waveguides. A key aspect of our waveguide design is the circular shape, which offers a significant advantage in maintaining consistent stiffness regardless of the bending axis. It is essential to recognize that for conventional CI electrodes, stiffness is significantly influenced by the internal wires' configuration. Different manufacturing approaches profoundly impact the electrode's bending stiffness, such as using “braided” wire arrangements vs. aligning wires in a single plane. We used the HiFocus 1J Advanced Bionics CI electrode array to establish a benchmark. We measured its bending stiffness in two orientations: parallel and perpendicular to the electrode contact surface. These measurements provided a comparative framework against which we assessed the performance of our waveguides.
Figure 3A shows the setup for the bending stiffness measurements. The force meter (Serie 5, Mark-10, NY, United States), mounted to a motorized translational stage (LTS150, Thorlabs, Newton, NJ, United States), moved at a 90-degree angle relative to the long axis of the waveguide (Figure 3A). The edge of the razor blade, glued to the tip of the force meter, advanced until it contacted the waveguide, 1 mm away from the waveguide's fixation point. After the force meter contacted the waveguide, the Mark 10 continuously measured the force and stored the values every 100 ms while advancing for 300 μm. The velocity was 0.1 mm/s. The values increased linearly over that distance, with the slope of the linear section providing the stiffness measure for the waveguide.
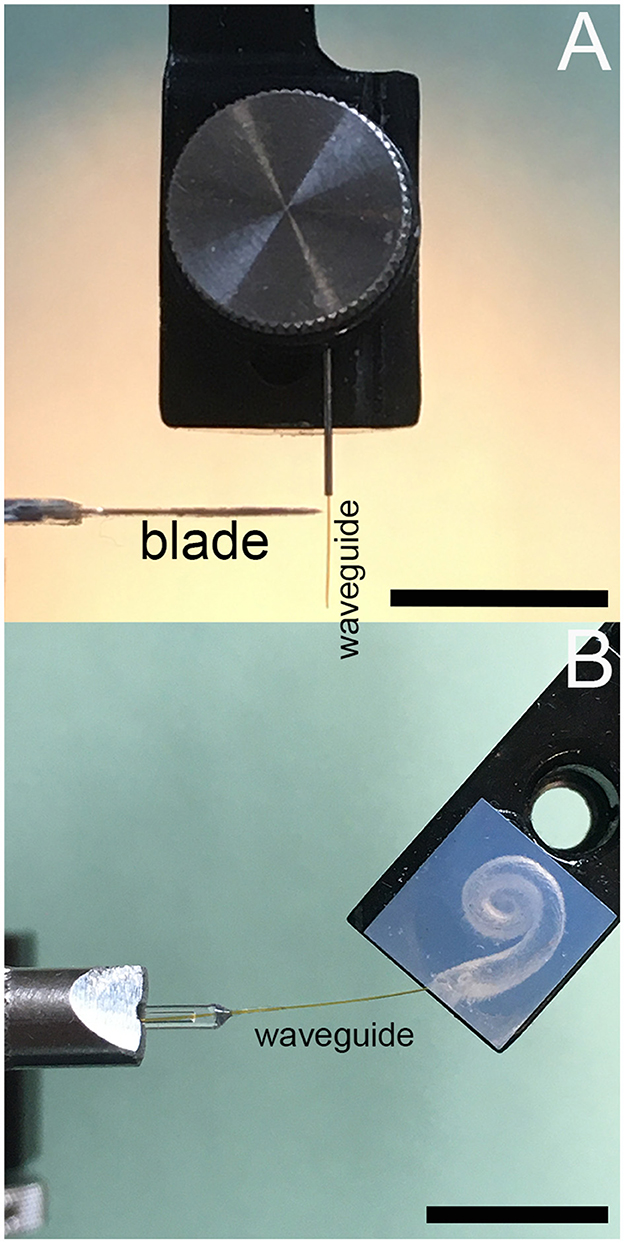
Figure 3. (A) Shows the waveguide bending stiffness measurements setup, and (B) for insertion force measurements. Scale bars equal 10 mm.
The results of the bending stiffness measurements reported as N/m were used to calculate Young's modulus (E) using Equation 6.
where E denotes Young's modulus, F the loading force, l the distance between the clamped end of the waveguide and the point where the force is applied, y the displacement of the waveguide at the loading site; and the corresponding moment of inertia I for a circular rod Irod (Equation 7) and a circular tube Itube (Equation 8), where d is the diameter of the rod, do and di are the outer and inner diameter of the tube.
Figure 3B shows the setup for the insertion force measurement of a single waveguide into an acrylic model of the human scala tympani. The waveguide was mounted to the tip of the force meter. While the instrument advanced, it measured the force to insert the waveguide into the acrylic model of the human scala tympani. The advancement speed was 0.1, 0.3, and 0.5 mm/s, respectively.
2.5 Animals and surgery
Procedures are the same as published previously (e.g., Richter et al., 2011; Agarwal et al., 2021; Xu et al., 2021). Nine male adult albino guinea pigs (age 6–12 months; weight 454–1,290 g) were used for the experiments. The animals were purchased from Kuiper Rabbit Ranch (Gary, IN, United States). After arrival at Northwestern University, the animals were housed for at least 2 weeks for acclimatization before any procedure was performed.
2.5.1 Anesthesia
During the terminal experiment, each guinea pig was anesthetized with an initial intraperitoneal injection of 1.3 mg/kg of urethane in 0.1 M sterile saline solution. Urethane injections were supplemented with ketamine (44 mg/kg) and xylazine (5 mg/kg) at the beginning of the surgical procedure. Atropine sulfate (0.05 mg/kg) was also administered at the start of the experiment to reduce bronchial secretions. Anesthesia was maintained by supplements of ketamine (44 mg/kg) and xylazine (5 mg/kg) along with a saline solution (0.5 ml). The paw withdrawal reflex was used to monitor the level of anesthesia. After the animal was anesthetized, it was transferred to a double-walled acoustic chamber (Serial No. 3579, Model No. 1202A; Industrial Acoustics Company, INC. Bronx, NY, United States). It was placed supine on a thermostatically controlled heating pad (T/pump, Model TP700; Stryker Medical, Portage, MI, United States), maintaining the core body temperature at 38°C. Vitals, including heart rate, respiratory rate, blood oxygenation, and rectal temperature, were monitored and logged every 15 min. A tracheotomy was performed, and a plastic tube (1.9 mm outer diameter, 1.1 mm inner diameter, Zeus Inc., Orangeburg, SC, United States) was secured in the trachea. The breathing was supported by mechanical ventilation with oxygen throughout the experiment using an anesthesia workstation (Hallowell EMC, Pittsfield, MA, United States).
2.5.2 Deafening of the animals
The guinea pig cochleae were damaged by a single transtympanic injection of 200 μL saline solution containing 50 mM of neomycin. The use of this ototoxic drug aimed to generate various levels of residual hearing in the animals, simulating the auditory conditions commonly observed in most cochlear implants' candidates. Injecting neomycin into the middle ear has not been able to completely deafen the animals. It is not a reliable procedure for completely deafening the animals. Following the neomycin injection, the animals were kept for more than 4 weeks for neural degeneration to occur. The damage was variable, as seen by the compound action potential (CAP) thresholds. For the transtympanic injection, the guinea pigs were sedated by gas inhalation of isoflurane 3% in oxygen 97%. The procedure took about 5 min. During the recovery from anesthesia, the animals were monitored until fully recovered.
2.5.3 Surgical access to the cochlea
After the guinea pigs were anesthetized, their head was fixed with dental acrylic (Methyl Methacrylate, CO-ORAL-ITE DENTAL MFG CO, Diamond Springs, CA, United States) to a custom-made head holder, using three 1.5 mm stainless steel self-tapping cortex screws (Veterinary Orthopedic Implants, St. Augustine, FL, United States) as anchors. The guinea pig was then placed in the prone position. A c-shaped retroauricular incision was made, and the cervicoauricular muscles were removed. The cartilaginous outer ear canal was exposed and sectioned. After opening the bulla approximately 2 × 3 mm (Figures 4A, B) with a motorized drill (World Precision Instruments, Sarasota, FL, United States), the basal turn of the cochlea was identified (Figure 4C), and a cochleostomy was created (Figure 4D) with a 0.5 mm Buckingham footplate hand drill (Richards Manufacturing Co., Memphis, TN, United States) or with the motorized drill.
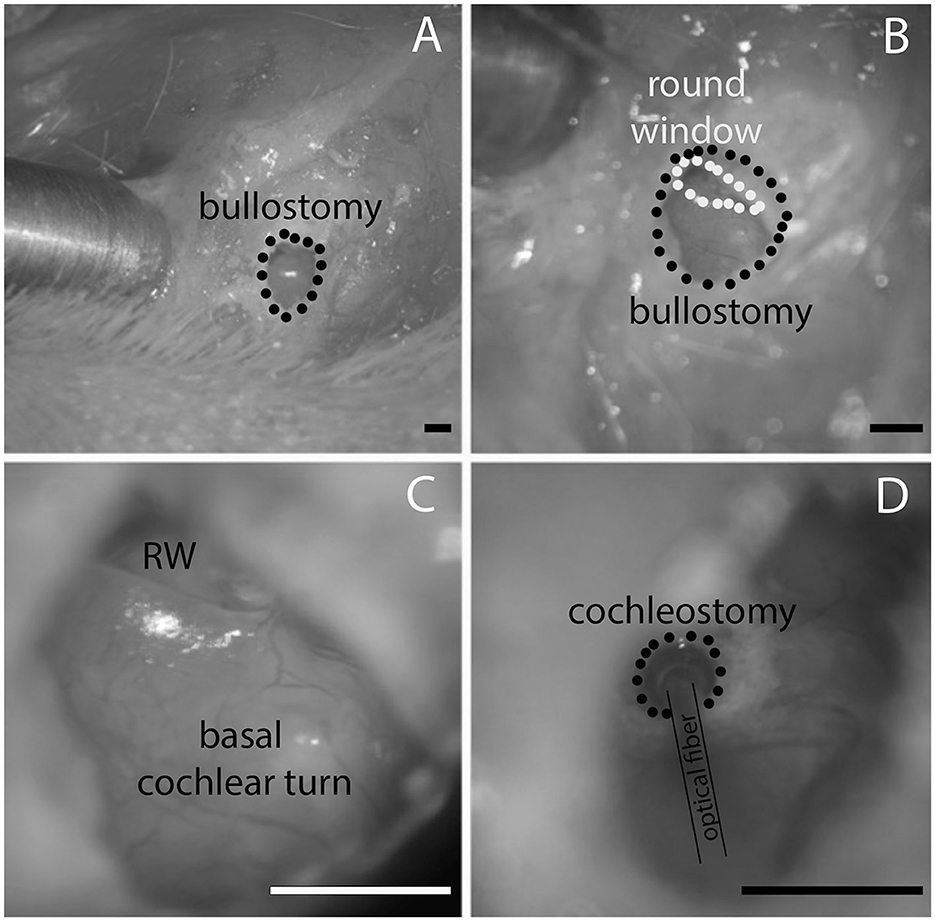
Figure 4. (A) Shows the opening of the opening in the bulla, (B) is the magnified view from (A) at a different angle that the round window comes into view. (C) Shows the round window (RW) and the basal cochlear turn. (D) Shows the location of the cochleostomy in the basal cochlear turn and the placement of the optical fiber. Likewise, the waveguide is inserted through the same cochleostomy. The scale bars equal 1.6 mm.
2.6 Placement of the optical fiber and the waveguide and hearing assessment
Figure 4D shows an image with the polished optical fiber (P200-5-VIS NIR, Ocean Optics, Dunedin, FL, United States) inserted through the openings in the cochlear wall. The polished optical fibers were 230 μm in diameter, with a core of 200 μm. Their numerical aperture was 0.22 ± 0.02, and the acceptance angle was 24.8° (numbers were provided by the vendor, Ocean Optics, Dunedin, FL, United States). The optical fibers or waveguides were mounted on a micromanipulator (MHW103, Narishige, Tokyo, Japan) and placed through the cochleostomy into the scala tympani. Each of the opposite ends of the 3 m long optical fibers was attached to a diode laser output. The insertion depth of the waveguide with a “flat” surface was between 200 and 300 μm, and the fiber was directly placed in front of the spiral ganglion. For the angled surface (45 degrees toward the optical axis), the insertion was about 1 mm. CAPs were measured with a 125-μm diameter silver wire electrode placed on the round window. After completion of the experiments, the deeply anesthetized animals were euthanized by injecting 0.2 mL Euthasol and decapitation.
2.7 Data analysis and presentation
Section 2.3 described the method to determine the total losses, propagation losses, and bending losses. Results were plotted vs. the length of the waveguides. Fitting the data to a linear function provided the coupling and the propagation losses for each radiation wavelength. The y-intercepts provide the coupling losses, and the slopes of the line function the propagation losses. A correlation analysis for each plot provided the correlation coefficient, the confidence intervals, and the radiant power for the measurements. Bending losses were calculated by comparing the total losses at the end of the straight fiber and after a 360-degree bend. For waveguides with a 300 μm core, bending tests were conducted at radii of curvature of 2.5, 3, and 4 mm. In contrast, for the 100 μm core waveguides, smaller radii of curvature of 1 and 2 mm were used. The choice of larger curvature radii for the thicker waveguides was due to their greater stiffness, which made achieving smaller radii more challenging and risked damaging the waveguide structure during testing. All results were tabulated, and the corresponding averages ± one standard deviation (σ) were calculated. Averages ± (σ) for the bending stiffnesses of the waveguides were calculated. The insertion forces for the waveguides were measured, and their values were plotted and compared to the insertion forces of conventional CI electrodes. A qualitative analysis of the data was made. Auditory brainstem response (ABR) thresholds for each animal were plotted with the averages and the corresponding standard deviations.
2.8 Statistical analysis
Differences of the average propagation and bending losses at different wavelengths were tested for statistical significance using Igor Pro 8 (WaveMetrics Inc., Lake Oswego, OR). The Shapiro-Wilk test was applied to test for normal distribution of the data. An Analysis of Variance (ANOVA) was performed, followed by the Tukey's Honest Significant Difference (HSD) post-hoc test. Significance was tested at a 0.05 level.
3 Results
3.1 Coupling and propagation losses
3.1.1 Propagation losses for the 100-μm core diameter waveguide
Table 1 and Figure 5 show the coupling and propagation losses for the waveguides. Losses are expressed in dB and are plotted vs. the length of each corresponding waveguide. The propagation losses at 534, 1,375, 1,460, and 1,550 nm radiation wavelengths were 12.34 ± 1.26, 1.18 ± 0.88, 1.49 ± 0.58, and 3.43 ± 0.68 dB/cm, respectively (Table 1, Figure 5). The number of waveguides examined is indicated by “N” in the plots. In Figure 5, the coupling losses were removed after fitting the data for each waveguide and subtracting the y-intercept from each data point of this particular waveguide. The slope of the plotted data provides the propagation loss. Remember, when referring to the change in radiant energy with the length of the waveguide, the propagation loss is given in decibels (dB), a logarithmic measure that denotes the ratio of input to output power. In this logarithmic scale, a linear increment in dB corresponds to an exponential change in radiant energy when expressed in Joules. Differences in propagation losses were statistically significant when compared to 534 nm (Supplementary Table 1). For the infrared wavelengths, differences in propagation losses were significant when compared to 1,550 nm (Supplementary Table 1).
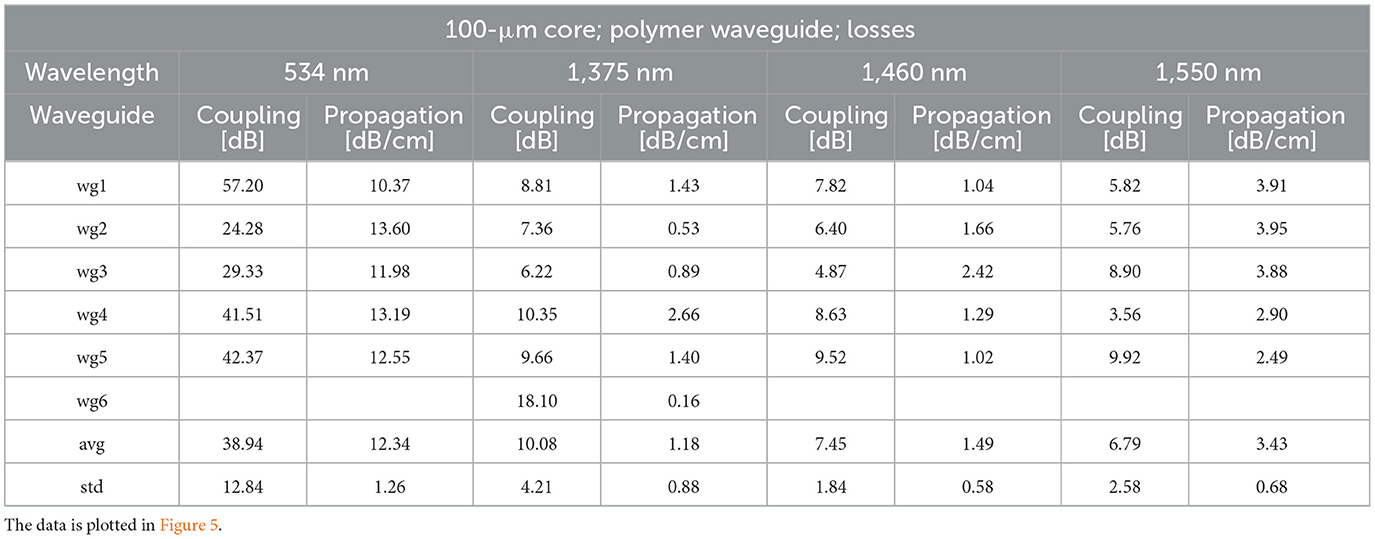
Table 1. Propagation and coupling losses for the 100-μm core diameter waveguides (wg) at 534, 1,375, 1,460, and 1,550 nm wavelengths.
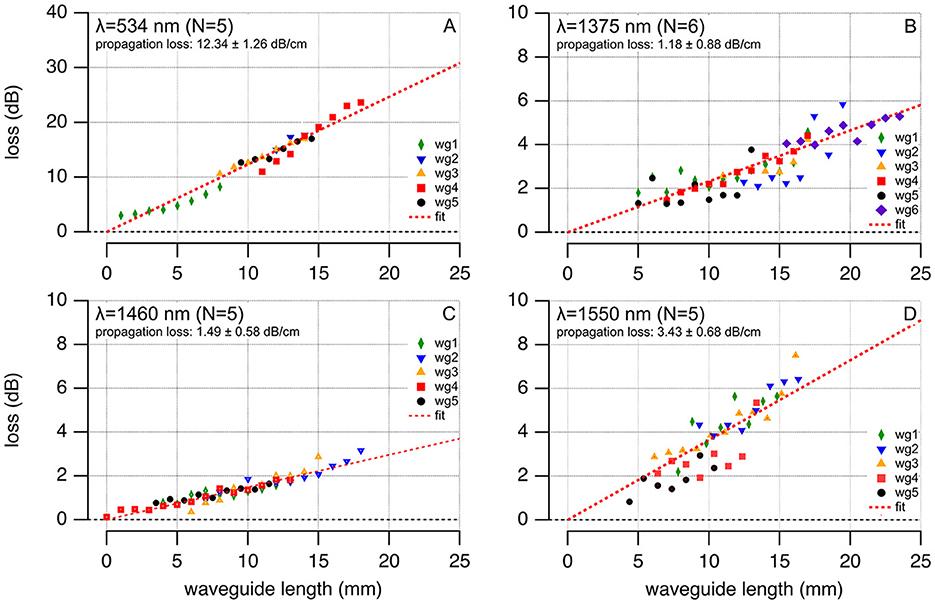
Figure 5. Propagation losses for 100-μm core diameter polymer waveguides at varying wavelengths are shown for 534 nm (N = 5, average loss 12.34 ± 1.26 dB/cm), 1,375 nm (N = 6, average loss 1.18 ± 0.88 dB/cm), 1,460 nm (N = 5, average loss 1.49 ± 0.58 dB/cm), and 1,550 nm (N = 5, average loss 3.43 ± 0.68 dB/cm). Each wavelength's data, denoted by differently colored waveguides (wgx), are plotted with waveguide lengths on the abscissa and total losses on the ordinate, fitting a red dash linear function to determine propagation loss.
3.1.2 Propagation losses for the 300-μm core diameter waveguide
For the 306-μm diameter waveguides, denoted as design #1 (300 μm core plus the 3-μm thick CYTOP cladding), the propagation losses at 450, 534, 680, 1,375, 1,460, and 1,550 nm radiation wavelengths were 3.78 ± 0.85, 0.43 ± 1.61, 0.77 ± 1.62, 0.98 ± 0.92, 3.55 ± 1.80, and 0.97 ± 1.04 dB/cm, respectively (Table 2). The coupling losses varied for the 306-μm diameter waveguide because of the limited reproducibility in placing the optical fiber onto the waveguide (Table 2). Differences in propagation losses were statistically significant when compared to 450 nm (Supplementary Table 1).
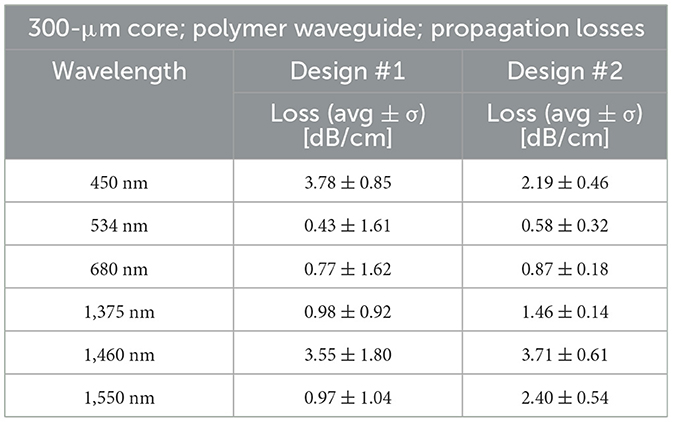
Table 2. Design #1 (cladding formed by dip-coating) reveals the propagation losses for the 300-μm core plus the 3-μm thick CYTOP cladding with a total diameter of 306 μm. Design #2 (cladding formed by thermal reflow) shows the propagation losses for the 300 μm core and cladding obtained by the reflow technique, adding 330 μm thickness, summating to a total of 960-μm diameter waveguide.
For the 960-μm diameter waveguides, denoted as design #2 (300 μm core plus the 330 μm thick Carbothane cladding), the propagation losses at 450, 534, 680, 1,375, 1,460, and 1,550 nm radiation wavelengths were 2.19 ± 0.46, 0.58 ± 0.32, 0.87 ± 0.18, 1.46 ± 0.14, 3.71 ± 0.61, and 2.40 ± 0.54 dB/cm, respectively (Table 2). Differences in propagation losses were statistically significant between 450 nm and 534 nm or 680 nm, between 1,460 nm and 534 nm or 450 nm, and between 1,550 nm and 534 nm or 680 nm (Supplementary Table 1).
3.2 Bending losses
3.2.1 Bending losses for the 100-μm core diameter waveguide
Bending losses for the 100-μm waveguides (N = 5) were larger for 1 mm than the 2 mm curvature radius (Table 3). At 2 mm, the average bending losses were 5.50 ± 1.32, 0.56 ± 0.26, 0.79 ± 0.18, and 0.64 ± 0.23 dB at wavelengths 534, 1,375, 1,460, and 1,550 nm, respectively. At 1 mm, the average losses were 8.54 ± 1.30, 2.05 ± 0.84, 2.11 ± 0.50, and 1.44 ± 0.37 dB at wavelengths 534, 1,375, 1,460, and 1,550 nm, correspondingly. Supplementary Table 1 shows the outcomes of the statistical evaluation of the differences in bending losses. Differences were statistically significant when compared to 534 nm Bending losses at different radii were statistically significant only at 534 nm.
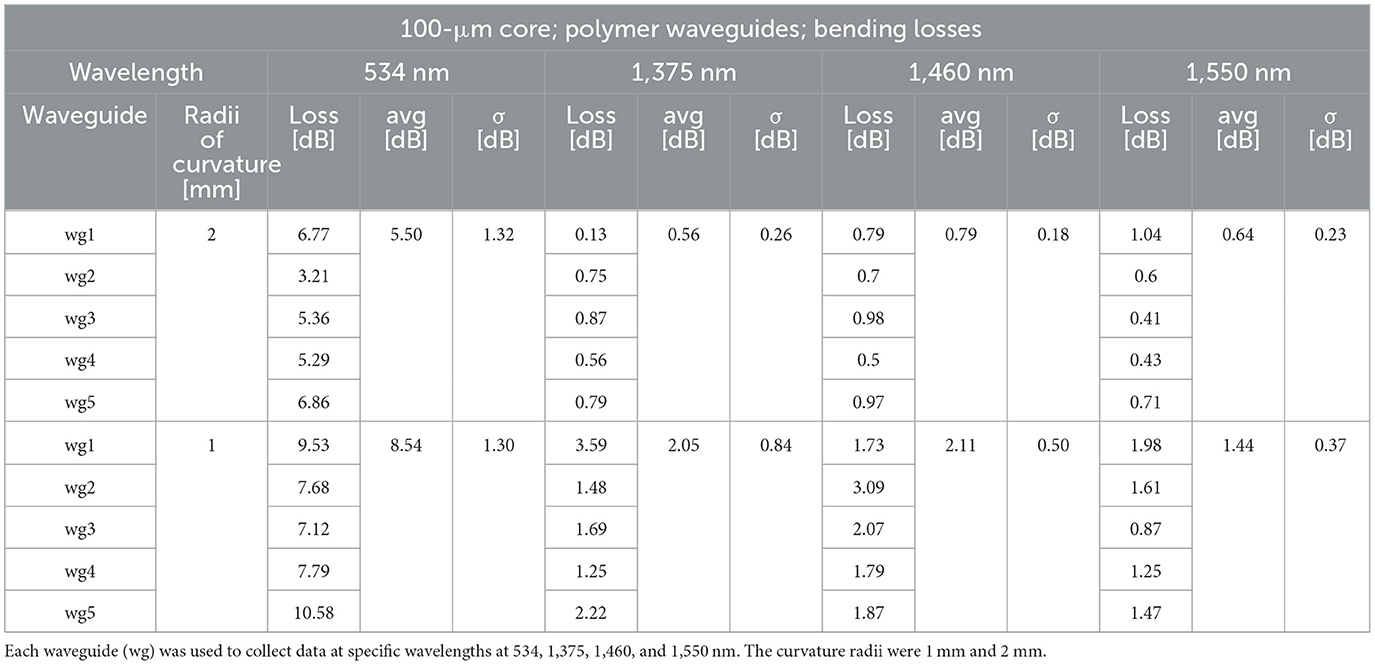
Table 3. Bending losses for the 100-μm core polymer waveguides.
3.2.2 Bending losses for the 300-μm core diameter waveguide
Waveguides with a 300-μm core and 940-μm total diameter were too large and stiff to measure bending losses at a 4 mm or smaller bending radius. Bending losses for a full circle (Figure 2C) for the waveguides with 306 μm in total diameter were determined at 1,375 nm. The losses are 5.0, 2.40, and 0.46 dB for a bending radius of 2.5, 3, and 4 mm, respectively. It is important to emphasize that even though we could measure the bending losses, the 306 μm waveguides demonstrated considerable stiffness.
3.3 Mechanical properties of a single waveguide
The bending stiffness was measured as described in Methods (Section 2.4). The bending stiffness of a conventional CI electrode is 41.1 ± 21.6 N/m (Figure 6). The large variability in stiffness for the traditional CI electrodes originates in the different measurement sites along the electrode. These electrodes are more compliant at the tip than at the base. Although Young's modulus for the silicone rubber spans 2.7–4.3 MPa (Feng et al., 2017), the mechanical properties of the CIs electrode are also determined by the arrangement of the platinum wires encapsulated within the silicone. Therefore, it is not straightforward to use the results from our stiffness measurements and directly derive the corresponding Young's modulus.
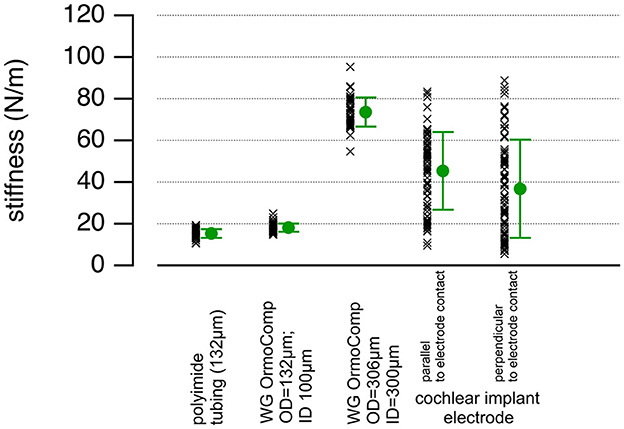
Figure 6. The plot shows the stiffness values, averages, and standard deviations for the 132 μm and 306 μm total diameter waveguides and the HiFocus 1J Advanced Bionics CI arrays. The data vary for the conventional HiFocus electrodes because the stiffness decreases toward the tip of the electrode, and the data were pooled.
For the 100-μm waveguides made from OrmoComp®, the cladding (empty tubing) contributed significantly to the bending stiffness; it was 15.40 ± 2.00 N/m (Figure 6). The corresponding Young's modulus estimation for the empty tubing, using 1 mm for the distance between the clamped end of the waveguide and the point where the force is applied, 100 μm for the inner diameter, and 132 μm for the outer diameter of the tubing, is about 0.51 GPa. The stiffness increased by filling the tubing with OrmoComp® the bending stiffness was 18.9 ± 2.2 N/m (Figure 6). The bending stiffness of the waveguide with a 300-μm core diameter was 73.50 ± 6.70 N/m (Figure 6). The bending stiffness measurements indicate that the core's Young's modulus is approximately 0.062 GPa. This estimate aligns well with published data (Buchroithner et al., 2020), which report Young's modulus of OrmoComp® for structures of a similar size to be in the range of 0.047 to 0.102 GPa.
3.4 Insertion forces measurements
Insertion forces for the 306 μm total diameter waveguides into an acrylic human-size scala tympany model range from 10–200 mN and increase with the distance of the electrode insertion. During the process, we observed no buckling. Waveguide insertion forces into a selected acrylic model of the scala tympani of the human cochlea compared with the values obtained for electrode arrays used in contemporary CI systems. In our tests, 100-μm core waveguides required insertion forces not exceeding 25 mN, as depicted in Figure 7A. Various insertion speeds, ranging between 0.1 and 0.5 mm/s, did not influence the insertion forces, as shown in Figure 7B. In both panels, at a depth of 8–10 mm, the waveguides encounter the first curve in the cochlea model. This anatomical feature accounts for the observable surge in insertion forces.
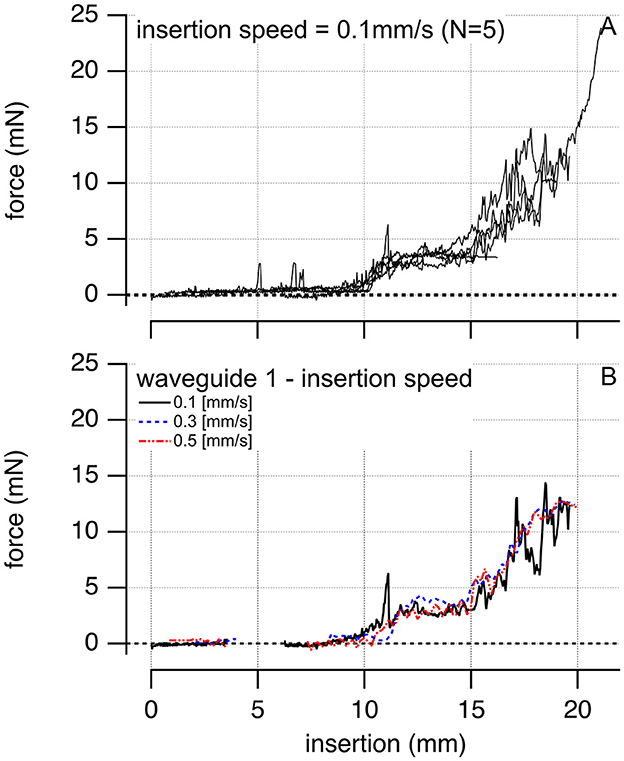
Figure 7. The plots show examples of inserting a single 100-μm core diameter waveguide into the scala tympani of a human-size acrylic cochlear model. (A) Is the insertion force for N = 5 different waveguides inserted at a velocity of 0.1 mm/s. Insertion forces for the waveguides are comparable. (B) Shows one of the waveguides inserted at different velocities, 0.1, 0.3, and 0.5 mm/s, respectively.
3.5 Verification of the waveguides in guinea pigs
3.5.1 Compound action potential threshold curves of the guinea pigs in the study
CAP thresholds to pure tone stimuli served to assess baseline hearing for nine guinea pigs. One animal had no response at any frequencies tested. CAP-thresholds for the animals are shown in Figure 8. The gray line represents the maximum speaker sound level, and the dotted gray line is the average threshold of normal-hearing animals ± one standard deviation. The remaining markers show the thresholds determined for the animals in the study. Markers on the gray line indicate that no response could be recorded at the highest sound level delivered by the speaker.
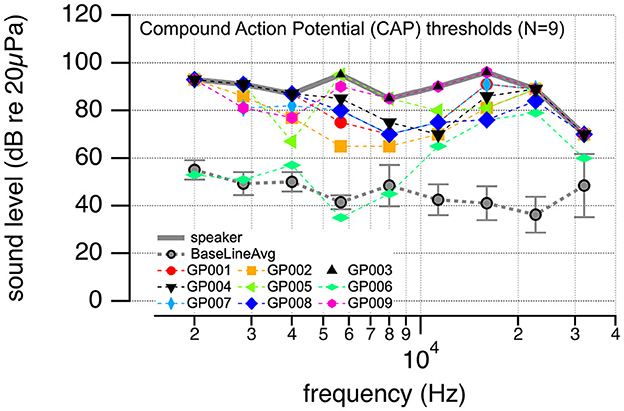
Figure 8. The plot shows the compound action potential (CAP) thresholds to pure tone stimulation at different frequencies. The solid gray line is the maximum sound level that could be achieved with the given settings. The dotted gray line shows the average (±one standard deviation) CAP thresholds for nine normal-hearing animals. The markers show the thresholds for the animals used in this study. All have drastic threshold elevations.
3.5.2 Response growth function for the flat polished glass fiber and the waveguides
After placing the 200-μm core optical fiber through the cochleostomy in the basal turn of each guinea pig's cochlea, we assessed the responses to 100-μs optical pulses at 1,375 nm delivered at 10 Hz. Figure 9 shows the results. Figure 9A shows the input-output contours, which demonstrate the growth of the CAP amplitude with increasing radiant energy/pulse. Guinea pigs GP004, GP005, and GP007 did not respond to optical stimulation and were not included in further data analysis. Figure 9B shows the CAP amplitude optically evoked by 100 μs square pulses at 100 μJ/pulse radiant energy. It is plotted vs. the thresholds of the animals to acoustic stimulation at 500 Hz (blue hexagons), 1,000 Hz (green hexagons), and 8,000 Hz (orange hexagons). The correlation coefficients for the laser and acoustically evoked responses obtained with a linear correlation test (Igor Pro 8) are −0.62, −0.27, and −0.34 at 8,000, 1,000, and 500 Hz, respectively. No systematic correlation was found between the optical evoked response amplitude and the acoustic threshold. Figure 9C shows responses to optical stimulation using the waveguides 300-μm core (total diameter 306 μm). In one animal (GP001, Figure 9), the waveguide was cut at a 45-degree angle, inserted into the scala tympani, and then rotated by 360 degrees (Figure 9D). In the air, the cut surface reflects the radiation by ~90 degrees, and the waveguides become “side-emitting.” In fluids, the difference in the refractive index between the waveguide and the water is less than between the waveguide and air. The waveguide still emits to the side. The optically evoked auditory responses showed the smallest CAP amplitude when the waveguide's orientation was selected, and the beam pointed toward the cochlear wall.
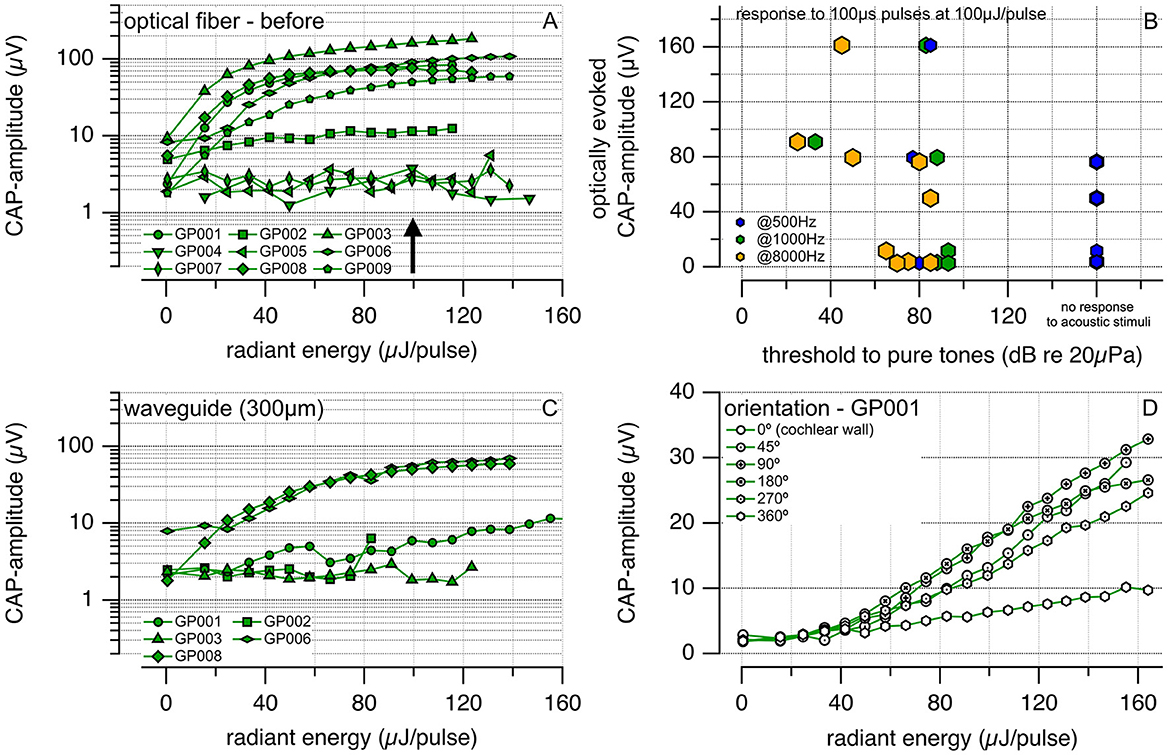
Figure 9. (A) Shows the compound action potential (CAP) amplitudes evoked optically in guinea pigs using a polished optical fiber with a 200 μm core (P200-5-VIS NIR, Ocean Optics) and coated with CYTOP. A larger radiant energy delivered to the cochlea leads to a larger CAP amplitude. (B) Shows the optical CAP amplitude evoked by 100-μs optical pulses at 100 μJ/pulse vs. the threshold to pure tone acoustic stimuli. Previous experiments in our and other laboratories show that laser radiation in the infrared can result in pressure pulses. If pressure pulses are responsible for the responses rather than direct neural stimulation, a correlation should exist between the amplitude evoked by a laser pulse and the animals' hearing. Deaf animals should have a smaller response amplitude than hearing animals, and the optically evoked amplitude should correlate with the response threshold to acoustic stimuli. The correlation coefficients for the laser and acoustically evoked responses are −0.62, −0.27, and −0.34 at 8,000, 1,000, and 500 Hz, respectively. (C) Exhibits the CAPs amplitude evoked optically using our waveguide with a total diameter of 306 μm. We employed the waveguide in those animals from (A) that showed optical responses. (D) Describes the CAPs amplitude vs. the radiant energy delivered for different orientations of the waveguide tip to the auditory neurons. The waveguide was cut at 45 degrees, inserted into the scala tympani, and rotated by a given angle after each measurement. The neural response amplitude was the smallest for the beam path pointing to the cochlear wall.
4 Discussion and conclusion
Our study demonstrated that the polymer OrmoComp® is suitable for fabricating waveguides to transmit near-infrared radiation. Initially, we experimented with waveguides with a core diameter of approximately 300 μm, which was large enough to assess their mechanical and optical properties effectively. However, this size proved too large for practical use in future multi-channel optical CIs. As a result, our focus shifted to smaller waveguide diameters, and we assessed their optical and mechanical properties.
Using light to evoke auditory responses could enhance the spatial precision of stimulation in CIs, significantly improving how implant recipients perceive sound. As we advance in developing optical CIs (oCIs), selecting the optimal placement for light sources is crucial. Internal placement within the cochlea comes with challenges related to size and concerns about current leakage, as detailed in the Introduction. Meanwhile, the external placement of light sources housed within the implant casing necessitates hermetic sealing and waveguides for light delivery into the cochlea.
For waveguides, the cochlear spiral structure presents distinct design encounters. If not meticulously addressed, the geometry of the waveguides may pose an increased risk of bending losses, compromising the performance of the oCIs. It is not just about light transmission; the goal is to harmonize mechanical properties with efficient optical properties.
In this context, the design of polymeric waveguides for biomedical applications is an emerging field with few off-the-shelf options. For instance, FiberFin (Yorkville, Illinois, United States) produces polymeric waveguides designed for the visible range, which is not suitable for INS. Their core diameter is large (up to 1 mm), and they do not provide the necessary bending flexibility essential for our application, considering the small size of the human cochlea. A different vendor, Nitto Denko (Osaka, Japan), provides polymeric waveguides for medical endoscopy. Although they might have applications in other medical fields, they do not meet our requirements.
In pursuing different waveguide solutions for cochlear applications, we recognize the efforts of a research group from Germany. They have been exploring the design of polymeric waveguides intended to be used in future optogenetics-based-CIs (Helke et al., 2022). Using a wafer-level micromachining process, they have manufactured flexible waveguides using Polymethyl Methacrylate (PMMA) as the cladding and SU-8, an epoxy photoresist, for the core. This fabrication approach allows for large-scale production. However, the waveguides produced are rectangular, which can introduce challenges. From a mechanical perspective, the bending stress experienced by circular waveguides is distributed more uniformly due to their geometric form. This contrasts with rectangular waveguides, where stress distribution can be non-uniform, leading to mechanical failures in the corners and anisotropic and inhomogeneous refractive index distribution (Huang, 2003). This could result in increased bending and propagation losses.
For this reason, we have opted for circular waveguides. Nevertheless, large-scale production presents its own challenges, particularly when considering the limitations of wafer-level micromachining for such rounded geometries. We have employed a fabrication process that utilizes circular molds to address this. While addressing the manufacturing constraints, selecting the suitable material for the core in these waveguides also emerged as a critical factor. In this context, we chose the polymer OrmoComp®. This selection was influenced by its unique characteristics as an Ormocer, a material that merges the benefits of organic polymers and inorganic ceramics (Schizas and Karalekas, 2011). Its composition enables it to display glass-like properties after UV curing, contributing to its durability and stability, similar to traditional ceramics, while maintaining the flexibility typical of organic materials. The hybrid structure of OrmoComp®, which combines inorganic building blocks with organic groups, offers thermal and chemical stability and notable optical transparency, essential for effective light transmission. In addition, the biocompatibility of OrmoComp® is also a significant consideration, especially for medical devices such as future oCIs. Its compatibility with our circular waveguide molding process facilitates a more manageable and reproducible production method.
Building on these considerations, our study demonstrated that OrmoComp® is a suitable material for delivering near-infrared radiation. We initially experimented with waveguides having a core diameter of approximately 300 μm. This size not only allowed us to assess their mechanical and optical properties but also helped us to evaluate the performance during in-vivo optical stimulation of the cochlea in guinea pigs. These in-vivo experiments using our waveguides with a 300 μm core proved successful. They effectively delivered infrared light to target neurons and efficiently evoked neural responses (Figure 9B). An important observation from these experiments is the orientation of the waveguide to the auditory neurons. Optimal neural responses were achieved when the radiation was oriented correctly, emphasizing the critical role of accurate positioning, especially as we look toward designing future waveguide bundles. By conducting experiments with deafened guinea pigs, we ensured that sound did not contribute to evoking an action potential optically. No correlation was found when comparing the thresholds of optical and acoustic stimulation in these animals, highlighting the distinct mechanisms at play for each type of stimulation.
While the 300 μm core waveguide showed promising performance in optically stimulating the guinea pigs' cochlea, they were too large in diameter and stiff. Considering future multi-channel oCIs, reducing the diameter size of the waveguides became of interest. This led to an increased focus on using polyimide tubing as a cladding material. By aspirating the polymer with a syringe into the polyimide tubing, we successfully built waveguides with a core diameter of 100 μm. The method of aspirating should be conducted carefully to avoid forming air bubbles within the waveguide, which affect light propagation. The reduced diameter significantly improved our initial prototypes (injection molding). This smaller size enhances the overall mechanical compliance, making them more suitable for the human cochlea.
It is important to note that our in-vivo studies using guinea pigs are necessary to ensure that the waveguides are functionally capable of transmitting infrared light and stimulating the auditory neurons before advancing to a human clinical trial. In these in-vivo tests, the waveguides did not extend beyond the first turn of the guinea pig's cochlea due to their stiffness. We positioned them at 200 to 300 micrometers within the cochlea, focusing solely on assessing the light transmission efficiency for stimulating the auditory neurons at the cochlea base. In line with this, we used an acrylic human-sized model when evaluating the insertion forces for single 100-μm core waveguides instead of a guinea pig's model. This decision was based on the need to test the waveguides in an environment that accurately reflects the human cochlea's unique curvature, size, and length. Furthermore, the transparency of the acrylic model allows for clear visualization of the waveguide during insertion, enabling us to observe and assess any potential buckling or folding of the waveguide. It is vital to ensure its proper mechanical functioning and integrity and provide insights into how the waveguides would behave in a clinical scenario. Based on the aforementioned, the insertion forces measurements for single 100-μm core waveguides were in line with values reported for conventional cochlear electrodes arrays (Roland, 2005; Majdani et al., 2010; Schurzig et al., 2010; Kontorinis et al., 2011a,b; Miroir et al., 2012; Nguyen et al., 2012; Balster et al., 2014; Wade et al., 2014; Mirsalehi et al., 2017; Lo et al., 2018; Vadivelu et al., 2019; Hendricks et al., 2021; Snels et al., 2021; Zuniga et al., 2021; Bottcher-Rebmann et al., 2022). Considering that we inserted one waveguide at a time into the cochlear conduit to determine their single mechanical insertion behavior, we can expect insertion forces to increase when using a bundle of waveguides due to the overall larger stiffness. Therefore, a unique design of the fiber bundles should be considered, allowing individual waveguides to slide relative to each other. In this regard, it is important to note that fewer waveguides are in a cross-section of the bundle tip, decreasing the stiffness but increasing at its base (larger number of waveguides at the bundle base). In addition, to facilitate the insertion procedure, thus reducing the exerted forces, the bundle can have a pre-bended form at the tip, similar to cochlear electrode arrays. In addition to these results, we also found that force measurements at different insertion velocities exhibited similar slopes as the waveguide was introduced deeper into the cochlea (see Figure 7). From these results, we conclude that the insertion forces are mainly dominated by bending rather than friction forces between the waveguide and the cochlear walls.
Concerning propagation losses in our waveguides, they encompassed a diverse range of wavelengths from the visible to the infrared spectrum, including 450 nm, 534 nm, 680 nm, 1,375 nm, 1,460 nm, and 1,550 nm. However, the selection was narrowed when examining bending losses, specifically omitting the 450 and 680 nm wavelengths. Our primary focus was on the potential of infrared neurostimulation (INS) for CIs, particularly given its characteristic of stimulating the cochlea without the need for genetic modifications of the spiral ganglion neurons. Propagation losses for waveguides 100-μm core were minimum at 1,375 and 1,460 nm, while 534 nm losses were about ten times greater. Bending losses over 360 degrees, the loop showed values in the range of 1 dB and below for a similar curvature radius present in the human cochlea. Previously published results on the measurements of the optical properties of OrmoComp® provide valuable data that corroborate our measurements (Heinrich, 2021; Kampasi et al., 2021). Their work has determined the optical attenuation of OrmoComp® slabs, a parameter that sets a lower limit of optical losses in waveguides made from this material. It is important to recognize that propagation losses in waveguides are composed of not only the inherent losses within the core material, such as absorption and scattering (optical attenuation), but also additional scattering losses at the cladding interface. Focusing on NIR wavelengths in our study, specifically at 1,375, 1,460, and 1,550 nm, the optical attenuation of OrmoComp® measured by Heinrich (2021) and Kampasi et al. (2021) was between 0.5–2 dB/cm. This range is consistent with our findings for these wavelengths, as detailed in the tables of our manuscript. However, in the visible spectrum, particularly between 400–650 nm, despite the optical attenuation of OrmoComp® remaining similar in these works, our waveguides exhibit significantly higher propagation losses in the visible spectrum. This discrepancy suggests a low performance of the polyimide cladding material in our waveguide design for visible wavelengths. The propagation losses we measured were considerably higher up to ten times than the attenuation values for OrmoComp® reported in the studies mentioned above.
As our research advances, we prepare to conduct further evaluations on the 100 μm-core OrmoComp® waveguides, building upon the characterizations already presented in the current work. These upcoming studies will focus on improving the light coupling using microlenses, assessing the waveguides' resilience to photobleaching and their stability in electrolyte environments similar to cochlear perilymph. Additionally, we intend to undertake a long-term study of these waveguides in an animal model such as guinea pigs and cats. This study is designed to provide insights into the waveguides' performance and biocompatibility over extended periods, essential for their potential clinical application in future oCIs.
We also plan to explore the potential for reducing the total diameter of waveguides to approximately 50 μm and even smaller. This reduction in diameter is crucial for effectively fitting the waveguides within the scala tympani of the human cochlea. Given the scala tympani's varying inner diameter—from 1.5–2.5 mm at the base to below 1 mm at the apex—we anticipate the feasibility of housing compact bundles comprising 40–50 waveguides in this region. In achieving this, we could consider using smaller microtubing with the required total and inner diameters, although this approach presents specific challenges, particularly with polyimide tubing. A promising alternative strategy involves using Nylon-6 microtubing as molds for the waveguides. The critical challenge in this approach is to remove the tubing without compromising the OrmoComp core. Nylon-6 may offer a more practical solution for dissolving than polyimide, potentially easing the fabrication process. Successfully navigating this challenge would enable us to fabricate OrmoComp® cores of the desired small diameters. To explore the waveguide's optical and mechanical properties, these cores could then be coated with several cladding materials, such as thin CYTOP layers and UV-curable resins (Evertz et al., 2021). Such investigations in cladding are crucial for ensuring efficient light transmission and mechanical stability during the insertion of the fiber bundle into the human cochlea, thereby aiming to enhance future oCIs performance.
Data availability statement
The raw data supporting the conclusions of this article will be made available by the authors, without undue reservation.
Ethics statement
The animal study was approved by IACUC at Northwestern University. The study was conducted in accordance with the local legislation and institutional requirements.
Author contributions
MK, LK, and XT: Methodology, data acquisition, investigation, and writing, review & editing. JC: Methodology, data acquisition, formal analysis, investigation, and writing, review & editing. MT and KK: Conceptualization, methodology, and writing, review & editing. R-uH and C-PR: Conceptualization, methodology, data acquisition, formal analysis, investigation, project administration, writing the original draft, and writing, review & editing. All authors contributed to the article and approved the submitted version.
Funding
The author(s) declare that financial support was received for the research, authorship, and/or publication of this article. This work was funded through the NIH by grants R56DC017492 and R01DC018666 at Northwestern and it was performed under the auspices of the U.S. Department of Energy by Lawrence Livermore National Laboratory under Contract DE-AC52-07NA27344.
Conflict of interest
C-PR and JC filed patents on the fabrication of waveguides. C-PR is a co-founder of NuroTone and co-owner of a patent on the fabrication and use of waveguides.
The remaining authors declare that the research was conducted without any commercial or financial relationship that could be construed as a potential conflict of interest.
Publisher's note
All claims expressed in this article are solely those of the authors and do not necessarily represent those of their affiliated organizations, or those of the publisher, the editors and the reviewers. Any product that may be evaluated in this article, or claim that may be made by its manufacturer, is not guaranteed or endorsed by the publisher.
Supplementary material
The Supplementary Material for this article can be found online at: https://www.frontiersin.org/articles/10.3389/fauot.2024.1221778/full#supplementary-material
References
Agarwal, A., Tan, X., Xu, Y., and Richter, C. P. (2021). Channel interaction during infrared light stimulation in the cochlea. Laser. Surg. Med. 53, 986–997. doi: 10.1002/lsm.23360
Balster, S., Wenzel, G. I., Warnecke, A., Steffens, M., Rettenmaier, A., Zhang, K., et al. (2014). Optical cochlear implant: evaluation of insertion forces of optical fibres in a cochlear model and of traumata in human temporal bones. BioMed. Tech. 59, 19–28. doi: 10.1515/bmt-2013-0038
Berenstein, C. K., Mens, L. H., Mulder, J. J., and Vanpoucke, F. J. (2008). Current steering and current focusing in cochlear implants: comparison of monopolar, tripolar, and virtual channel electrode configurations. Ear. Hear. 29, 250–260. doi: 10.1097/AUD.0b013e3181645336
Bonham, B. H., and Litvak, L. M. (2008). Current focusing and steering: modeling, physiology, and psychophysics. Hear. Res. 242, 141–153. doi: 10.1016/j.heares.2008.03.006
Bottcher-Rebmann, G., Schell, V., Budde, L., Zuniga, M. G., Baier, C., Lenarz, T., et al. (2022). A tool to enable intraoperative insertion force measurements for cochlear implant surgery. IEEE Trans. BioMed. Eng. 70, 1643–1650. doi: 10.1109/TBME.2022.3224528
Brendel, M., Frohne-Buechner, C., Stoever, T., Lenarz, T., and Buechner, A. (2009). Investigation of pitch discrimination and the effect of learning for virtual channels realized by current steering. Acta Otolaryngol. 129, 1425–1433. doi: 10.3109/00016480902725205
Brill, S. M., Gstöttner, W., Helms, J., Von Ilberg, C., Baumgartner, W., Müller, J., et al. (1997). Optimization of channel number and stimulation rate for the fast continuous interleaved sampling strategy in the COMBI 40+. Otol. Neurotol. 18, S104–106.
Buchroithner, B., Hartmann, D., Mayr, S., Oh, Y. J., Sivun, D., Karner, A., et al. (2020). 3D multiphoton lithography using biocompatible polymers with specific mechanical properties. Nanoscale Adv. 2, 2422–2428. doi: 10.1039/D0NA00154F
Buechner, A., Brendel, M., Krueger, B., Frohne-Buchner, C., Nogueira, W., Edler, B., et al. (2008). Current steering and results from novel speech coding strategies. Otol. Neurotol. 29, 203–207. doi: 10.1097/mao.0b013e318163746
Dhanasingh, A. (2018). Why pre-curved modiolar hugging electrodes only cover the basal turn of the cochlea and not beyond that? J. Int. Adv. Otol. 14, 376–381. doi: 10.5152/iao.2018.5831
Dieter, A., Keppeler, D., and Moser, T. (2020). Towards the optical cochlear implant: optogenetic approaches for hearing restoration. EMBO Mol. Med. 12:e11618. doi: 10.15252/emmm.201911618
Ding, M., Fan, D., Wang, W., Luo, Y., and Peng, G. D. (2019). Basics of Optical Fiber Measurements. Singapore: Springer. doi: 10.1007/978-981-10-7087-7_57
Doshi, J., Johnson, P., Mawman, D., Green, K., Bruce, I., Freeman, S., et al. (2015). Straight vs. modiolar hugging electrodes–does one perform better than the other? Cochlear Impl. Int. 16, S33–35. doi: 10.1179/1467010014Z.000000000231
Dunn, C. C., Tyler, R. S., Oakley, S., Gantz, B. J., and Noble, W. (2008). Comparison of speech recognition and localization performance in bilateral and unilateral cochlear implant users matched on duration of deafness and age at implantation. Ear Hear. 29, 352–359. doi: 10.1097/AUD.0b013e318167b870
Evertz, A., Schrein, D., Olsen, E., Hoffmann, G. A., and Overmeyer, L. (2021). Dip coating of thin polymer optical fibers. Opt. Fiber Technol. 66:102638. doi: 10.1016/j.yofte.2021.102638
Feng, L., Li, S., and Feng, S. (2017). Preparation and characterization of silicone rubber with high modulus via tension spring-type crosslinking. RSC Adv. 7, 13130–13137. doi: 10.1039/C7RA00293A
Feng, L., and Oxenham, A. J. (2018). Auditory enhancement and the role of spectral resolution in normal-hearing listeners and cochlear-implant users. J. Acoust. Soc. Am. 144, 552–566. doi: 10.1121/1.5048414
Ferreira, P. H. D., Tribuzi, V., Osellame, R., and Ghiglieno, F. (2023). Improvement in measuring losses by interferometric technique for glass waveguides produced by femtosecond laser writing. Opt. Commun. 530:129132. doi: 10.1016/j.optcom.2022.129132
Firszt, J. B., Koch, D. B., Downing, M., and Litvak, L. (2007). Current steering creates additional pitch percepts in adult cochlear implant recipients. Otol. Neurotol. 28, 629–636. doi: 10.1097/01.mao.0000281803.36574.bc
Fishman, K. E., Shannon, R. V., and Slattery, W. H. (1997). Speech recognition as a function of the number of electrodes used in the SPEAK cochlear implant speech processor. J. Speech Lang. Hear. Res. 40, 1201–1215. doi: 10.1044/jslhr.4005.1201
Friesen, L. M., Shannon, R. V., Baskent, D., and Wang, X. (2001). Speech recognition in noise as a function of the number of spectral channels: comparison of acoustic hearing and cochlear implants. J. Acoust. Soc. Am. 110, 1150–1163. doi: 10.1121/1.1381538
Fu, Q. J., and Nogaki, G. (2005). Noise susceptibility of cochlear implant users: the role of spectral resolution and smearing. J. Assoc. Res. Otolaryngol. 6, 19–27. doi: 10.1007/s10162-004-5024-3
Heinrich, A. (2021). 3D Printing of Optical Components. Cham: Springer International Publishing. doi: 10.1007/978-3-030-58960-8
Helke, C., Reinhardt, M., Arnold, M., Schwenzer, F., Haase, M., Wachs, M., et al. (2022). On the fabrication and characterization of polymer-based waveguide probes for use in future optical cochlear implants. Materials (Basel) 16:106. doi: 10.3390/ma16010106
Helms, J., Müller, J., Schön, F., Moser, L., Arnold, W., Janssen, T., et al. (1997). Evaluation of performance with the COMBI40 cochlear implant in adults: a multicentric clinical study. ORL 59, 23–35. doi: 10.1159/000276901
Hendricks, C. M., Cavilla, M. S., Usevitch, D. E., Bruns, T. L., Riojas, K. E., Leon, L., et al. (2021). Magnetic steering of robotically inserted lateral-wall cochlear-implant electrode arrays reduces forces on the basilar membrane in vitro. Otol. Neurotol. 42, 1022–1030. doi: 10.1097/MAO.0000000000003129
Hernandez, V. H., Gehrt, A., Reuter, K., Jing, Z., Jeschke, M., Mendoza Schulz, A., et al. (2014). Optogenetic stimulation of the auditory pathway. J. Clin. Investig. 124, 1114–1129. doi: 10.1172/JCI69050
Huang, M. (2003). Stress effects on the performance of optical waveguides. Int. J. Solids Struct. 40, 1615–1632. doi: 10.1016/S0020-7683(03)00037-4
Izzo, A. D., Pathria, J., Suh, E., Walsh, J. T., Whitlon, D. S., Jansen, E. D., et al. (2006). “Selectivity of optical stimulation in the auditory system,” in Photonic Therapeutics and Diagnostics II (SPIE), 287–294. doi: 10.1117/12.659743
Jeschke, M., and Moser, T. (2015). Considering optogenetic stimulation for cochlear implants. Hear. Res. 322, 224–234. doi: 10.1016/j.heares.2015.01.005
Kampasi, K., Ladner, I., Zhou, J., Soto, A. C., Hernandez, J., Patra, S., et al. (2021). POEMS (Polymeric Opto-Electro-Mechanical Systems) for advanced neural interfaces. Mater. Lett. 285:129015. doi: 10.1016/j.matlet.2020.129015
Klein, E., Gossler, C., Paul, O., and Ruther, P. (2018). High-density muLED-based optical cochlear implant with improved thermomechanical behavior. Front. Neurosci. 12:659. doi: 10.3389/fnins.2018.00659
Koch, D. B., Downing, M., Osberger, M. J., and Litvak, L. (2007). Using current steering to increase spectral resolution in CII and HiRes. 90K users. Ear Hear. 28, 38S−41S. doi: 10.1097/AUD.0b013e31803150de
Kontorinis, G., Lenarz, T., Stover, T., and Paasche, G. (2011a). Impact of the insertion speed of cochlear implant electrodes on the insertion forces. Otol. Neurotol. 32, 565–570. doi: 10.1097/MAO.0b013e318219f6ac
Kontorinis, G., Paasche, G., Lenarz, T., and Stover, T. (2011b). The effect of different lubricants on cochlear implant electrode insertion forces. Otol. Neurotol. 32, 1050–1056. doi: 10.1097/MAO.0b013e31821b3c88
Leosson, K., and Agnarsson, B. (2012). Integrated biophotonics with CYTOP. Micromachines 3, 114–125. doi: 10.3390/mi3010114
Littlefield, P. D., and Richter, C. P. (2021). Near-infrared stimulation of the auditory nerve: a decade of progress toward an optical cochlear implant. Laryngosc. Investig. Otolaryngol. 6, 310–319. doi: 10.1002/lio2.541
Liu, T. C., Chen, H. P., and Lin, H. C. (2004). Effects of limiting the number of active electrodes on Mandarin tone perception in young children using cochlear implants. Acta Oto-Laryngol. 124, 1149–1154. doi: 10.1080/00016480410017846
Lo, J., Bester, C., Collins, A., Newbold, C., Hampson, A., Chambers, S., et al. (2018). Intraoperative force and electrocochleography measurements in an animal model of cochlear implantation. Hear. Res. 358, 50–58. doi: 10.1016/j.heares.2017.11.001
Luo, X., and Garrett, C. (2020). Dynamic current steering with phantom electrode in cochlear implants. Hear. Res. 390:107949. doi: 10.1016/j.heares.2020.107949
Luo, X., Landsberger, D. M., Padilla, M., and Srinivasan, A. G. (2010). Encoding pitch contours using current steering. J. Acoust. Soc. Am. 128, 1215–1223. doi: 10.1121/1.3474237
Luo, X., Wu, C. C., and Pulling, K. (2021). Combining current focusing and steering in a cochlear implant processing strategy. Int. J. Audiol. 60, 232–237. doi: 10.1080/14992027.2020.1822551
Majdani, O., Schurzig, D., Hussong, A., Rau, T., Wittkopf, J., Lenarz, T., et al. (2010). Force measurement of insertion of cochlear implant electrode arrays in vitro: comparison of surgeon to automated insertion tool. Acta Otolaryngol. 130, 31–36. doi: 10.3109/00016480902998281
Marinins, A., Ozolins, O., Pang, X., Udalcovs, A., Navarro, J. R., Kakkar, A., et al. (2018). Thermal reflow engineered cylindrical polymer waveguides for optical interconnects. IEEE Photon. Technol. Lett. 30, 447–450. doi: 10.1109/LPT.2018.2797685
Matic, A. I., Walsh, J. T. Jr., and Richter, C. P. (2011). Spatial extent of cochlear infrared neural stimulation determined by tone-on-light masking. J. Biomed. Opt. 16:118002. doi: 10.1117/1.3655590
Mehta, A. H., Lu, H., and Oxenham, A. J. (2020). The perception of multiple simultaneous pitches as a function of number of spectral channels and spectral spread in a noise-excited envelope vocoder. J. Assoc. Res. Otolaryngol. 21, 61–72. doi: 10.1007/s10162-019-00738-y
Miroir, M., Nguyen, Y., Kazmitcheff, G., Ferrary, E., Sterkers, O., and Grayeli, A. B. (2012). Friction force measurement during cochlear implant insertion: application to a force-controlled insertion tool design. Otol. Neurotol. 33, 1092–1100. doi: 10.1097/MAO.0b013e31825f24de
Mirsalehi, M., Rau, T. S., Harbach, L., Hugl, S., Mohebbi, S., Lenarz, T., et al. (2017). Insertion forces and intracochlear trauma in temporal bone specimens implanted with a straight atraumatic electrode array. Eur. Arch. Otorhinolaryngol. 274, 2131–2140. doi: 10.1007/s00405-017-4485-z
Nguyen, Y., Miroir, M., Kazmitcheff, G., Sutter, J., Bensidhoum, M., Ferrary, E., et al. (2012). Cochlear implant insertion forces in microdissected human cochlea to evaluate a prototype array. Audiol. Neurootol. 17, 290–298. doi: 10.1159/000338406
Noble, W., Tyler, R., Dunn, C., and Bhullar, N. (2008). Hearing handicap ratings among different profiles of adult cochlear implant users. Ear Hear. 29, 112–120. doi: 10.1097/AUD.0b013e31815d6da8
Richter, C. P., Rajguru, S. M., Matic, A. I., Moreno, E. L., Fishman, A. J., Robinson, A. M., et al. (2011). Spread of cochlear excitation during stimulation with pulsed infrared radiation: inferior colliculus measurements. J. Neural Eng. 8:056006. doi: 10.1088/1741-2560/8/5/056006
Richter, C. P., and Tan, X. (2014). Photons and neurons. Hear. Res. 311, 72–88. doi: 10.1016/j.heares.2014.03.008
Roland, J. T. Jr. (2005). A model for cochlear implant electrode insertion and force evaluation: results with a new electrode design and insertion technique. Laryngoscope 115, 1325–1339. doi: 10.1097/01.mlg.0000167993.05007.35
Schizas, C., and Karalekas, D. (2011). Mechanical characteristics of an Ormocomp((R)) biocompatible hybrid photopolymer. J. Mech. Behav. BioMed. Mater. 4, 99–106. doi: 10.1016/j.jmbbm.2010.09.010
Schurzig, D., Webster, R. J. 3rd, Dietrich, M. S., and Labadie, R. F. (2010). Force of cochlear implant electrode insertion performed by a robotic insertion tool: comparison of traditional versus ADVANCE Off-Stylet techniques. Otol. Neurotol. 31, 1207–1210. doi: 10.1097/MAO.0b013e3181f2ebc3
Shannon, R. V., Fu, Q. J., and Galvin, J. (2004). The number of spectral channels required for speech recognition depends on the difficulty of the listening situation. Acta Otolaryngol. 552, 50–54. doi: 10.1080/03655230410017562
Shapiro, M. G., Homma, K., Villarreal, S., Richter, C. P., and Bezanilla, F. (2012). Infrared light excites cells by changing their electrical capacitance. Nat. Commun. 3:736. doi: 10.1038/ncomms1742
Smith, Z. M., Parkinson, W. S., and Long, C. J. (2013). “Multipolar current focusing increases spectral resolution in cochlear implants,” in 2013 35th Annual International Conference of the IEEE Engineering in Medicine and Biology Society, 2796–2799. doi: 10.1109/EMBC.2013.6610121
Snels, C., Roland, J. T., Treaba, C., Jethanamest, D., Huinck, W., Friedmann, D. R., et al. (2021). Force and pressure measurements in temporal bones. Am. J. Otolaryngol. 42:102859. doi: 10.1016/j.amjoto.2020.102859
Srinivasan, A. G., Shannon, R. V., and Landsberger, D. M. (2012). Improving virtual channel discrimination in a multi-channel context. Hear. Res. 286, 19–29. doi: 10.1016/j.heares.2012.02.011
Stieghorst, J., and Doll, T. (2016). Dispersed hydrogel actuator for modiolar hugging cochlear implant electrode arrays. IEEE Trans. BioMed. Eng. 63, 2294–2300. doi: 10.1109/TBME.2016.2524663
Triplett, M., Kessler, L., Sahota, S., Kampasi, K., Tan, X., Haque, R. U., et al. (2022). “Waveguides for neurostimulation in the cochlea,” in Imaging, Therapeutics, and Advanced Technology in Head and Neck Surgery and Otolaryngology, SPIE, 1193502. doi: 10.1117/12.2612874
Tyler, R. S., Witt, S. A., Dunn, C. C., and Perreau, A. E. (2008). A daily alternating method for comparing different signal-processing strategies in hearing aids and in cochlear implants. J. Am. Acad. Audiol. 19, 443–454. doi: 10.3766/jaaa.19.5.7
Vadivelu, A. N., Liu, Z., Gunawardena, D. S., Chen, B., Tam, H. Y., O'leary, S., et al. (2019). “Integrated force sensor in a cochlear implant for hearing preservation surgery,” in 2019 41st annual international conference of the IEEE engineering in medicine and biology society (EMBC) (IEEE), 3819–3822s. doi: 10.1109/EMBC.2019.8856549
Wade, S. A., Fallon, J. B., Wise, A. K., Shepherd, R. K., James, N. L., and Stoddart, P. R. (2014). Measurement of forces at the tip of a cochlear implant during insertion. IEEE Trans. BioMed. Eng. 61, 1177–1186. doi: 10.1109/TBME.2013.2296566
Webb, K., Connor, S., Wilson, K., Cooper, S., and Jiang, D. (2015). Tough choices: the challenges of cochlear implantation when there is 'something to lose'. Cochl. Impl. Int. 16, S50–52. doi: 10.1179/1467010014Z.000000000236
Wilson, B. S. (2015). Getting a decent (but sparse) signal to the brain for users of cochlear implants. Hear. Res. 322, 24–38. doi: 10.1016/j.heares.2014.11.009
Wilson, B. S., and Dorman, M. F. (2008). Cochlear implants: current designs and future possibilities. J. Rehabilit. Res. Dev. 45, 695–730. doi: 10.1682/JRRD.2007.10.0173
Xu, Y., Magnuson, M., Agarwal, A., Tan, X., and Richter, C. P. (2021). Infrared neural stimulation at different wavelengths and pulse shapes. Prog. Biophys. Mol. Biol. 162, 89–100. doi: 10.1016/j.pbiomolbio.2020.12.004
Xu, Y., Xia, N., Lim, M., Tan, X., Tran, M. H., Boulger, E., et al. (2018). Multichannel optrodes for photonic stimulation. Neurophotonics 5:045002. doi: 10.1117/1.NPh.5.4.045002
Yilmaz-Bayraktar, S., Foremny, K., Kreienmeyer, M., Warnecke, A., and Doll, T. (2022). Medical-grade silicone rubber-hydrogel-composites for modiolar hugging cochlear implants. Polymers 14:1766. doi: 10.3390/polym14091766
Keywords: laser, neural stimulation with light, infrared, waveguides, cochlear implants
Citation: Kim M, Cury J, Kessler L, Triplett M, Sahota S, Kampasi K, Tan X, Haque R-u and Richter C-P (2024) Waveguides for neurostimulation in the cochlea. Front. Audiol. Otol. 2:1221778. doi: 10.3389/fauot.2024.1221778
Received: 01 June 2023; Accepted: 21 March 2024;
Published: 29 April 2024.
Edited by:
Meisam Arjmandi, University of South Carolina, United StatesReviewed by:
Tobias Moser, University Medical Center Göttingen, GermanyBryony Buck, University of Dundee, United Kingdom
Copyright © 2024 Kim, Cury, Kessler, Triplett, Sahota, Kampasi, Tan, Haque and Richter. This is an open-access article distributed under the terms of the Creative Commons Attribution License (CC BY). The use, distribution or reproduction in other forums is permitted, provided the original author(s) and the copyright owner(s) are credited and that the original publication in this journal is cited, in accordance with accepted academic practice. No use, distribution or reproduction is permitted which does not comply with these terms.
*Correspondence: Claus-Peter Richter, cri529@northwestern.edu