Development and validation of a French speech-in-noise self-test using synthetic voice in an adult population
 Arnaud Génin1,2,3*
  Jérôme Courtial1,2,4 Maxime Balcon3
  Jean-Luc Puel2,4
  Frédéric Venail1,2,4
  Jean-Charles Ceccato2,4
- 1Département ORL&CMF- CHU, Université de Montpellier, Montpellier, France
- 2Institut des Neurosciences de Montpellier, INSERM U1298, Montpellier, France
- 3SONUP, Montpellier, France
- 4Audiocampus, Université de Montpellier, Montpellier, France
Background: Speech-in-noise (SIN) audiometry is a valuable part of audiological diagnostics and clinical measurements, providing information on an individual's ability to understand in noise. To date, such tests have been developed with natural voice presented monaurally or binaurally (via diotic and dichotic presentation). The time required to develop such tests is often long. The use of synthetic voice would simplify the test creation process and self-testing would improve accessibility.
Design: Measurements were performed using an Android tablet (Samsung Galaxy Tab A7) and calibrated Bluetooth headphones (Tilde Pro C, Orosound). Normative values were first defined using natural or synthetic voice on 69 normal-hearing participants. A total of 463 participants then undertook the SIN test comprising synthetic voice and dichotic antiphasic presentation. Of these, 399 also performed the SIN test with diotic presentation.
Results: No significant differences in the speech reception threshold (SRT) were found between natural and synthetic voices for diotic presentations (p = 0.824, paired Student t-test) with normative values of −10.7 dB SNR (SD = 1.5 dB) and −10.4 dB SNR (SD = 1.4 dB), respectively. For the SoNoise test with synthetic voice and dichotic antiphasic presentation, the results showed a normative value of −17.5 dB SNR (SD = 1.5 dB), and a strong correlation (r = 0.797, p < 0.001) with the four-frequency pure-tone average (4f-PTA). Receiver operating curves (ROC) were then calculated: for a 4f-PTA of 20 dB hearing level (HL), the SRT was −14.5 dB SNR with a sensitivity of 84% and specificity of 89%. For a 4f-PTA of 30 dB HL, the SRT was −13.7 dB SNR with a sensitivity of 89% and specificity of 91%. For a 4f-PTA of 35 dB HL, the SRT was −13.0 dB SNR with a sensitivity of 88% and specificity of 93%. The normative binaural intelligibility level difference (BILD) value was 8.6 dB (SD = 2.0 dB) with normal-hearing participants. The learning effect due to the task and interface was 1.7 dB (1st to 7th test) and test duration was 3 min.
Conclusion: The SoNoise test in its synthetic dichotic antiphasic presentation is a fast and reliable tool to diagnose hearing impairment at 20, 30, and 35 dB HL cut-offs.
1 Introduction
While pure-tone audiometry is currently recognized as the gold-standard measurement for hearing loss assessment, compelling evidence suggests that speech-in-noise (SIN) audiometry should be systematically added to evaluate the functional impairment related to hearing loss (Plomp, 1986; Killion and Niquette, 2000; Smits et al., 2004; Smits and Houtgast, 2005; Jansen et al., 2012). Most SIN tests assess the signal-to-noise ratio (SNR) at which a participant can recognize 50% percent of words. This particular SNR is called the speech reception threshold (SRT). A high correlation (between 0.77 and 0.86) is generally observed between pure-tone average (PTA) and SRT in noise (Smits et al., 2004; Jansen et al., 2010, 2013; Koole et al., 2016; Potgieter et al., 2018a,b). However, discordance between PTA and SIN may be found in certain medical conditions, such as auditory neuropathy (Rance et al., 2012; Narne, 2013; Apeksha and Kumar, 2017; White-Schwoch et al., 2020, 2022) or central auditory processing disorders (Houtgast and Festen, 2008; Anderson et al., 2011; Bellis and Bellis, 2015; Füllgrabe et al., 2015). Use of SIN tests offers three main advantages: (1) they are more representative of the everyday discomfort and of the handicap experienced by hearing-impaired people (Carhart and Tillman, 1970; Kramer et al., 1998; Grant and Walden, 2013); (2) they are more sensitive to early events of age-related hearing impairment, detecting the loss of auditory neurons that cannot be detected by PTA or even by speech audiometry in quiet (Wu et al., 2020); and (3) the supra-threshold measurement of the SRT is less sensitive than pure-tone threshold measurements to minor calibration inaccuracies.
Several SIN tests have been developed in French over the past 20 years, showing a rising interest for this type of auditory evaluation. The most frequently used are currently the French version of the hearing in noise test (HINT; Vaillancourt et al., 2005), the French intelligibility sentence test (FIST; Luts et al., 2008), the French digit triplet test (FrDigit3; Jansen et al., 2010), the speech understanding in noise (SUN; Paglialonga et al., 2011), the FraMatrix (Jansen et al., 2012), the vocale rapide dans le bruit (VRB, fast speech in noise; Leclercq et al., 2018), the FrBio (Bergeron et al., 2019), and the antiphasic digit triplet test (Höra; Ceccato et al., 2021). The SRT can be determined directly with tests using adaptive methods, such as the digit triplet test, Matrix tests, FrDigit3, HINT, and Höra, in which the SNR evolves automatically according to the participants' answer at each presented item (Nilsson et al., 1994; Smits et al., 2004; Jansen et al., 2010; Kollmeier et al., 2015; Ceccato et al., 2021). The pace of SNR adaptation may vary throughout the test, according to the number of correct answers, and depends on the recognition score target. Other SIN tests, such as QuickSIN (Killion et al., 2004), SUN (Paglialonga et al., 2011), and VRB (Leclercq et al., 2018), use lists of items presented at fixed SNR, for which the SRT can be measured by fitting the obtained recognition score at each presented SNR with a psychometric function. The FrBio (Bergeron et al., 2019) aimed to provide a more ecological approach for the SIN paradigm by measuring the recognition score at fixed SNR in real-life sound situations. Among these tests, only the digit triplet test, the FrDigit3 and Höra are currently performed in self-test mode, and their use is limited to screening. On the other hand, none of the French SIN tests used in clinical assessment, such as the HINT (Vaillancourt et al., 2005), the FIST (Luts et al., 2008), the FrDigit3 test (Jansen et al., 2010), the FrBio (Bergeron et al., 2019), the SUN (Paglialonga et al., 2011), the FraMatrix (Jansen et al., 2012), and the VRB (Leclercq et al., 2018), are currently used in self-testing mode but mostly with the investigator recording the subject's answers.
SIN tests developed for clinical evaluations are mainly performed in free-field settings, which may entail practical difficulties linked to the need for space and maintenance of a reliable calibration (VRB, FIST, HINT, FraMatrix, and FrBio). For practical reasons, screening tests using SIN have been presented with headphones, either monaurally or binaurally (Smits et al., 2004; Jansen et al., 2012; Van den Borre et al., 2021). Some recent SIN tests performed binaurally, have used dichotic antiphasic presentation (De Sousa et al., 2020; Ceccato et al., 2021) of a speech signal, with a diotic presentation of the noise (i.e., SπN0). The phase shift allows the use of binaural mechanisms involving the comparison of the temporal clues between the two ears. It results in a binaural masking release that improves the perception of the target signal (Culling and Lavandier, 2021). Binaural masking level difference (BMLD) has been extensively explored for tonal stimulus (Hirsh, 1948; Webster, 1951; Wilson et al., 2003). In such studies, the BMLD of normal-hearing individuals mainly varies according to the frequency of the stimulus to be detected: between 10 and 15 dB of enhancement at 500 Hz, and 1–3 dB at 4,000 Hz. For the SIN test, use of the presentation mode BILD, corresponding to the difference between binaural diotic (S0N0) and antiphasic (SπN0) presentation, improves the sensitivity and specificity of the test for detecting asymmetric, unilateral, and conductive hearing loss when used as a screening tool (De Sousa et al., 2020, 2022; Ceccato et al., 2021). Concerning correlation between SRT and PTA, the SRT of antiphasic and binaural diotic tests, respectively correlate better to the PTA of the worst and better ear (De Sousa et al., 2020; Ceccato et al., 2021). The BILD could be of interest in a clinical assessment as it tests binaural auditory functions that cannot be observed with headphones in either monaural or binaural diotic presentation mode nor in most free-field configurations.
Speech material used for SIN tests is usually based on the studio recordings of a speaker's voice, which entails certain disadvantages such as the cost and the duration of test development (Dickerson et al., 2006). Considering the progress made in voice synthesis (Gong and Lai, 2003; King, 2014) and its current use in everyday life (telecommunications, information services, numeric applications), we wondered about the relevance of its application for speech audiometry. Some studies have assessed the comparability of natural and synthetic voice in speech audiometry (Koul, 2003; Cooke et al., 2013; Simantiraki et al., 2018; Schwarz et al., 2022). Most of the clinical SIN tests still use natural voices, but some use synthetic ones (Nuesse et al., 2019; Ibelings et al., 2022).
The objective of this study was to develop and normalize a SIN test that could be used both as a screening tool and for clinical evaluation of SIN. For this purpose, we recruited a normative population to: (1) evaluate if the use of a synthetic voice may induce a difference in SRT measurement relative to the use of a more classical natural voice recording; (2) determine normative values for diotic and antiphasic presentation of the test; and (3) determine normative values of the BILD. We then assessed the validity of the test on a study population composed of normal-hearing and hearing-impaired participants presenting various audiometric profiles. We also evaluated the normative values for this test in screening and clinical assessment.
2 Materials and methods
2.1 Participants
The participants were recruited and tested in the ENT department of the university hospital in Montpellier (France). They were outpatients, accompanying persons, caregivers, students or hospital workers. Exclusion criteria were visual or motor impairments that prevented use of a tablet, self-reported cognitive functions disallowing understanding the principle of the tests, earwax, ear discharge, or ear malformation preventing the use of headphones. No exclusion criterion was based on PTA.
Normative values, duration and learning effect of each SoNoise test were calculated based on a first population of 69 normal-hearing French native speakers (4f-PTA 0.5/1/2/4 kHz ≤ 10 dB HL), 39 women and 30 men aged between 18 and 25 years, tested for the first time with SoNoise tests. Participants were chosen to be in agreement in age and hearing loss with the standard (ISO 8253-3). The SRT with natural or synthetic voice was compared in one group (n = 43) comprising 28 women and 15 men, with an average 4f-PTA of 5 dB HL (SD = 4.4 dB HL, median 5 dB HL, IC95 [3.7–6.3]) and mean age of 21.2 years (SD = 2.2 yrs, median 21 yrs, IC95 [20.2–22.2]). The SRT with diotic or antiphasic synthetic SIN was compared in the remaining group of normal-hearing participants (n = 26), comprising 12 women and 14 men of mean age 22.9 years (SD = 2.8 yrs, median 22.5 yrs, IC95 [21.8–24]), with an average 4f-PTA of 4.3 dB HL (SD = 2.7 dB HL, median 3.9 dB HL, IC95 [3.4–5.2]).
A second test population of 463 French native speakers, 230 women and 233 men all over 18 years of age (mean age 40 yrs, SD = 23 yrs, median 29 yrs, IC95 [38–42]), was used to assess the diagnostic performance of the SoNoise_SπN0_Syn test. Of these, for their best ear, 337 (72.8 %) were classified as having normal hearing, 51 (11.0 %) mild hearing loss, 55 (11.9%) moderate hearing loss, 19 (4.1%) moderately severe hearing loss, and 1 (0.2%) severe-profound hearing loss. For their worst ear, 328 (70.8%) were classified as having normal-hearing, 35 (7.7%) mild hearing loss, 57 (12.3%) moderate hearing loss, 27 (5.8%) moderately severe hearing loss, 15 (3.2%) severe-profound hearing loss, and 1 (0.2%) profound hearing loss. Degrees of hearing were based and categorized according to the World Health Organization grades of hearing impairment (World Health Organization, 2021) as follows: normal-hearing (PTA ≤ 20 dB HL), mild (PTA >20 ≤ 35 dB HL), moderate (PTA >35 ≤ 50 dB HL), moderately severe (PTA >50 ≤ 65 dB HL), severe-profound (PTA >65 ≤ 80 dB HL), profound (PTA >80 ≤ 95 dB HL), or complete hearing loss (PTA >95 dB HL).
Among the study population of 463 participants, a subset of 399 (188 women and 211 men) with a mean age of 36 years (SD = 21 yrs, median 27 yrs, IC95 [33–39]), received both SoNoise_S0N0_Syn and SoNoise_SπN0_Syn tests. Of these, 331 (83%) were classified as having normal hearing, 31 (7.7%) mild hearing loss, 31 (7.7%) moderate hearing loss, 5 (1.4%) moderately-severe hearing loss, and 1 (0.2%) severe-profound hearing loss. The audiometric profiles of both normative and test validation populations are displayed in Table 1.
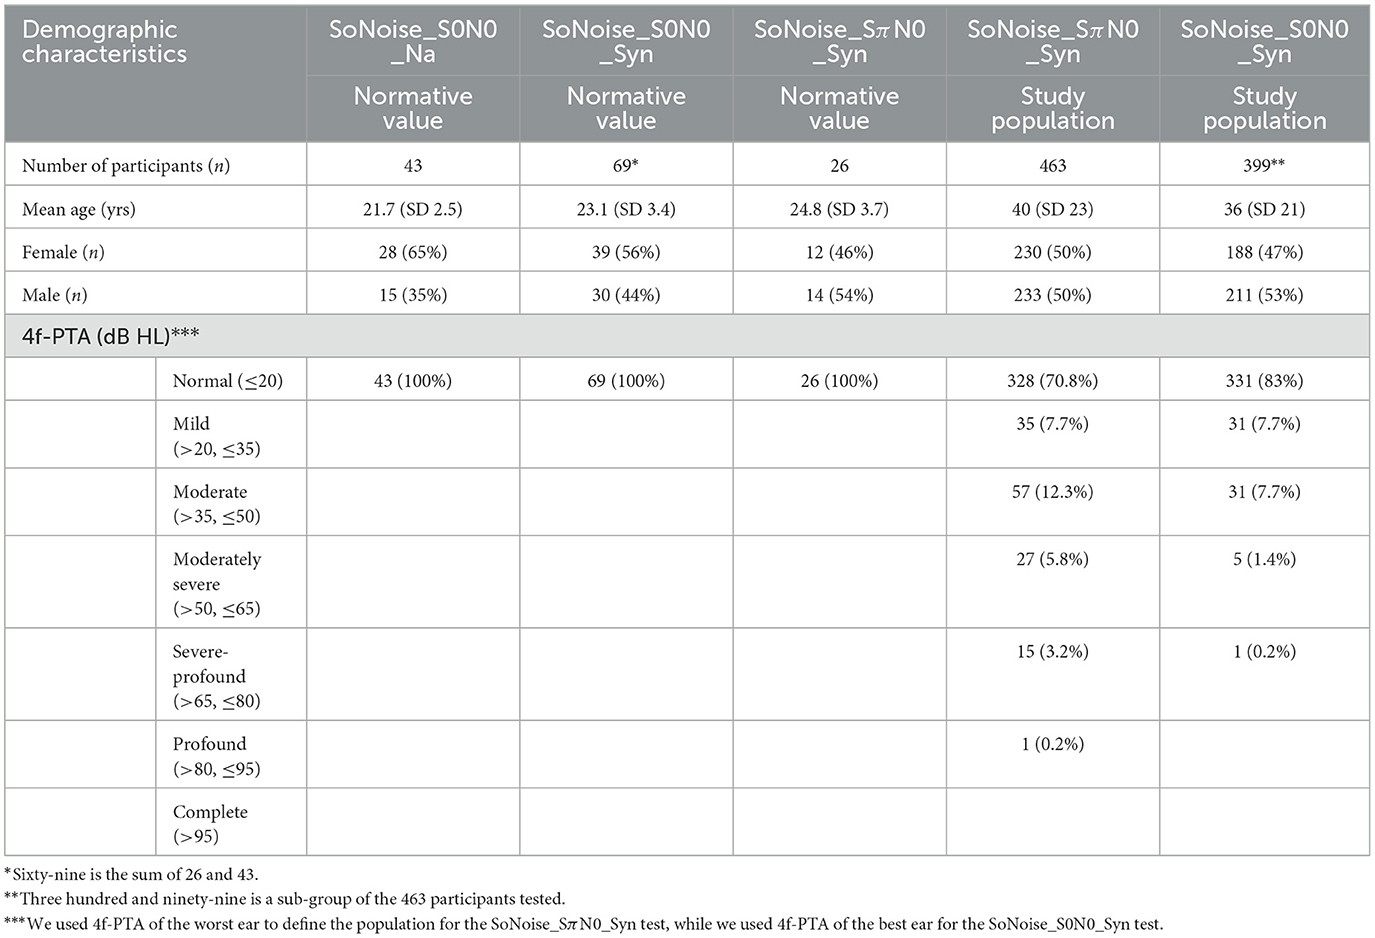
Table 1. Demographic characteristics of both normative and test validation study populations.
2.2 Speech material
Praat software (Boersma and Weenink, 2013) was used to determine the main speech characteristics (duration, fundamental frequency, speech rate) of both natural and synthetic voice. Natural voice recordings were performed by a 38 years old French native female speaker, who is not a professional speaker. Synthetic words were generated with “neural voices” (powered by Acapela Group, version 2017.1).
Table 2 shows the main characteristics: fundamental frequency (Hz), word duration (ms) and speech rate (syllables/s). The fundamental frequency of the natural speech triplet was on average higher (210 Hz) than that of the synthetic speech (178 Hz). The average word duration of the natural voice was 661 ms, whereas that of the synthetic voice was 451 ms, leading to a speech rate for natural and synthetic voice of 1.6 and 2.3 syllables/s, respectively.
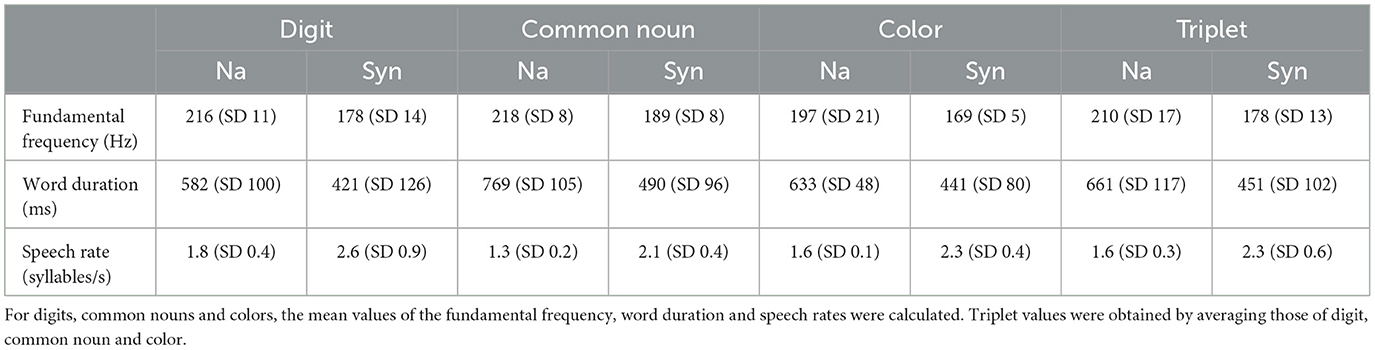
Table 2. Characteristics of the speech material for both natural and synthetic voices.
2.3 SoNoise tests
SoNoise tests are adaptive SIN self-tests aimed at automatically determining the SRT (dB SNR) in noise. They consisted here in the presentation of different triplets of words (digit -common noun—color) at different speech-to-noise ratios, as described elsewhere (Prang et al., 2021). Each word was randomly selected among 9, leading to 93 = 729 triplet combinations, with equal odds of presentation. The participant had to select the word heard by pressing the corresponding icon representing that word on the screen of the tablet. On the first response screen, the participant had to pick the correct word among the 9 icons representing digits), then a second response screen was displayed with the next 9 icons (representing common nouns), and finally a third screen was displayed with the last 9 icons (representing colors). The participant was instructed to choose an icon, even if the word was not heard, making this a forced-choice test with a closed-set list of words (Smits et al., 2006; De Sousa et al., 2018).
SoNoise tests are adaptive SIN tests designed to be performed as self-tests. The SoNoise_S0N0 had a binaural diotic presentation, i.e., both earphones delivered the same sound stimuli (words + noise) to each ear. Words of the SoNoise_S0N0 were generated either with a natural (Na) or a synthetic (Syn) voice. The SoNoise_SπN0_Syn offered a dichotic antiphasic presentation of words while presenting the same level of noise to each ear. A phase shift of “π” was introduced with word presentation. For this test, words were generated with a synthetic voice (Syn).
The masking noise was a white noise with envelope shaped on the long-term spectrum of the test words, as described elsewhere (Plomp and Mimpen, 1979; Nilsson et al., 1994; Brand and Kollmeier, 2002; Smits et al., 2006; Soli and Wong, 2008; Jansen et al., 2012; Dillon et al., 2016; Potgieter et al., 2016; De Sousa et al., 2018). Shaping was made by: (1) obtaining the long-term spectrum of all the concatenated words; (2) using this spectrum to design a frequency sampling-based finite-impulse-response filter with the desired frequency shape and applying it on a white noise; (3) adjusting noise level with the concatenated words. Speech and noise power spectrum for both natural and synthetic tests are displayed in Figure 1.
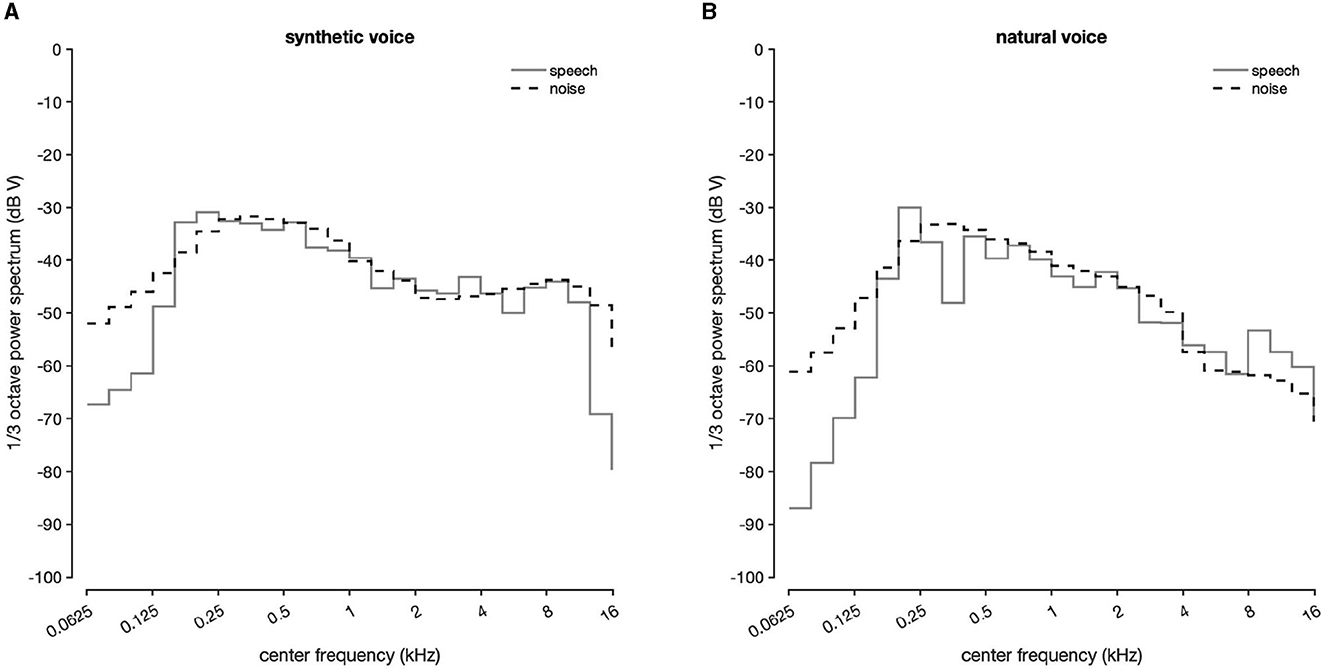
Figure 1. (A) Long-term average spectrum for synthetic speech and noise. (B) Long-term average spectrum for natural speech and noise.
The masking noise used depended on the SoNoise test performed, i.e., it was shaped on the long-term spectrum of natural voice words for the Na test, or synthetic words for the Syn tests. The noise started 500 ms before the first word and ended 500 ms after the third, as described elsewhere (Jansen et al., 2010; Smits et al., 2013; Kaandorp et al., 2015; Potgieter et al., 2016; Ceccato et al., 2021). A silence gap of 100 ms was inserted between words, to which was added a jitter (random extra delay) of 0–200 ms (Potgieter et al., 2016). The speech was presented at 75 dB SPL (sound pressure level, Leq measurements) and a SNR of 20 dB at the beginning of the test. The SNR level varied adaptively according to the number of words recognized correctly (0, 1, 2, or 3) as follows, respectively: +10, +5, −5, −10 until the first reversal, then +5, +2, −2, −5 between the first and the second reversal, and +3, +1, −1, −3 after that point.
When the SNR was positive, the noise level was modified. When the SNR level was negative, the speech level was modified. Twelve reversals were performed during the test, and the SRT was calculated by averaging the SNR results of the last eight reversals.
2.4 Words recording and difficulty equalization
Speech material was composed of monosyllabic words for digits and colors, and disyllabic words for common nouns (except for one trisyllabic word: “sanglier”). All words used were common language and easy to represent as an image.
For both types of voice, the words were generated individually and then combined for testing, ensuring that the word triplet included no prosody or natural coarticulation. Prior to the study, equalization of the words was performed for all the SoNoise tests developed. It consisted in adjusting the level of presentation of each word to ensure that each one had a 50% chance of being recognized at the same SNR. A specific level adjustment has been performed for each one of the three tests developed (SoNoise_S0N0_Na, SoNoise_S0N0_Syn, SoNoise_SπN0_Syn). To do this, 76 normal-hearing participants [PTA 0.5/1/2/4 kHz <20 dB hearing level (HL)] aged from 18 to 40 years (mean age of 21.8, SD = 4.5 yrs, median 20 yrs, IC95 [20.8–22.8]) were tested 1–5 times each. In this population, 21 normal-hearing subjects didn't match the ISO 8253-3 recommendation in terms of age and/or PTA thresholds, but their SRT at the test didn't statistically differ from the other participants. This allowed a reasonable inclusion of their results as item difficulty equalization was made following an adaptation of both the method proposed Brand and Kollmeier in 2002 for Matrix tests (Brand and Kollmeier, 2002; Jansen et al., 2012) and recently by Masalski et al. (2021) for digits in noise tests. The principle was to use the final test procedure to perform an evaluation of each item difficulty that considered both their inner difficulty and their position in the triplet. A routine Matlab script was used to identify the words pronounced and answered at each SNR. The psychometric curves of recognition for each word were fitted with a logistic function to determine the SRT. The equalization values obtained for the SoNoise_SπN0_Syn test are displayed in Figure 2A. Each word's recording level was then adjusted using the difference between the SRT of each word and the average SRT of all words (−17.4 dB SNR) while the average SRT of the 76 subjects was −17.5 dB SNR (SD = 2.5). The ≪ before/after ≫ results of the equalization are presented Figure 2 and shows that for digits, common nouns, and colors, the average SRT were respectively −18 dB SNR (SD = 2.3), −18.3 dB SNR (SD = 1.4), −15.9 dB SNR (SD = 2.9) before equilibration, and respectively −18.5 dB SNR (SD = 1), −18.9 dB SNR (SD = 1), −18 dB SNR (SD = 1) after equilibration. Globally, the item standard deviation of SRT dropped from 2.5 to 1 dB.
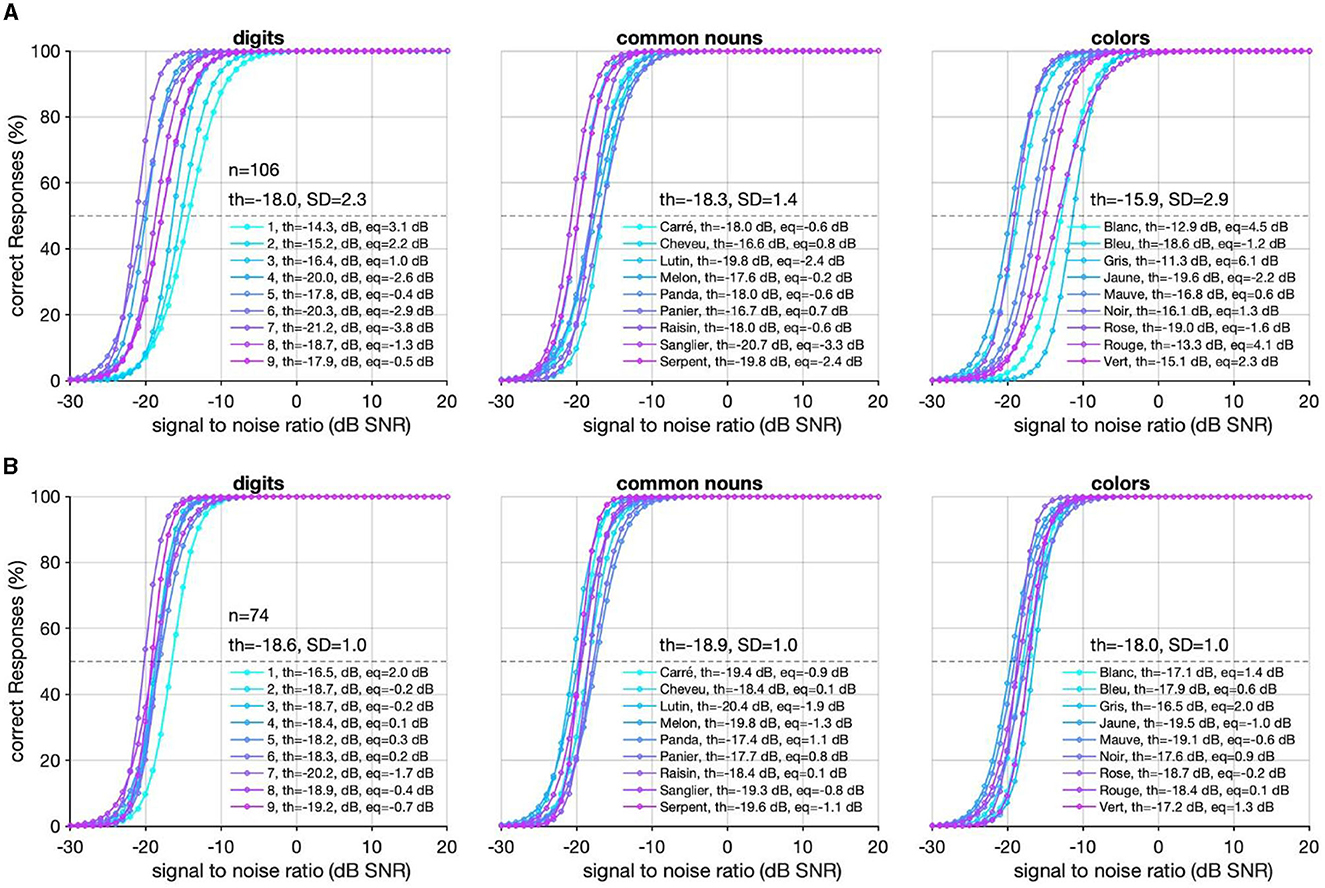
Figure 2. (A) Psychometric curves of the 27 synthetic words of the test before the first equalization. The mean SRT of each type of item is presented with SD. For each item, the SRT and the difference (eq) with the average SRT of all words is also presented. (B) Psychometric curves of these same 27 words after the first equalization. “n” corresponds to the number of SoNoise_SπN0_Syn tests performed.
2.5 Equipment and procedure
Conventional audiometry was carried out in a soundproof booth, with an AC33 audiometer (Interacoustics) calibrated with TDH-39 headphones.
For SIN testing, the SoNoise (SONUP, Montpellier, France) hearing application was used on an Android OS tablet (Samsung Galaxy Tab A7) connected via Bluetooth to circumaural headphones (Orosound Tilde Pro C). The SoNoise tests were performed in a quiet office. The KEMAR (Knowles Electronics Manikin for Acoustic Research, SET electronic GmbH, MK2-B, CE labeled), and its built-in prepolarized pressure microphones (GRAS 40AO ½), was chosen for the calibration of the tablet-headphones pair over an artificial ear for its superior acoustic coupling with the chosen headphones, that more closely resembles that of the adult participants tested in the clinic (Xie et al., 2009; Guo et al., 2021). The maximum output level was measured using the masking noise of the test, and used as a reference for the calibration level. Its value in dB SPL (sound pressure level, Leq measurements) was input into the application, which used it as a reference to send the desired level of signal.
This prospective study was conducted in the ENT department of the university hospital of Montpellier (France), and aimed at the development and the validation of the SoNoise SIN tests (SONUP). The study was approved by the local ethics committee (IRB-MTP_2021_09_202100889). All participants signed a consent form to participate in the study.
Audiometric thresholds (air and bone conduction) were determined for each subject (normative and study population) at 0.5, 1, 2, 4, and 8 kHz, using the modified Hughson-Westlake method (Carhart and Jerger, 1959) after bilateral otoscopy. The 4f-PTA was calculated by averaging the audiometric thresholds (0.5, 1, 2, and 4 kHz) measured during air conduction pure-tone audiometry.
To define normative values for both SoNoise_S0N0_Na and SoNoise_S0N0_Syn, participants (n = 43) performed a total of seven tests: a training test with the SoNoise_S0N0_Na, then alternating SoNoise_S0N0_Syn or SoNoise_S0N0_Na three times, followed by another sequence comprising the other test not presented in the first sequence (SoNoise_S0N0_Na or SoNoise_S0N0_Syn) again repeated three times, ensuring that both tests were passed three times each in an alternative manner.
To define normative values for both SoNoise_S0N0_Syn and SoNoise_SπN0_Syn, participants (n = 26) performed a total of seven tests as described earlier except that the training test was the SoNoise_SπN0_Syn and the six tests that followed alternated between SoNoise_S0N0_Syn and SoNoise_SπN0_Syn. All tests were achieved within the same session. The normative value of the BILD for the test was calculated by subtracting SπN0 SRT from S0N0 SRT. The tablet application measured the duration of each test from the start to the finish.
Of the 463 participants (normal or hearing-impaired) who underwent the SoNoise_SπN0_Syn test, 399 also underwent the SoNoise_S0N0_Syn test in a counterbalanced order.
2.6 Data and statistical analysis
The audiometric data, age and gender of the participants were stored by the SONUP application, uploaded to secure servers and retrieved via a secure dedicated website. They were then exported in xls format. Matlab R2021b software (MathWorks, Inc., USA) was used for statistical analyses, with the significance level set to 5% (p-value <0.05). ANOVA analysis was used to determine whether the number of trials (number of tests performed) and the voice type had a significant effect or not, followed by post-hoc t-tests for multiple comparisons. The diagnostic power (sensitivity and specificity) of the SoNoise_SπN0_Syn test to detect pure-tone average hearing loss was calculated for the study population. Different receiver operating characteristic (ROC) curves were then computed to determine the optimal SNR values to detect a pure-tone average hearing loss at different cut-off levels (20, 30, and 35 dB HL). The best sensitivity and specificity were determined for each of the three SRT values. The optimal sensitivity and specificity were achieved when the Youden index was the highest. Z-score was used to compare the results of the study population with the normative values, its value corresponding to the number of standard deviations separating a result from the normative value. For each individual tested with SoNoise_SπN0_Syn and SoNoise_S0N0_Syn, two different values for SRT (in dB SNR) were obtained. The difference between these values gave the BILD. ANOVA analysis was used to determine whether the hearing loss type had a significant effect or not. Wilcoxon post-hoc tests were performed for multiple comparisons, all samples not following a normal distribution (Jarque-Bera normality test).
3 Results
3.1 Normative values of the SoNoise tests
We firstly aimed to compare the use of natural and synthetic voices in a diotic presentation, before determining normative values for the binaural diotic tests, antiphasic test, and BILD. Figure 3A shows the average SRT values for the three tests (SoNoise_S0N0_Na, SoNoise_S0N0_Syn, SoNoise_SπN0_Syn) according to the different trials. The mean SRT for the SoNoise_S0N0_Na training test was −9.0 dB SNR (SD = 1.3) and was −10.0 dB SNR (SD = 1.4), −10.5 dB SNR (SD = 1.6), and −10.8 dB SNR (SD = 1.3) for the next three trials, respectively. The mean SRT for the three trials of SoNoise_S0N0_Syn that followed the SoNoise_S0N0_Na training test were −10.3 dB SNR (SD = 1.4), −10.9 dB SNR (SD = 1.6), and −11.1 dB SNR (SD = 1.6), respectively. A two factor ANOVA showed that trials number had a significant effect on SRT (p < 0.001) while the voice (natural and synthetic) had no significant effect (p = 0.824). The learning effect was significant for tests using the natural voice, with a difference of 1, 1.5, and 1.8 dB (p < 0.001 for all three) between the training and the 1st, 2nd, and 3rd tests, respectively. The 1st test also differed significantly (p = 0.002) from the last, with a difference of 0.8 dB. The learning effect was also significant for tests using the synthetic voice, with a difference of 1.3, 1.9, and 2.1 dB (p = 0.016, p = 0.003, and p < 0.001) between the training and the 1st, 2nd, and 3rd tests, respectively. When comparing binaural diotic and antiphasic presentation, a two factor ANOVA showed that both trials number and presentation had significant effects on SRT (p < 0.001). A SRT of −17.5 dB SNR (SD = 1.5) obtained in the first SoNoise_SπN0_Syn training test progressively increased to −18.9 dB SNR (SD = 1.3), −19.0 dB SNR (SD = 1.6), and −19.2 dB SNR (SD = 1.9) over the next three trials, respectively. The learning effect was significant with a difference of 1.4 dB between the training and the first test but no significant difference was found between the other consecutive tests. The value also appeared to stabilize around −19.2 dB SNR on the 3rd test, 1.7 dB better than the training test. We then calculated the BILD based on the difference between diotic and dichotic antiphasic SRT values for each individual. BILD values were 8.6 dB (SD = 2.0) for the 1st test, 8.1 dB (SD = 2.1) for the 2nd, and 8.1 dB (SD = 1.9) for the 3rd. One factor ANOVA showed no significant learning effect on the BILD (p = 0.645).
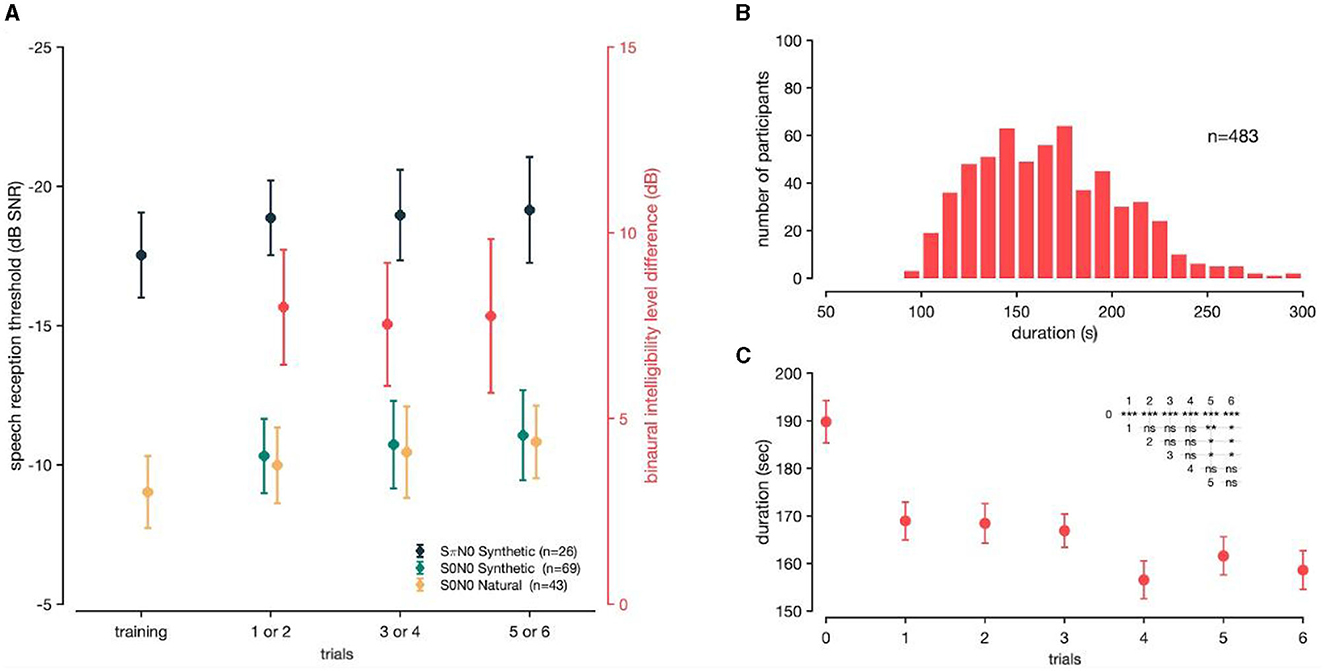
Figure 3. (A) Mean SRT and BILD values measured. SπN0 synthetic in dark blue (n = 26), S0N0 synthetic in green (n = 69), and S0N0 natural in yellow (n = 43). Binaural intelligibility level difference in red. The vertical bars represent the standard errors of the mean. (B) Histogram distribution of tests duration (n = 483) for SoNoise tests. (C) Tests duration according to the number of trials performed. The inserted triangular matrix represents the degree of significance of tests duration as a function of the number of trials (* if p ≤ 0.05, ** if p ≤ 0.01, *** if p ≤ 0.001, “ns” meaning not significant). Trial “0” meaning performed first as a training test.
Figure 3B displays the distribution of SoNoise tests duration. The mean duration was 167 s (SD = 38 s, median 166 s, IC95 [164–170]). Figure 3C displays the tests duration according to the number of trials performed. The test duration lasted 189.2 s (SD = 41) for the training test, and seemed to stabilize at 158.9 s (SD = 36.8) after four trials.
3.2 Assessment of the diagnostic power of the tests
Participants in the groups of age [40–60] and 4f-PTA [20–40] were fewer in number compared to in the other age groups (Figure 4). All the normative values, sensitivity and specificity of the SoNoise tests are displayed in Table 3.
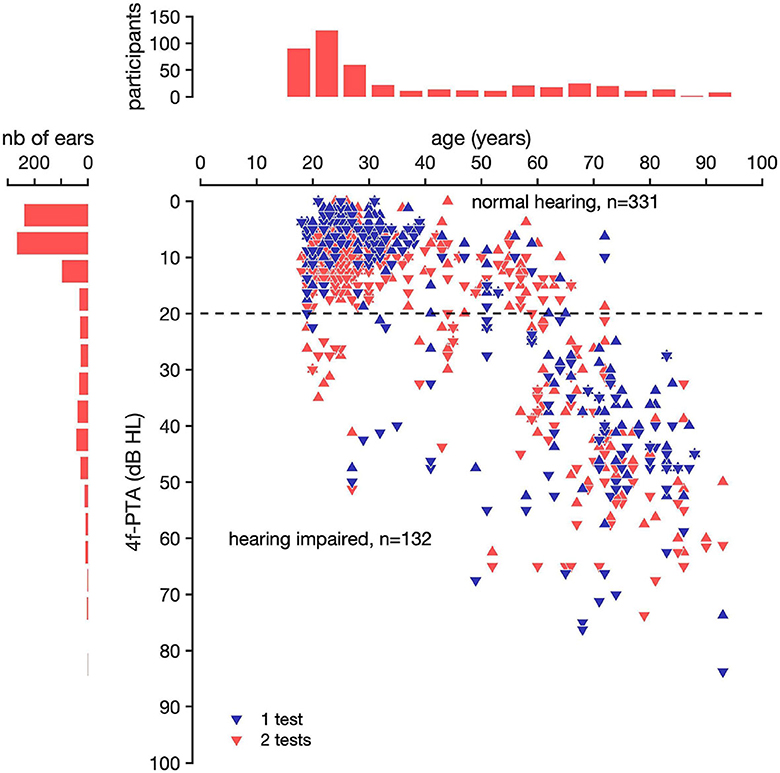
Figure 4. Best and worst ear 4f-PTA as a function of age of the 463 participants tested. The horizontal line at 20 dB HL represents the threshold for hearing impairment as defined by the WHO (World Health Organization). Participants were considered as hearing-impaired over 20 dB HL. The results of participants who performed only 1 test (SoNoise_SπN0_Syn) are represented as a red triangle and as a blue triangle if they performed 2 tests (SoNoise_SπN0_Syn + SoNoise_S0N0_Syn). The 4f-PTA was calculated by averaging the hearing thresholds at 0.5, 1, 2, and 4 kHz. Triangles with the point facing up represent the 4f-PTA of the best ears, and triangles with the point facing down represent the 4f-PTA of the worst ears.
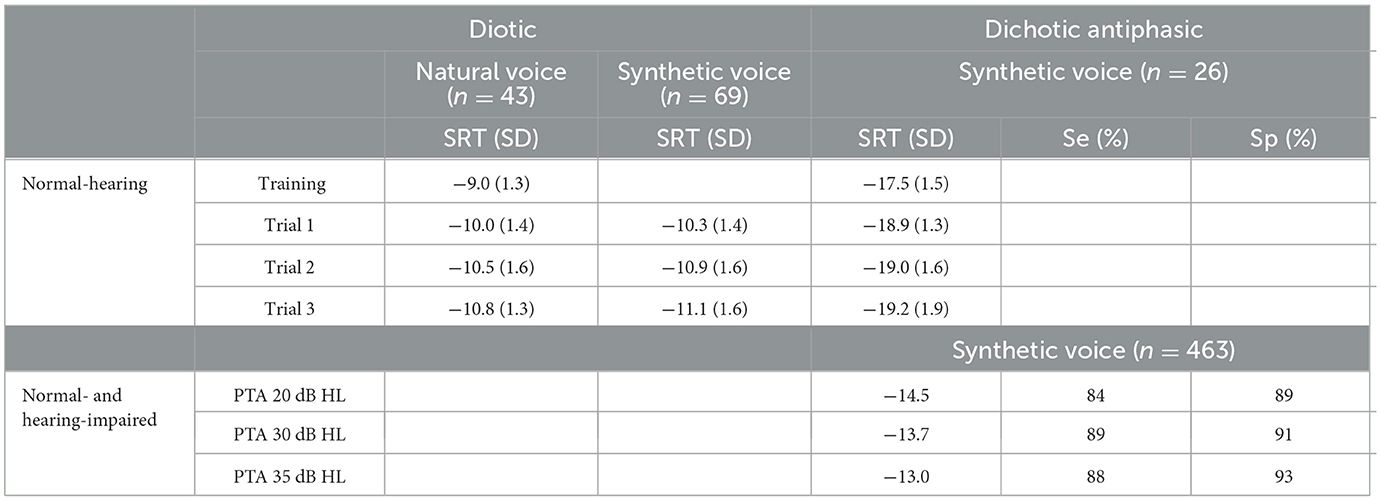
Table 3. Diotic and dichotic antiphasic SRT for the best and the worst ear respectively, normative and study populations, and both natural and synthetic voices.
The threshold of 30 dB HL is the audiometric limit chosen to qualify for reimbursement of hearing aids in France (Journal Officiel de la République Française n°0265, 2018; Joly et al., 2022). The SRTs on the worst ear of the study population (n = 463) were plotted against the 4f-PTA (Figure 5A).
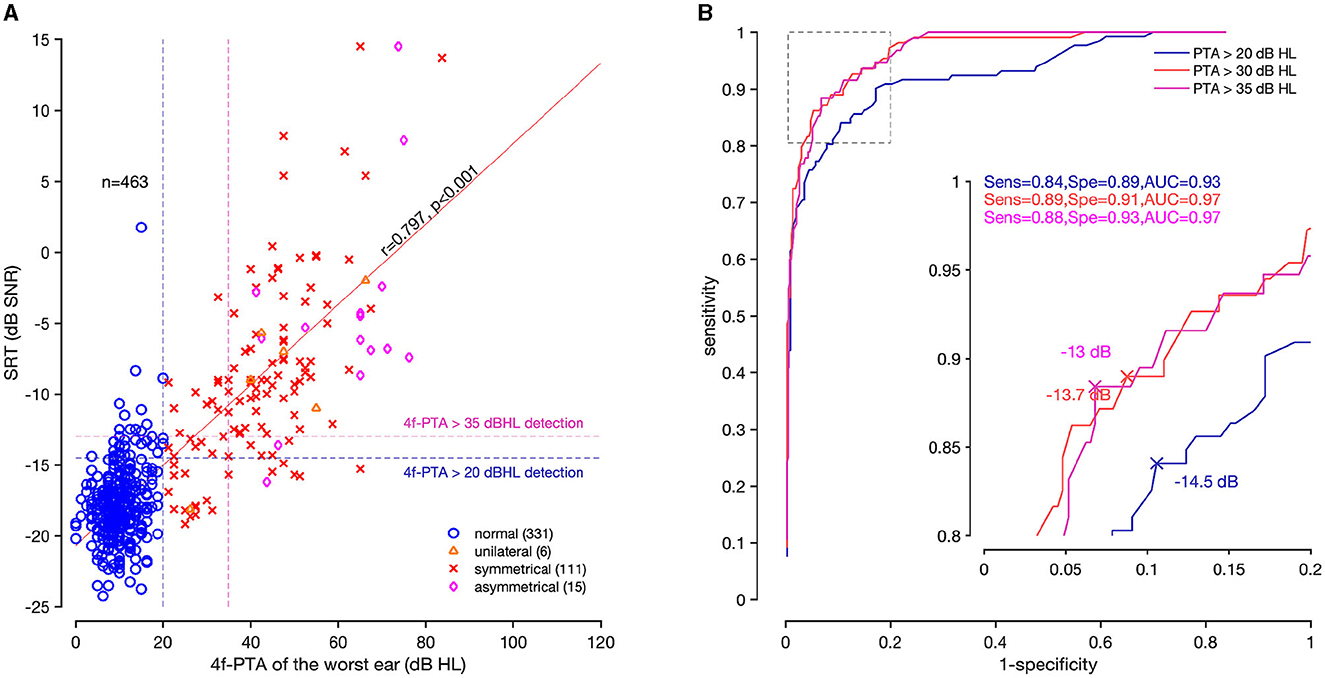
Figure 5. Correlation and ROC curves of the SoNoise_SπN0_Syn test. (A) Correlation coefficient (r = 0.797, p < 0.001) between SRT and 4f-PTA of the worst ear (n = 463). Normal-hearing is represented as a blue circle, unilateral hearing impairment as an orange triangle, symmetrical hearing impairment as a red cross, and asymmetrical deafness as a pink diamond. Two vertical dashed lines are drawn at 20 dB HL (blue) and 35 dB HL (pink). The horizontal dashed lines represent the best SRT value predictive of a 20 dB HL and 35 dB HL 4f-PTA. The top right corner represents participants with abnormal hearing results for both tests (true-positive). The top left corner shows discordant results between 4f-PTA (normal) and SoNoise_SπN0_Syn (abnormal; false-positive). The bottom right corner shows discordant results between 4f-PTA (abnormal) and SoNoise_SπN0_Syn (normal; false-negative). The bottom left corner represents participants with normal-hearing results for both tests (true-negative). (B) ROC curves corresponding to 4f-PTA of 20 dB HL (blue), 30 dB HL (red), and 35 dB HL (pink). The inserted graph enlarges the dotted square.
The correlation coefficient measured between SRTs of the worst ear and 4f-PTA was r = 0.797 (p < 0.001). The ROC curves allowed visualization of the sensitivity and specificity according to SNR values at different 4f-PTA cut-offs (20, 30, and 35 dB HL; Figure 5B). For a 4f-PTA of 20 dB HL (mild hearing loss), the optimal threshold value was −14.5 dB SNR and corresponded to a sensitivity of 84% and a specificity of 89%. For a 4f-PTA of 30 dB HL (clinical threshold defining deafness in France), the best threshold value was −13.7 dB SNR and corresponded to a sensitivity of 89% and a specificity of 91%. For a 4f-PTA of 35 dB HL (moderate hearing loss), the best threshold value was −13.0 dB SNR and corresponded to a sensitivity of 88% and a specificity of 93%.
The normative value (defined previously) of the SoNoise_SπN0_Syn training test was measured at −17.5 dB SNR, with a standard deviation of 1.5 dB. Theoretically therefore, 95% of the normal-hearing population would be expected to obtain a score lower (better) than −14.5 dB SNR (Z-score of 2). In this study population, 89.4% of the normal-hearing group, 0% of the unilateral hearing loss group, 17.8% of the symmetrical hearing loss group and 6.7% of the asymmetrical hearing loss group had a Z-Score <2. The normative value of the SoNoise_S0N0_Syn test was measured at −10.3 dB SNR, with a standard deviation of 1.4 dB. Theoretically therefore, 95% of the normal-hearing population would be expected to obtain a score lower (better) than −7.5 dB SNR (Z-score of 2). In this study population, 95.6% of the normal-hearing group, 20% of the unilateral hearing loss group, 21.7% of the symmetrical hearing loss group and 22.2% of the asymmetrical hearing loss group had a Z-score <2. Figure 6 represents the SRTs of the normative and study populations for both SoNoise_SπN0_Syn (A) and SoNoise_S0N0_Syn (B).
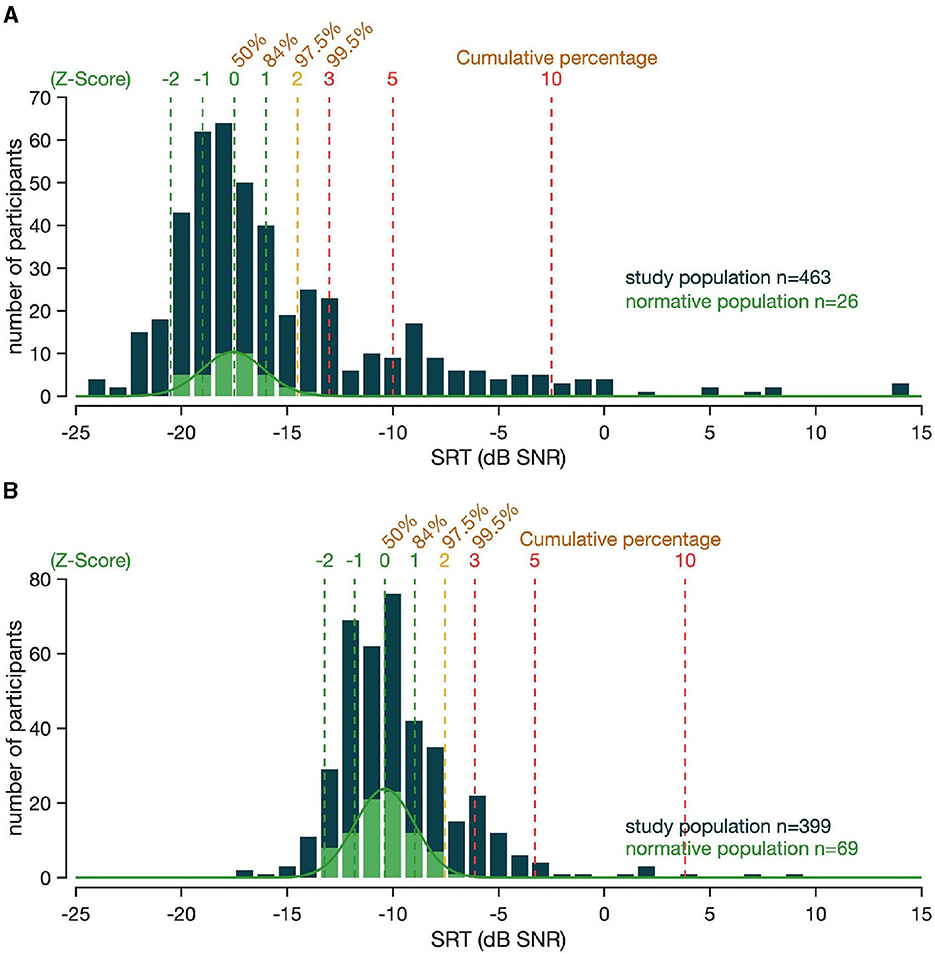
Figure 6. (A) SRT distribution of the SoNoise_SπN0_Syn. The SRT of the normative population is represented in light green (n = 26). The SRT of the study population that participated in the diagnostic power assessment study (n = 463) are shown in dark blue. The vertical dashed lines represent the Z-score, with associated percentile values. (B) SRT distribution of the SoNoise_S0N0_Syn. The SRT of the population is represented in light green (n = 69). The SRT of the study population (n = 399) are shown in dark blue. The vertical dashed lines represent the Z-score, with associated percentile values.
We measured the BILD using results of the 399 participants who performed both SoNoise_SπN0_Syn and SoNoise_S0N0_Syn tests. The distribution is given in Figure 7. The mean BILD for the 325 participants with normal hearing was 7.3 dB (SD = 2.1), and for those with hearing loss it was 1.3 dB (SD = 1.4) when unilateral (n = 6), 4.8 dB (SD = 5.4) when symmetrical (n=59), and 1.4 dB (SD=2.4) when asymmetrical (n = 9). ANOVA revealed significant differences in BILD across the hearing loss types (p < 0.001). Performing post-hoc tests (Wilcoxon test), normal-hearing group presented significantly better BILD than the other three (Sym: p < 0.001, Uni: p < 0.001, Asym: p < 0.001). Participants presenting symmetrical hearing loss had statistically better BILD than those presenting unilateral and asymmetric hearing loss (Uni: p = 0.035, Asym: p < 0.001). Unilateral and asymmetric hearing loss did not present statistical difference in BILD.
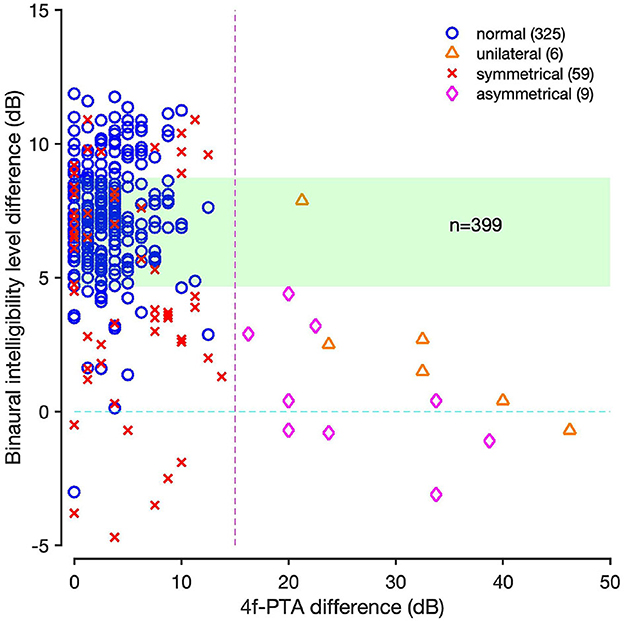
Figure 7. BILD according to 4f-PTA difference for the participants who performed both SoNoise_SπN0_Syn and SoNoise_S0N0_Syn tests. Normal ears (worst ear≤20 dB HL) are represented as blue circles, unilateral (best ear<=20 dB HL and worst ear>20 dB HL) deafness as orange triangles, symmetrical (best ear>20 dB HL and diffPTA≤15 dB) deafness as red crosses, and asymmetrical (worst ear>20 dB HL and best ear>20 dB HL and diffPTA>15 dB) deafness as pink diamonds. The light green area represents the normative values of the BILD.
4 Discussion
There were several reasons for developing a new French SIN test. Firstly, accessing equipment for free-field testing currently represents a problem. The development of SIN tests on a tablet with Bluetooth calibrated headphones facilitates their distribution and accessibility. Finally, no French SIN test currently exists enabling the assessment of BILD effect using headphones. It is important to assess the function of both ears working together. BILD measurement thus permitted would provide useful information to categorize hearing loss types with reasonable accuracy, any unilateral or asymmetric hearing loss being revealed by minimal unmasking.
The first part of this study was to determine normative values of SoNoise tests, based on the number of times they are performed. The normative value of the SoNoise_S0N0_Na was −10.0 dB SNR (SD = 1.4), meaning that 95% of the normal-hearing population obtained a score lower (better) than −7.2 dB SNR (Z-score of 2). For the SoNoise_S0N0_Syn, the normative value measured was −10.3 dB SNR (SD = 1.4), meaning that 95% of the normal-hearing population obtained a score lower (better) than −7.5 dB SNR (Z-score of 2). These results can only be compared against SIN tests using binaural diotic presentation. De Sousa et al. (2020) and Prang et al. (2021), respectively found −11.1 dB SNR (SD = 0.8) and −7.1 dB SNR (SD = 1.4) with triplets of words (digits, and digit—common noun—color, respectively) in South African English and English languages. Difference in the results between both tests may be either due to types of words, presentation mode (binaural or monaural) or noise used. They respectively tested 26 and 20 normal-hearing participants (PTA <15 dB HL). In another study on 202 normal-hearing participants with 4f-PTA better than 25 dB HL, De Sousa et al. (2022) reported a mean SRT of −10.3 dB SNR (SD = 1.3). Matrix tests measured SRT between −10.1 dB SNR (SD = 0.7) and −6 dB SNR (SD = 0.8) for 14 different languages, but with 5 words (Kollmeier et al., 2015). SRT obtained with Matrix tests are higher (worse) than SoNoise and digit in noise (DIN) tests, probably because they use open lists while we used closed ones. The normative value of the SoNoise_SπN0_Syn test was −17.5 dB SNR (SD = 1.5), meaning that 95% of the normal-hearing population obtained a score lower (better) than −14.5 dB SNR (Z-score of 2). These results can only be compared against SIN tests using dichotic antiphasic presentation. In their study, Smits et al. (2016) tested 16 normal-hearing participants (14 women and 2 men) aged between 19 and 25 years (average 22 yrs) with a DIN test in Dutch and American English languages. They respectively found standards of −15.3 dB SNR (SD = 0.9) and −17.1 dB SNR (SD = 0.9). In their studies, De Sousa et al. (2020, 2022) tested 26 and 243 normal-hearing participants with a DIN test in South African English language, and found standards of −18.4 dB SNR (SD = 1.4) and −17.2 dB SNR (SD = 2.4), respectively. The normative values of the present study are similar to both publications previously cited, but a little closer to that of De Sousa.
Synthetic voice has made enormous progress and is now frequently used in everyday life. Previous studies have evaluated the intelligibility of synthetic voice compared to natural voice. Some found no significant difference in intelligibility between the two (Mirenda and Beukelman, 1987; Paris et al., 1995; Koul, 2003; Nuesse et al., 2019; Ibelings et al., 2022; Schwarz et al., 2022). In their study, Nuesse et al. (2019) measured an SRT of −9.1 dB SNR for the natural voice, and −8.6 dB SNR for the synthetic voice. Tests were performed with the German Matrix test (Wagener et al., 1999). Some others suggested a dependence on synthetic voice quality (Clark, 1983; Pisoni et al., 1985; Greene et al., 1986; Mirenda and Beukelman, 1987, 1990; Kangas and Allen, 1990; Humes et al., 1991; Wolters et al., 2007; Papadopoulos et al., 2009; Cooke et al., 2013; Aoki et al., 2022). Finally, some authors found that natural voice had significantly higher intelligibility than synthetic voice (Koul, 2003; Venkatagiri, 2003; Simantiraki et al., 2018). While intelligibility was found to strongly depend on different features such as speech synthesizer quality, listening conditions and experience (Koul, 2003), the way the words are recorded and the speech material were reported to have only a minimal impact on the results (Van den Borre et al., 2021). We compared the SRT scores obtained in SoNoise_S0N0_Na and SoNoise_S0N0_Syn tests. The results show no significant difference between the average SRT measured for the three trials with respective p-values of 0.913, 0.691, and 0.754.
Learning effect is a key element and needs to be considered when performing SIN tests. For natural voice, the learning effect was significant with differences of 1, 1.5, and 1.8 dB (p < 0.001 for all three) between the training and the first, second and third tests respectively. For synthetic voice, the learning effect was also significant with a difference of 1.3, 1.9, and 2.1 dB (p = 0.016, p = 0.003, and p < 0.001) between the training and the first, second and third tests, respectively. These results are similar to those found in the literature, which show about 1 dB improvement between the first two tests, and about 2 dB between the first and fourth (Brand and Kollmeier, 2002; Jansen et al., 2012; Kollmeier et al., 2015; Schlueter et al., 2016; Nuesse et al., 2019). However, some studies measured a negligible learning effect after the first training (Hagerman and Kinnefors, 1995; Rhebergen et al., 2008; Paglialonga et al., 2014; Kaandorp et al., 2015; Sheikh Rashid et al., 2017). These findings highlight the need to compare participants' results to the appropriate normative value, according to the number of times the test is performed: i.e., a normative value for screening, and others for diagnosis or follow-up.
To assess the accuracy of the test and thus diagnostic power, we assessed the sensitivity and specificity of the SoNoise_SπN0_Syn test at different 4f-PTA cut-off levels. The main characteristic for an accurate SIN test is its ability to detect almost all cases of hearing loss without identifying individuals with normal hearing. For a 4f-PTA of 20 dB HL, the threshold value was −14.5 dB SNR with a sensitivity of 84% and specificity of 89%. For a 4f-PTA of 30 dB HL, the threshold value was −13.7 dB SNR with a sensitivity of 89% and a specificity of 91%. Finally, for a 4f-PTA of 35 dB HL, the threshold value was −13.0 dB SNR with a sensitivity of 88% and specificity of 93%. The French DIN test measured the correlation between DIN SRT and 4f-PTA (0.5/1/2/4 kHz; Ceccato et al., 2021). They tested 167 participants (77 women and 90 men), aged from 19 to 90 years (average 56, SD = 22). Among the 167 participants tested, 66 were classified as having normal hearing, 75 symmetric sensorineural hearing loss, 19 unilateral or asymmetric hearing loss, and seven mixed hearing loss. For a 20 dB HL cut-off value, the best sensitivity and specificity were respectively 96 and 93% with −12.9 dB SNR. For a 40 dB HL cut-off value, the best sensitivity and specificity found were respectively 99 and 83% with −10.3 dB SNR. De Sousa et al. (2020) compared the DIN results of the worst ear to the 4f-PTA (0.5/1/2/4 kHz). For a 40 dB HL cut-off value, the best sensitivity and specificity were respectively 87 and 91% with −14.2 dB SNR. For a 25 dB HL cut-off value, the best sensitivity and specificity were respectively 90 and 84% with −15.7 dB SNR (De Sousa et al., 2022). In their study, 489 participants were tested: 243 were classified as having normal hearing, 172 symmetric sensorineural hearing loss, 42 unilateral or asymmetric hearing loss, and 32 conductive hearing loss. Unfortunately, in their study, Smits et al. (2016) did not report sensitivity or specificity with the PTA.
In the present study, the correlation coefficient found between 4f-PTA and SRT of the SoNoise_SπN0_Syn test was r = 0.797 (p < 0.001). This is consistent with the two studies using dichotic antiphasic presentation which both found r = 0.82 (De Sousa et al., 2020; Ceccato et al., 2021). Unfortunately, again, there was no mention of correlation coefficient with the PTA in the study published by Smits et al. (2013).
In this study and those presented, age and hearing-impairment repartition may have a non-negligible effect on the performance of speech reception threshold in noise to predict hearing-impairment based on 4f-PTA. For example, more people with 4f-PTA under 20 dB HL and poor understanding in noise would raise false-positive number, lowering specificity, meanwhile more people with 4f-PTA mild hearing loss but good understanding in noise would raise false-negative number, lowering sensitivity. The ROC analysis values must be taken with perspective with the profile of these people misclassified according to their problems. On Figure 5A, participants in the top left corner demonstrated problems understanding in noise, however this would likely be left unmanaged today due to the good 4f-PTA results, considered the main criteria for the management of hearing-impaired people. These people often have real complaints about their capacity to communicate in difficult daily situations and more and more countries consider that poor understanding in noise alone merits treatment. On the opposite, the bottom right corner shows discordant results between 4f-PTA (abnormal) and SoNoise_SπN0_Syn (normal). These participants have mostly good low frequency but poor high frequency thresholds, and can be explained by dichotic antiphasic presentation improving the speech understanding for individuals with symmetric hearing loss but with well-preserved low frequency thresholds (Culling and Lavandier, 2021). These people often have no real complaint in noisy situations but are often eligible for hearing loss management, not for milder hearing loss but for 4f-PTA above 30 dB HL. In this study, their detection is difficult due to the antiphasic presentation, and more of these profiles would have lowered the obtained sensitivity. Studies have shown that diotic presentation fails to detect unilateral and asymmetrical hearing loss due to the dominance of the better ear. Also, this presentation is mostly unaffected by bone conduction hearing loss when presented at suprathreshold levels (De Sousa et al., 2020, 2022; Ceccato et al., 2021). Dichotic antiphasic presentation correlates well with the results of the worst ear, but misses symmetric hearing loss with well-preserved low frequency thresholds.
Each test type having its advantages and disadvantages demonstrates the need for a combined test with both diotic and dichotic antiphasic assessment allowing the discrimination between different types of hearing loss. Another option could be to combine a screening audiometric test and a questionary evaluating the hearing impairment in daily life like the HHIE-S (Ventry and Weinstein, 1982; Duchêne et al., 2022) to assess the problematic of subjects that perform well but still experienced hearing difficulties. Those profiles sometimes get a real benefit from hearing care, even with under-clinical audiometric requirements.
4.1 Binaural intelligibility level difference
The BILD were 8.6 dB (SD = 2.0), 8.1 dB (SD = 2.1), and 8.1 dB (SD = 1.9) for the three SoNoise_S0N0_Syn and SoNoise_SπN0_Syn comparisons, respectively. ANOVA analysis showed no significant learning effect on the BILD (p = 0.645). These results are consistent with those published by De Sousa et al. (2020, 2022) who found a difference between diotic and dichotic presentation of the DIN test between 6 and 8 dB. They reported a SRT of −11.1 and −18.4 dB SNR respectively for diotic and dichotic presentation for the first study, and −10.3 dB SNR and −17.2 dB SNR respectively for the second one. Smits et al. (2016) meanwhile found a smaller BILD (called binaural masking level difference BMLD) with the DIN test in Dutch and US English giving 5.7 and 5.6 dB, respectively. In an additional study (unpublished), Ceccato et al. (2021) tested 19 normal-hearing young adults. They found a SRT of −10.7 dB SNR (SD = 1.3) with the diotic presentation and −15.4 dB SNR (SD = 1.3) with the dichotic antiphasic, both of which are lower than what was measured using diotic and dichotic SoNoise tests with synthetic voice. The differences in BILD may be explained by the specific equalization for binaural diotic and antiphasic presentation for SoNoise test, and by the fact that SoNoise tests do not only use digits.
4.2 Time duration
Concerning test duration, the mean duration of the SoNoise tests was 167 s (SD = 38 s, median 166 s, IC95 [164–170]), and took no longer than other screening SIN tests. Indeed, this duration is consistent with the 3 min measured with the DIN triplet test (Smits et al., 2004; Smits and Houtgast, 2005; Koole et al., 2016; De Sousa et al., 2020). In their studies, they respectively tested: 3,327 adults aged above 50 years (mean = 65 yrs), 38 normal-hearing and hearing-impaired participants (76 ears) among which 22 normal ears and 54 impaired ears, and 39,968 participants during a telephone mass screening study (75% older than 44 yrs of age). The DIN was reported (Smits et al., 2013) to have a 2-minute test duration, although the way this was measured was not mentioned. In their study on 19 normal-hearing and 21 hearing-impaired participants, Jansen et al. (2010) reported a 5-minute duration for the FrDigit3 test, longer than other triplet tests. Where the SoNoise_SπN0_Syn test saves a lot of time is in hearing screening. SoNoise tests for use in screening and in diagnosis have the advantage of being fast in both cases and thus fulfill a key requirement for performing SIN tests.
4.3 Speech material
The development and validation of SIN tests requires several steps. The equalization phase ensures that each word has a 50% chance of being recognized correctly at the same SNR. Indeed, the generation of the words does not certify an identical difficulty between them. One equalization was done for the SoNoise_SπN0_Syn test, and one for the SoNoise_S0N0_Syn test. We decided to equalize each word separately, without prosody and coarticulation. Normal-hearing participants were tested with 1 to 5 tests, to present all words equally at different SNR levels. Psychometric curves were plotted for each of the words, and an intensity level correction then performed so that each word had a 50% chance of being recognized at the same SNR. The Dutch DIN equalized the whole triplet. Only some have been selected—those with a certain slope and SNR value—and normal-hearing subjects performed the DIN with an adaptive method (Smits et al., 2004). In their study, Jansen et al. (2010) used digits pronounced with natural intonation, but without coarticulation from one digit to another. They selected digits with steep slopes and with SRTs near the average SRT, before having them equalized by normal-hearing subjects with a fixed SNR method. In other studies, different procedures were used (Jansen et al., 2010; Potgieter et al., 2016; Ceccato et al., 2021). For Matrix tests, equalization protocol was more complicated and used coarticulation between the five words of the tests in different languages.
Then, level adjustments were applied: words with high intelligibility were reduced and words with low intelligibility were increased (Kollmeier et al., 2015). In this protocol, the final test was used to perform equalization, as proposed in Brand and Kollmeier (2002), Jansen et al. (2012) and recently by Masalski et al. (2021) for digits. This allows to get information of the item inner difficulties as well as the difficulties induced by their position in the group of words. We showed that the common nouns in the middle were the easiest, followed by the digits presented in first position and the colors in last position that is coherent with studies on the Matrix tests (Brand and Kollmeier, 2002; Jansen et al., 2012; Nuesse et al., 2019). We re-tested the difficulty of items after equalization and found that the item SRT variability dropped from 2.5 to 1 dB of standard deviation. While variations in SRT remained between digits, common nouns and colors, they were slightly reduced as well. Moreover, according to the second evaluation further equilibration in difficulty may be done, and even later by getting the results of the future test that are done. In this study, a different equalization has been performed for each one of the dichotic antiphasic and diotic SoNoise tests, unlike for the DIN tests where the words used for the dichotic antiphasic presentation were equalized using a diotic presentation of the words. The question could be raised as to the impact on a dichotic test of an equalization with diotic word presentation.
The word “sanglier” is trisyllabic. When compared to other words, length appears not to be an issue. The jitter allows a random variation in duration between words, and the equalizations ensure that words are equally complicated to recognize. In their study, Potgieter et al. (2016) separated words with 200 ms of silence and 100 ms of jitter. In the DIN (Smits et al., 2013), the silent interval was 150 ms between digits, and was enlarged or reduced with a random ±50 ms. This reduces the rhythm of the test, and limits whether patients can understand a word only due to its duration. In their studies, Lyzenga and Smits (2011) and Smits et al. (2016) detected no significant difference in the SRT measured between triplets of digits pronounced with and without prosody and coarticulation, using male and female voices, respectively. It appears that coarticulatory cues are no longer available at a SNR of 10 dB (Fernandes et al., 2007). All combinations of triplet words were kept and available for testing, as described elsewhere (Prang et al., 2021).
The masking noise used in these tests was a white noise fitted to the long-term spectrum of the test words (Plomp and Mimpen, 1979; Nilsson et al., 1994; Brand and Kollmeier, 2002; Soli and Wong, 2008; Jansen et al., 2012; Dillon et al., 2016; Potgieter et al., 2016), ensuring that the chosen noise depended on the SoNoise test performed. Indeed, the long-term spectrum of the diotic test words differs from the dichotic antiphasic one, both having different shapes due to the inverted temporal envelopes. This approach therefore differs to that of Ceccato et al. (2021) who used the same masking noise for both diotic and dichotic presentations. In their study, De Sousa et al. (2022) did not specify whether the same masking noise was used for both diotic and dichotic antiphasic tests. In the SoNoise tests, there are differences between speech and noise power spectrum levels below 150 Hz for both natural and synthetic tests (Figure 1). The finite-impulse-response filter used tends to increase the noise spectrum shape, keeping more low frequencies for the noise. This is due to the algorithm's difficulty in generating a filter that follows rapid spectral changes of the speech.
Characteristics of the speech material are displayed in Table 2. The fundamental frequency was higher for natural voice (210 Hz) than for synthetic voice (178 Hz). In the US DIN test, the fundamental frequency was 208.9 Hz for the female voice used (Smits et al., 2016). In the present study, the tests also revealed a longer word duration for natural voice (661 ms) compared to synthetic voice (451 ms), leading to a slower speech rate with 1.6 and 2.3 syllables/s, respectively. In their study, Nuesse et al. (2019) also found a higher fundamental frequency for the natural speech, and a slower speech rate for the natural female OLSA (167 syllables/min) compared to the synthetic female voice (175 syllables/min). The FraMatrix and the French Intelligibility Sentence Test (FIST) measured higher speech rate with respectively 4.2 and 3.6 syllables/s (Jansen et al., 2012; Luts et al., 2008). The FrDigit3 shows a lower speech rate with 1.9 syllables/s (Jansen et al., 2010).
Most of the cited tests are designed for free-field presentation and the only ones specifically designed for headphones presentation are the screening tests. While free-field presentation may be more ecological and very useful for prosthetic evaluation (hearing aids, cochlear implants), a clinical setting is often not suited for a good free-field installation that requires space and stability to ensure reliable calibration. A clinical SIN test administered with headphones may therefore be of interest, especially if the test also measures some of the main binaural functions of the hearing.
4.4 Limitations
The results of this study were obtained using an Android OS tablet (Galaxy Tab A7) and calibrated Orosound Bluetooth headphones, chosen for their capacity for automatic calibration with the high accuracy required in a professional hearing application.
SRT measured in normal-hearing participants with natural and synthetic voices showed no significant differences. It would now be interesting to compare SRT of both voices in hearing-impaired subjects. In this study, the learning effect calculation is not completely reliable. Normal-hearing participants tested to define the normative values performed the tests in a counterbalanced manner, as described elsewhere (Culling et al., 2005; McArdle et al., 2005; Potgieter et al., 2016). If each SoNoise test had been performed in succession by the participants, the normative values would probably have been different. This choice was made in order to carry out intra-individual analyses of the SRT on participants on different tests (natural vs. synthetic voices).
5 Conclusion
SoNoise tests are adaptive SIN self-tests, performed with Bluetooth headphones and a tablet. These SIN tests are the unique French auditory tests operating on the binaural system. Its dichotic antiphasic presentation enables its accurate measurement of SIN abilities. With a duration of only 3 min, it can be used for screening and diagnosis, with the corresponding normative values.
Data availability statement
The raw data supporting the conclusions of this article will be made available by the authors, without undue reservation.
Ethics statement
The studies involving human participants were reviewed and approved by Institutional Review Board of Montpellier University Hospital (IRB-MTP_2021_09_202100889). The patients/participants provided their written informed consent to participate in this study.
Author contributions
AG: Conceptualization, Formal analysis, Investigation, Methodology, Visualization, Writing – original draft, Writing – review & editing, Data curation. JC: Investigation, Writing – original draft. MB: Funding acquisition, Project administration, Software, Supervision, Writing – review & editing. J-LP: Resources, Validation, Writing – review & editing. FV: Conceptualization, Funding acquisition, Methodology, Project administration, Resources, Supervision, Validation, Writing – review & editing. J-CC: Conceptualization, Data curation, Formal analysis, Methodology, Project administration, Software, Supervision, Visualization, Writing – review & editing.
Funding
The author(s) declare that no financial support was received for the research, authorship, and/or publication of this article.
Conflict of interest
AG is the Chief Scientific Officer of SONUP. MB is the Chief Executive Officer of SONUP. FV and J-CC have relationships with SONUP, including equity, consulting, and potential royalties. FV has been awarded the Early Career Scientific Prize from the Fondation pour l'Audition.
The remaining authors declare that the research was conducted in the absence of any commercial or financial relationships that could be construed as a potential conflict of interest.
Publisher's note
All claims expressed in this article are solely those of the authors and do not necessarily represent those of their affiliated organizations, or those of the publisher, the editors and the reviewers. Any product that may be evaluated in this article, or claim that may be made by its manufacturer, is not guaranteed or endorsed by the publisher.
References
Anderson, S., Parbery-Clark, A., Yi, H. G., and Kraus, N. (2011). A neural basis of speech-in-noise perception in older adults. Ear Hear. 32:750. doi: 10.1097/AUD.0b013e31822229d3
Aoki, N. B., Cohn, M., and Zellou, G. (2022). The clear speech intelligibility benefit for text-to-speech voices: effects of speaking style and visual guise. JASA Expr. Lett. 2:10274. doi: 10.1121/10.0010274
Apeksha, K., and Kumar, A. U. (2017). Speech perception in quiet and in noise condition in individuals with auditory neuropathy spectrum disorder. J. Int. Adv. Otol. 13, 83–87. doi: 10.5152/iao.2017.3172
Bellis, T. J., and Bellis, J. D. (2015). Central auditory processing disorders in children and adults. Handb. Clin. Neurol. 129, 537–556. doi: 10.1016/B978-0-444-62630-1.00030-5
Bergeron, F., Berland, A., Fitzpatrick, E. M., Vincent, C., Giasson, A., Leung Kam, K., et al. (2019). Development and validation of the FrBio, an international French adaptation of the AzBio sentence lists. Int. J. Audiol. 58, 510–515. doi: 10.1080/14992027.2019.1581950
Boersma, P., and Weenink, D. (2013). Praat: Doing Phonetics by Computer [Computer Program]. Version 6.1.53.
Brand, T., and Kollmeier, B. (2002). Efficient adaptive procedures for threshold and concurrent slope estimates for psychophysics and speech intelligibility tests. J. Acoust. Soc. A. 111, 2801–2810. doi: 10.1121/1.1479152
Carhart, R., and Jerger, J. F. (1959). Preferred method for clinical determination of pure-tone thresholds. J. Speech Hear. Disord. 24, 330–345. doi: 10.1044/jshd.2404.330
Carhart, R., and Tillman, T. W. (1970). Interaction of competing speech signals with hearing losses. Archiv. Otolaryngol. 91, 273–279. doi: 10.1001/archotol.1970.00770040379010
Ceccato, J. C., Duran, M. J., Swanepoel, D. W., Smits, C., De Sousa, K. C., Gledhill, L., et al. (2021). French version of the antiphasic digits-in-noise test for smartphone hearing screening. Front. Publ. Health. 9, 725080. doi: 10.3389/fpubh.2021.725080
Clark, J. E. (1983). Intelligibility comparisons for two synthetic and one naturalspeech source. J. Phonet. 11, 37–49. doi: 10.1016/S0095-4470(19)30775-2
Cooke, M., Mayo, C., and Valentini-Botinhao, C. (2013). “Intelligibility-enhancingspeech modifications: the hurricane challenge,” in Interspeech (International Speech Communication Association), 3552–3556. doi: 10.21437/Interspeech.2013-764
Culling, J. F., and Lavandier, M. (2021). “Binaural unmasking and spatial release from masking,” in Binaural Hearing, Vol. 73, eds. R. Y. Litovsky, M. J. Goupell, R. R. Fay, and A. N. Popper (Berlin: Springer International Publishing), 209–241.
Culling, J. F., Zhao, F., and Stephens, D. (2005). The viability of speech-in-noise audiometric screening using domestic audio equipment : La viabilidad del tamizaje audiométrico con lenguaje en ruido utilizando equipo doméstico de audio. Int. J. Audiol. 44, 691–700. doi: 10.1080/14992020500267017
De Sousa, K. C., Smits, C., Moore, D. R., Myburgh, H. C., and Swanepoel, D. W. (2022). Diotic and antiphasic digits-in-noise testing as a hearing screening and triage tool to classify type of hearing loss. Ear Hear. 43, 1037–1048. doi: 10.1097/AUD.0000000000001160
De Sousa, K. C., Swanepoel, D. W., Moore, D. R., Myburgh, H. C., and Smits, C. (2020). Improving sensitivity of the digits-in-noise test using antiphasic stimuli. Ear Hear. 41, 442–450. doi: 10.1097/AUD.0000000000000775
De Sousa, K. C., Swanepoel, D. W., Moore, D. R., and Smits, C. (2018). A smartphone national hearing test : performance and characteristics of users. Am. J. Audiol. 27, 448–454. doi: 10.1044/2018_AJA-IMIA3-18-0016
Dickerson, R., Johnsen, K., Raij, A., Lok, B., Stevens, A., Bernard, T., et al. (2006). Virtual patients: assessment of synthesized versus recorded speech. Stud. Health Technol. Inform. 119, 114–119.
Dillon, H., Beach, E. F., Seymour, J., Carter, L., and Golding, M. (2016). Developmentof Telscreen: a telephone-based speech-in-noise hearing screening test with a novel masking noise and scoring procedure. Int. J. Audiol. 55, 463–471. doi: 10.3109/14992027.2016.1172268
Duchêne, J., Billiet, L., Franco, V., and Bonnard, D. (2022). Validation of the French version of HHIE-S (Hearing Handicap Inventory for the Elderly - Screening) questionnaire in French over-60 year-olds. Eur. Ann. Otorhinolaryngol. Head Neck Dis. 139, 198–201. doi: 10.1016/j.anorl.2021.11.003
Fernandes, T., Ventura, P., and Kolinsky, R. (2007). Statistical information and coarticulation as cues to word boundaries: a matter of signal quality. Percept Psychophys. 69, 856–864. doi: 10.3758/BF03193922
Füllgrabe, C., Moore, B. C., and Stone, M. A. (2015). Age-group differences in speechidentification despite matched audiometrically normal-hearing: contributions from auditory temporal processing and cognition. Front. Aging Neurosci. 6, 347. doi: 10.3389/fnagi.2014.00347
Gong, L., and Lai, J. (2003). To mix or not to mix synthetic speech and human speech?Contrasting impact on judge-rated task performance versus self-rated performance and attitudinal responses. Int. J. Speech Technol. 6, 123–131. doi: 10.1023/A:1022382413579
Grant, K. W., and Walden, T. C. (2013). Understanding excessive SNR loss in hearing-impaired listeners. J. Am. Acad. Audiol. 24, 258–273. doi: 10.3766/jaaa.24.4.3
Greene, B. G., Logan, J. S., and Pisoni, D. B. (1986). Perception of synthetic speech produced automatically by rule: intelligibility of eight text-to-speech systems. Behav. Res. Methods Instr. Comput. 18, 100–107. doi: 10.3758/BF03201008
Guo, Z., Yu, G., Zhou, H., Wang, X., Lu, Y., and Meng, Q. (2021). Utilizing true wireless stereo earbuds in automated pure-tone audiometry. Trends Hear. 25, 23312165211057367. doi: 10.1177/23312165211057367
Hagerman, B., and Kinnefors, C. (1995). Efficient adaptive methods for measuring speech reception threshold in quiet and in noise. Scand. Audiol. 24, 71–77. doi: 10.3109/01050399509042213
Hirsh, I. J. (1948). The influence of interaural phase on interaural summation and inhibition. J. Acoust. Soc. Audiol. Am. 20, 536–544. doi: 10.1121/1.1906407
Houtgast, T., and Festen, J. M. (2008). On the auditory and cognitive functions that may explain an individual's elevation of the speech reception threshold in noise. Int. J. Audiol. 47, 287–295. doi: 10.1080/14992020802127109
Humes, L. E., Nelson, K. J., and Pisoni, D. B. (1991). Recognition of synthetic speech by hearing-impaired elderly listeners. J. Speech Hear. Res. 34, 1180–1184. doi: 10.1044/jshr.3405.1180
Ibelings, S., Brand, T., and Holube, I. (2022). Speech recognition and listening effortof meaningful sentences using synthetic speech. Trends Hear. 26, 23312165221130656. doi: 10.1177/23312165221130656
Jansen, S., Luts, H., Dejonckere, P., van Wieringen, A., and Wouters, J. (2013). Efficient hearing screening in noise-exposed listeners using the digit triplet test. Ear Hear. 34, 773–778. doi: 10.1097/AUD.0b013e318297920b
Jansen, S., Luts, H., Wagener, K. C., Frachet, B., and Wouters, J. (2010). The French digit triplet test : a hearing screening tool for speech intelligibility in noise. Int. J. Audiol. 49, 378–387. doi: 10.3109/14992020903431272
Jansen, S., Luts, H., Wagener, K. C., Kollmeier, B., Del Rio, M., Dauman, R., et al. (2012). Comparison of three types of French speech-in-noise tests: a multi-center study. Int. J. Audiol. 51, 164–173. doi: 10.3109/14992027.2011.633568
Joly, C. A., Reynard, P., Mezzi, K., Bakhos, D., Bergeron, F., Bonnard, D., et al. (2022). Recommandations de la Société française d'ORL et de chirurgie de laface et du cou (SFORL) et de la Société française d'audiologie (SFA) pour la pratiquede l'audiométrie vocale dans le bruit chez l'adulte. Ann. françaises d'Oto-rhino-laryngologie et de Pathologie Cervico-faciale. 139, 20–27. doi: 10.1016/j.aforl.2021.03.004
Journal Officiel de la République Française n°0265 (2018). Texte n°7—Portant modification des modalités de prise en charge des aides auditives et prestations associées au chapitre 3 du titre II de la liste des produits et prestations prévue à l'article L. 165-1 du code de la sécurité sociale.
Kaandorp, M. W., Smits, C., Merkus, P., Goverts, S. T., and Festen, J. M. (2015). Assessing speech recognition abilities with digits in noise in cochlear implant and hearing aid users. Int. J. Audiol. 54, 48–57. doi: 10.3109/14992027.2014.945623
Kangas, K. A., and Allen, G. D. (1990). Intelligibility of synthetic speech for normal-hearing and hearing-impaired listeners. J. Speech Hear. Disord. 55, 751–755. doi: 10.1044/jshd.5504.751
Killion, M. C., and Niquette, P. A. (2000). What can the pure-tone audiogram tell us about a patient's SNR loss? Hear. J. 53, 46–48. doi: 10.1097/00025572-200003000-00006
Killion, M. C., Niquette, P. A., Gudmundsen, G. I., Revit, L. J., and Banerjee, S. (2004). Development of a quick speech-in-noise test for measuring signal-to-noise ratio loss in normal-hearing and hearing-impaired listeners. J. Acoust. Soc. A. 116, 2395–2405. doi: 10.1121/1.1784440
King, S. (2014). Measuring a decade of progress in Text-to-Speech. Loquens 1, e006. doi: 10.3989/loquens.2014.006
Kollmeier, B., Warzybok, A., Hochmuth, S., Zokoll, M. A., Uslar, V., Brand, T., et al. (2015). The multilingual matrix test: principles, applications, and comparison across languages: a review. Int. J. Audiol. 54, 3–16. doi: 10.3109/14992027.2015.1020971
Koole, A., Nagtegaal, A. P., Homans, N. C., Hofman, A., Baatenburg de Jong, R. J., and Goedegebure, A. (2016). Using the digits-in-noise test to estimate age-related hearing loss. Ear Hear. 37, 508–513. doi: 10.1097/AUD.0000000000000282
Koul, R. (2003). Synthetic speech perception in individuals with and without disabilities. Augment. Alternat. Commun. 19, 49–58. doi: 10.1080/0743461031000073092
Kramer, S. E., Kapteyn, T. S., and Festen, J. M. (1998). The self-reported handicapping effect of hearing disabilities. Audiology 37, 302–312. doi: 10.3109/00206099809072984
Leclercq, F., Renard, C., and Vincent, C. (2018). Speech audiometry in noise: development of the French-language VRB (vocale rapide dans le bruit) test. Eur. Ann. Otorhinolaryngol Head Neck Dis. 135, 315–319. doi: 10.1016/j.anorl.2018.07.002
Luts, H., Boon, E., Wable, J., and Wouters, J. (2008). FIST: a French sentence test forspeech intelligibility in noise. Int. J. Audiol. 47, 373–374. doi: 10.1080/14992020801887786
Lyzenga, J., and Smits, C. (2011). Effects of coarticulation, prosody, and noise freshness on the intelligibility of digit triplets in noise. J. Am. Acad. Audiol. 22, 215–221. doi: 10.3766/jaaa.22.4.4
Masalski, M., Adamczyk, M., and Morawski, K. (2021). Optimization of the speech test material in a group of hearing impaired subjects: a feasibility study for multilingual digit triplet test development. Audiol. Res. 11, 342–356. doi: 10.3390/audiolres11030032
McArdle, R. A., Wilson, R. H., and Burks, C. A. (2005). Speech recognition in multitalker babble using digits, words, and sentences. J. Am. Acad. Audiol. 16, 726–739. doi: 10.3766/jaaa.16.9.9
Mirenda, P., and Beukelman, D. (1987). A comparison of speech synthesis intelligibility with listeners from three age groups. Augment. Alternat. Commun. 3, 120–128. doi: 10.1080/07434618712331274399
Mirenda, P., and Beukelman, D. (1990). A comparison of intelligibility among natural speech and seven speech synthesizers with listeners from three age groups. Augment. Alternat. Commun. 6, 61–68. doi: 10.1080/07434619012331275324
Narne, V. K. (2013). Temporal processing and speech perception in noise by listenerswith auditory neuropathy. PLoS ONE. 8, e55995. doi: 10.1371/journal.pone.0055995
Nilsson, M., Soli, S. D., and Sullivan, J. A. (1994). Development of the Hearing in Noise Test for the measurement of speech reception thresholds in quiet and in noise. J. Acoust. Soc. Am. 95, 1085–1099. doi: 10.1121/1.408469
Nuesse, T., Wiercinski, B., Brand, T., and Holube, I. (2019). Measuring speech recognition with a matrix test using synthetic speech. Trends Hear. 23, 233121651986298. doi: 10.1177/2331216519862982
Paglialonga, A., Tognola, G., and Grandori, F. (2011). SUN-test (Speech Understanding in Noise): a method for hearing disability screening. Audiol. Res. 1, e13. doi: 10.4081/audiores.2011.e13
Paglialonga, A., Tognola, G., and Grandori, F. (2014). A user-operated test of suprathreshold acuity in noise for adult hearing screening: the SUN (SPEECH UNDERSTANDING IN NOISE) test. Comput. Biol. Med. 52, 66–72. doi: 10.1016/j.compbiomed.2014.06.012
Papadopoulos, K., Koutsoklenis, A., Katemidou, E., and Okalidou, A. (2009). Perception of synthetic and natural speech by adults with visual impairments. J. Vis. Impairment Blindness 103, 403–414. doi: 10.1177/0145482X0910300704
Paris, C. R., Gilson, R. D., Thomas, M. H., and Silver, N. C. (1995). Effect of syntheticvoice intelligibility on speech comprehension. Hum. Fact. 37, 335–340. doi: 10.1518/001872095779064609
Pisoni, D. B., Nusbaum, H. C., and Greene, B. G. (1985). Perception of syntheticspeech generated by rule. Proc. IEEE 73, 1665–1676. doi: 10.1109/PROC.1985.13346
Plomp, R. (1986). A signal-to-noise ratio model for the speech-reception threshold ofthe hearing-impaired. J. Speech Lang. Hear. Res. 29, 146–154. doi: 10.1044/jshr.2902.146
Plomp, R., and Mimpen, A. M. (1979). Improving the reliability of testing the speechareception threshold for sentences. Audiology 18, 43–52. doi: 10.3109/00206097909072618
Potgieter, J.-M., Swanepoel, D. W., Myburgh, H. C., Hopper, T. C., and Smits, C. (2016). Development and validation of a smartphone-based digits-in-noise hearing test in South African English. Int. J. Audiol. 55, 405–411. doi: 10.3109/14992027.2016.1172269
Potgieter, J.-M., Swanepoel, D. W., Myburgh, H. C., and Smits, C. (2018b). The South African english smartphone digits-in-noise hearing test : effect of age, hearing loss, and speaking competence. Ear Hear. 39, 656–663. doi: 10.1097/AUD.0000000000000522
Potgieter, J.-M., Swanepoel, D. W., and Smits, C. (2018a). Evaluating a smartphone digits-in-noise test as part of the audiometric test battery. South Afri. J. Commun. Disord. 65, 574. doi: 10.4102/sajcd.v65i1.574
Prang, I., Parodi, M., Coudert, C., Legoff, S., Exter, M., Buschermöhle, M., et al. (2021). The simplified French Matrix. A tool for evaluation of speech intelligibility in noise. Eur. Ann. Otorhinolaryngol. Head Neck Dis. 138, 253–256. doi: 10.1016/j.anorl.2020.12.003
Rance, G., Ryan, M. M., Carew, P., Corben, L. A., Yiu, E., Tan, J., et al. (2012). Binaural speech processing in individuals with auditory neuropathy. Neuroscience 226, 227–235. doi: 10.1016/j.neuroscience.2012.08.054
Rhebergen, K. S., Versfeld, N. J., and Dreschler, W. A. (2008). Learning effect observed for the speech reception threshold in interrupted noise with normal-hearing listeners. Int. J. Audiol. 47, 185–188. doi: 10.1080/14992020701883224
Schlueter, A., Lemke, U., Kollmeier, B., and Holube, I. (2016). Normal and time-compressed speech : how does learning affect speech recognition thresholds in noise? Trends Hear. 20, 233121651666988. doi: 10.1177/2331216516669889
Schwarz, T., Frenz, M., Bockelmann, A., and Husstedt, H. (2022). Untersuchung einesynthetischen Stimme für den Freiburger Einsilbertest. GMS Z Audiol (Audiol Acoust). 4:Doc04.
Sheikh Rashid, M., Dreschler, W. A., and de Laat, J. A. P. M. (2017). Evaluation of an internet-based speech-in-noise screening test for school-age children. Int. J. Audiol. 56, 967–975. doi: 10.1080/14992027.2017.1378932
Simantiraki, O., Cooke, M., and King, S. (2018). “Impact of different speech types on listening effort,” in Interspeech (International Speech Communication Association), 2267–2271. doi: 10.21437/Interspeech.2018-1358
Smits, C., and Houtgast, T. (2005). Results from the Dutch speech-in-noise screening test by telephone. Ear Hear. 26, 89–95. doi: 10.1097/00003446-200502000-00008
Smits, C., Kapteyn, T. S., and Houtgast, T. (2004). Development and validation of an automatic speech-in-noise screening test by telephone. Int. J. Audiol. 43, 15–28. doi: 10.1080/14992020400050004
Smits, C., Kramer, S. E., and Houtgast, T. (2006). Speech reception thresholds in noise and self-reported hearing disability in a general adult population. Ear Hear. 27, 538–549. doi: 10.1097/01.aud.0000233917.72551.cf
Smits, C., Theo Goverts, S., and Festen, J. M. (2013). The digits-in-noise test: assessing auditory speech recognition abilities in noise. J. Acoust. Soc. A. 133, 1693–1706. doi: 10.1121/1.4789933
Smits, C., Watson, C. S., Kidd, G. R., Moore, D. R., and Goverts, S. T. (2016). A comparison between the Dutch and American-English digits-in-noise (DIN) tests in normal-hearing listeners. Int. J. Audiol. 55, 358–365. doi: 10.3109/14992027.2015.1137362
Soli, S. D., and Wong, L. L. (2008). Assessment of speech intelligibility in noise with the Hearing in Noise Test. Int. J. Audiol. 47, 356–361. doi: 10.1080/14992020801895136
Vaillancourt, V., Laroche, C., Mayer, C., Basque, C., Nali, M., Eriks-Brophy, A., et al. (2005). Adaptation of the hint (hearing in noise test) for adult canadianfrancophone populations. Int. J. Audiol. 44, 358–361. doi: 10.1080/14992020500060875
Van den Borre, E., Denys, S., van Wieringen, A., and Wouters, J. (2021). The digit triplettest: a scoping review. Int. J. Audiol. 60, 946–963. doi: 10.1080/14992027.2021.1902579
Venkatagiri, H. S. (2003). Segmental intelligibility of four currently used text-to- speechsynthesis methods. J. Acoust. Soc. A. 113, 2095–2104. doi: 10.1121/1.1558356
Ventry, I. M., and Weinstein, B. E. (1982). The hearing handicap inventory for the elderly:a new tool. Ear Hear. 3, 128–134. doi: 10.1097/00003446-198205000-00006
Wagener, K., Kühnel, V., and Kollmeier, B. (1999). Entwicklung und evaluation einessatztests in deutscher sprache i: design des oldenburger satztests. Z Audiol. 38, 4–115.
Webster, W. R. (1951). The influence of interaural phase on masked thresholds I. The role of interaural time deviation. J. Acoust. Soc. Am. 23, 452–462. doi: 10.1121/1.1906787
White-Schwoch, T., Anderson, S., and Kraus, N. (2020). Long-term follow-up of a patient with auditory neuropathy and normal hearing thresholds. J. Am. Med. Assoc. Otolaryngol. Head Neck Surg. 146, 499–501. doi: 10.1001/jamaoto.2019.4314
White-Schwoch, T., Anderson, S., Krizman, J., Bonacina, S., Nicol, T., Bradlow, A. R., et al. (2022). Multiple cases of auditory neuropathy illuminate the importance of subcortical neural synchrony for speech-in-noise recognition and the frequency-following response. Ear Hear. 43, 605–619. doi: 10.1097/AUD.0000000000001122
Wilson, R. H., Moncrieff, D. W., Townsend, E. A., and Pillion, A. L. (2003). Development of a 500-Hz masking- leveldifference protocol for clinic use. J. Am. Acad. Audiol. 14, 1–8. doi: 10.3766/jaaa.14.1.2
Wolters, M., Campbell, P., DePlacido, C., Liddell, A., and Owens, D. (2007). “The effect ofhearing loss on the intelligibility of synthetic speech,” in Proceedings of the 16th International Congress of the ICPhS (University of Edinburgh, Edinburgh Research Explorer).
World Health Organization (2021). World Report on Hearing. Geneva: World Health Organization. Available online at: https://apps.who.int/iris/handle/10665/339913 (accessed August 5, 2023).
Wu, P. Z., O'Malley, J. T., de Gruttola, V., and Liberman, M. C. (2020). Age-related hearing loss is dominated by damage to inner ear sensory cells, not the cellular batterthat powers them. J. Neurosci. 40, 6357–6366. doi: 10.1523/JNEUROSCI.0937-20.2020
Keywords: hearing diagnosis, speech-in-noise test, natural and synthetic voices, dichotic antiphasic, tablet based
Citation: Génin A, Courtial J, Balcon M, Puel J-L, Venail F and Ceccato J-C (2024) Development and validation of a French speech-in-noise self-test using synthetic voice in an adult population. Front. Audiol. Otol. 2:1292949. doi: 10.3389/fauot.2024.1292949
Received: 12 September 2023; Accepted: 03 January 2024;
Published: 26 January 2024.
Edited by:
Faheema Mahomed-Asmail, University of Pretoria, South AfricaReviewed by:
Inga Holube, Jade University of Applied Sciences, GermanyRazan Alfakir, Auburn University, United States
Copyright © 2024 Génin, Courtial, Balcon, Puel, Venail and Ceccato. This is an open-access article distributed under the terms of the Creative Commons Attribution License (CC BY). The use, distribution or reproduction in other forums is permitted, provided the original author(s) and the copyright owner(s) are credited and that the original publication in this journal is cited, in accordance with accepted academic practice. No use, distribution or reproduction is permitted which does not comply with these terms.
*Correspondence: Arnaud Génin, arnaud.g@sonup.fr