Pathway Tools Management of Pathway/Genome Data for Microbial Communities
 Peter D. Karp1*
  Suzanne Paley1
  Markus Krummenacker1 Anamika Kothari1
  Michael J. Wannemuehler2
  Gregory J. Phillips2
- 1Bioinformatics Research Group, Artificial Intelligence Center, SRI International, Menlo Park, CA, United States
- 2Department of Veterinary Microbiology, Iowa State University, Ames, IA, United States
The Pathway Tools (PTools) software provides a suite of capabilities for storing and analyzing integrated collections of genomic and metabolic information in the form of organism-specific Pathway/Genome Databases (PGDBs). A microbial community is represented in PTools by generating a PGDB from each metagenome-assembled genome (MAG). PTools computes a metabolic reconstruction for each organism, and predicts its operons. The properties of individual MAGs can be investigated using the many search and visualization operations within PTools. PTools also enables the user to investigate the properties of the microbial community by issuing searches across the full community, and by performing comparative operations across genome and pathway information. The software can generate a metabolic network diagram for the community, and it can overlay community omics datasets on that network diagram. PTools also provides a tool for searching for metabolic transformation routes across an organism community.
1 Introduction
The Pathway Tools (PTools) software Karp et al. (2019), Karp et al. (2020) was originally developed to facilitate functional analysis of individual genomes. The software has a range of capabilities including genome informatics, metabolic pathway informatics, regulatory informatics, omics data analysis, and comparative analysis. A typical workflow is to import a genome into PTools, compute a metabolic reconstruction, infer operons of the organism, and then apply the search, visualization, and comparative analysis tools to investigate the functional properties of the organism.
The software has been extended in recent years to support functional analysis of microbiomes (Prakash and Taylor, 2012; Krishnan et al., 2015; Sung et al., 2017; Eng and Borenstein, 2019; Visconti et al., 2019) that provides causal insights regarding the interactions of organisms within a microbiome. Whereas many microbiome-related informatics tools aim to quantify and compare properties of an overall community, PTools is more focused on enabling detailed reconstructions of community members and their interactions. For example, PTools does not perform taxonomic analysis of metagenome samples, nor does it compute case-control studies such as statistical comparison of healthy and diseased individuals.
Questions that can be addressed using the software include the following: What metabolic reactions and pathways are present in a metagenome, or in each organism in a community? How do their metabolic capabilities complement one another? What pathways are unique to a given community member? What metabolic transformations can be accomplished by the community, for example, via what metabolic route might the community convert a starting metabolite into an ending metabolite? The PTools software does perform metabolic modeling of individual microbes and of microbial communities via flux-balance analysis Latendresse et al. (2022) (see also Greenblum et al., 2013; Levy and Borenstein, 2014; Krishnan et al., 2015; Esvap and Ulgen, 2021; Heinken et al., 2021), although that topic is beyond the scope of this article.
The first step in a typical workflow is to import a set of metagenome-assembled genomes (MAGs) into PTools. Each MAG is converted to a PTools Pathway/Genome Database. A number of PTools computational inference tools are next applied to each MAG to infer its metabolic reactions and pathways, its transport reactions, and its operons. The community members are now captured within a set of PGDBs that comprehensively encode their genomes and metabolic networks.
Next the user can apply a set of search and comparative analysis tools to assess and compare the functional capabilities of community members. For example, the user can search across all community PGDBs for the presence of a gene, a metabolite, or a pathway; the software can produce comparisons of the entire metabolic networks of the community.
If meta-transcriptomics and/or meta-metabolomics data are available for the community, then PTools provides an analysis tool for visualizing such data on a multi-organism metabolic map diagram.
PTools provides a community route-search tool that requires as user inputs a set of PGDBs as well as a starting metabolite and ending metabolite. The tool generates minimal-cost metabolic routes (linear reaction paths) from the starting to the ending metabolite that show how the community might accomplish that transformation.
The remainder of the article describes these tools in more detail and illustrates their use on the Altered Schaedler Flora (ASF), a community of eight microorganisms from the mouse gut microbiome Wannemuehler et al. (2014). The ASF were selected by experimentalists as a model microbiome for their dominance and persistence in the mouse gut, and for their ability to be grown in the laboratory.
2 Methods
2.1 Importing a Microbial Community Into Pathway Tools
To import a microbial community into PTools, the metagenomic sequencing data must have been binned by a separate program into separate groups, one for each detected member of the community. Each such MAG consists of a collection of sequenced contigs covering a subset of the genome of each organism. The contigs must be annotated by a tool such as MetaPathways Konwar et al. (2013), MetaErg Dong and Strous (2019), MG-RAST Keegan et al. (2016), MEGAN Huson et al. (2016), Prokka Seemann (2014), or the National Center for Biotechnology Information (NCBI) Prokaryotic Genome Annotation Pipeline Tatusova et al. (2016), meaning that an ORF-finding program has been run on each organism, and protein function-prediction tools have been run on each identified gene to assign protein names such as “pyruvate kinase,” as well as to assign Enzyme Commission (EC) numbers (optional).
The resulting sequence data, gene locations, and protein functions can be provided as inputs to PTools in either GFF3 format or GenBank format, preferably as one file per MAG. The files can be provided within a directory structure containing one directory per genome that is processed by invoking the PathoLogic component of PTools from the command line, as described in the Pathway Tools User’s Guide SRI International (2021).
PathoLogic applies a series of processing steps to each input MAG to obtain a comprehensive PGDB for each organism. Those steps are as follows.
1. The input files are parsed.
2. The input sequence, gene locations, and annotations are converted to PGDB format. PGDBs are encoded using the Ocelot object-oriented database system. A database object is created for each replicon, each gene, and each gene product described by the input files.
3. The reactome of the organism is predicted from the annotated gene functions using a previously published algorithm Karp et al. (2011). Enzyme names and EC numbers are associated with biochemical reactions via queries to the MetaCyc metabolic database (DB) Caspi et al. (2020). Those reactions are imported into the new PGDB from MetaCyc.
4. The metabolic pathways of the organism are predicted from the predicted reactome Karp et al. (2011). For each pathway in MetaCyc the prediction algorithm considers which of its component reactions are catalyzed by an enzyme in the PGDB, and computes a score expressing the likelihood that the pathway is present. Pathways that exceed a threshold are imported into the PGDB.
5. The Transport Inference Parser Lee et al. (2008) is executed to predict the transport reactions of the organism from annotated transporter names.
6. The PTools operon predictor Romero and Karp (2004) is executed to predict the operons of the organism.
7. PathoLogic executes an automatic layout algorithm that creates an organism-specific metabolic network diagram for the organism based on its complement of pathways, metabolic reactions, and transport reactions Paley et al. (2021).
The result of this process is a community of PGDBs—one for each binned organism—describing its genome, proteome, reactome, metabolic pathways, and operons. For example, we have created PGDBs for each of the eight members of the ASF, all of which are available through the BioCyc.org website (which is powered by PTools). Enter “ASF” into the BioCyc organism selection tool to search for these databases.
We are not aware of other metagenome-analysis software that performs operon prediction or transport-reaction prediction. A number of other software tools Prakash and Taylor (2012); Huson et al. (2016) perform metabolic reaction and pathway prediction, often based on KEGG Kanehisa et al. (2021). The metabolic reconstruction approaches of KEGG and PTools differ in the following respects. They use different reference databases of pathways and reactions: as of August 2021, KEGG contained 400 metabolic pathway modules versus 2,969 metabolic pathways in the MetaCyc DB; KEGG contained 11,603 reactions versus 17,412 in MetaCyc. Thus, MetaCyc has far wider coverage of metabolism (7.4 times as many pathways, 1.5 times as many reactions). MetaCyc pathways were derived from and cite 69,000 literature citations and 9,739 textbook-equivalent pages of mini-reviews that explain the role of each pathway; KEGG contains very few citations or mini-reviews. The KEGG algorithm for reactome and pathway prediction has never been published to our knowledge, therefore its processing steps are unknown, whereas the PTools pathway prediction algorithm has been published Karp et al. (2011). KEGG does not produce organism-specific metabolic network diagrams, but it does have a series of global overview maps that span all KEGG pathways, thereby showing many pathways that are not present in a particular organism.
MAPLE Takami et al. (2016) also uses KEGG for metagenome pathway analysis. Its pathway prediction method is based on the “module completion ratio,” that is, assessing the evidence for pathway presence based solely on the fraction of reactions within a pathway that have an enzyme present. This simple method causes many false-positive predictions—particularly for larger pathway DBs such as MetaCyc—which is why we developed a more elaborate prediction method that considers factors such as pathway taxonomic range and key reactions Karp et al. (2011).
2.2 Searching Across an Organism Community
A suite of search tools enables scientists to perform basic searches across a set of microbiome-derived PGDBs, such as to determine which organisms in the community contain a given gene, protein, metabolite, or pathway. Such searches enable a researcher to quickly determine the functional roles played by different organisms in the community. In addition, more advanced searches are supported to find the organisms in the community containing genes, proteins, metabolites, or pathways matching specified conditions.
These searches are available in both the web and desktop modes of PTools, with somewhat different user interfaces available in the two modes. In web mode, the multi-organism search tools are present under the Tools
For example, Figure 1 shows the result of searching across the ASF PGDBs on BioCyc.org for all pathways whose name contains “tryptophan.” Pathway searches can also search by ontology (such as for all detoxification pathways in the organism), pathway length, substrate(s) contained within the pathways, evidence code, and publication.
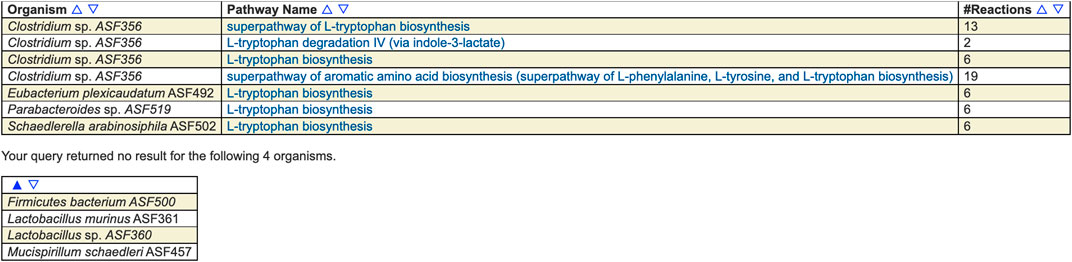
FIGURE 1. Results of searching across the ASF for pathways whose name contains “tryptophan.” Four of the organisms contain such a pathway and four do not. The pathways include biosynthesis and degradation, as well as super-pathways and base pathways.
Gene/protein searches can search by sequence length, molecular weight, genome map position, pI, evidence code, cellular location, Gene Ontology (GO) term, publication, and by protein features.
Metabolite searches can search by ontology, monoisotopic mass, molecular weight, chemical formula, SMILES Anderson et al. (1988) substructure, and InChI Stein et al. (2003).
We are not aware of other tools that provide these types of multi-MAG search capabilities.
2.3 Comparative Analysis Operations on a Microbiome
PTools provides an extensive set of comparative operations that can be run across a set of PGDBs for a microbial community. Each comparative operation generates a series of pre-defined tables. The comparative operations are available at BioCyc.org under Tools
• Organism comparison
• Table 1: Database Summary Statistics (example in Figure 2)
• Table 2: Phenotype Metadata
• Table 3: Collection Metadata
• Table 4: Annotation Metadata
• Reaction comparison
• Table 1: Breakdown of Reactions by Type
• Table 2: Reactions of Small Molecule Metabolism (SMM)
• Table 3: Breakdown of SMM Reactions by Top-Level EC Category (example in Figure 3)
• Table 4: Distribution of Isozymes across SMM Reactions
• Table 5: Shared Reactions
• Table 6: Unique Reactions
• Pathway comparison
• Table 1: Breakdown of Pathways by Pathway Class (example in Figure 4)
• Table 2: Shared Pathways (example in Figure 5)
• Table 3: Unique Pathways (example in Figure 5)
• Table 4: Pathway Holes
• Metabolite comparison
• Table 1: All Compounds
• Table 2: Shared Compounds
• Table 3: Unique Compounds
• Table 4: Statistics on the Frequency with which Different Compounds Appear in Different Metabolic Roles
• Gene/protein comparison
• Table 1: Selected Gene/Protein Statistics
• Table 2: Gene Annotation
• Table 3: Frequency Distribution of Heteromultimers by Number of Unique Gene Products
• Table 4: Enzymes
• Table 5: Multifunctional Enzymes
• Table 6: Gene Ontology
• Transporter comparison
• Table 1: Transporters (example in Figure 6)
• Table 2: Substrate Uptake (example in Figure 6)
• Table 3: Substrate Efflux
• Table 4: Multiple Transporters and Substrates
• Table 5: Transcription
• Transcription unit and regulation comparison
• Table 1: Number of Genes per Transcription Unit
• Table 2: Number of Operons per Pathway
• Table 3: Regulation
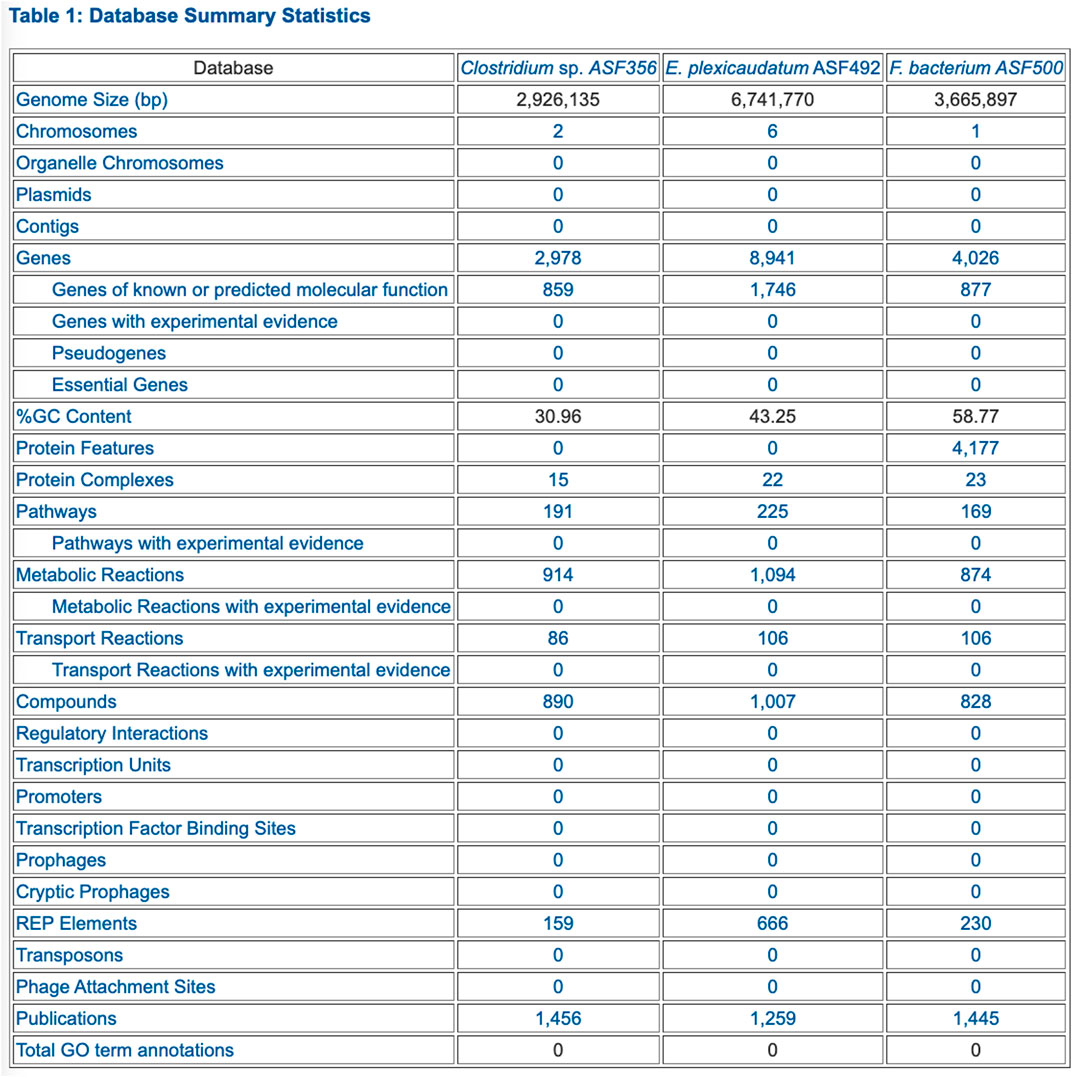
FIGURE 2. PTools generated table that summarizes database contents for three selected ASF organisms.
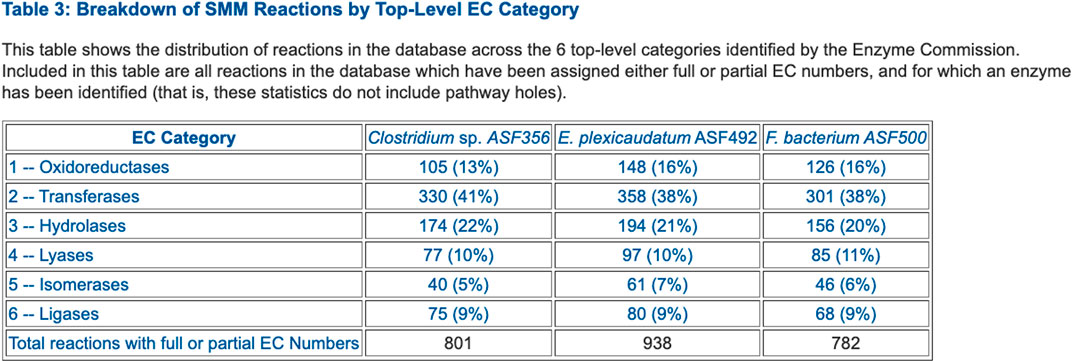
FIGURE 3. Table that summarizes the number of enzymes in each Enzyme Commission top-level category for selected ASF organisms.
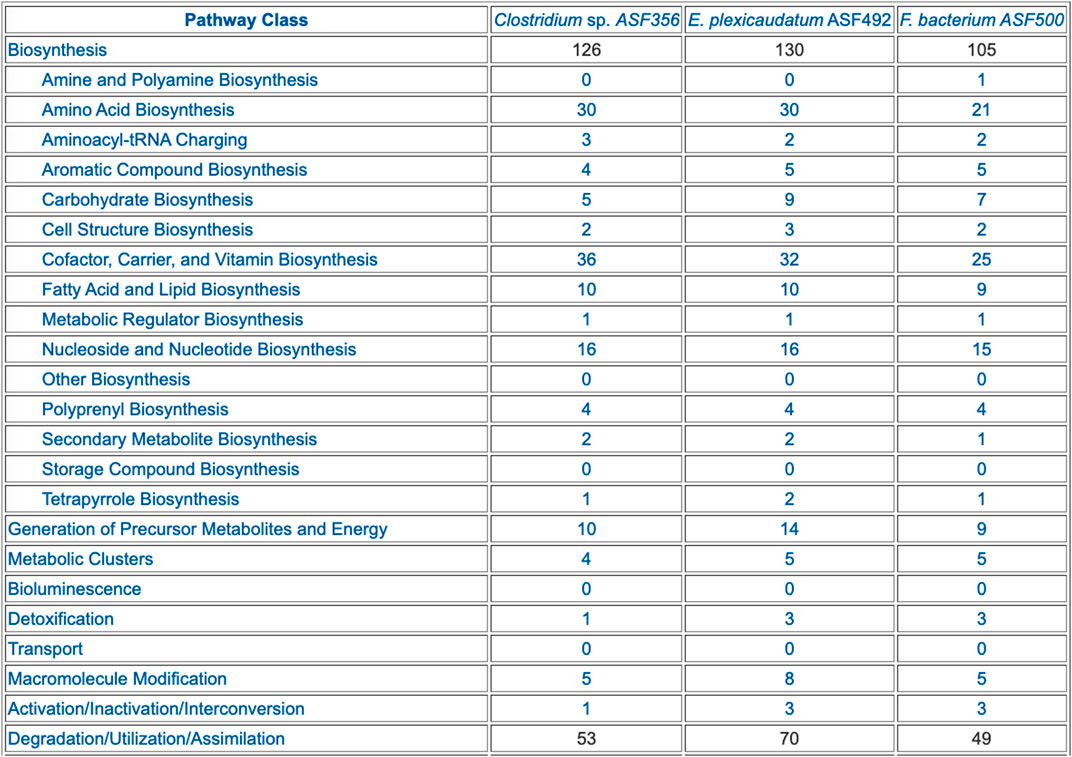
FIGURE 4. Table summarizing the pathway composition of selected ASF organisms, organized by the MetaCyc pathway ontology. The table is truncated for space considerations.
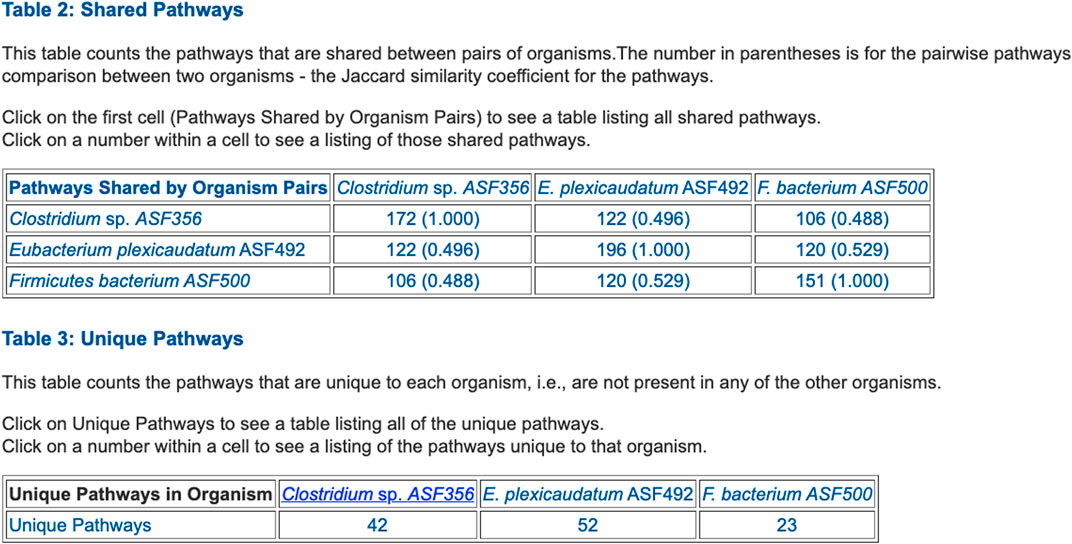
FIGURE 5. Table summarizing the number of metabolic pathways shared between pairs of selected ASF organisms, and the number of pathways unique to each of the three organisms.
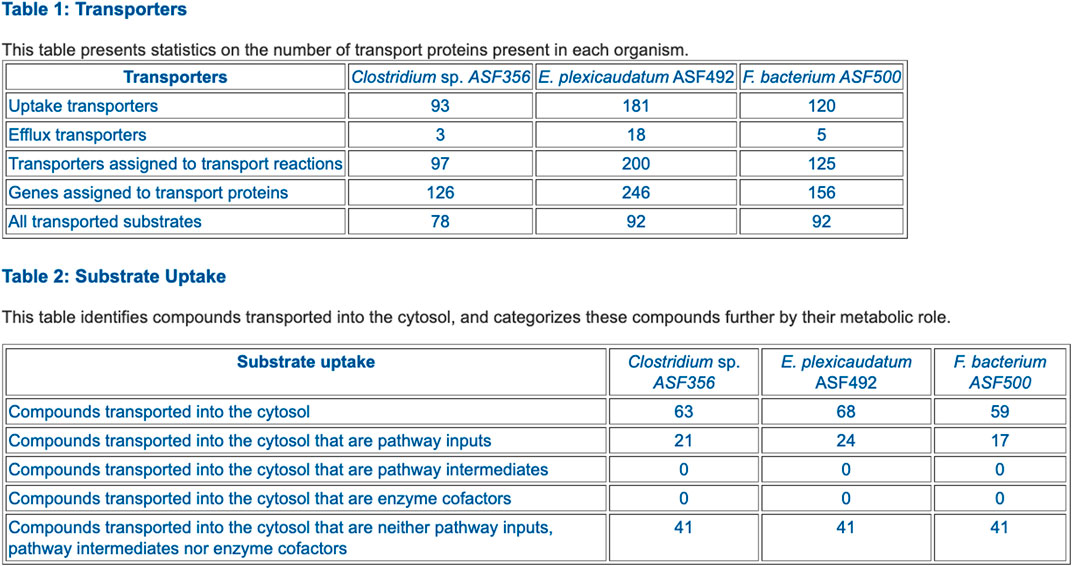
FIGURE 6. Table comparing the transporter complements of selected ASF organisms.
The preceding tables are computationally generated such that clicking hyperlinks within the tables will produce a new table with an expanded level of information. For example, clicking on the row name “Amino Acid Biosynthesis” in Figure 4 will generate the table shown in Figure 7, which shows the biosynthetic pathways present in each organism for each amino acid.
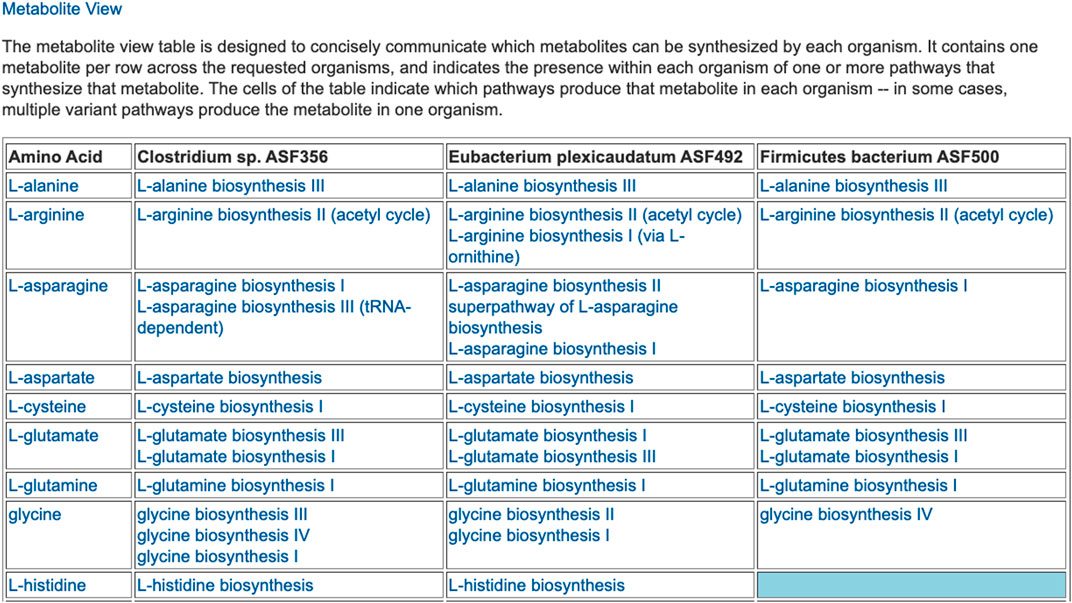
FIGURE 7. For each of three selected ASF organisms, this figure lists the biosynthetic pathways it contains for each amino acid. Multiple variants of amino-acid biosynthetic pathways are often known, as designated with roman numerals. The blue cell indicates that Firmicutes bacterium ASF500 does not contain a pathway for biosynthesis of L-histidine. The table is truncated for space considerations.
A number of other tools (e.g., MEGAN) present summaries of pathway abundances across different metagenome samples. In contrast, PTools reports differences in pathway compositions of different MAGs; we are not aware of other tools that perform such comparisons.
2.4 Analysis of Meta-Transcriptomics and Meta-Metabolomics Data
In a PGDB for a single organism, the PTools-generated cellular overview diagram provides a visual summary of all the metabolic and transport capabilities of the organism. A rectangular outer border represents the cell membrane. For Gram-negative bacteria, this consists of a double membrane with an intervening periplasmic space. Transporters and other membrane proteins are drawn on the appropriate membrane. Within the interior, representing the cytosol, metabolic pathways are shown to the left, and a grid containing all reactions not assigned to any pathway appears to the right. Within the pathway section, pathways are organized according to the MetaCyc pathway ontology, with biosynthetic pathways to the left, energy metabolism pathways in the middle, and catabolic pathways to the right. These sections are further subdivided into functionally-based blocks. For example, within the biosynthetic section are separate blocks for Carbohydrate Biosynthesis and Secondary Metabolite Biosynthesis. Pathways generally flow downwards, and connections between pathways are mostly omitted. As the user zooms in on the diagram, more detail is shown. At the highest level of detail, pathway, metabolite, enzyme and gene names all become visible. Users can overlay omics data for an organism onto the cellular overview diagram to visualize experimental results in a metabolic context Paley et al. (2021).
For a community of organisms, the user can create a community overview diagram (within the desktop version of PTools only) that condenses and combines the overview diagrams from multiple organisms into a grid, forming a single large diagram. While initially shown at a low level of detail, users can interrogate the diagram via mouse-overs, zoom in to show more detail, or apply a range of highlight operations. Meta-transcriptomics or meta-metabolomics data can then be mapped onto this community overview diagram to visualize how experimental conditions affect the metabolism of the entire community. Omics data are supplied as a set of tab-delimited files, one per organism in the community, each with the first column containing gene or metabolite identifiers, and a single numeric data column (any additional columns in the file will be ignored), which can contain either absolute data (e.g., counts, intensities, concentrations) or relative data (e.g., ratios or log ratios of two experimental conditions or experiment vs. control).
Figure 8 shows a community overview diagram consisting of four organisms from the ASF microbial community overlaid with an example transcriptomics dataset. To identify the metabolic pathways that showed differential activity in response to altered gut environmental conditions, we conducted global transcriptome analysis (RNA-seq) of the ASF community recovered directly from wild type mice (129Sv6 background) along with IL-10−/− knockout mice on the same genetic background. IL-10 is a well-characterized immunomodulatory cytokine and IL-10−/− knockout conventional (i.e., complex microbiota) mice are known to exhibit an altered microbiota composition Overstreet et al. (2021). Figure 8 shows the functional changes in the microbiome as the ASF responded to the altered immune status of the host as determined by identifying differentially expressed genes associated with specific metabolic pathways. The transcriptome dataset used for this analysis was generated by DeSeq2 Love et al. (2014).
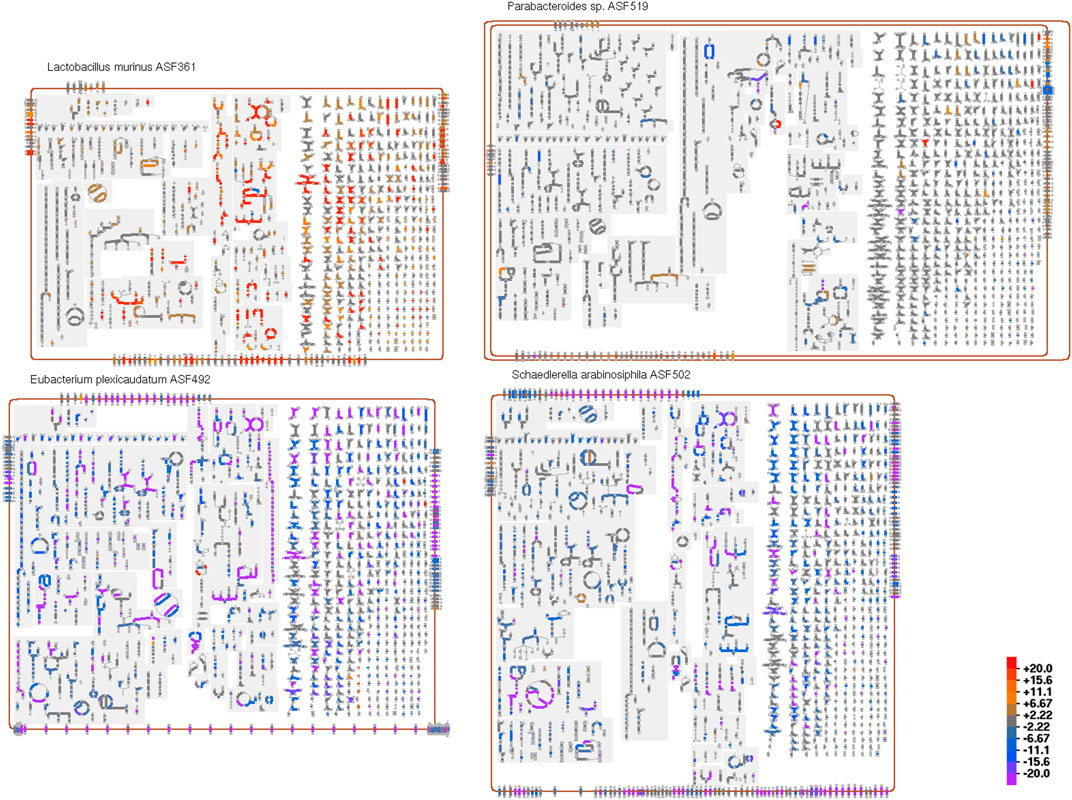
FIGURE 8. A community overview diagram for four of the bacterial species that make up the Altered Schaedler Flora model gut microbiome, overlaid with data from an example transcriptomics dataset. Reactions colored orange or red indicate genes with increased expression levels, whereas reactions colored blue or purple indicate genes with reduced expression levels.
In addition to visually drawing attention to particular metabolic reactions and pathways that undergo significant change, organism-wide effects also become apparent. For example, in this dataset we immediately notice that the metabolism of one organism, Ligilactobacillus murinus (i.e., Lactobacillus murinus) is generally increased (red/orange reactions), with the increases concentrated in certain pathway classes; the metabolism of two other organisms, Eubacterium plexicaudatum and Schaedlerella arabinosiphila, generally decreases (blue/purple). Mousing over any reaction will show a tooltip that includes the omics data values for all genes associated with that reaction. The user can zoom in on the diagram for a more detailed view of regions of interest.
We are not aware of other tools that can display metabolic network diagrams from multiple organisms simultaneously and paint these diagrams with meta-omics data.
2.5 Community Metabolic Route Search
Single-organism metabolic route search enables the discovery of the most optimal series of reactions (called routes), that will transform a starting compound into a goal compound, within the organism’s reaction network. Optimal means that the reaction series has the lowest cost. The cost of a route is computed by a weighted combination of atom conservation, route length in terms of sequential reactions, and other parameters. To compute the number of conserved atoms, our RouteSearch algorithm Latendresse et al. (2014) uses pre-computed atom mappings Latendresse et al. (2012) of reactions that are available in MetaCyc. An atom mapping of a reaction gives a one-to-one correspondence of each non-hydrogen atom, from reactants to products. The more atoms are conserved, the more efficient the transformation from start to goal becomes, thus resulting in a lower cost.
The Multi-Organism RouteSearch (MORS) algorithm Krummenacker et al. (2019) is a recent extension of single-organism RouteSearch that enables route discovery across arbitrary sets of organisms, simultaneously searching across the union of reactions in their PGDBs. MORS enables dissecting the metabolic contributions originating from specific organisms, within the overall transformation performed by the microbial community. A typical use case is searching HumanCyc as well as the organisms in a microbiome body site, such as the gastrointestinal-tract, to investigate how a combination of organisms might synthesize a compound that is toxic to the host organism. To perform MORS searches at BioCyc.org, invoke Tools
The MORS algorithm requires an additional input beyond the inputs to RouteSearch, namely the set of PGDBs to be searched. The reaction network searched by MORS will be the union of all reactions from that organism set. Additionally, the user may alter a new MORS parameter, the cost for “organism switching.” A switch occurs when the two organism sets of two consecutive reactions in a route have no overlap. In other words, if the first reaction is known to occur in one set of organisms and the second reaction is occurring in a different organism set, but there is no organism that contains both reactions simultaneously, then the route must switch organisms by transferring the compound connecting both reactions from one organism to another (by unspecified transport mechanisms). Each discovered route is displayed horizontally across the web page, with the start compound on the left and the goal compound on the right. An organism switch is depicted in a route by a red vertical line. A SmartTable of the route can be generated, which lists the organism sets that provide the enzymes that catalyze each reaction along the route.
As an example, let us use BioCyc.org to examine how dietary L-tyrosine is transformed into toxic 4-methylphenyl sulfate, which is a protein fermentation product that has been modified in the liver and is implicated in kidney disease. As it is known that this toxin originates from L-tyrosine Selmer and Andrei (2001), the MORS start compound was set to L-tyrosine and the goal compound to 4-methylphenyl sulfate. We selected all organisms in the human microbiome body site called “gastrointestinal-tract” plus Homo sapiens. The total count of organisms was 553. The resulting top three routes are shown in Figure 9. All routes retain eight atoms. The first route consists of two reactions, and the other two routes consist of four reactions. The first route does not need an organism switch, because one microbe was found that can perform both reactions of this route. In the other two routes, the last reaction after the organism switch is found only in Homo sapiens. However, the reaction immediately before the switch occurs in 26 organisms in both routes. The third route found a different choice for the first reaction, which incurs the cost of an additional organism switch.
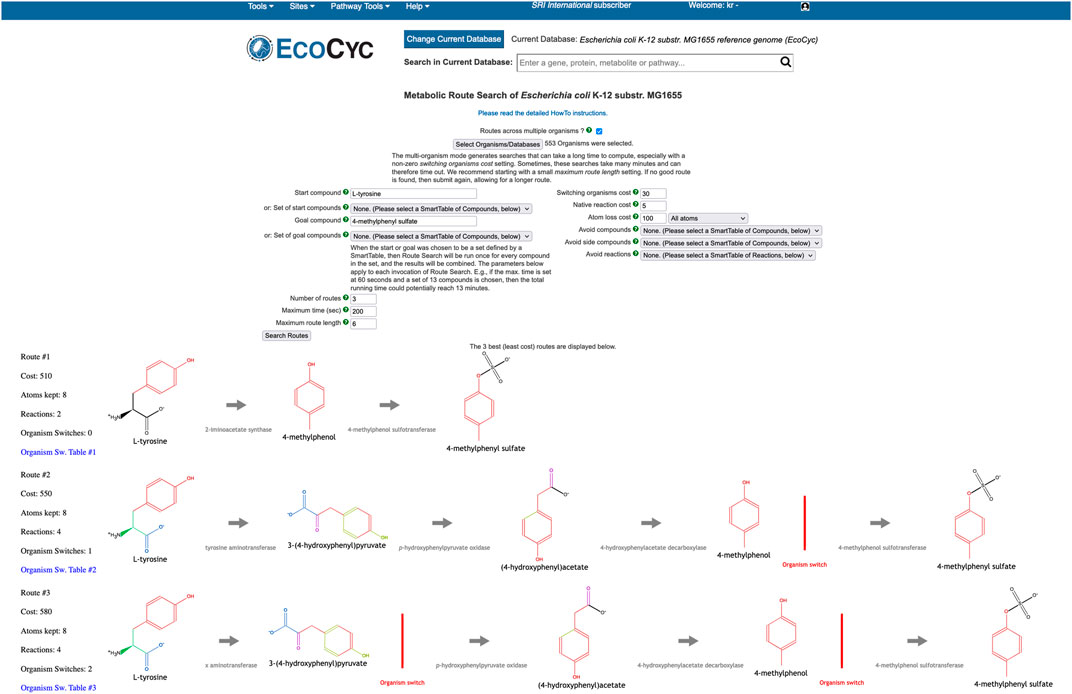
FIGURE 9. MORS computed routes from L-tyrosine to 4-methylphenyl sulfate.
We are not aware of other tools that can perform multi-organism metabolic route search.
Data Availability Statement
Publicly available datasets were analyzed in this study. This data can be found here: biocyc.org.
Author Contributions
PK supervised the work and authored much of the article. SP implemented the community search tools, the community overview and omics analysis tools, and some of the comparative analysis tools, and authored a portion of the manuscript. MK worked on the implementation of Multi-Organism Route Search and wrote the corresponding article section. AK worked on comparative analysis operations. GP and MW contributed data for analysis; GP contributed to manuscript revision.
Funding
Research reported in this publication was supported by the National Institute of General Medical Sciences of the National Institutes of Health (NIH) under award number R01GM080746 PK, by the National Institute of Allergy and Infectious Diseases of the NIH under award number R01AI160719 to PK; and by NIH/NCI grant R03 CA195305 and the DOD-Defense Threat Reduction Agency (DTRA) award HDTRA12110015 to GP.
Conflict of Interest
The authors declare that the research was conducted in the absence of any commercial or financial relationships that could be construed as a potential conflict of interest.
Publisher’s Note
All claims expressed in this article are solely those of the authors and do not necessarily represent those of their affiliated organizations, or those of the publisher, the editors and the reviewers. Any product that may be evaluated in this article, or claim that may be made by its manufacturer, is not guaranteed or endorsed by the publisher.
Acknowledgments
We thank Lawrance Chandra for his contributions.
References
Anderson, E., Veith, G. D., and Weininger, D. (1988). Smiles: A Chemical Language and Information System. J. Chem. Inf. Comput. Sci. 28, 31–36.
Caspi, R., Billington, R., Keseler, I. M., Kothari, A., Krummenacker, M., Midford, P. E., et al. (2020). The MetaCyc Database of Metabolic Pathways and Enzymes - a 2019 Update. Nucleic Acids Res. 48, D445–D453. doi:10.1093/nar/gkz862
Dong, X., and Strous, M. (2019). An Integrated Pipeline for Annotation and Visualization of Metagenomic Contigs. Front. Genet. 10, 999. doi:10.3389/fgene.2019.00999
Eng, A., and Borenstein, E. (2019). Microbial Community Design: Methods, Applications, and Opportunities. Curr. Opin. Biotechnol. 58, 117–128. doi:10.1016/j.copbio.2019.03.002
Esvap, E., and Ulgen, K. O. (2021). Advances in Genome-Scale Metabolic Modeling toward Microbial Community Analysis of the Human Microbiome. ACS Synth. Biol. 10, 2121–2137. doi:10.1021/acssynbio.1c00140
Greenblum, S., Chiu, H. C., Levy, R., Carr, R., and Borenstein, E. (2013). Towards a Predictive Systems-Level Model of the Human Microbiome: Progress, Challenges, and Opportunities. Curr. Opin. Biotechnol. 24, 810–820. doi:10.1016/j.copbio.2013.04.001
Heinken, A., Basile, A., Hertel, J., Thinnes, C., and Thiele, I. (2021). Genome-scale Metabolic Modeling of the Human Microbiome in the Era of Personalized Medicine. Annu. Rev. Microbiol. 75, 199–222. doi:10.1146/annurev-micro-060221-012134
Huson, D. H., Beier, S., Flade, I., Górska, A., El-Hadidi, M., Mitra, S., et al. (2016). MEGAN Community Edition - Interactive Exploration and Analysis of Large-Scale Microbiome Sequencing Data. Plos Comput. Biol. 12, e1004957. doi:10.1371/journal.pcbi.1004957
Kanehisa, M., Furumichi, M., Sato, Y., Ishiguro-Watanabe, M., and Tanabe, M. (2021). KEGG: Integrating Viruses and Cellular Organisms. Nucleic Acids Res. 49, D545–D551. doi:10.1093/nar/gkaa970
Karp, P. D., Latendresse, M., and Caspi, R. (2011). The Pathway Tools Pathway Prediction Algorithm. Stand. Genomic Sci. 5, 424–429. doi:10.4056/sigs.1794338
Karp, P. D., Midford, P. E., Billington, R., Kothari, A., Krummenacker, M., Latendresse, M., et al. (2019). Pathway Tools Version 23.0 Update: Software for Pathway/genome Informatics and Systems Biology. Brief Bioinform 22, 109–126. https://academic.oup.com/bib/article-abstract/22/1/109/5669859?redirectedFrom=fulltext. doi:10.1093/bib/bbz104
Karp, P. D., Midford, P., Paley, S., Krummenacker, M., Billington, R., Kothari, A., et al. (2020). Pathway Tools Version 24.0: Integrated Software for Pathway/genome Informatics and Systems Biology. [v4]. arXiv , 1–98. http://arxiv.org/abs/1510.03964v4.
Keegan, K. P., Glass, E. M., and Meyer, F. (2016). MG-RAST, a Metagenomics Service for Analysis of Microbial Community Structure and Function. Methods Mol. Biol. 1399, 207–233. doi:10.1007/978-1-4939-3369-3_13
Konwar, K. M., Hanson, N. W., Pagé, A. P., and Hallam, S. J. (2013). MetaPathways: a Modular Pipeline for Constructing Pathway/genome Databases from Environmental Sequence Information. BMC Bioinformatics 14, 202. doi:10.1186/1471-2105-14-202
Krishnan, S., Alden, N., and Lee, K. (2015). Pathways and Functions of Gut Microbiota Metabolism Impacting Host Physiology. Curr. Opin. Biotechnol. 36, 137–145. doi:10.1016/j.copbio.2015.08.015
Krummenacker, M., Latendresse, M., and Karp, P. D. (2019). Metabolic Route Computation in Organism Communities. Microbiome 7, 89–96. doi:10.1186/s40168-019-0706-6
Latendresse, M., Krummenacker, M., and Karp, P. D. (2014). Optimal Metabolic Route Search Based on Atom Mappings. Bioinformatics 30, 2043–2050. doi:10.1093/bioinformatics/btu150
Latendresse, M., Ong, W. K., and Karp, P. D. (2022). Metabolic Modeling with MetaFlux. Methods Mol. Biol. 2349, 259–289. doi:10.1007/978-1-0716-1585-0_12
Latendresse, M., Malerich, J., Travers, M., and Karp, P. D. (2012). Accurate Atom-Mapping Computation for Biochemical Reactions. J. Chem. Inf. Model. 52 (11), 2970–2982. doi:10.1021/ci3002217
Lee, T. J., Paulsen, I., and Karp, P. (2008). Annotation-based Inference of Transporter Function. Bioinformatics 24, i259–67. http://bioinformatics.oxfordjournals.org/cgi/content/full/24/13/i259. doi:10.1093/bioinformatics/btn180
Levy, R., and Borenstein, E. (2014). Metagenomic Systems Biology and Metabolic Modeling of the Human Microbiome: from Species Composition to Community Assembly Rules. Gut Microbes 5, 265–270. doi:10.4161/gmic.28261
Love, M. I., Huber, W., and Anders, S. (2014). Moderated Estimation of Fold Change and Dispersion for RNA-Seq Data with DESeq2. Genome Biol. 15, 550. doi:10.1186/s13059-014-0550-8
Overstreet, A. C., Ramer-Tait, A. E., Suchodolski, J. S., Hostetter, J. M., Wang, C., Jergens, A. E., et al. (2020). Temporal Dynamics of Chronic Inflammation on the Cecal Microbiota in IL-10-/- Mice. Front. Immunol. 11, 585431. doi:10.3389/fimmu.2020.585431
Paley, S., Billington, R., Herson, J., Krummenacker, M., and Karp, P. D. (2021). Pathway Tools Visualization of Organism-Scale Metabolic Networks. Metabolites 11, 64. doi:10.3390/metabo11020064
Prakash, T., and Taylor, T. D. (2012). Functional Assignment of Metagenomic Data: Challenges and Applications. Brief Bioinform 13, 711–727. doi:10.1093/bib/bbs033
Romero, P. R., and Karp, P. D. (2004). Using Functional and Organizational Information to Improve Genome-wide Computational Prediction of Transcription Units on Pathway-Genome Databases. Bioinformatics 20, 709–717. doi:10.1093/bioinformatics/btg471
Seemann, T. (2014). Prokka: Rapid Prokaryotic Genome Annotation. Bioinformatics 30 (14), 2068–2069. doi:10.1093/bioinformatics/btu153
Selmer, T., and Andrei, P. I. (2001). p-Hydroxyphenylacetate Decarboxylase from Clostridium difficile. A Novel Glycyl Radical Enzyme Catalysing the Formation of P-Cresol. Eur. J. Biochem. 268, 1363–1372. doi:10.1046/j.1432-1327.2001.02001.x
SRI International (2021). Pathway Tools User’s Guide Version 25.5. Available from SRI International.
Stein, S. E., Heller, S. R., and Tchekhovskoi, D. (2003). “An Open Standard for Chemical Structure Representation: The IUPAC Chemical Identifier,” in Proc. 2003 International Chemical Information Conference (Nimes), 131–143.
Sung, J., Kim, S., Cabatbat, J. J. T., Jang, S., Jin, Y. S., Jung, G. Y., et al. (2017). Global Metabolic Interaction Network of the Human Gut Microbiota for Context-specific Community-Scale Analysis. Nat. Commun. 8, 15393. doi:10.1038/ncomms15393
Takami, H., Taniguchi, T., Arai, W., Takemoto, K., Moriya, Y., and Goto, S. (2016). An Automated System for Evaluation of the Potential Functionome: MAPLE Version 2.1.0. DNA Res. 23, 467–475. doi:10.1093/dnares/dsw030
Tatusova, T., DiCuccio, M., Badretdin, A., Chetvernin, V., Nawrocki, E. P., Zaslavsky, L., et al. (2016). NCBI Prokaryotic Genome Annotation Pipeline. Nucleic Acids Res. 44, 6614–6624. doi:10.1093/nar/gkw569
Visconti, A., Le Roy, C. I., Rosa, F., Rossi, N., Martin, T. C., Mohney, R. P., et al. (2019). Interplay between the Human Gut Microbiome and Host Metabolism. Nat. Commun. 10, 4505. doi:10.1038/s41467-019-12476-z
Keywords: microbiome, data management, genome database, metabolic pathways, metabolic routes
Citation: Karp PD, Paley S, Krummenacker M, Kothari A, Wannemuehler MJ and Phillips GJ (2022) Pathway Tools Management of Pathway/Genome Data for Microbial Communities. Front. Bioinform. 2:869150. doi: 10.3389/fbinf.2022.869150
Received: 03 February 2022; Accepted: 05 April 2022;
Published: 26 April 2022.
Edited by:
Nikos Kyrpides, Joint Genome Institute, United StatesReviewed by:
Kazuhiro Takemoto, Kyushu Institute of Technology, JapanNatalia Ivanova, Berkeley Lab (DOE), United States
Copyright © 2022 Karp, Paley, Krummenacker, Kothari, Wannemuehler and Phillips. This is an open-access article distributed under the terms of the Creative Commons Attribution License (CC BY). The use, distribution or reproduction in other forums is permitted, provided the original author(s) and the copyright owner(s) are credited and that the original publication in this journal is cited, in accordance with accepted academic practice. No use, distribution or reproduction is permitted which does not comply with these terms.
*Correspondence: Peter D. Karp, pkarp@ai.sri.com