Quantum-Inspired Moth-Flame Optimizer With Enhanced Local Search Strategy for Cluster Analysis
 Xinrong Cui
 Qifang Luo1,2*
  Yongquan Zhou
 Wu Deng
 Shihong Yin
- 1College of Artificial Intelligence, Guangxi University for Nationalities, Nanning, China
- 2Guangxi Key Laboratories of Hybrid Computation and IC Design Analysis, Nanning, China
- 3Xiangsihu College of Gunagxi University for Nationalities, Nanning, China
- 4College of Electronic Information and Automation, Civil Aviation University of China, Tianjin, China
Clustering is an unsupervised learning technique widely used in the field of data mining and analysis. Clustering encompasses many specific methods, among which the K-means algorithm maintains the predominance of popularity with respect to its simplicity and efficiency. However, its efficiency is significantly influenced by the initial solution and it is susceptible to being stuck in a local optimum. To eliminate these deficiencies of K-means, this paper proposes a quantum-inspired moth-flame optimizer with an enhanced local search strategy (QLSMFO). Firstly, quantum double-chain encoding and quantum revolving gates are introduced in the initial phase of the algorithm, which can enrich the population diversity and efficiently improve the exploration ability. Second, an improved local search strategy on the basis of the Shuffled Frog Leaping Algorithm (SFLA) is implemented to boost the exploitation capability of the standard MFO. Finally, the poor solutions are updated using Levy flight to obtain a faster convergence rate. Ten well-known UCI benchmark test datasets dedicated to clustering are selected for testing the efficiency of QLSMFO algorithms and compared with the K-means and ten currently popular swarm intelligence algorithms. Meanwhile, the Wilcoxon rank-sum test and Friedman test are utilized to evaluate the effect of QLSMFO. The simulation experimental results demonstrate that QLSMFO significantly outperforms other algorithms with respect to precision, convergence speed, and stability.
1 Introduction
Clustering is the process of grouping objects into clusters according to the similarities within the data objects (Jain et al., 1999). Cluster analysis (Jain, 2010) does not need to refer to any classification information beforehand and can classify data by judging the similarity of data features. So, clustering belongs to unsupervised learning in machine learning (Sinaga and Yang, 2020). It is widely used in customer classification (Deng and Gao, 2020; Li et al., 2021a; Sun et al., 2021), automatic medical image detection (Hassan et al., 2021), image retrieval (Karthikeyan and Aruna, 2013; Gu et al., 2019; Anju and Shreelekshmi, 2022), object recognition (Woźniak and Połap, 2018), data mining (Hosseini et al., 2010), (Sato et al., 2019), pattern recognition (Xu et al., 2022), (Singh and Ganie, 2021), and other fields.
There are four taxonomic methods applied to cluster analysis: partition-based, hierarchical, grid-based, and density-based methods. K-means is a partition-based method that is widely welcomed owing to its simple calculation steps and easy implementation. However, the clustering effect obtained by the K-means is easily influenced by the preliminary location of the centroids and is vulnerable to the risk of slipping into a local optimum as the algorithm proceeds. There are two solutions to optimization problems, one is deterministic and the other is non-deterministic. Real-life engineering optimization problems have the characteristics of complexity, large-scale, nonlinearity, multiple constraints, and high dimensionality. However, deterministic methods can often not effectively calculate the correct results for such optimization problems. Therefore, it is an urgent matter to find efficient ways to solve optimization problems. Researchers have used non-deterministic algorithms, also known as stochastic optimization algorithms, to achieve excellent results in solving certain real-world complex optimization problems over the last decades. Meta-heuristic intelligent optimization algorithms fall under the category of stochastic algorithms, and researchers have successively proposed many intelligent optimization algorithms, which have become a very popular and feasible solution in dealing with complex problems. Classical metaheuristic algorithms that have been widely used include differential evolution (DE) (Storn and Price, 1997), grey wolf optimizer (GWO) (Mirjalili et al., 2014), particle swarm optimization (PSO) (Kennedy and Eberhart, 1995) and Monarch butterfly optimization (MBO) (Wang et al., 2019), etc. Many researchers have made a variety of meaningful improvements to promote the performance of the algorithm, such as Wei et al. (2021) proposed an improved slime mold algorithm with oscillating factor and Levy flight strategy for optimal reactive power dispatch problem. Wang and Tan (2017) proposed a method based on the information feedback model to improve the performance of the heuristic algorithm. Wang et al. (2014) introduced chaos theory into the optimization process of the krill herd (HK) algorithm, and the algorithm’s performance was effectively improved. Gao et al. (2020) used an improved DE algorithm with a selection mechanism to solve the fuzzy job-shop scheduling problem. Merwe and Engelbrecht successfully combined the PSO to address the clustering problem by constructing the structure of the evaluation function and the solution (Van der Merwe and Engelbrecht, 2003). Wang et al. (2016) improved the precision and convergence rate of the flower pollination algorithm on cluster analysis by adding the discard pollen operator. Zhou et al. (2017) propose an improved social spider optimization algorithm that introduces a stochastic strategy known as the simplex method to deal with clustering analysis. A symbiotic biological search algorithm for clustering analysis has been proposed by Zhou et al. (2019). Ouadfel and Abd Elaziz (2021) introduced an improved multi-objective gradient optimizer to handle the clustering problem of multi-view datasets. Taib and Bahreininejad (2021) introduced an improved water cycle algorithm incorporating an algorithm for evaporation rate to tackle the clustering analysis problem. Wang et al. (2021) implemented a meme algorithm with adaptive inverse K-means operation to tackle the clustering question.
The Moth-flame Optimizer (MFO) (Mirjalili, 2015a) is a firmly established meta-heuristic optimization algorithm that has proven to be efficient and potentially capable of addressing real-life problems. After MFO was put forward, many scholars applied it to various engineering problems and achieved good results. Elsakaan et al. (2018) applied a moth flame optimizer to solving economic scheduling problems. Elaziz et al. (2020) introduced an OMFODE algorithm that integrates opposition learning strategy and differential evolution algorithm for the feature selection problem. Moreover, the classification of galaxy images is successfully implemented with satisfactory results. Khan et al. (2021) used MFO to optimize the integrated power plant system containing stochastic wind. Ahmed et al. (2021) applied MFO to optimizing workflow scheduling in fog computing. Li et al. (2021b) used opposition-based learning (OBL) and differential evolution (DE) algorithm to improve the quality of the flame population to enhance the efficiency of the standard MFO. Wu et al. (2022) construct a bi-clustering-based moth-flame optimizer for recommender systems to successfully generate recommendation lists and predict unrated items for target users.
Quantum computing (QC) integrates concepts from three disciplines: quantum physics, computer science, and classical information theory (Steane, 1998). At present, more and more researchers combine quantum computing with heuristic algorithms and try to apply them in various fields. Han and Kim (2002) were the earliest to combine QC with evolutionary algorithms to solve combinatorial optimization problems. Layeb (2011) applied a cuckoo search algorithm combined with quantum-inspired for knapsack issues. Cai et al. introduced the simulated annealing (SA) strategy and the quantum revolving gate (QRG) strategy into the moth flame optimizer to improve the local development and exploration capabilities. It has achieved good results in benchmark test functions and engineering applications and has been verified in feature selection issues (Yu et al., 2020). The idea of introducing QRG and water circulation (WC) mechanisms in SMA was given by Cai et al. (Yu et al., 2021). Chen et al. (2020) introduced a hybrid algorithm with the combination of K-means and quantum behavior inspired by Ant Lion Optimized for data clustering and successfully applied it to intrusion detection. Deng et al. (2021) introduced quantum double-chain coding technology and quantum revolving gate into differential evolution algorithm and combined mutation strategy to further improve large-scale complex problems. The latest study by Dahi and Alba (2022) applied quantum-inspired metaheuristics to solve the Mobility Management Problem (MMP) and provides a new vision of quantum-inspired metaheuristics in conjunction with a comprehensive analysis of the quantum hardware.
In summary, this paper proposes a quantum-inspired moth-flame optimizer with enhanced local search capability (QLSMFO). The proposed algorithm combines quantum computing and the moth-flame optimizer. Quantum coding and quantum revolving gates are introduced in the initial period of the algorithm to enrich the swarm diversity as well as boost the global search capability. Then, a modified local search strategy is introduced to reinforce the mining capability. Finally, the poor solutions of the quantum moth population are selected to be updated by the Levy flight method to generate more promising solutions. The contribution of this study is primarily as follows:
(1) Quantum coding is introduced for moth swarm to enrich population diversity and further promote a more robust global search capability.
(2) The quantum revolving gate primarily balances the exploration and exploitation capabilities while guiding moths to more promising solutions and preventing them from falling into local optima.
(3) By adding an enhanced local search to improve the exploit capability and enhance the mining accuracy, moths can evade the local optimum in various ways.
(4) The proposed QLSMFO is used to solve the cluster analysis problem and has good clustering results on ten well-known UCI datasets.
The rest of this study is structured as outlined below. Section 2 fully elaborates on the problem of cluster analysis. An overview of the standard MFO algorithm in Section 3. Section 4 illustrates the specific improvement strategies of the QLSMFO. Section 5 carries out simulation experiments and analysis of results. Finally, conclusions and future work are available in Section 6.
2 Clustering Problem
2.1 Mathematical Definition
Clustering is characterized as unsupervised learning due to the absence of labeling or grouping information for each data instance. The K-Means algorithm is a classical unsupervised clustering method, which was introduced by MacQueen (1967) and has been widely used since it was proposed. To clearly illustrate the clustering problem, suppose dataset D is classified into k different clusters. There is n datum in dataset D, and each datum has l attributes. So, dataset D can be expressed as
(1)
(2)
(3)
2.2 Clustering Criteria
Dataset D is grouped into k clusters, where each cluster
where l indicates the number of attributes for each data,
2.3 The Objective Function of Clustering
This paper presents the QLSMFO algorithm to settle the cluster analysis problem. With the aim of clearly describing the evaluation process, suppose there is a dataset
where D refers to the given dataset, and C is the set of cluster centers.
3 Moth-Flame Optimizer
3.1 Inspiration
The MFO is inspired by the phenomenon of moth jumping on fire. The reason behind this phenomenon is a navigation method called transverse orientation of moths in nature. Moths flying at a constant angle to the moonlight are able to fly in a straight line and at the shortest distance to save energy. However, artificial light at night is troublesome for them. The light emitted from an artificial light source is a ray centered on the light source. If the moths still fly at a fixed angle to the light, they will fly to the center of the light source in a spiral trajectory.
3.2 Mathematical Model
The MFO algorithm establishes a mathematical model for the spiral flight of moths around flames. Moths and flames represent candidate solvers within the search space. But their location is updated in a different way. The moths' population is described by a matrix M. A one-dimensional array OM was used to store the fitness values calculated for all the moths. As shown below.
where d refers to the problem dimension, n denotes the size of the moth swarm.
The definition of the flame is another critical part, using a matrix F which stores information about the position of the flame. The values of the objective function corresponding to all flames are recorded in a one-dimensional array OF as shown in Eq. 4:
The spiral trajectory of the moth flying around the flame is described by a mathematical model expressed by Eq. 5:
where
where b determines the spiral shape and is set to 1, t indicates a random number between [r, 1]. In addition, r denotes a linearly decreasing function with a change interval of the value domain from −1 to −2. The function is shown below:
where it denotes the current generation, Max_it denotes the largest number of generations.
The position of the flame is obtained by the moths ordered in accordance with the fitness value, then the individual moth regenerates its location in accordance with the respective flame using Eq. 6. Although this position update mechanism expands the search space and enhances exploration, all moths may have difficulty finding optimal solutions based on their respective flame update positions. To overcome this deficiency, a scheme for adaptively changing the number of flames is suggested and updated using Eq. 9:
where N represents the maximal size of the flames swarm.
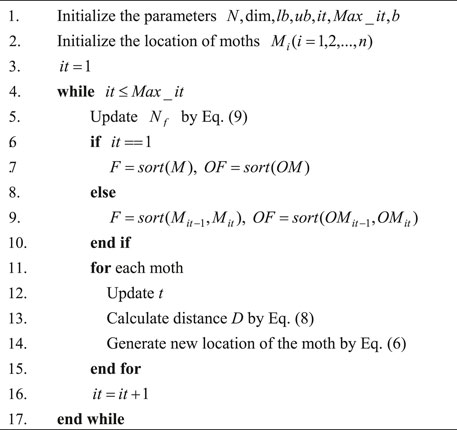
The pseudo-code of the MFO is shown in Algorithm 1, and the flow chart is expressed in Figure 1.
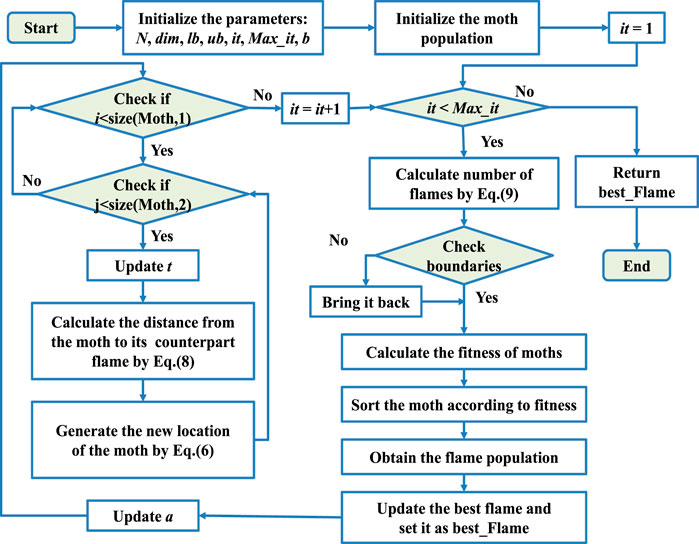
FIGURE 1. Flowchart of MFO.
Algorithm 1. Pseudo-code of MFO.
4 Quantum-Inspired Moth-Flame Optimizer With Enhanced Local Search Strategy
Due to the advantages of fast convergence speed and simple overall structure, the MFO algorithm is frequently employed in real-life problems, and the results obtained are competitive. However, when solving high-dimensional, multi-constraint complex problems, the convergence of the MFO algorithm turns out to be slower and frequently drops into local optima. To overcome these shortcomings, three strategies are introduced in the standard MFO algorithm. 1) Quantum coding and quantum revolving gate. 2) An improved local search based on SFLA (Eusuff et al., 2006). 3) Levy flight. The remainder of Section 4 describes in detail the contents of these three improvement strategies.
4.1 Quantum-Inspired Based MFO
4.1.1 Quantum Encoding
In quantum computing, the minimum unit to store information is to be called a quantum bit (qubit). Distinguished from a memory cell (bit) in a classical computer, a qubit can be a superposition of “1” state and “0” state. The definition of a qubit is given in the following:
where
In the quantum-inspired moth-flame optimization algorithm, the individual quantum moths (QM) are represented as follows:
where
4.1.2 Quantum Initialization
Step 1: Initialize angle matrixThe moth population contains N individuals, and the problem dimension is dim. The probability amplitude is used to represent the state of a qubit and it is generated according to the angle matrix. When carrying out quantum initialization, it is necessary to establish an angle matrix of N * dim, and the search range of angle is 0 to
where
Step 2: Initialize quantum populationQM represents a quantum moth matrix containing N quantum moths, each quantum moth occupying two positions in the search space, each position representing a candidate solution to the problem. The expression for the quantum population is as follows:
If it is necessary to calculate the fitness value to evaluate the individual quality, it needs to be carried out after solution space conversion. This part will be described in detail in Section 4.1.4.
4.1.3 Quantum Rotation Gate
In quantum computing, quantum operators are used to manipulating a quantum to change the relative phase of the quantum. The trade-off between global and local search is implemented by adjusting the rotation angle and direction of the QRG. Moreover, Figure 2 illustrates the position change of the QRG before and after changing the rotation angle. In QLSMFO, the expression of the quantum revolving gate is as follows:
where
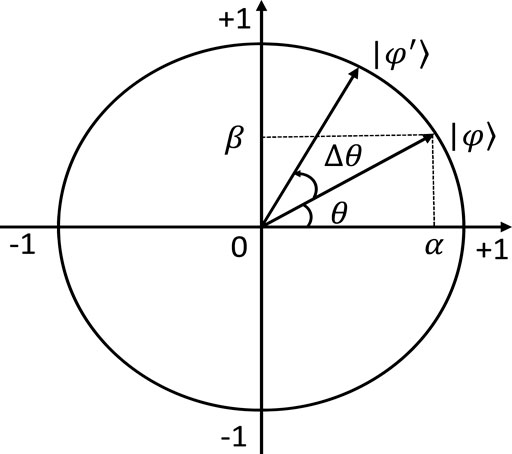
FIGURE 2. Quantum rotation angle updating.
The new qubit is updated by using the quantum revolving gate, as shown in the following formula:
In QLSMFO, instead of using the traditional fixed angle for the rotation angle of the quantum revolving gate, the Differential Evolution (DE) algorithm is employed for dynamically updating the angle size and direction. The process of adjusting the rotation angle by the DE algorithm can be seen as under:
4.1.3.1 Mutation Operation
The rotation angle
where
4.1.3.2 Crossover Operation
The new angle
where CR represents the probability of crossover, which is a random number between [0,1]. randi refers to a random integer between [1, d].
4.1.3.3 Rotation Angle Acquisition
Rotation angle
4.1.4 Solution Space Transformation
The fitness value was considered to assess the quality level of each moth. It is necessary to transform the solution space of the individual’s position. Assuming that the solution space of the definition problem is
4.2 Enhanced Local Search Strategy
To obviate the original MFO algorithm from trapping into local optima, an individual moth is designed to fly in a spiral trajectory according to the corresponding flame position instead of flying towards a single flame. While this mechanism improves the moth’s ability to fall into local optima, it also reduces the ability to mine more promising solutions. To solve this defect, the standard MFO algorithm introduces a mechanism for adjusting the number of flames in the local search stage, which enhances the probability of obtaining the optimal solution to a certain extent. However, there is still much scope for improvement in terms of convergence rate and precision.
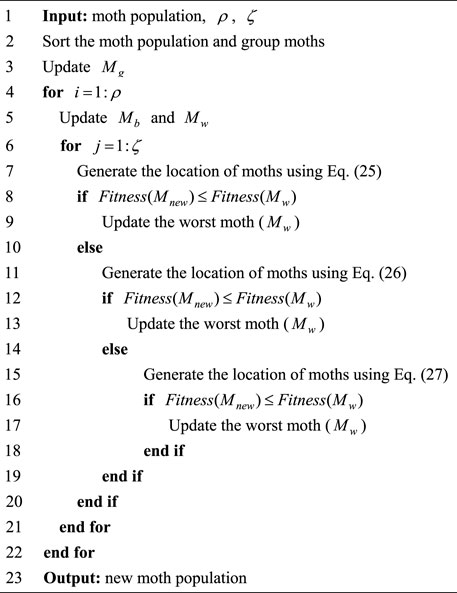
For the purpose of finding the optimal solution at a faster rate and obtaining higher accuracy, this paper adopts a boosted approach based on the standard local search strategy of SFLA. This strategy divides the moths into
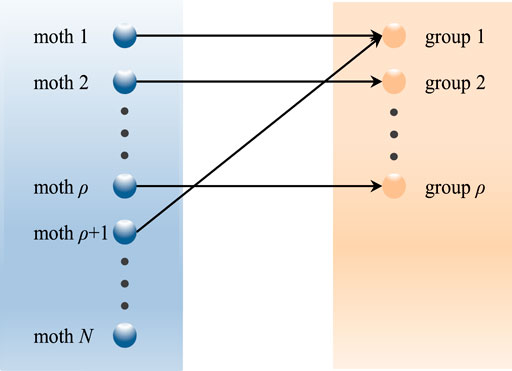
FIGURE 3. Diagram of grouping rules.
The moths with the best fitness value and the moths with the worst fitness value in each group are defined as
Step 1. The worst moth adjusts its position with respect to the optimal value in the group, as shown in Eq. 25.
Step 2. If a better position cannot be obtained in Step 1, then the worst moth is updated according to the global optimum position according to Eq. 26.
Step 3. If a better position cannot be obtained in Step 2, the worst moth uses Eq. 27 to update the position according to the optimal moth in the group and the global optimal moth.
According to the local search strategy in SFLA, steps 1–3 here will be repeated
Algorithm 2. Pseudo-code of local search mechanism.
4.3 Poor Solution Update Using Levy Flight
After L iterations, moths with larger total fitness values (for the minimization problem) are defined as individuals with weak search ability, and these moths are defined as poor moths. Levy flight is introduced to update the position of poor moths to obtain more promising solutions. The update formula of the poor moths is shown in Eq. 28.
4.4 Description of QLSMFO Algorithm
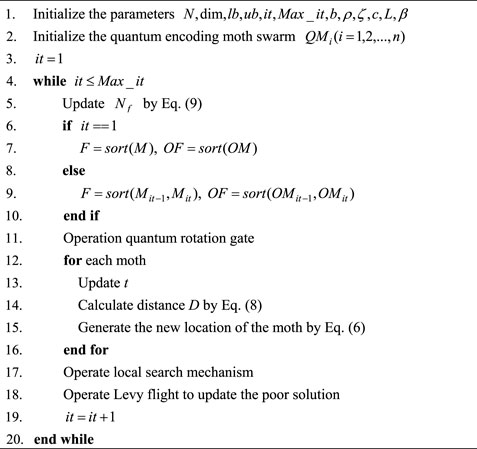
The pseudo-code of the QLSMFO is exhibited in Algorithm 3. Then the flowchart of the QLSMFO is exhibited in Figure 4.
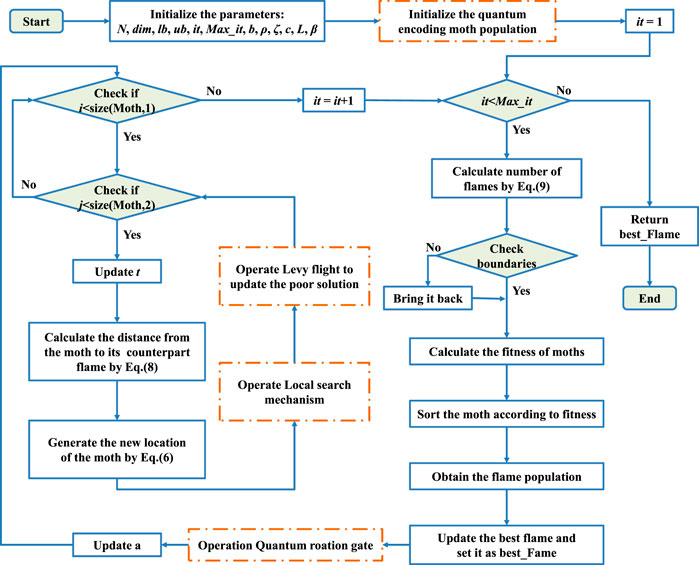
FIGURE 4. Flowchart of QLSMFO.
Algorithm 3. Pseudo-code of QLSMFO.
4.5 Computational Complexity of the QLSMFO Algorithm
In the QLSMFO algorithm, the computational cost is mainly composed of seven parts: quantum initialization, fitness value calculation, generating flame population, QRG operation, moth position update, local search strategy of SFLA, and Levy flight. Here n is the number of moth individuals and d is the dimension. In the quantum initialization phase, first, use the function rand to generate an n*d matrix between 0 and
The time complexity of QLSMFO is the sum of the time complexity of the above seven parts, as shown below:
The time complexity of the original MFO algorithm is
5 Experiment Results
All experiments in this paper were implemented on MATLAB R2018(b), running on a desktop computer with Windows 10 operating system, Intel(R) Core(TM) i7-9700 CPU, running frequency of 3.00 GHz and 16 GB of memory.
5.1 Parameter Settings
With the purpose of validating the performance of QLSMFO, the improved algorithm is compared with K-means (MacQueen, 1967) and thirteen current mainstream optimization algorithms. They are the artificial bee colony (ABC) algorithm (Karaboga and Basturk, 2007), ant lion optimizer (ALO) (Mirjalili, 2015b), cuckoo search (CS) algorithm (Yang and Deb, 2009), DE (Storn and Price, 1997), flower pollination algorithm (FPA) (Yang, 2012), GWO (Mirjalili et al., 2014), Moth-flame optimizer (MFO) (Mirjalili, 2015a), multi-verse optimizer (MVO) (Mirjalili et al., 2016), PSO (Kennedy and Eberhart, 1995), whale optimization algorithm (WOA) (Mirjalili and Lewis, 2016), SFLA (Eusuff et al., 2006), quantum encoding bat algorithm (QBA) (Luo et al., 2017), Gaussian quantum behaved particle swarm optimization (GQPSO) (Coelho, 2010). The parameter settings of the above-mentioned comparison algorithms are reported in Table 1.
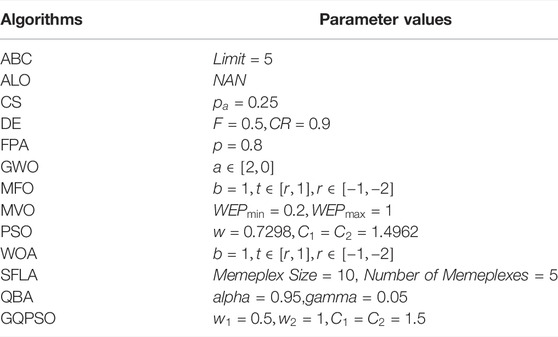
TABLE 1. Parameter value setting for the comparison algorithms.
The largest value of generations for each algorithm is Max_it = 200, and the number of moth swarm is N = 50. The dimensions are the same as the number of attributes in the benchmark dataset. The datasets used in this paper include two artificial datasets and eight UCI classic datasets. The specific characteristics of the dataset will be further introduced in Section 5.2. All algorithms will be independently executed 20 times.
5.2 Datasets
Among the 10 benchmark datasets, Artificial Datasets I and II are artificial datasets selected from the literature (Niknam and Amiri, 2010), and the remaining 8 datasets are related to life and physics from UCI. Table 2 summarizes the number of attributes, clusters, and instances and the application areas of ten benchmark datasets.
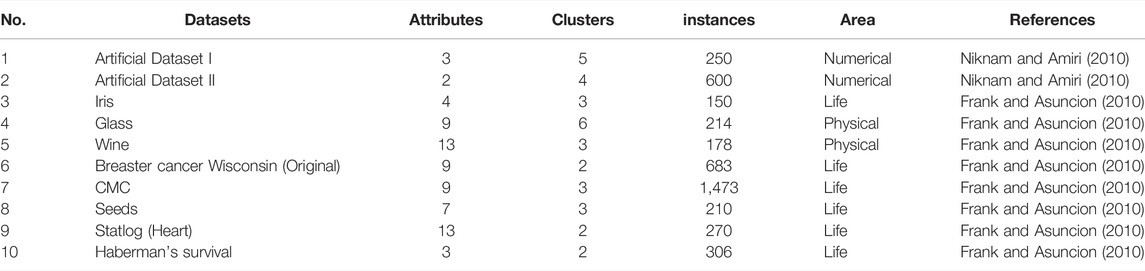
TABLE 2. Details of the ten clustering benchmark datasets.
5.3 Results Analysis
Table 3 reports the statistical results of the experiments performed by QLSMFO and K-Means algorithms and other thirteen metaheuristics algorithms on ten test datasets. The data in the table are presented in the form of four decimal places, except for Std., which uses scientific notation to retain two decimal places. In the table, Best indicates optimal fitness value, Worst indicates the worst fitness value, Mean indicates average fitness value, and Std. indicates standard deviation. The four indicators are the statistics obtained by each algorithm in 20 independent runs. Friedman test is applied to the four indicators in Table 3. The penultimate column FAR indicates the Friedman’s average ranking, and the last column Rank indicates the final ranking. It can be observed through Table 3, that compared with other comparison algorithms, QLSMFO ranks the best on the four indicators (Best, Worst, Mean, and Std.) on all datasets except the seed dataset. QLSMFO achieves second place in the Std. index on the seed dataset. These data show that QLSMFO possesses excellent precision and reliability.
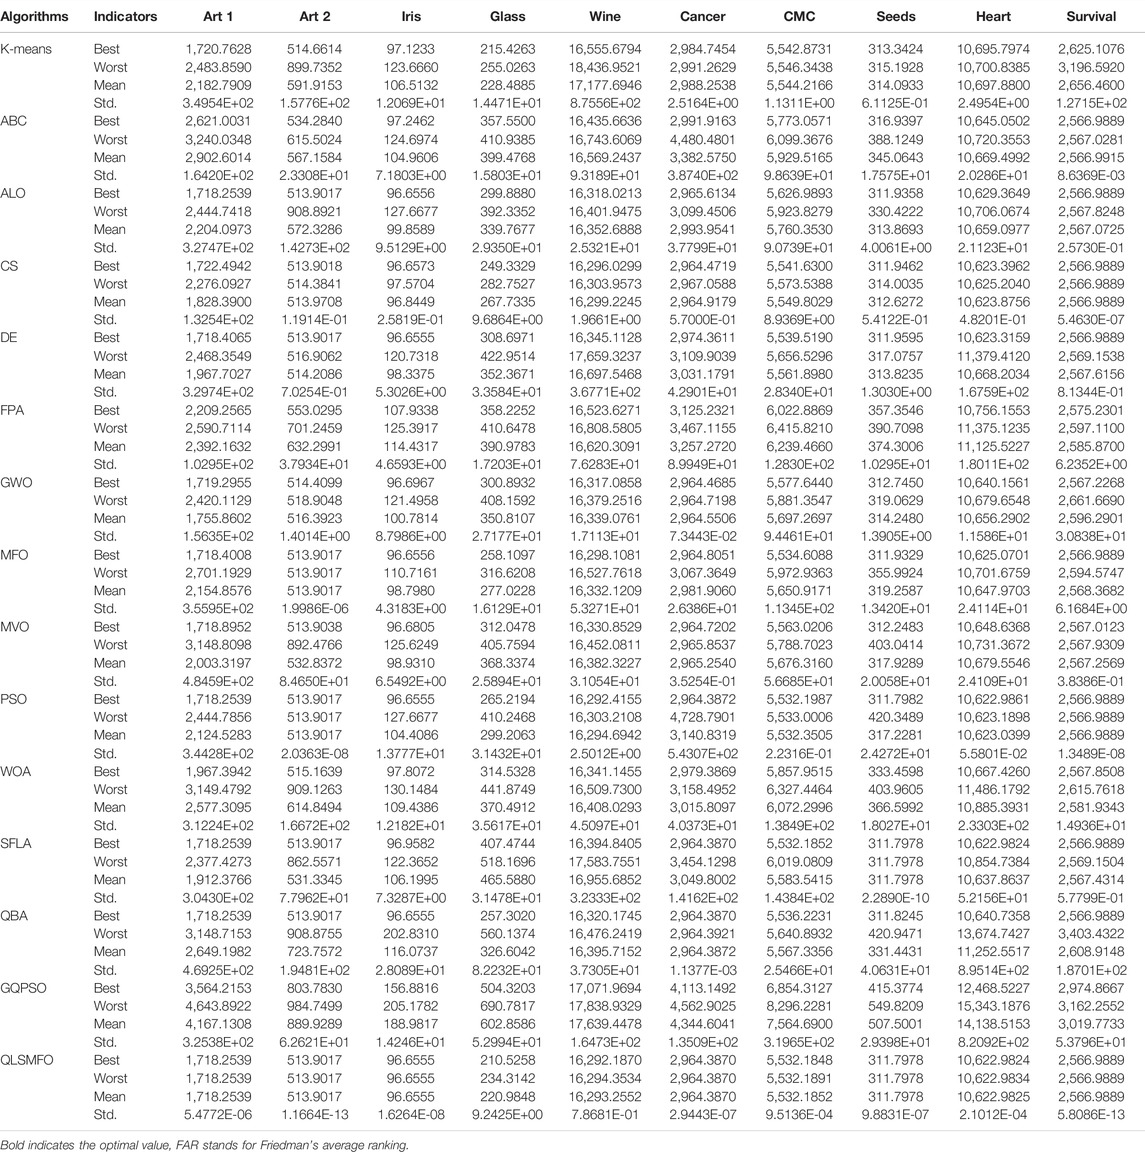
TABLE 3. Simulation results for clustering algorithm after 20 runs on 10 datasets.
The convergence curves of all algorithms on the 13 datasets are presented in Figure 5. The data of the curves are the average fitness values calculated by running each algorithm 20 times independently with 200 iterations. Figure 6 shows the ANOVA plot. A low median, few outliers, and a narrow height in the variance plot indicate better stability. It is clear and obvious from Figures 5 and 6 that QLSMFO possesses the advantages of rapid convergence, excellent accuracy, and outstanding stability. The specific analysis of each dataset is shown below.
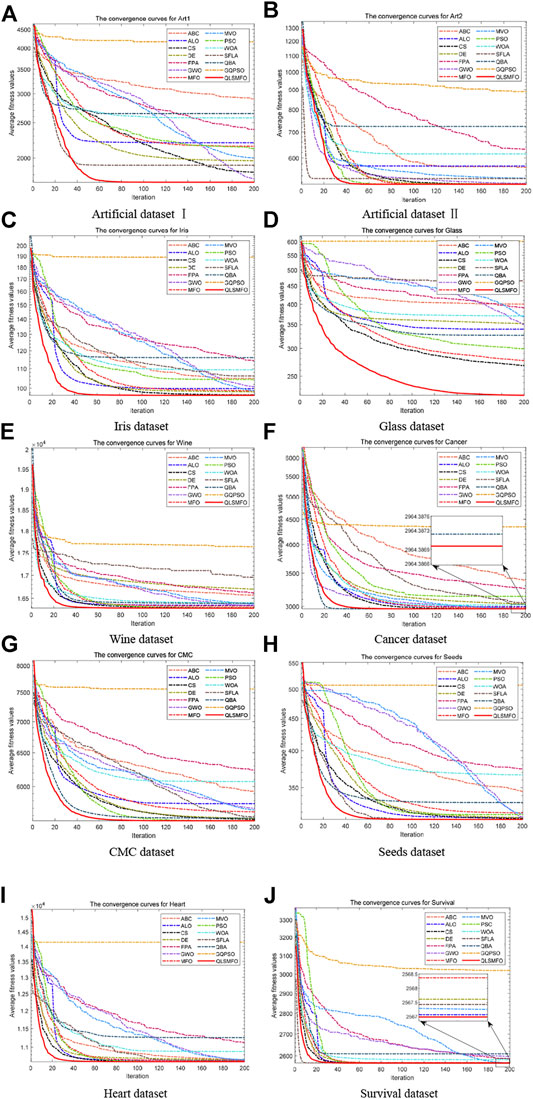
FIGURE 5. Convergence curves of all algorithms on the 10 datasets. (A) Artificial Dataset I. (B) Artificial Dataset II. (C) Iris dataset. (D) Glass dataset. (E) Wine dataset. (F) Cancer dataset. (G) CMC dataset. (H) Seeds dataset. (I) Heart dataset. (J) Survival dataset.
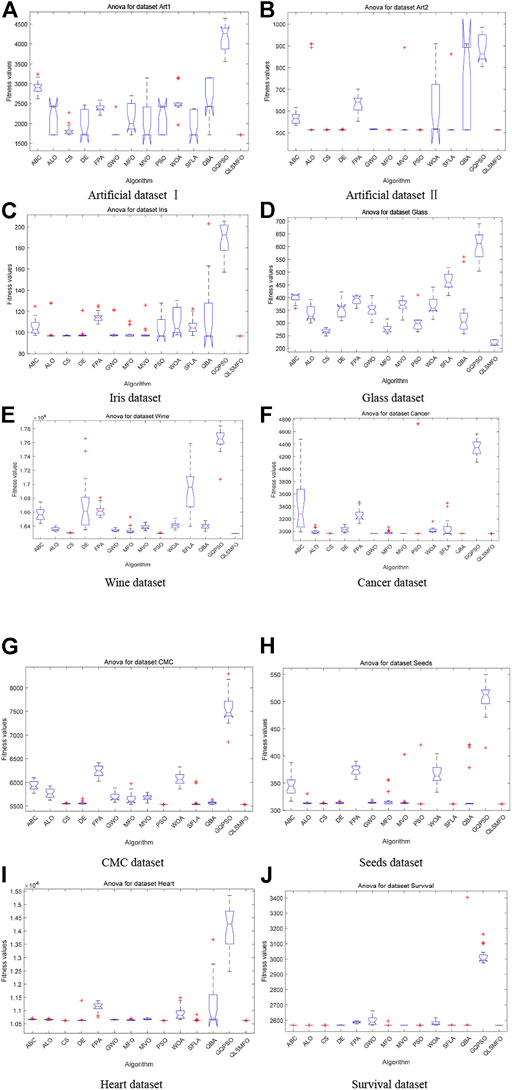
FIGURE 6. ANOVA simulation results of all algorithms on the 10 datasets. (A) Artificial Dataset I. (B) Artificial Dataset II. (C) Iris dataset. (D) Glass dataset. (E) Wine dataset. (F) Cancer dataset. (G) CMC dataset. (H) Seeds dataset. (I) Heart dataset. (J) Survival dataset.
5.3.1 Artificial Dataset I
For Artificial Dataset I, QLSMFO won first place in all algorithms in the four indicators. ALO, PSO, SFLA, and QBA reach the same level as QLSMFO at the optimal value. It is clearly observed that the worst value of QLSMFO outperforms the optimal results derived from other algorithms. It revealed that QLSMFO has high precision and good algorithm performance. Figure 5A shows that the speed of the convergence curve of QLSMFO decreases significantly more quickly when compared with other methods. The standard deviation of QLSMFO from Table 3 is better than all algorithms by eight orders of magnitude. It can also be observed in Figure 6A that the graph of the improved algorithm is the narrowest and the median line is the lowest, indicating that the algorithm has high robustness.
5.3.2 Artificial Dataset II
QLSMFO achieves the best performance on Best, Worst, Mean, and Std. Table 3 shows that ALO, DE, SFLA, and QBA is the same as QLSMFO on the best indicator. Then MFO and PSO have the same good performance as QLSMFO on Best, Worst, and Mean indicators. However, the standard deviation of QLSMFO is superior to theirs, which is seven and five orders of magnitude better than MFO and PSO, respectively. From the convergence curve in Figure 5B, although the proposed algorithm fails to converge as rapidly as SFLA in the early iterations, after 30 generations, QLSMFO converges significantly quicker than the other algorithms and is ultimately the best in accuracy. Compared with other algorithms in Figure 6B, QLSMFO has no outliers, and the box is the narrowest, so the stability of the algorithm is better.
5.3.3 Iris Dataset
QLSMFO achieved the greatest performance on Best, Worst, Mean, and Std., except PSO, DE, and QBA. They achieve the same results as QLSMFO in Best indicators. However, the values of Worst, Mean, and Std. are not as good as the results of QLSMFO. From Figure 5C, it can be seen that DE has a small number of outliers, and it can be seen from the box shape that the variance of PSO is large. QLSMFO has the smallest variance and no outliers, indicating that the algorithm has high stability. Table 3 reflects that QLSMFO outperforms the other algorithms by at least eight orders of magnitude in terms of Std. indicators, which shows that the algorithm is robust.
5.3.4 Glass Dataset
QLSMFO acquired the optimum value on Best, Worst, Mean, and Std. among eleven algorithms. The worst value of QLSMFO outperforms the optimal values of the other algorithms except for the K-means algorithm. In Figure 5D, it is clearly visible that QLSMFO has the fastest rate of convergence, and the final convergence accuracy has obvious advantages over other algorithms. In Table 3, the Std. index of QLSMFO has no obvious advantage compared with other algorithms, but in Figure 6D, it can be seen that the height of the box of QLSMFO is lower than that of other algorithms, indicating great robustness.
5.3.5 Wine Dataset
Table 3 displays that QLSMFO obtains the optimum value on Best, Worst, Mean, and Std. The figures for PSO are very close to those of QLSMFO in terms of optimal and average values. However, it is observed from Figure 5E that QLSMFO converges faster. The higher stability of QLSMFO than PSO is observed in Figure 6E.
5.3.6 Cancer Dataset
It is shown that the values of Best, Worst, Mean, and Std. of QLSMFO are optimum in Table 3. The Best indicators of CS and PSO are close to QLSMFO, at the same time, SFLA and QBA reach the same level as QLSMFO at the optimal value, but the other three indicators are not as good as the improved algorithm. QLSMFO has a significant improvement on Std. metrics, at least five orders of magnitude of excellence over other algorithms. It is observed that the worst value obtained by QLSMFO is superior to the optimum value derived from comparison algorithms. The convergence curve of QLSMFO is displayed in Figure 6F, although it is not as fast as QBA in the initial 20 generations of iteration, the convergence rate in the later period is the fastest among all algorithms.
5.3.7 CMC Dataset
It is observed in Table 3 that QLSMFO achieves the best performance for all metrics compared with the comparative algorithms. Although the performance of PSO is close to that of QLSMFO, the data provided in Table 3 demonstrates that the Std. index of QLSMFO is three orders of magnitude superior to PSO, and QLSMFO has higher stability and robustness. Figure 6G shows that the convergence rate of QLSMFO decreases quicker than other methods.
5.3.8 Seeds Dataset
Table 3 shows that QLSMFO all obtained the optimal values on Best, Worst, and Mean except for Std. The performance of SFLA reaches the same level as QLSMFO, although the stability of QLSMFO is not as good as that of SFLA, the gap between them is not big. And the convergence speed of QLSMFO is significantly faster than that of SFLA. Moreover, the value of its Std. the indicator is at least six orders of magnitude outperformed by other algorithms. It appears from Figure 6H that the stability of QLSMFO is higher. The convergence curve of QLSMFO drops the fastest, and the accuracy at the end of the iteration is the highest, as can be observed from Figure 5H.
5.3.9 Heart Dataset
The data in Table 3 shows that QLSMFO achieves optimal values for Best, Worst, Mean, and Std. From Figure 6I, the heights of the boxes of CS, PSO, and QLSMFO are all short, indicating high stability, but the position of QLSMFO is lower, so the robustness of QLSMFO is higher than that of CS and PSO.
5.3.10 Survival Dataset
QLSMFO attained the best performance in Best, Worst, Mean, and Std. from Table 3. Best metric of ABC, ALO, CS, DE, MFO, PSO, SFLA, and QBA all reach the same level as QLSMFO, and the worst and average values of CS and PSO are the same as QLSMFO. However, the standard deviation of QLSMFO is five to six orders of magnitude preferred over CS and PSO. As seen in Figure 6J that CS and PSO have outliers, but QLSMFO does not. So the stability of QLSMFO is higher than these two algorithms. From Figure 5J, although SFLA has the fastest convergence speed in the early stage, the final accuracy is not as high as that of QLSMFO.
5.4 Wilcoxon’s Non-Parametric Test
The Wilcoxon rank-sum test is a non-parametric statistical technique that is introduced in this research to accurately validate the experimental results of this investigation and to verify that the effect of QLSMFO is statistically significant and does not occur by coincidence. The twenty best fitness values yielded in twenty independent runs of each method were used in Wilcoxon’s non-parametric statistical test. The p-value shown in Table 4 is calculated from the eleven pairs of data through the Wilcoxon rank-sum test. In this study, fourteen pairs of data are formed by QLSMFO vs. ABC, QLSMFO vs. ALO, QLSMFO vs. CS, QLSMFO vs. DE, QLSMFO vs. FPA, QLSMFO vs. GWO, QLSMFO vs. MFO, QLSMFO vs. MVO, QLSMFO vs. PSO, QLSMFO vs. WOA, QLSMFO vs. SFLA, QLSMFO vs. QBA, QLSMFO vs. GQPSO and QLSMFO vs. K-means. If
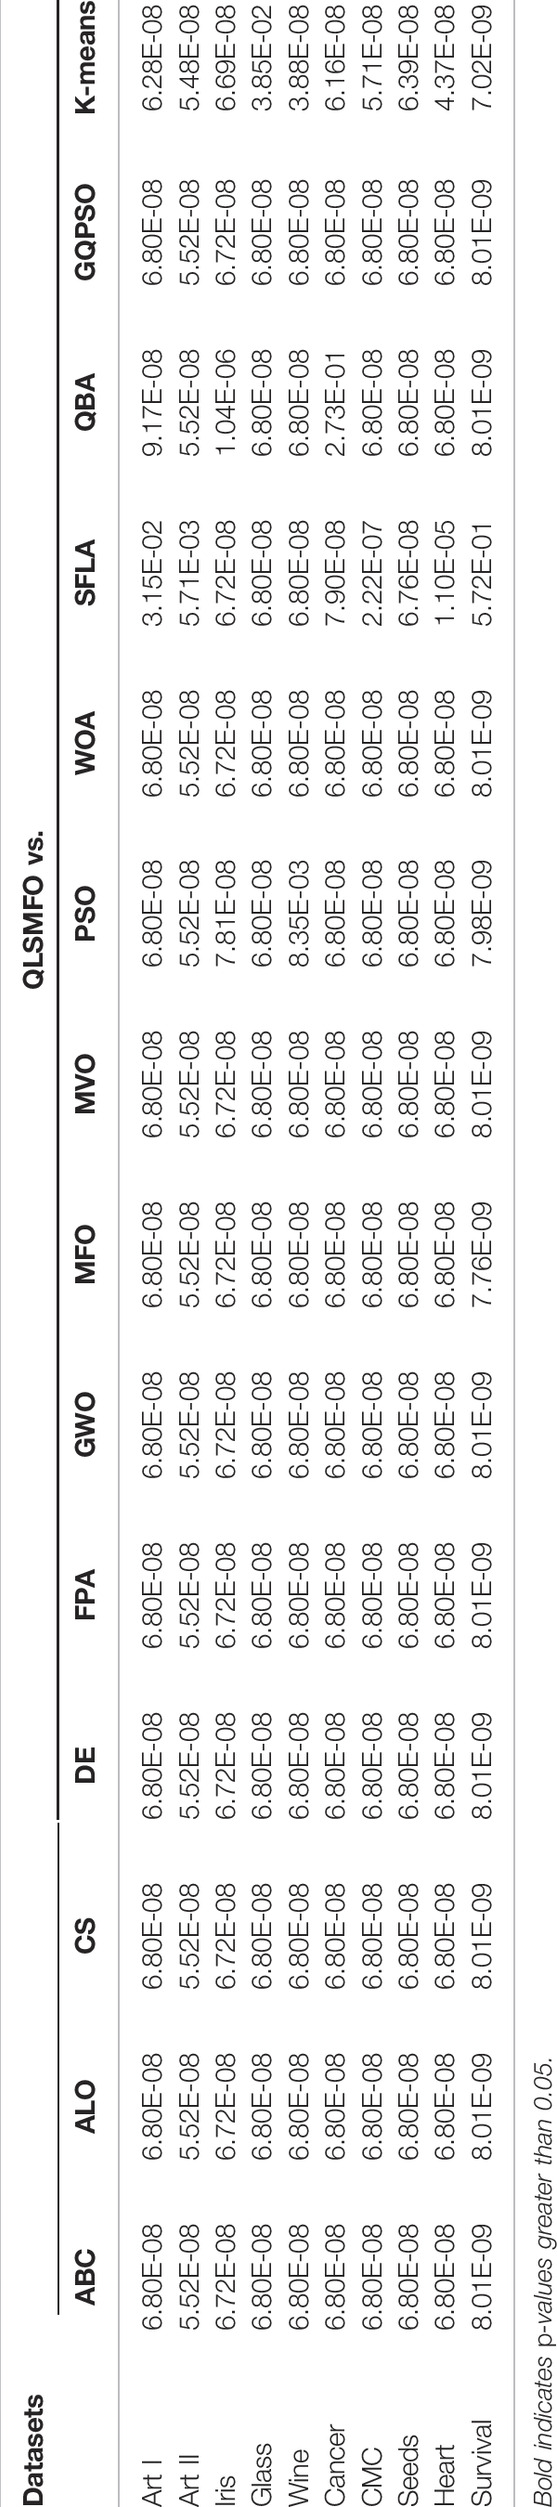
TABLE 4. p-values generated by Wilcoxon rank-sum test.
5.5 Visual Analysis of Clustering Results
After the above experiments, Tables 3, 4, and Figures 5, and 6 demonstrate that the QLSMFO algorithm is characterized by high accuracy, rapid convergence, and reliable stability of performance. For the purpose of showing the clustering capability of the proposed algorithm more vividly, this section will show the process of clustering in a graphical way.
5.5.1 Clustering Process of QLSMFO
Artificial Dataset I will be applied to visualize the process of clustering in QLSMFO during this section. Artificial Dataset I has three attributes and five clusters. The x, y, and z axes correspond to three attribute values, respectively. Different types of clusters are marked by green, blue, red, magenta, and cyan. The clustering situation of QLSMFO on Artificial Dataset 1 when the number of iterations is 0, 5, 10, and 20 are presented in Figure 7. The initial distribution of the Art I dataset is presented in Figure 7A. When the number of iterations is 5, as shown in Figure 7B, there is confusion in the data classification between the green and red clusters. During the classification process, there is a misassignment of a class to the class represented by magenta and red, such as the part where magenta and red are mixed. Only blue is classified correctly. As the iterations continue, Figure 7C shows the clustering results with an iteration number of 10. Cyan, red, blue, and magenta are classified correctly, but the part of the data that mixes blue and magenta is classified incorrectly. Figure 7D demonstrates the clustering effect at 20 iterations. It is obvious from the figure that five classes are correctly classified, and there is no data confusion between classes.
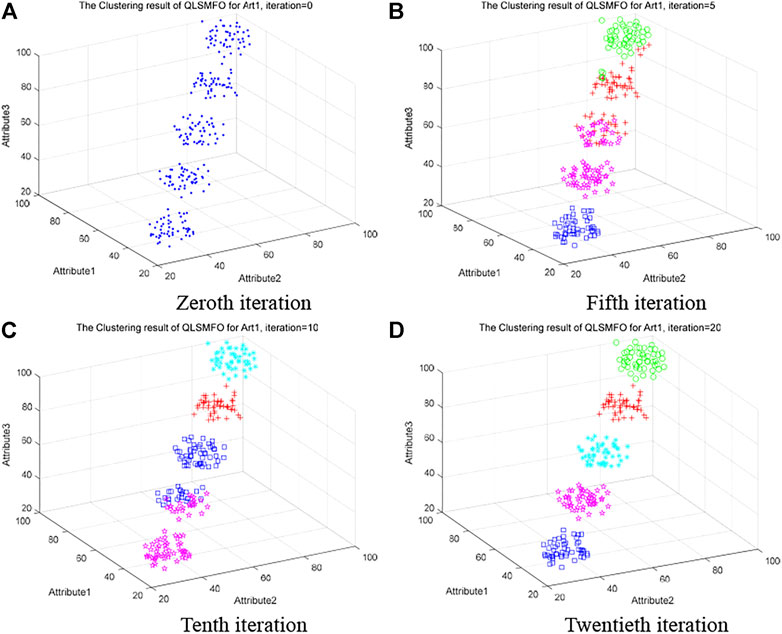
FIGURE 7. Clustering process of QLSMFO on Art 1 dataset at iteration is 0, 5, 10, and 20. (A) Zeroth iteration. (B) Fifth iteration. (C) Tenth iteration. (D) Twentieth iteration.
The four graphs in Figure 7 vividly show the clustering process of QLSMFO on Artificial Dataset 1, and the correct classification effect is achieved in the 20th generation, which illustrates the effectiveness of the algorithm and the fast classification speed.
5.5.2 Comparison of the Clustering Process with Other Algorithms
The comparison results of QLSMFO and other algorithms in Artificial Dataset 1, Artificial Dataset 2, Iris dataset, and CMC dataset will be presented in this section.
Figure 8 shows the clustering results of MFO on Artificial Dataset 1 with iterations of 10 and 20, respectively. In Figure 8A, the data is not successfully divided into five categories, and there is data confusion within each category cluster. Although Figure 8B divides the classes into five classes. However, most of the data in magenta are misclassified to red, and there is a small amount of data misclassification between blue and green. Compared with Figures 7C and D in Section 5.5.1, It is observed that QLSMFO has high efficiency and high precision in solving clustering problems compared to the original MFO.
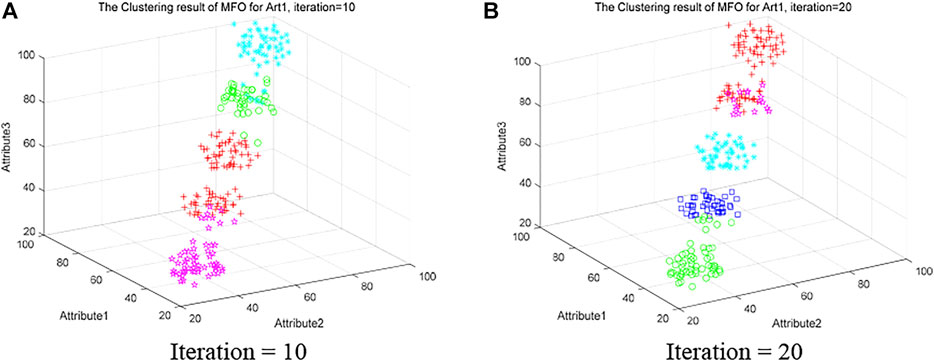
FIGURE 8. Clustering results of MFO on the Art 1 dataset at iteration is 10 and 20. (A) Iteration = 10. (B) Iteration = 20.
To make a comparison of the results of QLSMFO with other algorithms on Artificial Dataset II, the original MFO and an algorithm ranked second to QLSMFO are selected for further comparison.
Table 3 illustrates that PSO has reached the same level as QLSMFO on Best, Worst, and Mean. PSO algorithm is selected for further performance comparison with QLSMFO since the Std. of PSO is second only to QLSMFO. The maximum iteration value is given as 20. Figures 9A–C exhibit the clustering outcomes of the 20th generation on Artificial Dataset II for MFO, PSO, and QLSMFO, respectively. It is seen from Figure 9A that the blue, magenta, green, and red in the MFO are classified incorrectly. In Figure 9B, the classification result of the PSO is better than that of the MFO, and the data has been successfully divided into four categories, but there are still some data confusions between magenta and blue that have not been successfully separated. From Figure 9C, QLSMFO is observed, the classification effect is the best, there is no data confusion between clusters, and the classification is correct. It can be clearly shown that the classification effect of QLSMFO is better.
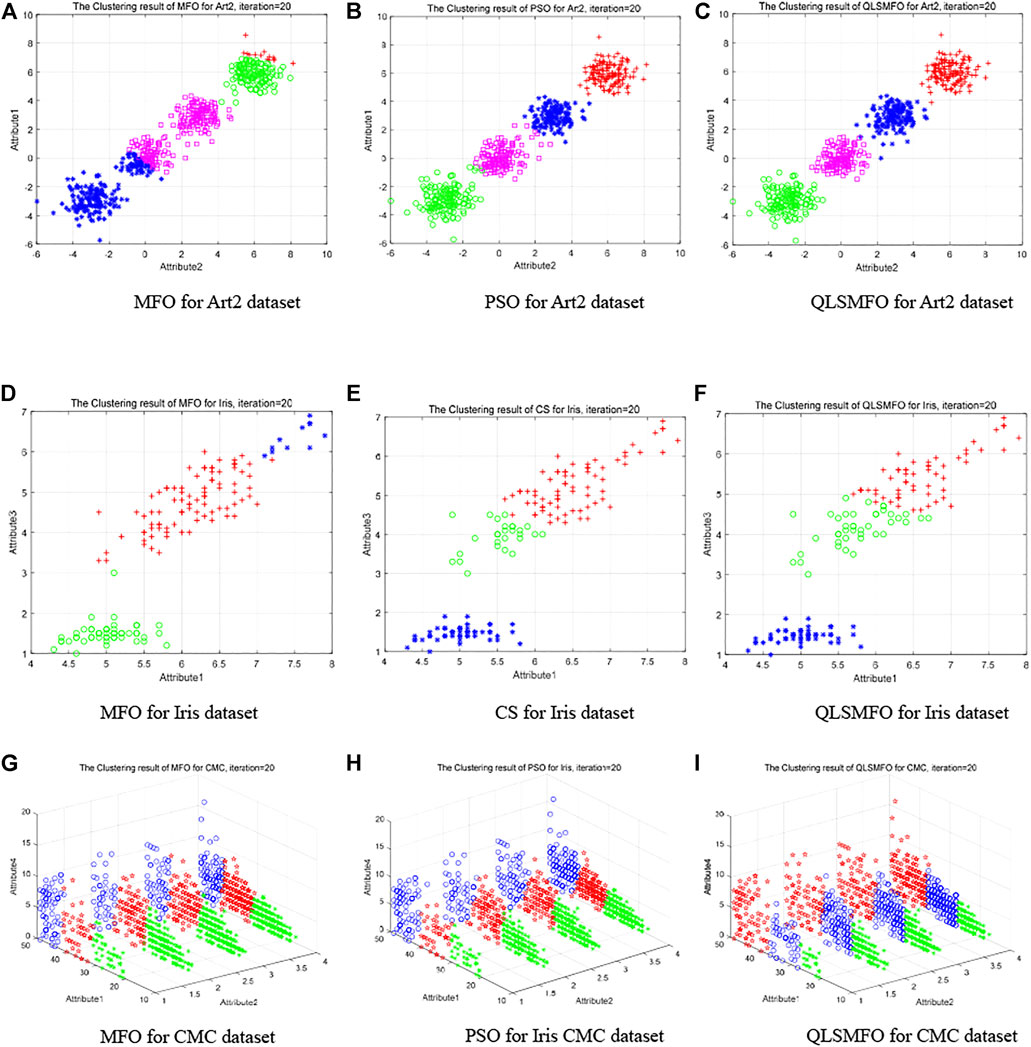
FIGURE 9. Clustering results of QLSMFO and other algorithms on different datasets at iteration 20. (A) MFO for Art 2 dataset. (B) PSO for Art 2 dataset. (C) QLSMFO for Art 2 dataset. (D) MFO for Iris dataset. (E) CS for Iris dataset. (F) QLSMFO for Iris dataset. (G) MFO for CMC dataset. (H) PSO for Iris CMC dataset. (I) QLSMFO for CMC dataset.
The data in Table 3 shows that the values of CS on Best, Worst, Mean, and Std. on the Iris dataset are closest to QLSMFO. In order to further show the performance difference between QLSMFO and CS in the clustering effect, the clustering results with 20 iterations are selected for comparison. Figures 9D–F show the classification results of MFO, CS, and QLSMFO on the 20th generation of attribute 1 and attribute 3 of the Iris dataset. In Figure 9D, the red and blue data appear chaotic. In Figure 9E the green and red appear chaotic. In Figure 9F, green and red achieve a good balance, and the data are correctly separated.
Figures 9G–I indicate the clustering effect of the 20th generation of MFO, PSO, and QLSMFO on attributes 1, 2, and 4 of the CMC dataset. It is observed that the blue, red, and green borders in Figure 9I are clear and there is no mixing. In Figures 9G and H, there is a situation where the intermediate data and the data on both sides are stuck, so the effect of QLSMFO is better.
5.6 Verify the Effectiveness of the Three Strategies in QLSMFO
In order to verify the effectiveness of the three improved strategies added to the QLSMFO algorithm, the proposed QLSMFO is compared with the original MFO, QMFO1, and QMFO2. Firstly, QMFO1 represents an improved algorithm with quantum initialization and QRG strategy added to the original MFO. Secondly, the improved algorithm formed by adding the Levy flight strategy based on the QMFO1 algorithm is named QMFO2. Finally, the algorithm that combines the three strategies is the QLSMFO. The four algorithms were tested on 10 UCI clustering datasets. The algorithm parameters and simulation experiments are consistent with the previous content. In addition, the bold in the table indicates the optimal value. The experimental data in Table 5 compares the mean and standard deviation of the original MFO, QMFO1, QMFO2, and QLSMFO to measure the performance improvement of the algorithm. The effect of the added strategies on the convergence speed of the algorithm is observed in Figure 10.
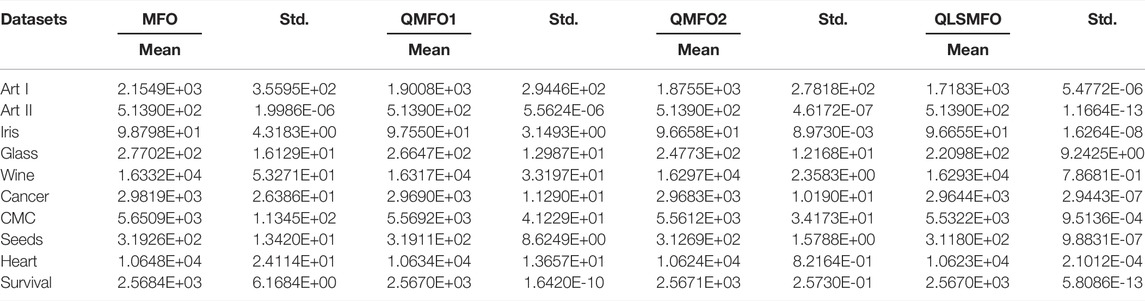
TABLE 5. Numerical results of improved algorithms with different strategies on 10 clustered data.
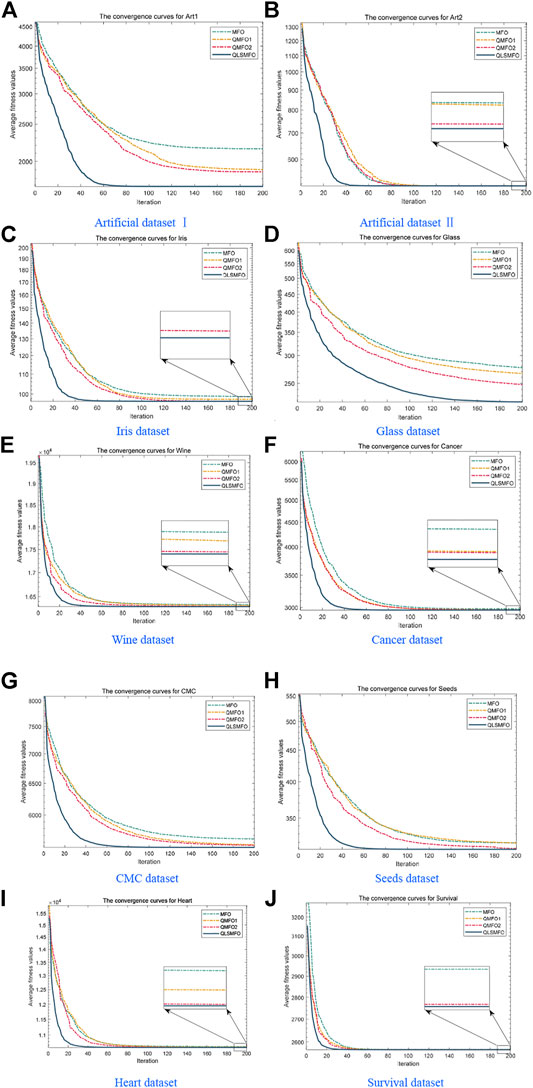
FIGURE 10. Convergence curves of MFO, QMFO1, QMFO2, and QLSMFO on the 10 datasets. (A) Artificial Dataset I (B) Artificial Dataset II. (C) Iris dataset. (D) Glass dataset. (E) Wine dataset. (F) Cancer dataset. (G) CMC dataset. (H) Seeds dataset. (I) Heart dataset. (J) Survival dataset.
The experimental results in Table 5 show that in terms of algorithm accuracy and stability, QMFO1 has a certain improvement over the original MFO algorithm on 10 datasets, and achieves the same accuracy as QLSMFO on Art II and survival datasets. After adding quantum initialization and QRG in the original MFO algorithm, due to the increase in the diversity of the moth population, the search range is expanded and the exploration ability of the algorithm is enhanced. The QMFO1 algorithm achieves a better average value than the original MFO on all ten datasets. Since QRG can adaptively guide the algorithm to search in a more desired search direction, the stability of the algorithm is improved. It can be seen from Table 5 that the accuracy and stability of QMFO2 have been further improved on the basis of QMFO1. When implementing the Levy flight strategy, the moth population needs to be assessed to identify the poor moths and update their positions. Levy flight improves the searchability of the moth. From the convergence curves in Figures 10A–J, it can be seen that the QMFO2 algorithm has significantly improved the convergence speed. Both Table 5 and Figure 10 show that the local search strategy has the greatest contribution to improving the accuracy, stability, and convergence speed of QLSMFO, the average value, and standard deviation are both optimal, and the convergence speed is also the fastest. This is due to the superior exploitation capability of the local search strategy based on SFLA. By observing the experimental results of the four algorithms, the multi-strategy effectively improves the performance of the algorithm due to a single strategy. The quantum initialization and Levy flight strategy, both improved the performance of the original algorithm to a certain extent, and the local search strategy has greatly contributed to the accuracy, stability, and convergence speed of the algorithm.
6 Conclusion and Future Works
A quantum-inspired moth-flame optimizer with an enhanced local search strategy (QLSMFO) is introduced to address clustering analysis in this research. Quantum coding is used for the coding of individuals in the moth population to enrich the population diversity and thus boost the exploration capacity of the algorithm. The addition of the quantum revolving gate guides the population to evolve towards a better solution, bringing the two phases of exploration and exploitation into a state of balance. The local search strategy based on SFLA enhances the mining capability of standard MFO. Finally, the Levy flight is used to update the poor solutions in the population. This mechanism improves the population quality and accelerates the rate of convergence. To confirm the effectiveness and practical performance of QLSMFO in clustering analysis, we compared it with eleven algorithms including ABC, ALO, CS, DE, FPA, GWO, MFO, MVO, PSO, WOA, SFLA, QBA, GQPSO, and K-means on two artificial datasets and eight famous UCI datasets. Experimental results show that QLSMFO significantly outperforms comparison algorithms with regard to the accuracy, convergence speed, and robustness. Future research will try to use QLSMFO to solve higher latitude cluster analysis problems. Try to expand the application scope of QLSMFO.
Data Availability Statement
The original contributions presented in the study are included in the article, further inquiries can be directed to the corresponding authors.
Author Contributions
XC: methodology, writing–original draft. QL: writing–review and editing. YZ: experimental results analysis, software. WD: review and editing. SY: experimental results testing.
Funding
This work was supported by the National Natural Science Foundation of China under Grant No. U21A20464, 62066005, and Project of the Guangxi Science and Technology under Grant No. AD21196006, and Innovation Project of Guangxi Minzu University Graduate Education under Grant gxun-chxs2021065.
Conflict of Interest
The authors declare that the research was conducted in the absence of any commercial or financial relationships that could be construed as a potential conflict of interest.
Publisher’s Note
All claims expressed in this article are solely those of the authors and do not necessarily represent those of their affiliated organizations, or those of the publisher, the editors, and the reviewers. Any product that may be evaluated in this article, or claim that may be made by its manufacturer, is not guaranteed or endorsed by the publisher.
References
Ahmed, O. H., Lu, J., Xu, Q., Ahmed, A. M., Rahmani, A. M., and Hosseinzadeh, M. (2021). Using Differential Evolution and Moth-Flame Optimization for Scientific Workflow Scheduling in Fog Computing. Appl. Soft Comput. 112, 107744. doi:10.1016/j.asoc.2021.107744
Anju, J., and Shreelekshmi, R. (2022). A Faster Secure Content-Based Image Retrieval Using Clustering for Cloud. Expert Syst. Appl. 189, 116070. doi:10.1016/j.eswa.2021.116070
Chen, J., Qi, X., Chen, L., Chen, F., and Cheng, G. (2020). Quantum-inspired Ant Lion Optimized Hybrid K-Means for Cluster Analysis and Intrusion Detection. Knowledge-Based Syst. 203, 106167. doi:10.1016/j.knosys.2020.106167
Coelho, L. d. S. (2010). Gaussian Quantum-Behaved Particle Swarm Optimization Approaches for Constrained Engineering Design Problems. Expert Syst. Appl. 37 (2), 1676–1683. doi:10.1016/j.eswa.2009.06.044
Dahi, Z. A., and Alba, E. (2022). Metaheuristics on Quantum Computers: Inspiration, Simulation and Real Execution. Future Gener. Comput. Syst. 130, 164–180. doi:10.1016/j.future.2021.12.015
Deng, W., Shang, S., Cai, X., Zhao, H., Zhou, Y., Chen, H., et al. (2021). Quantum Differential Evolution with Cooperative Coevolution Framework and Hybrid Mutation Strategy for Large Scale Optimization. Knowledge-Based Syst. 224, 107080. doi:10.1016/j.knosys.2021.107080
Deng, Y., and Gao, Q. (2020). A Study on E-Commerce Customer Segmentation Management Based on Improved K-Means Algorithm. Inf. Syst. E-Bus Manage 18 (4), 497–510. doi:10.1007/s10257-018-0381-3
Elaziz, M. A., Ewees, A. A., Ibrahim, R. A., and Lu, S. (2020). Opposition-based Moth-Flame Optimization Improved by Differential Evolution for Feature Selection. Math. Comput. Simul. 168, 48–75. doi:10.1016/j.matcom.2019.06.017
Elsakaan, A. A., El-Sehiemy, R. A., Kaddah, S. S., and Elsaid, M. I. (2018). An Enhanced Moth-Flame Optimizer for Solving Non-smooth Economic Dispatch Problems with Emissions. Energy 157, 1063–1078. doi:10.1016/j.energy.2018.06.088
Eusuff, M., Lansey, K., and Pasha, F. (2006). Shuffled Frog-Leaping Algorithm: a Memetic Meta-Heuristic for Discrete Optimization. Eng. Optim. 38 (2), 129–154. doi:10.1080/03052150500384759
Frank, A., and Asuncion, A. (2010). UCI Machine Learning Repository. Univ. Calif. Sch. Inf. Comput. Sci. 213 2.
Gan, G., Ma, C., and Wu, J. (2020). Data Clustering: Theory, Algorithms, and Applications. Philadelphia, Pennsylvania, United States: Society for Industrial and Applied Mathematics.
Gao, D., Wang, G.-G., and Pedrycz, W. (2020). Solving Fuzzy Job-Shop Scheduling Problem Using DE Algorithm Improved by a Selection Mechanism. IEEE Trans. Fuzzy Syst. 28 (12), 3265–3275. doi:10.1109/tfuzz.2020.3003506
Gonzalez, T. F. (1985). Clustering to Minimize the Maximum Intercluster Distance. Theor. Comput. Sci. 38, 293–306. doi:10.1016/0304-3975(85)90224-5
Gu, Y., Wang, S., Zhang, H., Yao, Y., Yang, W., and Liu, L. (2019). Clustering-driven Unsupervised Deep Hashing for Image Retrieval. Neurocomputing 368, 114–123. doi:10.1016/j.neucom.2019.08.050
Hassan, B. A., Rashid, T. A., and Hamarashid, H. K. (2021). A Novel Cluster Detection of COVID-19 Patients and Medical Disease Conditions Using Improved Evolutionary Clustering Algorithm Star. Comput. Biol. Med. 138, 104866. doi:10.1016/j.compbiomed.2021.104866
Hosseini, S. M. S., Maleki, A., and Gholamian, M. R. (2010). Cluster Analysis Using Data Mining Approach to Develop CRM Methodology to Assess the Customer Loyalty. Expert Syst. Appl. 37 (7), 5259–5264. doi:10.1016/j.eswa.2009.12.070
Jain, A. K. (2010). Data Clustering: 50 Years beyond K-Means. Pattern Recognit. Lett. 31 (8), 651–666. doi:10.1016/j.patrec.2009.09.011
Jain, A. K., Murty, M. N., and Flynn, P. J. (1999). Data Clustering. ACM Comput. Surv. 31 (3), 264–323. doi:10.1145/331499.331504
Jianchang Mao, J., and Jain, A. K. (1996). A Self-Organizing Network for Hyperellipsoidal Clustering (HEC). IEEE Trans. Neural Netw. 7 (1), 16–29. doi:10.1109/72.478389
Karaboga, D., and Basturk, B. (2007). A Powerful and Efficient Algorithm for Numerical Function Optimization: Artificial Bee Colony (ABC) Algorithm. J. Glob. Optim. 39 (3), 459–471. doi:10.1007/s10898-007-9149-x
Karthikeyan, M., and Aruna, P. (2013). Probability Based Document Clustering and Image Clustering Using Content-Based Image Retrieval. Appl. Soft Comput. 13 (2), 959–966. doi:10.1016/j.asoc.2012.09.013
Kennedy, J., and Eberhart, R. (1995). Particle Swarm Optimization. Proc. ICNN'95-international Conf. neural Netw. 4, 1942–1948.
Khan, B. S., Raja, M. A. Z., Qamar, A., and Chaudhary, N. I. (2021). Design of Moth Flame Optimization Heuristics for Integrated Power Plant System Containing Stochastic Wind. Appl. Soft Comput. 104, 107193. doi:10.1016/j.asoc.2021.107193
Han, K. H., and Kim, J. H. (2002). Quantum-inspired Evolutionary Algorithm for a Class of Combinatorial Optimization. IEEE Trans. Evol. Comput. 6 (6), 580–593. doi:10.1109/tevc.2002.804320
Layeb, A. (2011). A Novel Quantum Inspired Cuckoo Search for Knapsack Problems. Ijbic 3 (5), 297–305. doi:10.1504/ijbic.2011.042260
Li, Y., Chu, X., Tian, D., Feng, J., and Mu, W. (2021). Customer Segmentation Using K-Means Clustering and the Adaptive Particle Swarm Optimization Algorithm. Appl. Soft Comput. 113, 107924. doi:10.1016/j.asoc.2021.107924
Li, Z., Zeng, J., Chen, Y., Ma, G., and Liu, G. (2021). Death Mechanism-Based Moth-Flame Optimization with Improved Flame Generation Mechanism for Global Optimization Tasks. Expert Syst. Appl. 183, 115436. doi:10.1016/j.eswa.2021.115436
Luo, Q., Li, a., and Zhou, Y. (2017). A Quantum Encoding Bat Algorithm for Uninhabited Combat Aerial Vehicle Path Planning. Ijica 8 (3), 182–193. doi:10.1504/ijica.2017.086642
MacQueen, J. (1967). “Some Methods for Classification and Analysis of Multivariate Observations,” in Proceedings of the fifth Berkeley symposium on mathematical statistics and probability, California, Berkeley, January 7, 1966, 281–297.
Mirjalili, S., and Lewis, A. (2016). The Whale Optimization Algorithm. Adv. Eng. Softw. 95, 51–67. doi:10.1016/j.advengsoft.2016.01.008
Mirjalili, S., Mirjalili, S. M., and Hatamlou, A. (2016). Multi-verse Optimizer: a Nature-Inspired Algorithm for Global Optimization. Neural Comput. Applic 27 (2), 495–513. doi:10.1007/s00521-015-1870-7
Mirjalili, S., Mirjalili, S. M., and Lewis, A. (2014). Grey Wolf Optimizer. Adv. Eng. Softw. 69, 46–61. doi:10.1016/j.advengsoft.2013.12.007
Mirjalili, S. (2015). Moth-flame Optimization Algorithm: A Novel Nature-Inspired Heuristic Paradigm. Knowledge-based Syst. 89, 228–249. doi:10.1016/j.knosys.2015.07.006
Mirjalili, S. (2015). The Ant Lion Optimizer. Adv. Eng. Softw. 83, 80–98. doi:10.1016/j.advengsoft.2015.01.010
Niknam, T., and Amiri, B. (2010). An Efficient Hybrid Approach Based on PSO, ACO and K-Means for Cluster Analysis. Appl. soft Comput. 10 (1), 183–197. doi:10.1016/j.asoc.2009.07.001
Ouadfel, S., and Abd Elaziz, M. (2021). A Multi-Objective Gradient Optimizer Approach-Based Weighted Multi-View Clustering. Eng. Appl. Artif. Intell. 106, 104480. doi:10.1016/j.engappai.2021.104480
Sato, Y., Izui, K., Yamada, T., and Nishiwaki, S. (2019). Data Mining Based on Clustering and Association Rule Analysis for Knowledge Discovery in Multiobjective Topology Optimization. Expert Syst. Appl. 119, 247–261. doi:10.1016/j.eswa.2018.10.047
Sinaga, K. P., and Yang, M.-S. (2020). Unsupervised K-Means Clustering Algorithm. IEEE access 8, 80716–80727. doi:10.1109/access.2020.2988796
Singh, S., and Ganie, A. H. (2021). Applications of Picture Fuzzy Similarity Measures in Pattern Recognition, Clustering, and MADM. Expert Syst. Appl. 168, 114264. doi:10.1016/j.eswa.2020.114264
Steane, A. (1998). Quantum Computing. Rep. Prog. Phys. 61 (2), 117–173. doi:10.1088/0034-4885/61/2/002
Storn, R., and Price, K. (1997). Differential Evolution–A Simple and Efficient Heuristic for Global Optimization over Continuous Spaces. J. Glob. Optim. 11 (4), 341–359. doi:10.1023/a:1008202821328
Sun, Z.-H., Zuo, T.-Y., Liang, D., Ming, X., Chen, Z., and Qiu, S. (2021). GPHC: A Heuristic Clustering Method to Customer Segmentation. Appl. Soft Comput. 111, 107677. doi:10.1016/j.asoc.2021.107677
Taib, H., and Bahreininejad, A. (2021). Data Clustering Using Hybrid Water Cycle Algorithm and a Local Pattern Search Method. Adv. Eng. Softw. 153, 102961. doi:10.1016/j.advengsoft.2020.102961
Van der Merwe, D. W., and Engelbrecht, A. P. (2003). “Data Clustering Using Particle Swarm Optimization,” in The 2003 Congress on Evolutionary Computation, Canberra, ACT, Australia, 08-12 December 2003 (IEEE), 215–220.
Wang, G.-G., Deb, S., and Cui, Z. (2019). Monarch Butterfly Optimization. Neural Comput. Applic 31 (7), 1995–2014. doi:10.1007/s00521-015-1923-y
Wang, G.-G., Guo, L., Gandomi, A. H., Hao, G.-S., and Wang, H. (2014). Chaotic Krill Herd Algorithm. Inf. Sci. 274, 17–34. doi:10.1016/j.ins.2014.02.123
Wang, G. G., and Tan, Y. (2017). Improving Metaheuristic Algorithms with Information Feedback Models. IEEE Trans. Cybern. 49 (2), 542–555. doi:10.1109/TCYB.2017.2780274
Wang, R., Zhou, Y., Qiao, S., and Huang, K. (2016). Flower Pollination Algorithm with Bee Pollinator for Cluster Analysis. Inf. Process. Lett. 116, 1–14. doi:10.1016/j.ipl.2015.08.007
Wang, X., Wang, Z., Sheng, M., Li, Q., and Sheng, W. (2021). An Adaptive and Opposite K-Means Operation Based Memetic Algorithm for Data Clustering. Neurocomputing 437, 131–142. doi:10.1016/j.neucom.2021.01.056
Wei, Y., Zhou, Y., Luo, Q., and Deng, W. (2021). Optimal Reactive Power Dispatch Using an Improved Slime Mould Algorithm. Energy Rep. 7, 8742–8759. doi:10.1016/j.egyr.2021.11.138
Woźniak, M., and Połap, D. (2018). Object Detection and Recognition via Clustered Features. Neurocomputing 320, 76–84.
Wu, H. H., Ke, G., Wang, Y., and Chang, Y. T. (2022). Prediction on Recommender System Based on Bi-clustering and Moth Flame Optimization. Appl. Soft Comput. 120, 108626. doi:10.1016/j.asoc.2022.108626
Xu, R., and WunschII, D. (2005). Survey of Clustering Algorithms. IEEE Trans. Neural Netw. 16 (3), 645–678. doi:10.1109/tnn.2005.845141
Xu, X., Zhu, Z., Wang, Y., Wang, R., Kong, W., and Zhang, J. (2022). Odor Pattern Recognition of a Novel Bio-Inspired Olfactory Neural Network Based on Kernel Clustering. Commun. Nonlinear Sci. Numer. Simul. 109, 106274. doi:10.1016/j.cnsns.2022.106274
Yang, X.-S. (2012). “Flower Pollination Algorithm for Global Optimization,” in International Conference on Unconventional Computing and Natural Computation (Berlin, Heidelberg: Springer), 240–249. doi:10.1007/978-3-642-32894-7_27
Yang, X. S., and Deb, S. (2009). “Cuckoo Search via Lévy Flights,” in 2009 World congress on nature & biologically inspired computing (NaBIC), Coimbatore, India, 09-11 December 2009 (IEEE), 210–214.
Yu, C., Heidari, A. A., and Chen, H. (2020). A Quantum-Behaved Simulated Annealing Algorithm-Based Moth-Flame Optimization Method. Appl. Math. Model. 87, 1–19. doi:10.1016/j.apm.2020.04.019
Yu, C., Heidari, A. A., Xue, X., Zhang, L., Chen, H., and Chen, W. (2021). Boosting Quantum Rotation Gate Embedded Slime Mould Algorithm. Expert Syst. Appl. 181, 115082. doi:10.1016/j.eswa.2021.115082
Zhou, Y., Wu, H., Luo, Q., and Abdel-Baset, M. (2019). Automatic Data Clustering Using Nature-Inspired Symbiotic Organism Search Algorithm. Knowledge-Based Syst. 163, 546–557. doi:10.1016/j.knosys.2018.09.013
Keywords: K-means, cluster analysis, quantum-inspired moth-flame optimizer, local search mechanism, swarm intelligence
Citation: Cui X, Luo Q, Zhou Y, Deng W and Yin S (2022) Quantum-Inspired Moth-Flame Optimizer With Enhanced Local Search Strategy for Cluster Analysis. Front. Bioeng. Biotechnol. 10:908356. doi: 10.3389/fbioe.2022.908356
Received: 30 March 2022; Accepted: 03 June 2022;
Published: 10 August 2022.
Edited by:
Xiao-Zhi Gao, University of Eastern Finland, FinlandReviewed by:
Shikha Mehta, Jaypee Institute of Information Technology, IndiaGai-Ge Wang, Ocean University of China, China
Copyright © 2022 Cui, Luo, Zhou, Deng and Yin. This is an open-access article distributed under the terms of the Creative Commons Attribution License (CC BY). The use, distribution or reproduction in other forums is permitted, provided the original author(s) and the copyright owner(s) are credited and that the original publication in this journal is cited, in accordance with accepted academic practice. No use, distribution or reproduction is permitted which does not comply with these terms.
*Correspondence: Qifang Luo, l.qf@163.com; Yongquan Zhou, zhouyongquan@gxun.edu.cn