Assessment of chemotherapeutic effects on cancer cells using adhesion noise spectroscopy
 Maximilian Ell
 Mai Thu Bui
 Seyda Kigili2
  Günther Zeck
 Sonia Prado-López
- 1Institute of Biomedical Electronics, Faculty of Electrical Engineering and Information Technology, TU Wien, Vienna, Austria
- 2Institute of Solid State Electronics, Faculty of Electrical Engineering and Information Technology, TU Wien, Vienna, Austria
With cancer as one of the leading causes of death worldwide, there is a need for the development of accurate, cost-effective, easy-to-use, and fast drug-testing assays. While the NCI 60 cell-line screening as the gold standard is based on a colorimetric assay, monitoring cells electrically constitutes a label-free and non-invasive tool to assess the cytotoxic effects of a chemotherapeutic treatment on cancer cells. For decades, impedance-based cellular assays extensively investigated various cell characteristics affected by drug treatment but lack spatiotemporal resolution. With progress in microelectrode fabrication, high-density Complementary Metal Oxide Semiconductor (CMOS)-based microelectrode arrays (MEAs) with subcellular resolution and time-continuous recording capability emerged as a potent alternative. In this article, we present a new cell adhesion noise (CAN)-based electrical imaging technique to expand CMOS MEA cell-biology applications: CAN spectroscopy enables drug screening quantification with single-cell spatial resolution. The chemotherapeutic agent 5-Fluorouracil exerts a cytotoxic effect on colorectal cancer (CRC) cells hampering cell proliferation and lowering cell viability. For proof-of-concept, we found sufficient accuracy and reproducibility for CAN spectroscopy compared to a commercially available standard colorimetric biological assay. This label-free, non-invasive, and fast electrical imaging technique complements standardized cancer screening methods with significant advances over established impedance-based approaches.
1 Introduction
Cancer is a major burden worldwide that affected 19.3 million people in 2021. According to the Global Cancer Observatory (GLOBOCAN), the number of new cancer patients per year is expected to reach 28.4 million in 2040. Among all types of cancer, colorectal cancer (CRC) represents 10% of new cases and is the second cause of cancer death worldwide (Sung et al., 2021). This puts the focus on the development of new therapies for the disease to assess the drug efficacy in a quick and cost-effective way by implementing new technologies.
Bringing a new drug on the market requires a preclinical phase and a clinical trial with high costs. The whole process before approval demands 10–15 years and costs millions of euros (Marchetti and Schellens, 2007). In the preclinical phase, the drug candidates are tested first in vitro and then in vivo. For five decades, the NCI 60 cell-line screening has been the gold standard for anti-cancer drug development (Chabner, 2016). This panel includes 60 cell lines for nine different types of cancer (leukemia, melanoma, non-small cell lung carcinoma, ovary, brain, breast, kidney, colon, and prostate). The evolution of the drug screening tests based on the NCI 60 cell lines is reviewed in detail elsewhere (Chabner, 2016). In brief, the screening process starts with an initial test of just three of the cell lines. If the tested compounds present growth-inhibiting activity, they will be screened against the full cell panel. The testing approach uses a colorimetric assay (sulforhodamine blue cytotoxicity assay), incubated for 48 h with five different concentrations of the tested drugs. Next, the GI50 (Growth Inhibition of 50%), the TGI (Total Growth Inhibition), and the LC50 (drug concentration with 50% reduction of the measured protein) are calculated (Developmental Therapeutics Program, 2021). Afterwards, an algorithm forms clusters of drugs with the same type of cytotoxic activity. Moreover, the relative expression of hundreds of molecular targets that are known to be present in the cell lines is correlated with the drug sensitivity profile against every drug (Takimoto, 2003). Next, the selected drug candidates are assessed for pharmacokinetic and toxicokinetic behavior in vivo and—if successful—they will enter the Phase I clinical trial in humans. Although many compounds enter the clinical trials phase, many are proven not to be efficacious in human subjects later. The reasons for the low ratio of success in the clinic can be multifactorial. On the one hand, the 2D in vitro culture system cannot fully represent the tumoral complexity, and on the other hand, the in vivo models are biologically different from humans. 3D tumoral models generated with patient-derived material for drug testing are proposed as a more physiological approach for basic cancer research and drug testing and are gaining momentum in many fields, including cancer research. But adapting the drug screening assays from the 2D to the 3D cultures will take some time. However, the 3D models also present drawbacks and are far from perfect. For example, the 3D tumoral models tend to become necrotic in the center after several days in culture due to the lack of a circulatory system (Pugh and Ratcliffe, 2003), which can yield misleading results for drug testing. In this work, we propose the use of CMOS-based microelectrode arrays (CMOS MEAs) in combination with cancer cells growing in 2D on different extracellular matrix (ECM) proteins to assess chemotherapeutic effects on CRC cells using adhesion noise spectroscopy to complement drug screening techniques and reveal features not accomplished by optical readouts.
Monitoring cells electrically and electrochemically offers a label-free (Magar et al., 2021), easy-to-use (Turner, 2013; Mehrotra, 2016), and portable (D. Zhang and Liu, 2016) technique to gain further insight into cell properties that are difficult to obtain by optical density proliferation and cytotoxicity assays [e.g., cell adhesion (Srinivasan et al., 2015)], but suffer from spatial resolution (Wegener et al., 2000). Hence, CMOS-based microelectrode arrays (CMOS MEAs) enable recordings of the cells’ electrical activity with high spatial (few to few tens of µm) and high temporal (up to 20 kHz bandwidth) resolution using thousands of densely packed sensor sites (Müller et al., 2015; Thewes et al., 2016). This new CMOS MEA application allows for the non-invasive probing of the electrical properties of the adhesion cleft of adherent cells either via impedance spectroscopy (Viswam et al., 2018) or cell adhesion noise (CAN) spectroscopy (Zeitler et al., 2011). In impedance spectroscopy, an external (small) AC current is applied and the impedance of the cleft between the cell membrane and the oxide surface and of potentially capacitive cellular components is recorded by the electrode underneath the cell. In CAN spectroscopy, sensing relies on the thermal noise generated by the cleft resistance between the adherent cellular membrane and the capacitive recording site. Adherent non-electrogenic cells are detected by an increase in extracellular voltage fluctuations caused by the cleft resistance between the cell membrane and a field-effect transistor (Voelker and Fromherz, 2006; Zeitler et al., 2011; Zeitler and Fromherz, 2013). Moreover, CAN spectroscopy evaluates the voltage noise of cells adhered to a CMOS MEA in terms of spectral power density (SV) without the need for any external stimulation (Eickenscheidt et al., 2012; Bertotti et al., 2014; Stutzki et al., 2016) or perturbation of cells [e.g., contacting with a patch pipette (Im et al., 2018)]. In conclusion, monitoring cell cultures using CAN spectroscopy offers not only label-free but also a non-invasive electrical imaging method with high spatiotemporal resolution for drug screening applications.
To use CAN spectroscopy in a biological setting, we focus on detecting early changes in cell adhesion of the (CRC) cell line HT-29 and non-cancerous human dermal fibroblasts (HDFs) growing in 2D cultures on top of the dielectric oxide of the MEA coated with ECM proteins after treating them with the chemotherapeutic agent 5-Fluoruracil (5-FU) (N. Zhang et al., 2008). Since cancer cells are immortal cells that proliferate abnormally, we correlate adhesive properties and cells’ health status (Tubiana, 1989; Hanahan and Weinberg, 2011; Feitelson et al., 2015). Therefore, cell proliferation is determined by the MEA’s area covered with adherent cells, assuming a loss in cell adhesion due to the cytotoxic anti-cancer drug 5-FU (Akalovich et al., 2021; Fohlen et al., 2021). Our MEA comprises both subcellular resolution (Hierlemann et al., 2011; Viswam et al., 2018; Ell, Zeitler, et al., 2023) and cellular network studies (Amin et al., 2017; Viswam et al., 2017; Angotzi et al., 2018; Abbott et al., 2022; Cojocaru et al., 2022; Emery et al., 2022; 2023). To relate electrical imaging to optical imaging, CAN-based images were overlaid with brightfield microscopy images. Just to verify the accuracy of our technology localizing the cells physically. Moreover, we assessed the cell viability on the MEA with the commercial device CASY Cell Counter and Analyzer (Weinreich et al., 2014; Grintzalis et al., 2017). Besides, both cell types were grown in 96-well plates and quantified using a commercially available colorimetric cell viability assay (Cell Counting Kit-8, CCK-8). The technology presented in this work provides a cell-based, label-free, non-invasive, and fast assay to assess drug development applications in a time-resolved manner.
2 Methods
2.1 Cell culture 2D models
The colorectal cancer (CRC) cell line HT-29 (ATCC, RRID: CVCL_0320) and the human dermal fibroblast cell line HDF (PELOBiotech GmbH, RRID: CVCL_DP66) were cultivated at 37°C in a 5% CO2 atmosphere. The used culture medium consisted of Dulbecco’s Modified Eagle’s Medium (DMEM (1X), Thermo Fisher Scientific Inc.), 10% v/v Fetal Bovine Serum (FBS, heat-inactivated, Thermo Fisher Scientific Inc.), 1% v/v Gibco™ Penicillin Streptomycin (Pen Strep, Thermo Fisher Scientific Inc.) and 1% v/v Gibco™ L-glutamine 200 mM (Thermo Fisher Scientific Inc.). We changed the cell culture medium every 2 days and passaged the cells at 80% confluency.
2.2 Coating-dependent cell attachment
Cell-cell and cell-extracellular matrix (ECM) protein interactions are essential for proper tissue development, maintenance, and regeneration. Thus, in vitro cells adhere, grow, and perform more physiologically when adhering to surfaces coated with ECM proteins or specific adhesion molecules (Cruz Walma and Yamada, 2020) Both Poly-L-lysine, which is commonly used in neuroscientific applications (Eickenscheidt and Zeck, 2014; Stutzki et al., 2016; Cojocaru et al., 2022) and Collagen type I as the most abundant ECM protein in our body (Murata et al., 1986; Katsuda et al., 1992; Hohenester and Engel, 2002) ensure tight tissue adhesion (Vitale et al., 2018). We therefore addressed the biocompatibility of the cited ECM biomolecules (Prockop and Kivirikko, 1995; Vitale et al., 2018) by analyzing the viability of the cell line HT-29 cultivated in 96-well plates and on CMOS MEAs coated with Poly-L-lysine or Collagen type I.
2.2.1 96-well plate
The Nunc™ MicroWell™ 96-well, Nunclon Delta-Treated, Flat-Bottom Microplates (Thermo Fisher Scientific Inc.) were coated with either 0.01 μg/μL Poly-L-lysine (PLL) (MW 150–300 kDa, Sigma-Aldrich GmbH) or 10% (v/v) Collagen type I (from calfskin, Sigma-Aldrich GmbH) for 2 hours at room temperature. Afterwards, they were washed with 2 × 100 µL PBS (1X) and 1 × 100 μL cell culture medium to remove the excessive coating solution. After coating, we seeded 10,000 cells per well, let the cells sediment and adhere sufficiently overnight, and started to conduct the CCK-8 assay. The medium was exchanged every 2 days to avoid nutrient depletion, building-up of metabolic products, and a lowered pH (Masters and Stacey, 2007).
The Cell Counting Kit-8 (CCK-8) assay (MedChemExpress) was used at 0 h and 48 h after the cells’ seeding, following the provider’s recommendations. Briefly, cells were incubated with 10% CCK-8 for 2 hours, and the optical density (OD) was read at 450 nm with a microplate reader (Byonoy GmbH). To calculate cell viability from OD, we used the formula Cell Viability (%) = (Sample Signal–Blank Signal)/(Control Signal–Blank Signal) × 100. We conducted the experiments independently at least three times, each with 3-5 technical replicates. Statistics were performed using the mean and standard deviation of the OD or Cell Viability with GraphPad Prism 10 (GraphPad Software, RRID: SCR_002798). Unpaired t-tests/ANOVA compared the significant differences between the two experimental groups. The significance level is denoted as ns, not significant, *, p ≤ 0.05, **, p ≤ 0.01, ***, p ≤ 0.001, ****, p ≤ 0.0001.
2.2.2 CMOS MEA
We used the CMOS MEA system CAN-Q Station with the biosensing platform CAN-Q Chip (obtained from formerly Venneos GmbH) to record the MEAs (Vallicelli, De Matteis, et al., 2018). To prepare the CMOS MEA for cell seeding, we cleaned it with Tickopur R60 (5% v/v at 80°C, Dr. H. Stamm GmbH Chemische Fabrik), sterilized with 70% v/v ethanol and UV light for 30 min, and rinsed with distilled water and cell culture medium. Next, the recording sites were coated with 50 µL of Collagen or PLL solution of the same concentrations as the 96-well plates. After 2 hours of incubation at room temperature, we rinsed the CMOS MEA with distilled water to withdraw the excessive coating solution. The HT-29 cells were then seeded at a concentration of 20,000 cells/chip in a 50 μL cell-culture-medium suspension by pipetting on the sensor window array. One hour of incubating at 37°C in a 5% CO2 atmosphere ensured adequate cell sedimentation on the CMOS MEA’s sensor sites, and next, the CMOS MEA’s culture chambers were filled up with cell culture medium. After letting the cells attach to the sensors, recordings were performed at 0 h, 24 h, 48 h, and 72 h in a bio-safety cabinet Class II at room temperature.
We analyzed the recordings with a custom Python script (Python version 3.9.5, RRID: SCR_008394). An electrical image was generated by the spectral power density SV with image processing techniques using the OpenCV Library (RRID: SCR_015526) (Bradski, 2000). The cell viability status was estimated from the proliferation status: we assume that healthy and proliferative cells cover a larger sensor area following (Witzel et al., 2015). The area covered by cells was calculated using the formula area (%) = Number of Cell-covered Sensors/Total Number of Sensors 100. We performed unpaired t-tests/ANOVA for the statistics of the mean and standard deviation of the area using GraphPad Prism 10 with ns, not significant, *, p ≤ 0.05, **, p ≤ 0.01, ***, p ≤ 0.001, ****, p ≤ 0.0001.
2.3 Drug testing efficacy
We evaluated the effect of 5-Fluorouracil (5-FU, Sigma-Aldrich GmbH) on HT-29 and HDF. For that, the cell lines were cultivated in 96-well plates and on CMOS MEAs coated with Collagen type I. Recent studies indicate that 5-FU exerts a cytotoxic effect on HT-29 cells (Fohlen et al., 2021), leading to cell apoptosis (Vallicelli, Fary, et al., 2018). We therefore assumed that apoptotic cells (i) generate a lower OD during the CCK-8 assay with lower Cell Viability and (ii) detach from the ECM coating, causing fewer sensors where cells are adhered to, which results in a smaller area of the CMOS MEA sensor array covered by cells.
For these experiments, we coated the CMOS MEAs with 10% (v/v) Collagen type I and seeded both cell lines in separate experiments. HT-29 was seeded at a concentration of 20,000 cells/chip as described before (2.2) and HDF was seeded at a concentration of 2,000 cells/chip. Both cell lines were seeded on the uncoated 96-well plates at a concentration of 10,000 cells/well. After overnight incubation for cell adhesion, we replaced the cell culture medium with a medium containing 0.25 mg/mL of 5-FU. The cells were kept in the 5-FU-supplemented medium for the remaining experimental time (72 h). For the untreated control group, we exchanged the medium at the same time when the drug treatment started. The 5-FU-containing medium was prepared freshly before each treatment with a 1 mg/mL stock solution.
We performed the CCK-8 assay and the CMOS MEA recordings at 0 h, 24 h, 48 h, and 72 h after overnight adhesion. For the statistical analysis (t-test and ANOVA), we used the GraphPad Prism 10 software with ns, not significant, *, p ≤ 0.05, **, p ≤ 0.01, ***, p ≤ 0.001, ****, p ≤ 0.0001.
2.4 CMOS MEA recording
The CMOS MEA biosensing platform CAN-Q Chip comprised 256 × 384 capacitive recording sites with a pitch of 5.6 µm × 6.5 µm covering an active area of 1.6 mm × 2.5 mm as described in (Vallicelli, De Matteis, et al., 2018; Vallicelli, Fary, et al., 2018). The sensor array is covered with a 30 nm ALD-TiO2 top oxide layer. A Perspex culture chamber is glued on the chip, exposing the recording site arrays to cell culture and medium (Zeitler and Fromherz, 2013). The recording transistor features an open gate between the source and drain contacts, which is insulated from the electrolyte by an oxide layer to prevent electric or ionic charge transfer (Figure 1A, top) (Zeitler et al., 2011; Zeitler and Fromherz, 2013; Vallicelli, Fary, et al., 2018). A local voltage change in the electrolyte-filled cleft between the cell and the recording site modulates the source-drain current. Prior studies on neurons (Voelker and Fromherz, 2006; Zeitler et al., 2011; Zeitler and Fromherz, 2013) demonstrated how the cleft resistance RJ enhances the voltage noise VJ (Figure 1A, bottom).
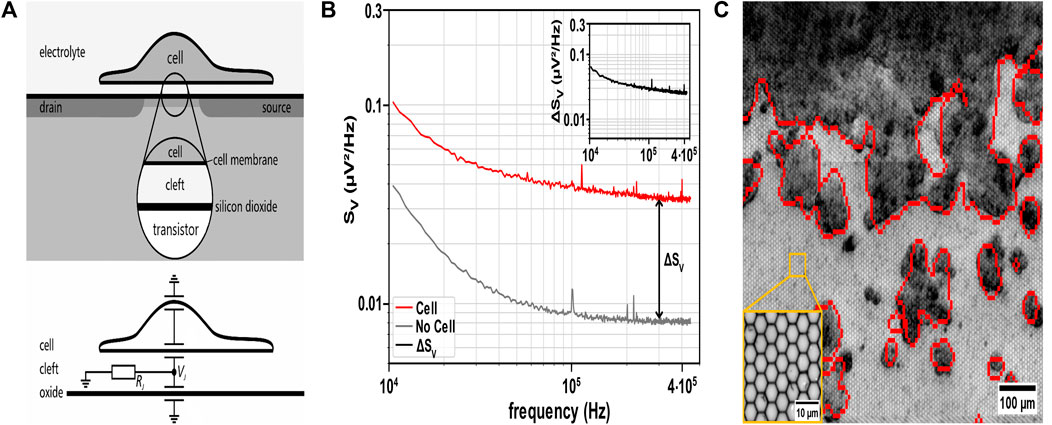
Figure 1. Principle of non-invasive detection of cell attachment using cell adhesion noise spectroscopy. (A) Top: Schematic cross-section of a cell adhered to the coated oxide surface of the recording sensor. The sensor comprises an open-gate field-effect transistor and is in contact with the electrolyte beneath the cell to record the extracellular voltage in the cleft between the cell and the chip. Bottom: Equivalent electric circuit of the cell-chip interface. The ionic current through the adherent cell membrane flows along the electrical cleft resistance RJ and enhances the voltage noise VJ (Fromherz, 1999), which characterizes the thermal noise of cell adhesion. Schematic and equivalent electric circuit adapted from (Voelker and Fromherz, 2006) with permission from SciPris on behalf of the American Physical Society. (B) Cell identification via cell adhesion noise (CAN) spectroscopy. A sensor must exceed the sum of ΔSV and the values of SV of bare sensors (i.e., background noise) to detect an adherent cell (SV analyzed at 300 kHz). Inset: Cell adhesion noise ΔSV obtained by subtracting SV (bare sensor) from total SV (red trace). (C) Overlay of electrically identified HT-29 cells (red contours) with brightfield microscopic image of the CMOS MEA with adherent HT-29 cells (dark grey/black: cell clusters, light grey: sensor sites in the background). Inset: ×50 magnification of sensor sites on the MEA.
We calibrated the CMOS MEA with the CAN-Q Acquisition software (Venneos GmbH) with default settings using an Ag/AgCl electrode (VWR International GmbH) as an external reference electrode in PBS (1X). The CAN-Q Acquisition software assessed the spectral power density SV at frequencies between 1 kHz and 450 kHz. The CMOS MEA recordings with PBS were calibrated to characterize the sensors’ background noise.
For the cell proliferation studies, we recorded the cells after the initial overnight adhesion time to the ECM protein (as described in 2.2) at 0 h, 24 h, 48 h, and 72 h. For the drug treatment studies, we changed the cell culture medium with a 5-FU-supplemented medium and recorded at 0 h, 24 h, 48 h, and 72 h (described in 2.2 and 2.3).
2.5 CASY cell counter and analyzer
The viability of the cells was additionally quantified using the CASY Cell Counter and Analyzer (OLS OMNI Life Science GmbH & Co. KG). CASY counts and analyzes the cells’ viability using Electronic Current Exclusion (Lindl et al., 2005) and Pulse Field Analysis. The cell size and viability are detected based on the electrical resistance of the cell membrane (Weinreich et al., 2014; Grintzalis et al., 2017).
We collected two samples for each chip: 1) cells attached to the chip and 2) cells floating in the culture medium (i.e., supernatant). The first cellular fraction was detached from the chip using 100 µL Accutase (Sigma-Aldrich GmbH) as a mild-acting enzyme (Quan et al., 2013; Chen et al., 2015; Skog et al., 2019; Nowak-Terpiłowska et al., 2021; Lai et al., 2022) after 10 min incubation at room temperature. The second cellular fraction was isolated from the medium. For that, we collected the chips medium and centrifuged the samples at 800 rpm for 5 min. Then, we removed the supernatant and resuspended the pellet in a 100 μL cell culture medium. To do the CASY measurements, 100 μL of each sample was diluted with 10 mL of CASYton buffer and loaded for measurement. A sample consisting only of medium without cells served as blank. The data were collected with a custom CASY® Excel program (Innovatis AG) and analyzed with GraphPad Prism 10 as described above.
2.6 Data processing for CMOS MEA noise analysis
The SV was analyzed as an electrical image with image processing techniques using the OpenCV Library via custom Python scripts. Firstly, we subtracted the SV of the bare electrodes (i.e., background noise) from the proliferation and drug treatment recordings to extract the cell adhesion noise (CAN), assuming uncorrelated noise sources (Zeitler et al., 2011). Secondly, the electrical image was grey-scaled and blurred with a Gaussian Blur filter to reduce the amount of image noise (i.e., single-pixel errors) to enhance the identification of objects of interest (i.e., cells and cell clusters) (Haralick and Shapiro, 1992). Thirdly, Otsu’s Binarization method determined the threshold for cell segmentation (Otsu, 1979). Finally, morphological operations (i.e., opening, closing) were performed to fine-tune the object detection and recognition. For drug treatment studies, we assumed that unhealthy or dead cells detach from the MEA (Frisch and Francis, 1994; Frisch and Screaton, 2001). This leads to a decline in adhesion noise that does not differ from the background noise. After these imaging processing steps, the number of sensors detecting cells estimated the cell-covered area.
2.7 Microscopy validation
Brightfield images with an upright light microscope (Zeiss Axioplan, ×10 objective, Carl Zeiss AG) related the electrically estimated cell positions to ground truth. For the CMOS MEA imaging, we reconstructed the whole microscopic image from individual image sections with the Fiji (Fiji is just ImageJ, version 1.54f, RRID: SCR_002285) plugin “Stitching” described in (Preibisch et al., 2009). Afterwards, we segmented the cell-covered area with the plugin “Trainable Weka Segmentation.” Brightfield images of 96-well plates were taken with an inverted microscope (Zeiss Axiovert 35, Carl Zeiss AG) with a ×10 objective.
3 Results
In this study, we assessed the effects of chemotherapeutic treatment with 5-Fluorouracil (5-FU) on 2D cell cultures using the label-free cell adhesion (CAN) analysis. The proliferation status and 5-FU-induced changes of colorectal cancer (CRC) cell line HT-29 and human dermal fibroblasts (HDFs) interfaced with the capacitive recording sites of the CMOS-based microelectrode arrays (MEAs) were recorded and analyzed over several days and across multiple MEAs.
3.1 Label-free detection of adherent cells by adhesion noise spectroscopy
To identify adherent cells, we recorded the voltage generated in the cleft between the cell membrane and the planar oxide surface. Previous studies demonstrated that the noise of the cleft can be used to infer the presence of adherent cells (Voelker and Fromherz, 2006; Zeitler et al., 2011; Zeitler and Fromherz, 2013). Details of the detection technique are described in the method section. We assessed voltage fluctuations in the adhesion area of non-electrogenic cells (like the CRC cell line HT-29 and HDFs) cultured on the MEA recording sites (i.e., electrolyte-oxide-silicon field-effect transistors) (Figure 1A). The resistive cleft below non-electrogenic cells gives rise to the adhesion voltage noise, allowing for distinguishing this value from that of a bare sensor site (Rocha et al., 2016; Ell, Zeitler, et al., 2023) (Figure 1B). Adherent cells are detected by estimating the SV spectrum. Comparing spectra from uncovered with cell-covered sensor sites, SV exhibits elevated values with cells attached, which is attributed to the resistive cleft. To assess the values of the resistive cleft from the voltage noise spectral power density (SV), we compared the estimate of electrical imaging to brightfield microscopy by overlay (Figure 1C). Figure 1B illustrates that cells adhered to sensor sites give rise to an increased SV across the entire frequency spectrum. Subtracting the SV of a bare sensor from the estimated SV in culture (i.e., sensors exposed to the electrolyte) provides the adhesion noise ΔSV (Figure 1B inset), assuming that the two noise sources are independent (Zeitler et al., 2011). Here, we identified the frequency range with a flat adhesion noise spectrum indicating a frequency-independent (i.e., resistive) cleft from 100 kHz to 450 kHz (Voelker and Fromherz, 2006). We selected a frequency value in the middle of this frequency range, i.e., 300 kHz, for all future analyses of ΔSV. From the adhesion noise plateau with an average amplitude of ΔSV = 0.027 µV2/Hz, we estimated the cleft resistance using Eq. 1 with a thermal energy kBT at incubation temperature (Zeitler and Fromherz, 2013).
Equation 1: Cleft resistance of the cell-transistor interface derived from noise spectrum. ΔSV denotes the cell adhesion noise, kBT refers to the thermal energy with the Boltzmann constant kB and incubation temperature T (Zeitler et al., 2011).
The cleft resistance Rcleft = 1.58 MΩ aligns with previous studies on neurons (Voelker and Fromherz, 2006). 1/f noise dominated the CAN for the SV data below 10 kHz frequency, which is attributed to the intrinsic setup noise and not used for further analysis here (Haartman and Östling, 2007; Viswam et al., 2018; Lausen et al., 2022). Undetected small structures on the sensor surface indicate poor cell attachment or dead cells. The exemplary Figure 1C and parts of Figure 3 demonstrate that adhesion voltage noise is a valuable parameter for the label-free detection of adherent cells. In the following, we assess to what degree ΔSV changes upon application of 5-FU to the cell culture.
3.2 Constant cell adhesion noise across culture time and cell types indicates stable adhesion
After extracting the cell adhesion noise (CAN) ΔSV from the total voltage noise, we compared ΔSV across sensors, time, cell types, and different CMOS MEAs employed at untreated and drug-treated (5-FU) states. Therefore, we (i) identified adherent cells by their ΔSV, (ii) calculated the mean ΔSV averaged over thousands of cell-identifying sensors (Figures 2A, B, grey dashed dots), (iii) plotted the ΔSV-traces of each CMOS MEA for the cultivation time of 72 h (Figures 2A, B, grey dashed lines), and (iv) estimated the mean and the standard deviation of all chips employed for both cell types (i.e., HT-29 CRC cells and HDFs) (Figures 2A, B, mean as bold green and pink line, standard deviation as error bars). Figure 2 compares the mean ΔSV (at 300 kHz frequency) of adherent untreated cell networks (top) to the mean spectrum of 5-FU-treated ones (bottom).
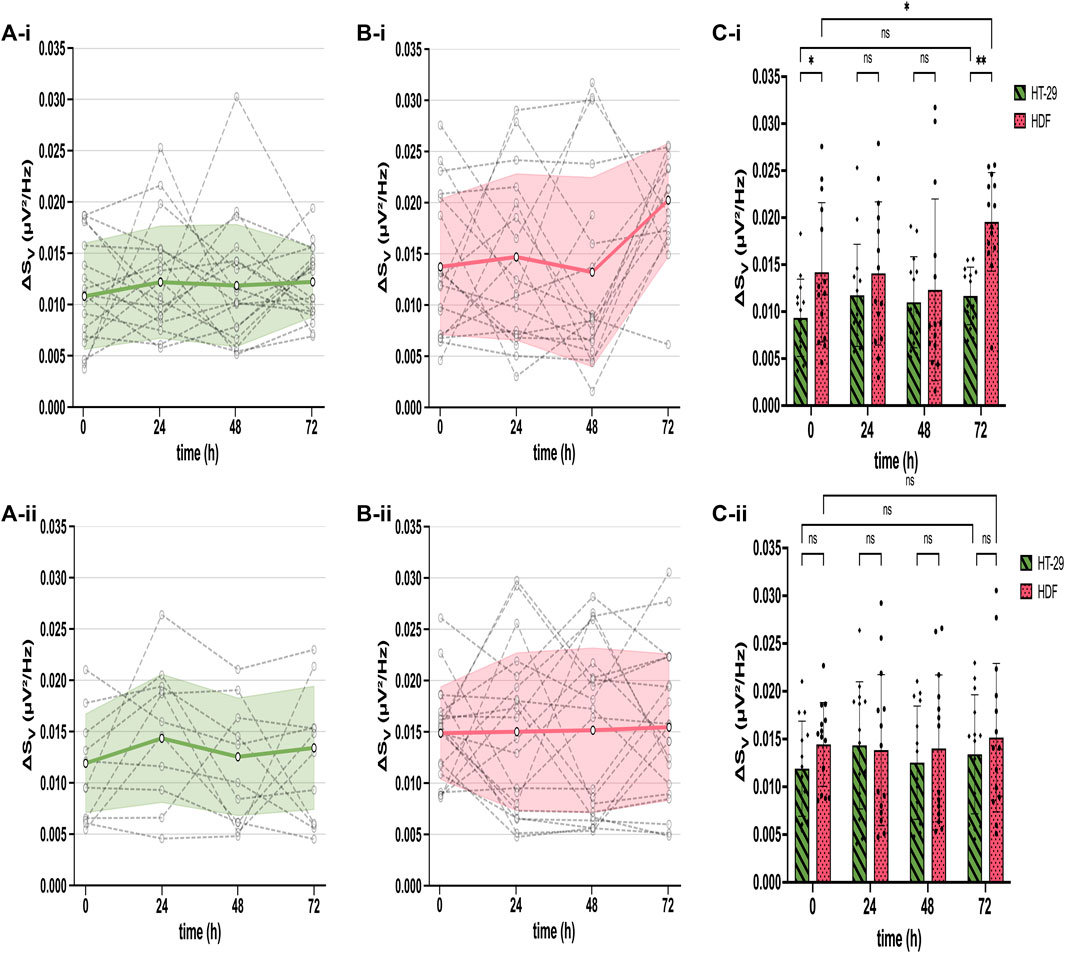
Figure 2. Stable cell adhesion inferred from mean ΔSV across different cultures (HT-29 and HDF), time points in culture, and different chips. (A) Constant ΔSV over time for untreated (A-i) and 5-FU-treated HT-29 cells (A-ii). Each dashed symbol represents the mean ΔSV calculated for all cell-detecting sensors on one chip. The dashed lines between symbols connect recordings obtained with the same chip. The bold green line constitutes the mean of all chips and the standard deviation of ΔSV is shown as error bars. (B) ΔSV for each chip (dashed lines with symbols) and mean with standard deviation error bars (bold pink line) of all chips over time for both untreated (B-i) and 5-FU-treated HDFs (B-ii). (C) Bars: mean ΔSV for untreated (green) and 5-FU treated (pink) HT-29 cells (C-i) and for HDFs (C-ii), respectively. Dots: ΔSV for each chip. Two-way ANOVA for statistical difference in ΔSV between HT-29 cells and HDFs. Asterisks: ns, not significant. *, p ≤ 0.05. **, p ≤ 0.01.
Untreated and 5-FU-exposed HT-29 cells exhibited a mean ΔSV between 0.009 µV2/Hz and 0.014 µV2/Hz with slightly higher variations of treated cells (Figure 2A). The ΔSV mean for untreated and 5-FU-treated HDFs remained constant until 48 h of cultivation between 0.012 µV2/Hz and 0.014 µV2/Hz (Figure 2B). After 72 h cultivation, ΔSV for untreated HDFs went up to 0.020 µV2/Hz with a statistical difference of p ≤ 0.01 (Figure 2C) while remaining constant for cells in 5-FU (Figures 2B, C). This longitudinal comparison demonstrates a stable interfacing for 72 h of the two cell cultures under test. We could not detect any significant differences except for HT-29 cells at 0 h and 72 h, which will be addressed in the discussion section. Given that ΔSV remains stable for adherent cells, we simplify our analysis and assign sensors with adherent cells as “positive” sensors and with no cells as “negative.” The total fraction of “positive” sensors is used in the following to quantify cell proliferation on a coated CMOS MEA surface.
3.3 Assessment of cell proliferation on coated substrates
Since the values of ΔSV do not change over time upon application of 5-FU (Figure 2), we assessed an additional feature provided by the cell-detecting sensors on the CMOS MEA: the cell-covered area. If the sensor area covered with adherent cells changes in control conditions in a different way than the cell-covered area upon treatment, we would have identified a potential indicator of the proliferation status. In the first experiment, we sought coating conditions where the cell-covered area increases over time.
We analyzed the Collagen and PLL effects on the viability and proliferation capacity of the CRC cell line HT-29 (Prockop and Kivirikko, 1995; Vitale et al., 2018). For that, the HT-29 cells were cultivated in a 2D monolayer in Collagen and PLL-coated 96-well plates and on CMOS MEA. Data from CCK-8 proliferation assay and CAN spectroscopy CMOS MEAs were collected. Cell Viability in %, optical density (OD), and the cell detection positive area per chip were quantitatively examined, as shown in Figure 3. Electrical imaging (red contours) was overlayed with brightfield microscopy imaging (grey background) (Figure 3A) and Figure 3B shows brightfield microscopy images of the cells in 96-well plates. After 2 days of cultivation, the HT-29 cells detached from the PLL-coated sensors while forming clusters and proliferating on Collagen-coated sensors, the same for cells in 96-well plates. We could draw two conclusions from the estimated cell detection positive area (Figure 3C): (i) initial HT-29 cell attachment is better in Collagen-coated plates (cell-covered area at 0 h: 47.5%) than in PLL-coated ones (cell-covered area at 0 h: 12.5%) and (ii) cell attachment dropped for cells growing on PLL after 2 days of cultivation (cell-covered area decreased at 48 h to 5.2%) whereas Collagen enhanced cell attachment and proliferation (cell-covered area at 48 h: 77.0%).
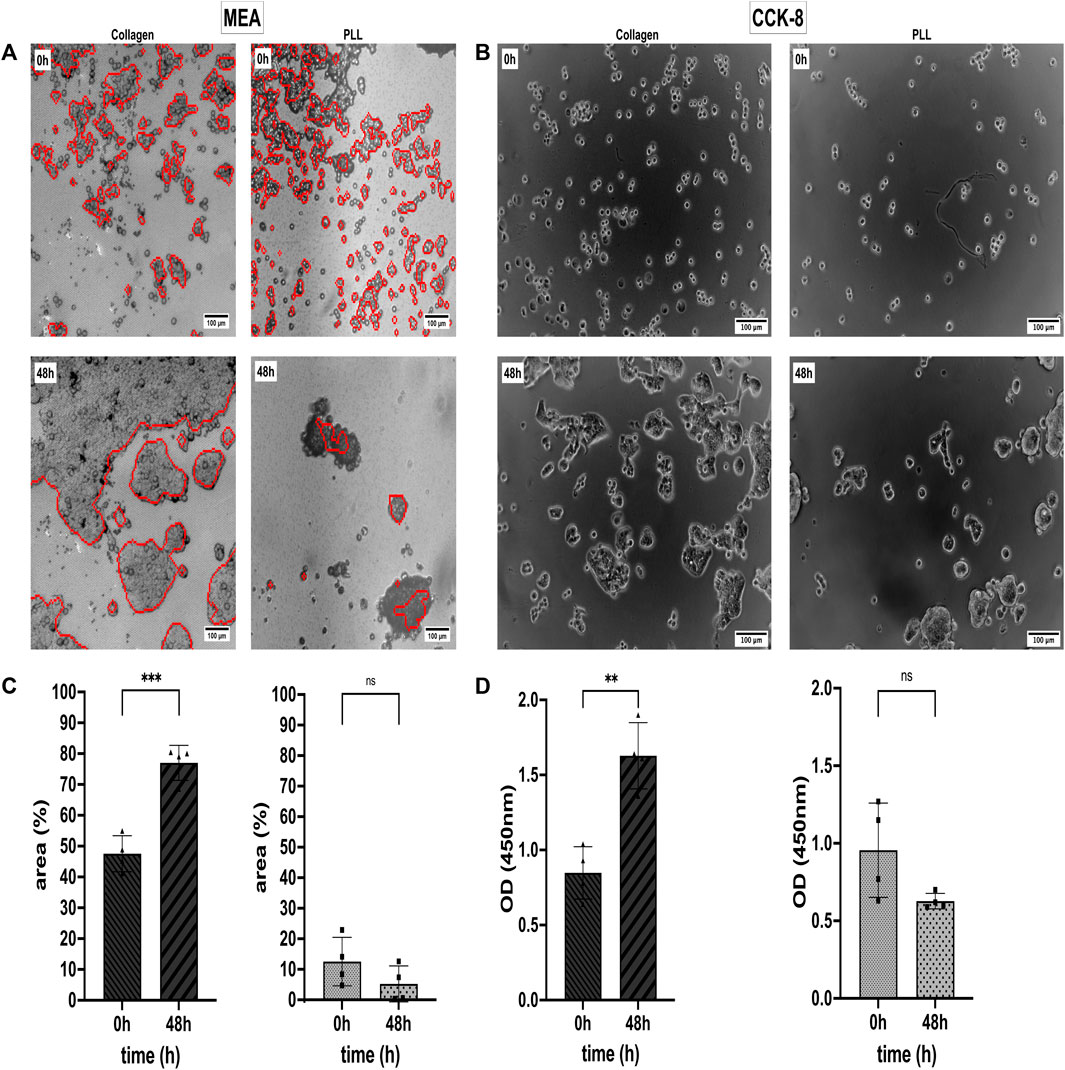
Figure 3. Cell attachment, viability, and proliferation status of the colorectal cancer (CRC) cell line HT-29 on Collagen type I and Poly-L-lysine (PLL). (A) Cell adhesion noise (CAN) spectroscopy electrically images adherent cells (red contours) on CMOS-based microelectrode arrays (MEAs). Electrical and brightfield microscopy (greyscale) images overlay for optical validation of the electrical data. (B) Optical study of HT-29 proliferation in 96-well plates using Collagen and PLL coating. (C) Mean area covered by adherent cells on Collagen (left) and PLL (right). Statistical comparison: unpaired t-test. (D) Analysis of HT-29 Cell Viability via CCK-8 assay. As in (B), the left subplot shows cell viability on Collagen-I-coated substrate and the right subplot shows cell viability on a PLL-coated substrate. Statistics: unpaired t-test. Asterisks denote statistical significance of the indicated comparisons (n = 4; ns, not significant. *, p ≤ 0.05. **, p ≤ 0.01. ***, p ≤ 0.001. ****, p ≤ 0.0001).
The CCK-8 assay allows us to evaluate the % of metabolic active cells in culture. Dehydrogenases in alive cells can reduce WST-8 [2- (2- methoxy-4-nitrophenyl)-3-(4-nitrophenyl)-5-(2, 4-disulfophenyl)-2H-tetrazolium, monosodium salt] to a water-soluble orange dye known as formazan. The amount of formazan produced correlates with the number of viable cells and can be measured with an absorbance microplate reader at 450 nm (Cai et al., 2019). In Figure 3D, it is shown that the OD increased by 1.9-fold from 0.85 at 0 h to 1.63 OD after 48 h of cultivation on Collagen. For cells growing on PLL, the OD dropped not significantly by 1.9-fold from 0.96 at 0 h to 0.63 OD after 48 h (Figures 3B, D).
HT-29 cells growing on Collagen showed constant ΔSV values over time, but the cells’ ΔSV showed variations when growing on PLL-coated MEAs (Supplementary Figure S1). Supplementary Figure S2 relates the two coatings (i.e., Collagen and PLL) to uncoated 96-well plates as control group with statistical significance p ≤ 0.01 at initial cell attachment (0 h) and p ≤ 0.0001 after 48 h of cultivation. Supplementary Figure S3 compares cell segmentation of electrical imaging with brightfield microscopy imaging with non-significant differences in the cell-covered area of the CMOS MEAs but slightly higher rates for microscopic images.
3.4 Assessing the effect of the chemotherapeutic drug 5-FU on cell adhesion
Based on the positive adhesion results, we used Collagen-I to evaluate the response of colorectal cancer cells HT-29 and non-cancerous HDF cells to the anti-cancer drug 5-FU. 5-FU has a cytotoxic effect on HT-29 cells, leading to cell apoptosis (Mhaidat et al., 2014). Consequently, cells undergoing cell death metabolize less or no WST-8 dye, which results in lower optical density (OD) for CCK-8 assay. Similarly, these cells detach from the MEA and will not be detected by the sensors. Hence, we correlated cell viability and apoptosis with OD and the area that is covered by adherent cells (Ell, Bui, et al., 2023). CASY recorded the cell viability of cells attached to the CMOS MEA surface and cells floating in the cell culture medium.
Untreated HT-29 cells growing on the Collagen-coated MEA proliferated and the area covered by adherent cells doubled after 72 h in culture (Figure 4A-i). However, after treating the HT-29 cells with 5-FU, approximately half of the cells detached from the chip and the cell-covered CMOS MEA area declined by 1.8-fold after 72 h exposure time (Figure 4A-ii). Figure 4A-iii shows statistical significance p ≤ 0.01 for untreated and 5-FU-treated HT-29 cells after 72 h with less cell-covered area (54%–22%), while a shorter exposure time to 5-FU for 24 h led to a larger cell-covered area (28%–40%). The ODs for the HT-29 cells matched the CAN-based areas: untreated HT-29 cells showed a 2.5-fold higher OD at 72 h compared with 24 h (Figure 4C-i), whereas HT-29 cells exposed to 5-FU showed a decline in OD by 2.2-fold (Figure 4C-ii). The agreement between CAN and OD value is, however, detected only after 72 h for HT-29 cells.
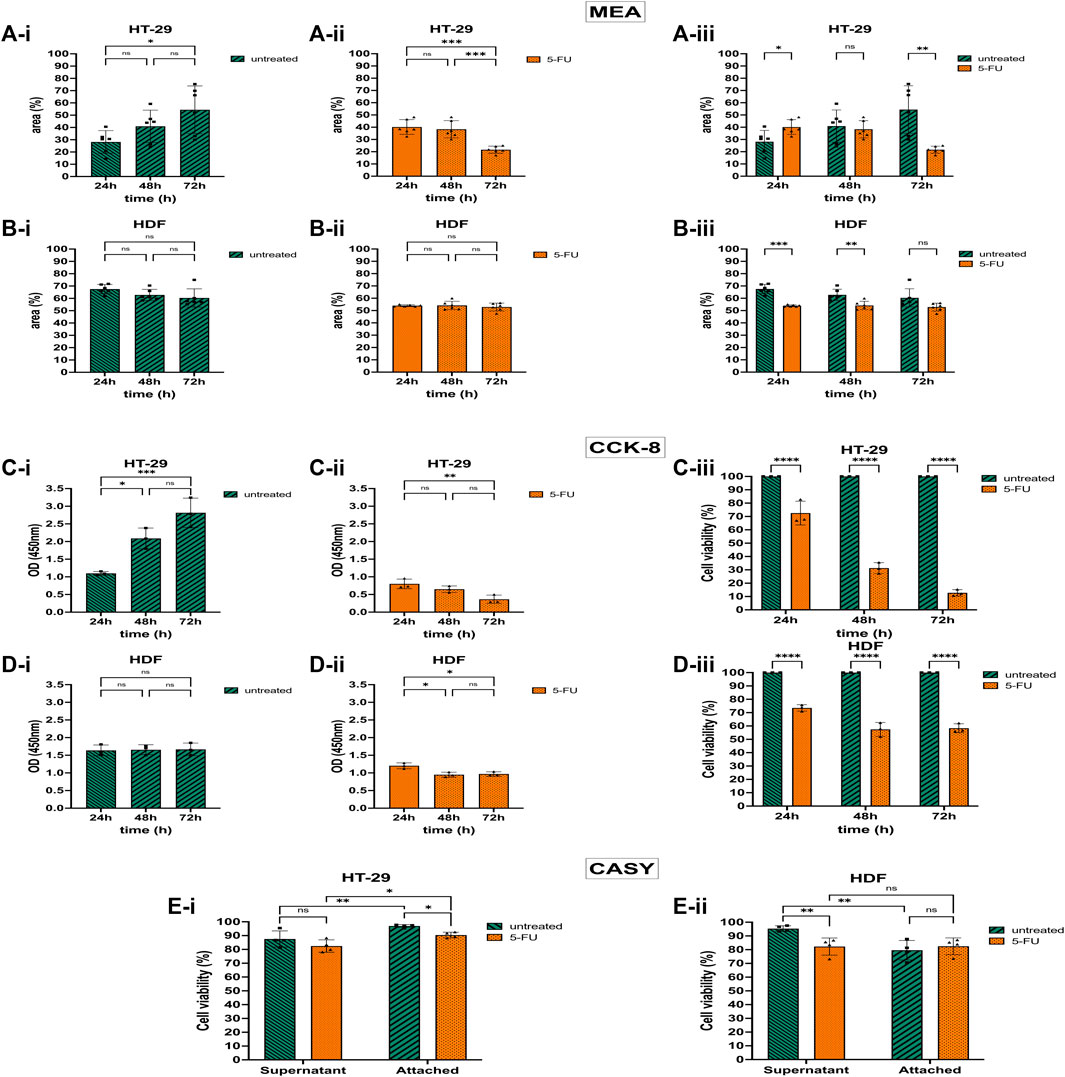
Figure 4. 5-Fluorouracil (5-FU) with cytotoxic and detachment-enhancing effect on the colorectal cancer cell (CRC) line HT-29 but without effect on human dermal fibroblast (HDF) cell viability and proliferation. (A) 5-FU effects via CAN spectroscopy on HT-29 cells cultivated on the CMOS MEA (analyzed at 300 kHz). Untreated HT-29 grew on the CMOS MEA and the cell-covered area rose (A-i). After 5-FU treatment, the detection positive area declined after 72 h of cultivation (A-ii). Statistics (A-i,A-ii): one-way ANOVA. Statistical difference of the cell-covered area between untreated and treated HT-29 (A-iii). Statistics (A-iii): two-way ANOVA. (B) 5-FU effects via CAN spectroscopy on HDF cells cultivated on the CMOS MEA (analyzed at 300 kHz). Untreated and treated HDFs showed a stagnant CMOS MEA area where cells are adhered to (B-i,B-ii). Statistics (B-i,B-ii): one-way ANOVA. CMOS MEA area covered by HDFs (B-iii). Statistics (B-iii): two-way ANOVA. (C) 5-FU effects on HT-29 cells via CCK-8 assay. Untreated HT-29 cells’ optical density (OD) increased during 72 h cultivation time (C-i), while 5-FU treated cells’ OD declined (C-ii). (D) 5-FU effects on HDF cells via CCK-8 assay. For HDFs, the OD stays constant without (D-i) and with 5-FU treatment (D-ii). Statistics: one-way ANOVA. (C-iii,D-iii) compared cell viability of treated cells with untreated cells as control group. Treated cells showed less cell viability for both cell types [HT-29 (C-iii) and HDF (D-iii)]. Statistics: two-way ANOVA. (E) Cell viability from CASY recordings of treated and untreated HT-29 in the supernatant and on the chip (E-i). Same for HDFs (E-ii). Two-way ANOVA. Statistical significance is indicated by asterisks (nHT-29 = 4, nHDF = 4, ns, not significant. *, p ≤ 0.05. **, p ≤ 0.01. ***, p ≤ 0.001. ****, p ≤ 0.0001).
While 5-FU caused cell detachment on the CMOS MEA and a lowered metabolic activity in the CKK-8 assay for the HT-29 cells, the HDFs’ proliferation status was altered differently: the CMOS MEA’s positive cell detection area for untreated HDFs was on a constant level (Figure 4B-i) and also the OD did not change (Figure 4D-i). For the 5-FU-treated HDFs, the cell-covered area remained constant over 72 h (Figure 4B-ii). The OD decreased within the first 24 h of 5-FU exposure and stagnated for the remaining culture time (Figure 4D-ii). Untreated HDFs showed a slight decrease in cell-covered area (Figure 4B-i), while treated ones remained on a constant coverage over time (Figure 4B-ii). Figure 4B-iii indicates a statistical difference of p ≤ 0.001 for 24 h and p ≤ 0.01 for 48 h, but no significance for 72 h by analyzing the cell-covered area. The cell viability lowered upon 5-FU application to 74% after 24 h, 57% after 48 h, and 58% after 72 h drug exposure time with p ≤ 0.0001 (Figure 4D-iii).
CASY results in Figure 4E-i show elevated cell viability for untreated HT-29 cells compared with 5-FU-treated cells in the supernatant. HT-29 cells adhered to the MEA exhibited significantly higher cell viability than in the supernatant with p ≤ 0.01 (untreated) and p ≤ 0.05 (treated). CASY recorded higher viability for untreated HDFs in the supernatant than for 5-FU-exposed ones with p ≤ 0.01 (Figure 4E-ii). Untreated as well as treated CMOS MEA-adherent HDFs remained at the same viability level.
4 Discussion
In this study, a label-free, time-continuous electric detection method is presented, which enabled the assessment of chemotherapeutic effects on two different cell cultures (colorectal cancer (CRC) cell line HT-29 and human dermal fibroblasts HDFs). The electric detection of cell adhesion voltage noise has been validated by microscopy and with commercial reference methods, such as Cell Counting Kit-8 (CCK-8) and CASY Cell Counter and Analyzer.
In the following lines, we discuss the results obtained using cell adhesion noise (CAN) in comparison with the reference methods from a technical perspective and biological context. We furthermore address shortcomings and point towards improvements that may be addressed in future work.
To analyze the adhesion noise across sensors, MEA chips, time, and cell types, the CAN spectra were averaged over thousands of sensors and the standard deviation was determined for both HT-29 CRC cells and HDFs detecting sensors. Our reported cleft resistance RJ, estimated with Eq. 1, is in accordance with prior studies on the neuron-transistor interface (Voelker and Fromherz, 2006). HDFs showed a slightly elevated CAN compared to HT-29 in both conditions (5-FU-treated and untreated). According to the model of a circular core-coat conductor of a cell-solid junction, as proposed in (Zeitler and Fromherz, 2013), ΔSV is dominated by three free parameters: the sheet resistance rJ at low frequency (<1 kHz), the effective cell capacitance cM (frequency range: 1 kHz–1 MHz) or the cytoplasmic resistivity ρcyt at high frequency (>1 MHz). Additionally, ΔSV depends on the given parameters, such as the sensor radius, adhesion area, and the thermal energy kBT, as shown in (Zeitler and Fromherz, 2013). Given the bath resistivity of ρE = 66.7 Ω cm, we calculate the cytoplasmic resistivity to 937 Ω cm for HDFs and 803 Ω cm for HT-29. However, HDFs are bigger than HT-29 cells (Coumans et al., 2013; Tai et al., 2022) and should therefore show higher ΔSV values. Further research could focus on tumor cells altering the cell adhesion molecules (Harjunpää et al., 2019) to better understand the effects on cytoplasm resistivity. Additionally, investigating the actual membrane-oxide surface distance with, e.g., fluorescence interference contrast (FLIC) microscopy could provide more insight into the sheet resistance influence (Iwanaga et al., 2001; Fromherz, 2002; Schoen and Fromherz, 2007; Zeitler and Fromherz, 2013).
The average values of ΔSV did neither change over time nor upon application of 5-FU except for HT-29 cells at 0 h and 72 h. Integrins as transmembrane proteins mediate cell adhesion to the extracellular matrix (ECM) by spanning the plasma membrane (Santini et al., 2000). This cell adhesion through integrins stimulates numerous signaling pathways, including ion channel activation. Therefore, ion channels that may stochastically open and close can generate current fluctuations (Siebenga et al., 1973) giving rise to the voltage noise in the cleft. Since integrin functions can be dynamically regulated by combinations of conformational changes and cells clustering (Dedhar, 1999), initial cell attachment at 0 h can alter the CAN significantly (Figure 2C). Not only cell attachment but also cell death by cell detachment [i.e., anoikis (Frisch and Francis, 1994; Frisch and Screaton, 2001)] is regulated mainly through integrins. Hence, apoptosis-induced cell detachment is accompanied by the loss of structural links of the ECM to the cell. These active membrane processes can cause mechanical fluctuations, which are recorded with CAN spectroscopy (Seifert, 1994; Prost and Bruinsma, 1996; Voelker and Fromherz, 2006). We quantified the cells’ proliferation status on a coated CMOS MEA substrate with the total fraction of cell-detecting (i.e., “positive”) sensors. The estimated positions of the cells (“positive” sensors) on the MEA aligned with microscopic brightfield images with high accuracy (Figure 1C).
To enable favorable conditions for the cell culture on the CMOS MEAs, we first compensated for the hydrophobic surface of the MEA’s surface oxide (Bae et al., 2019) by coating it with an extracellular matrix (ECM) protein or with a synthetic polymer. Cell interactions with the extracellular matrix (ECM) are vital for cell adhesion, migration, and growth (Cruz Walma and Yamada, 2020). ECM proteins like Collagen Type I and synthetic polymers like Poly-L-lysine (PLL) ensure surface cell adhesion in vitro (Vitale et al., 2018). Besides, Collagen-I is the most abundant type of Collagen in the tissues and plays a main role in cell normal cell biology and metastasis (De Martino and Bravo-Cordero, 2023). The common coating polymer in neuroscientific applications, Poly-L-lysine, caused a decline in the cells’ metabolic activity, resulting in a lower optical density (OD) than cells cultivated on Collagen (Figure 3D). Previous studies indicated PLL’s cytotoxic, apoptotic, and genotoxic effects on mammalian cells (Alinejad-Mofrad et al., 2019). Additionally, ECM proteins can rescue cells from anoikis, but surfaces coated with PLL cannot (Meredith et al., 1993; Frisch and Ruoslahti, 1997). In contrast, Collagen as the major component for ECM (Kallis and Friedman, 2018) promoted cell adhesion and proliferation (Mainardi et al., 1980; Greco et al., 1998; Somaiah et al., 2015) with OD increasing over time. For the CMOS MEA recordings, we assume that unhealthy or dead cells detach from the MEA (Frisch and Francis, 1994; Frisch and Screaton, 2001) with a decline in cell adhesion noise below the cell identification threshold. Thus, proliferative cells on Collagen covered a larger area on the MEA than cells on PLL with lowered metabolic activity (Figure 3C). Brightfield microscopy confirmed the positive impact of Collagen (i.e., higher cell-covered area) and the negative impact of PLL (i.e., lower cell-covered area) on cell viability cultivated on the MEA (Figures 3A, B). An immediate future study could focus on how different coatings and coating concentrations alter cell adhesion (like PLL’s concentration-dependent cytotoxicity, as reported in (Alinejad-Mofrad et al., 2019)). Additionally, since cancer cells have an altered glycocalyx structure, cell adhesion receptors (e.g., integrins) as part of the glycocalyx could be investigated for a better understanding of ECM protein-cancer cell adhesion interactions (Burridge et al., 1988; Hollingsworth and Swanson, 2004; Xu et al., 2016; Kanyo et al., 2020). Moreover, analyzing the distribution of the chip coatings over the MEA surface (e.g., using mass spectrometric bio- and polymer analysis) could explain the variability of the initial cell attachment (Figure 3C).
Next, the area of the sensor array covered by adherent cells was related to cell proliferation as an indicator of the health status with and without drug treatment. While untreated HT-29 cells proliferated thereby increasing MEA coverage and leading to higher OD, 5-FU-exposed HT-29 cells detached after 48 h of cultivation with a significant reduction of metabolic activity via CCK-8 (Figure 4A). As opposed to the HT-29 cells, 5-FU did not cause a lowered cell proliferation on HDFs via CAN spectroscopy but remained constant (Figure 3B). The shorter doubling time of HT-29 cells (Forgue-Lafitte et al., 1989; Frant et al., 2022) compared to HDFs (Zhu et al., 2004; Endt et al., 2010; Rorteau et al., 2022) may lead to a higher 5-FU-uptake, resulting in stronger proliferation-reducing effects of drug treatment. However, the HDFs’ metabolic activity in the CCK-8 assay in the 5-FU-supplemented medium dropped after 24 h of exposure and stayed constant for the remaining time (Figure 3B). This could indicate that the primary cell line reduces its proliferative capacity but not its viability (Krtolica et al., 2001). An immediate future work could focus on drug concentration-dependent cell viability studies to calculate the GI50, TGI, and LC50 to compare with the NCI 60 cell-line screening panel (Chabner, 2016; Developmental Therapeutics Program, 2021).
We recorded the viability using CASY Cell Counter and Analyzer for the experimental end time point because significant changes in the cell-covered area occurred after 72 h of 5-FU exposure (Figure 4B). CASY recorded high viability for both cells on the MEA and in the supernatant. The high cell viability on the MEA is in accordance with the elevated SV due to cell adhesion accounting for healthy status. In contrast, the high viability of the detached cells (i.e., floating cells in the supernatant) could be explained by cells being in an early stage of apoptosis. During an apoptotic process, adherens junctions are destructed, and adhesive complexes are destabilized (Suzanne and Steller, 2009). Therefore, cells start to detach but are not recorded as dead cells. Supplementary Figure S4 shows the same behavior after 5 days (i.e., 120 h) of 5-FU-treatment.
Our MEA technique provides one of the smallest electrode separations (∼6 µm) and therefore highest spatial resolution reported in literature [reviewed in (Iyer et al., 2023), but see (Laborde et al., 2015; Widdershoven et al., 2018)] enabling the non-invasive detection of non-electrogenic single cells, but also cell network studies. CAN spectroscopy electrically images only viable cells that are attached to the CMOS MEA’s oxide surface, while brightfield microscopy images all cells present on the chip adhered or not. Moreover, the method is label-free in contrast to fluorescence microscopy, which also images viable cells with subcellular resolution (Supplementary Figure S5). A related method to CAN spectroscopy is the electrochemical impedance spectroscopy (EIS) (Viswam et al., 2017; Abbott et al., 2022). While the readout (extracellular voltage) is identical for both methods, EIS requires AC stimulation and may thus be considered somewhat more invasive, depending on the implementation. In contrast, EIS offers a richer readout, given that different readout configurations (2-point, 4-point measurements) are feasible. In future work, the high spatial resolution may be explored further when analyzing the effects of different agents on the cell-covered area.
Overall, this new application of CMOS MEAs is in good agreement with the commercially available biological assay Cell-Counting Kit-8 (Figure 3B). Moreover, we gained further insight into the cells’ health status with the electrical cell counter CASY by studying the detachment behavior of cells already in the early stages of apoptosis (Figure 3C). In conclusion, CAN spectroscopy is label-free, non-invasive, and demonstrates high accordance with the CCK-8 assay over many days of culture via high spatiotemporal resolution to be used for drug screening studies. In conclusion, CAN spectroscopy combines the advantages of brightfield microscopy, impedance spectroscopy, CMOS technology, and biological assays to complement existing drug screening techniques: label-free, non-invasive, and fast electrical imaging with subcellular resolution at high accuracy over many days of culture.
Data availability statement
The original contributions presented in the study are included in the article/Supplementary Material, further inquiries can be directed to the corresponding authors.
Ethics statement
Ethical approval was not required for the studies on humans in accordance with the local legislation and institutional requirements because only commercially available established cell lines were used.
Author contributions
ME: Conceptualization, Data curation, Formal Analysis, Investigation, Methodology, Resources, Software, Validation, Visualization, Writing–original draft, Writing–review and editing. MB: Data curation, Investigation, Visualization, Writing–review and editing. SK: Data curation, Investigation, Visualization, Writing–review and editing. GZ: Conceptualization, Funding acquisition, Investigation, Supervision, Visualization, Writing–review and editing. SP-L: Conceptualization, Data curation, Formal Analysis, Funding acquisition, Investigation, Methodology, Project administration, Resources, Software, Supervision, Validation, Visualization, Writing–original draft, Writing–review and editing.
Funding
The author(s) declare that financial support was received for the research, authorship, and/or publication of this article. The authors acknowledge TU Wien Bibliothek for financial support through its Open Access Funding Programme. This work was partially supported by funding through the IRA-SME project ELEVATE (FFG Grant No. 895365) to GZ and SPL.
Conflict of interest
The authors declare that the research was conducted in the absence of any commercial or financial relationships that could be construed as a potential conflict of interest.
The author(s) declared that they were an editorial board member of Frontiers, at the time of submission. This had no impact on the peer review process and the final decision.
Publisher’s note
All claims expressed in this article are solely those of the authors and do not necessarily represent those of their affiliated organizations, or those of the publisher, the editors and the reviewers. Any product that may be evaluated in this article, or claim that may be made by its manufacturer, is not guaranteed or endorsed by the publisher.
Supplementary material
The Supplementary Material for this article can be found online at: https://www.frontiersin.org/articles/10.3389/fbioe.2024.1385730/full#supplementary-material
References
Abbott, J., Mukherjee, A., Wu, W., Ye, T., Jung, H. S., Cheung, K. M., et al. (2022). Multi-parametric functional imaging of cell cultures and tissues with a CMOS microelectrode array. Lab a Chip 22 (7), 1286–1296. doi:10.1039/d1lc00878a
Akalovich, S., Portyanko, A., Pundik, A., Mezheyeuski, A., and Doroshenko, T. (2021). 5-FU resistant colorectal cancer cells possess improved invasiveness and βIII-tubulin expression. Exp. Oncol. 43 (2), 111–117. doi:10.32471/exp-oncology.2312-8852.vol-43-no-2.16314
Alinejad-Mofrad, E., Malaekeh-Nikouei, B., Gholami, L., Mousavi, S. H., Sadeghnia, H. R., Mohajeri, M., et al. (2019). Evaluation and comparison of cytotoxicity, genotoxicity, and apoptotic effects of poly-l-lysine/plasmid DNA micro- and nanoparticles. Hum. Exp. Toxicol. 38 (8), 983–991. doi:10.1177/0960327119846924
Amin, H., Nieus, T., Lonardoni, D., Maccione, A., and Berdondini, L. (2017). High-resolution bioelectrical imaging of Aβ-induced network dysfunction on CMOS-MEAs for neurotoxicity and rescue studies. Sci. Rep. 7 (1), 2460. doi:10.1038/s41598-017-02635-x
Angotzi, G. N., Malerba, M., Boi, F., Miele, E., Maccione, A., Amin, H., et al. (2018). A synchronous neural recording platform for multiple high-resolution CMOS probes and passive electrode arrays. IEEE Trans. Biomed. Circuits Syst. 12 (3), 532–542. doi:10.1109/TBCAS.2018.2792046
Bae, J., Samek, I. A., Stair, P. C., and Snurr, R. Q. (2019). Investigation of the hydrophobic nature of metal oxide surfaces created by atomic layer deposition. Langmuir 35 (17), 5762–5769. doi:10.1021/acs.langmuir.9b00577
Bertotti, G., Velychko, D., Dodel, N., Keil, S., Wolansky, D., Tillak, B., et al. (2014). “A CMOS-based sensor array for in-vitro neural tissue interfacing with 4225 recording sites and 1024 stimulation sites,” in 2014 IEEE biomedical circuits and systems conference (BioCAS) proceedings, 304–307. doi:10.1109/BioCAS.2014.6981723
Bradski, G. (2000). The OpenCV library. Dr. Dobb’s J. Softw. Tools, 122–125. Available at: https://www.scirp.org/reference/ReferencesPapers?ReferenceID=1692176.
Burridge, K., Fath, K., Kelly, T., Nuckolls, G., and Turner, C. (1988). Focal adhesions: transmembrane junctions between the extracellular matrix and the cytoskeleton. Ann. Rev. Cell. Bioi 4, 487–525. doi:10.1146/annurev.cb.04.110188.002415
Cai, L., Qin, X., Xu, Z., Song, Y., Jiang, H., Wu, Y., et al. (2019). Comparison of cytotoxicity evaluation of anticancer drugs between real-time cell analysis and CCK-8 method. ACS Omega 4 (7), 12036–12042. doi:10.1021/acsomega.9b01142
Chabner, B. A. (2016). NCI-60 cell line screening: a radical departure in its time. J. Natl. Cancer Inst. 108 (5), djv388. doi:10.1093/jnci/djv388
Chen, S., So, E. C., Strome, S. E., and Zhang, X. (2015). Impact of detachment methods on M2 macrophage phenotype and function. J. Immunol. Methods 426, 56–61. doi:10.1016/j.jim.2015.08.001
Cojocaru, A. E., Corna, A., Reh, M., and Zeck, G. (2022). High spatial resolution artificial vision inferred from the spiking output of retinal ganglion cells stimulated by optogenetic and electrical means. Front. Cell. Neurosci. 16, 1033738. doi:10.3389/fncel.2022.1033738
Coumans, F. A. W., van Dalum, G., Beck, M., and Terstappen, L. W. M. M. (2013). Filter characteristics influencing circulating tumor cell enrichment from whole blood. PLoS ONE 8 (4), e61770. doi:10.1371/journal.pone.0061770
Cruz Walma, D. A., and Yamada, K. M. (2020). The extracellular matrix in development. Dev. Camb. 147 (10), dev175596. doi:10.1242/dev.175596
Dedhar, S. (1999). Integrins and signal transduction. Curr. Opin. Hematol. 6 (1), 37–43. doi:10.1097/00062752-199901000-00007
De Martino, D., and Bravo-Cordero, J. J. (2023). Collagens in cancer: structural regulators and guardians of cancer progression. Cancer Res. 83 (9), 1386–1392. doi:10.1158/0008-5472.CAN-22-2034
Developmental Therapeutics Program (2021). NCI-60 screening methodology. Available at: https://dtp.cancer.gov/discovery_development/nci-60/methodology.htm.
Eickenscheidt, M., Jenkner, M., Thewes, R., Fromherz, P., and Zeck, G. (2012). Electrical stimulation of retinal neurons in epiretinal and sub retinal configuration using a multi capacitor array. J. Neurophysiology 107 (10), 2742–2755. doi:10.1152/jn.00909.2011
Eickenscheidt, M., and Zeck, G. (2014). Action potentials in retinal ganglion cells are initiated at the site of maximal curvature of the extracellular potential. J. Neural Eng. 11 (3), 036006. doi:10.1088/1741-2560/11/3/036006
Ell, M., Bui, M. T., Prado-Lopez, S., and Zeck, G. (2023). Electrical recording of effects of chemotherapeutic treatment on cancer spheroids. Proc. IEEE Sensors, 1–4. doi:10.1109/SENSORS56945.2023.10325119
Ell, M., Zeitler, R., Thewes, R., and Zeck, G. (2023). “Label-free identification of nonelectrogenic cancer cells using adhesion noise,” in 2023 IEEE BioSensors conference (London: BioSensors 2023 - Proceedings), 1–4. doi:10.1109/BioSensors58001.2023.10280952
Emery, B. A., Hu, X., Khanzada, S., Kempermann, G., and Amin, H. (2023). High-resolution CMOS-based biosensor for assessing hippocampal circuit dynamics in experience-dependent plasticity. Biosens. Bioelectron. 237, 115471. doi:10.1016/j.bios.2023.115471
Emery, B. A., Hu, X., Maugeri, L., Khanzada, S., Klutsch, D., Altuntac, E., et al. (2022). “Large-scale multimodal recordings on a high-density neurochip: olfactory bulb and hippocampal networks,” in Proceedings of the annual international conference of the IEEE engineering in medicine and biology society, EMBS, 2022-july, 3111–3114. doi:10.1109/EMBC48229.2022.9871961
Endt, H., Sprung, C. N., Keller, U., Gaipl, U., Fietkau, R., and Distel, L. V. (2010). Detailed analysis of DNA repair and senescence marker kinetics over the life span of a human fibroblast cell line. Journals Gerontology - Ser. A Biol. Sci. Med. Sci. 66A (4), 367–375. doi:10.1093/gerona/glq197
Feitelson, M. A., Arzumanyan, A., Kulathinal, R. J., Blain, S. W., Holcombe, R. F., Mahajna, J., et al. (2015). Sustained proliferation in cancer: mechanisms and novel therapeutic targets. Seminars Cancer Biol. 35, S25–S54. doi:10.1016/j.semcancer.2015.02.006
Fohlen, A., Bordji, K., Assenat, E., Gongora, C., Bazille, C., Boulonnais, J., et al. (2021). Anticancer drugs for intra-arterial treatment of colorectal cancer liver metastases: in-vitro screening after short exposure time. Pharmaceuticals 14 (7), 639. doi:10.3390/ph14070639
Forgue-Lafitte, M.-E., Coudray, A.-M., Bréant, B., and Mester, J. (1989). Proliferation of the human colon carcinoma cell line HT29: autocrine growth and deregulated expression of the c-myc Oncogene1. Available at: https://pubmed.ncbi.nlm.nih.gov/2684395/.
Frant, M. P., Trytek, M., and Paduch, R. (2022). Assessing the in vitro activity of selected porphyrins in human colorectal cancer cells. Molecules 27 (6), 2006. doi:10.3390/molecules27062006
Frisch, S. M., and Francis, H. (1994). Disruption of epithelial cell-matrix interactions induces apoptosis. J. Cell. Biol. 124 (4), 619–626. doi:10.1083/jcb.124.4.619
Frisch, S. M., and Ruoslahti, E. (1997). Integrins and anoikis. Curr. Opin. Cell. Biol. 9 (5), 701–706. doi:10.1016/S0955-0674(97)80124-X
Frisch, S. M., and Screaton, R. A. (2001). Anoikis mechanisms. Curr. Opin. Cell. Biol. 13 (5), 555–562. doi:10.1016/S0955-0674(00)00251-9
Fromherz, P. (1999). Extracellular recording with transistors and the distribution of ionic conductances in a cell membrane. Eur. Biophysics J. 28, 254–258. doi:10.1007/s002490050206
Fromherz, P. (2002). Electrical interfacing of nerve cells and semiconductor chips. ChemPhysChem 3 (3), 276–284. doi:10.1002/1439-7641(20020315)3:3<276::AID-CPHC276>3.0.CO;2-A
Greco, R. M., Iocono, J. A., and Ehrlich, H. P. (1998). Hyaluronic acid stimulates human fibroblast proliferation within a collagen matrix. J. Cell. Physiology 177 (3), 465–473. doi:10.1002/(SICI)1097-4652(199812)177:3<465::AID-JCP9>3.0.CO;2-5
Grintzalis, K., Dai, W., Panagiotidis, K., Belavgeni, A., and Viant, M. R. (2017). Miniaturising acute toxicity and feeding rate measurements in Daphnia magna. Ecotoxicol. Environ. Saf. 139, 352–357. doi:10.1016/j.ecoenv.2017.02.002
Haartman, M. von, and Östling, M. (2007). “1/F noise in mosfets,” in Low-frequency noise in advanced mos devices (Netherlands: Springer), 53–102. doi:10.1007/978-1-4020-5910-0_3
Hanahan, D., and Weinberg, R. A. (2011). Hallmarks of cancer: the next generation. Cell. 144 (5), 646–674. doi:10.1016/j.cell.2011.02.013
Harjunpää, H., Asens, M. L., Guenther, C., and Fagerholm, S. C. (2019). Cell adhesion molecules and their roles and regulation in the immune and tumor microenvironment. Front. Media S.A 10 (5), 1078. doi:10.3389/fimmu.2019.01078
Hierlemann, A., Frey, U., Hafizovic, S., and Heer, F. (2011). Growing cells atop microelectronic chips: interfacing electrogenic cells in vitro with CMOS-based microelectrode arrays. Proc. IEEE 99 (2), 252–284. doi:10.1109/JPROC.2010.2066532
Hohenester, E., and Engel, J. (2002). Domain structure and organisation in extracellular matrix proteins. Matrix Biol. 21, 115–128. doi:10.1016/S0945-053X(01)00191-3
Hollingsworth, M. A., and Swanson, B. J. (2004). Mucins in cancer: protection and control of the cell surface. Nat. Rev. Cancer 4 (1), 45–60. doi:10.1038/nrc1251
Im, M., Werginz, P., and Fried, S. I. (2018). Electric stimulus duration alters network-mediated responses depending on retinal ganglion cell type. J. Neural Eng. 15 (3), 036010. doi:10.1088/1741-2552/aaadc1
Iwanaga, Y., Braun, D., and Fromherz, P. (2001). No correlation of focal contacts and close adhesion by comparing GFP-vinculin and fluorescence interference of DiI. Eur. Biophysics J. 30 (1), 17–26. doi:10.1007/s002490000119
Iyer, V., Issadore, D. A., and Aflatouni, F. (2023). The next generation of hybrid microfluidic/integrated circuit chips: recent and upcoming advances in high-speed, high-throughput, and multifunctional lab-on-IC systems. Lab a Chip 23 (11), 2553–2576. doi:10.1039/d2lc01163h
Kallis, P. J., and Friedman, A. J. (2018). Collagen powder in wound healing. J. Drugs Dermatology JDD 17 (4), 403–408. Available at: https://europepmc.org/article/med/29601617.
Kanyo, N., Kovacs, K. D., Saftics, A., Szekacs, I., Peter, B., Santa-Maria, A. R., et al. (2020). Glycocalyx regulates the strength and kinetics of cancer cell adhesion revealed by biophysical models based on high resolution label-free optical data. Sci. Rep. 10 (1), 22422. doi:10.1038/s41598-020-80033-6
Katsuda, S., Okada, Y., Minamoto, T., Oda, Y., Matsui, Y., and Nakanishi, I. (1992). Collagens in human atherosclerosis immunohistochemical analysis using collagen type-specific antibodies. Arteriosclerosis Thrombosis 12 (4), 494–502. doi:10.1161/01.ATV.12.4.494
Krtolica, A., Parrinello, S., Lockett, S., Desprez, P.-Y., and Campisi, J. (2001). Senescent fibroblasts promote epithelial cell growth and tumorigenesis: a link between cancer and aging. Proc. Natl. Acad. Sci. U. S. A. 98, 12072–12077. doi:10.1073/pnas.211053698
Laborde, C., Pittino, F., Verhoeven, H. A., Lemay, S. G., Selmi, L., Jongsma, M. A., et al. (2015). Real-time imaging of microparticles and living cells with CMOS nanocapacitor arrays. Nat. Nanotechnol. 10 (9), 791–795. doi:10.1038/nnano.2015.163
Lai, T. Y., Cao, J., Ou-Yang, P., Tsai, C. Y., Lin, C. W., Chen, C. C., et al. (2022). Different methods of detaching adherent cells and their effects on the cell surface expression of Fas receptor and Fas ligand. Sci. Rep. 12 (1), 5713. doi:10.1038/s41598-022-09605-y
Lausen, T., Keil, S., Dodel, N., Schulz, M., Corna, A., Zeck, G., et al. (2022). “A low-noise ex-vivo CMOS MEA with 4k recording sites, 4k recording channels, and 1k stimulation sites,” in BioCAS 2022 - IEEE biomedical circuits and systems conference: intelligent biomedical systems for a better future (Taipei: Proceedings), 524–528. doi:10.1109/BioCAS54905.2022.9948664
Lindl, T., Lewandowski, B., Schreyögg, S., and Stäudte, A. (2005). An evaluation of the in vitro cytotoxicities of 50 chemicals by using an electrical current exclusion method versus the neutral red uptake and MTT assays. Altern. Laboratory Animals 33 (6), 591–601. doi:10.1177/026119290503300614
Magar, H. S., Hassan, R. Y. A., and Mulchandani, A. (2021). Electrochemical impedance spectroscopy (Eis): principles, construction, and biosensing applications. Sensors 21 (19), 6578. doi:10.3390/s21196578
Mainardi, C. L., Dixit, S. N., and Kang, A. H. (1980). Degradation of type IV (basement membrane) collagen by a proteinase isolated from human polymorphonuclear leukocyte granules. J. Biol. Chem. 255 (11), 5435–5441. doi:10.1016/s0021-9258(19)70805-9
Marchetti, S., and Schellens, J. H. M. (2007). The impact of FDA and EMEA guidelines on drug development in relation to Phase 0 trials. Br. J. Cancer 97 (5), 577–581. doi:10.1038/sj.bjc.6603925
Masters, J. R., and Stacey, G. N. (2007). Changing medium and passaging cell lines. Nat. Protoc. 2 (9), 2276–2284. doi:10.1038/nprot.2007.319
Mehrotra, P. (2016). Biosensors and their applications - a review. J. Oral Biol. Craniofacial Res. 6 (2), 153–159. doi:10.1016/j.jobcr.2015.12.002
Meredith, J. E., Fazeli, B., and Schwartz, M. A. (1993). The extracellular matrix as a cell survival factor. Mol. Biol. Cell. 4 (9), 953–961. doi:10.1091/mbc.4.9.953
Mhaidat, N. M., Bouklihacene, M., and Thorne, R. F. (2014). 5-Fluorouracil-induced apoptosis in colorectal cancer cells is caspase-9-dependent and mediated by activation of protein kinase C-δ. Oncol. Lett. 8 (2), 699–704. doi:10.3892/ol.2014.2211
Müller, J., Ballini, M., Livi, P., Chen, Y., Radivojevic, M., Shadmani, A., et al. (2015). High-resolution CMOS MEA platform to study neurons at subcellular, cellular, and network levels. Lab a Chip 15 (13), 2767–2780. doi:10.1039/c5lc00133a
Murata, K., Motayama, T., and Kotake, C. (1986). Collagen types in various layers of the human aorta and their changes with the atherosclerotic process. Atherosclerosis 60 (3), 251–262. doi:10.1016/0021-9150(86)90172-3
Nowak-Terpiłowska, A., Śledziński, P., and Zeyland, J. (2021). Impact of cell harvesting methods on detection of cell surface proteins and apoptotic markers. Braz. J. Med. Biol. Res. 54 (2), e10197–7. doi:10.1590/1414-431X202010197
Otsu, N. (1979). A threshold selection method from gray-level histograms. IEEE Trans. Syst. Man, Cybern. 9 (1), 62–66. doi:10.1109/TSMC.1979.4310076
Preibisch, S., Saalfeld, S., and Tomancak, P. (2009). Globally optimal stitching of tiled 3D microscopic image acquisitions. Bioinformatics 25 (11), 1463–1465. doi:10.1093/bioinformatics/btp184
Prockop, D. J., and Kivirikko, K. I. (1995). COLLAGENS: molecular biology, diseases, and potentials for therapy. Annu. Rev. Biochem. 64, 403–434. doi:10.1146/annurev.bi.64.070195.002155
Prost, J., and Bruinsma, R. (1996). Shape fluctuations of active membranes. EPL 33 (4), 321–326. doi:10.1209/epl/i1996-00340-1
Pugh, C. W., and Ratcliffe, P. J. (2003). Regulation of angiogenesis by hypoxia: role of the HIF system. Nat. Med. 9 (Issue 6), 677–684. doi:10.1038/nm0603-677
Quan, Y., Yan, Y., Wang, X., Fu, Q., Wang, W., Wu, J., et al. (2013). Impact of cell dissociation on identification of breast cancer stem cells. Cancer Biomarkers 12 (3), 125–133. doi:10.3233/CBM-130300
Rocha, P. R. F., Schlett, P., Kintzel, U., Mailänder, V., Vandamme, L. K. J., Zeck, G., et al. (2016). Electrochemical noise and impedance of Au electrode/electrolyte interfaces enabling extracellular detection of glioma cell populations. Sci. Rep. 6, 34843. doi:10.1038/srep34843
Rorteau, J., Chevalier, F. P., Bonnet, S., Barthélemy, T., Lopez-Gaydon, A., Martin, L. S., et al. (2022). Maintenance of chronological aging features in culture of normal human dermal fibroblasts from old donors. Cells 11 (5), 858. doi:10.3390/cells11050858
Santini, M. T., Rainaldi, G., and Indovina, P. L. (2000). Apoptosis, cell adhesion and the extracellular matrix in the three-dimensional growth of multicellular tumor spheroids. Crit. Rev. Oncology/Hematology 36 (2–3), 75–87. doi:10.1016/S1040-8428(00)00078-0
Schoen, I., and Fromherz, P. (2007). The mechanism of extracellular stimulation of nerve cells on an electrolyte-oxide-semiconductor capacitor. Biophysical J. 92 (3), 1096–1111. doi:10.1529/biophysj.106.094763
Seifert, U. (1994). Dynamics of a bound membrane. Phys. Rev. E 49 (4), 3124–3127. doi:10.1103/PhysRevE.49.3124
Siebenga, E., Meyer, A. W. A., and Verveen, A. A. (1973). Membrane shot-noise in electrically depolarized nodes of Ranvier. Pfluegers Archiv Eur. J. Physiology 341 (2), 87–96. doi:10.1007/BF00587315
Skog, M., Sivlér, P., Steinvall, I., Aili, D., Sjöberg, F., and Elmasry, M. (2019). The effect of enzymatic digestion on cultured epithelial autografts. Cell. Transplant. 28 (5), 638–644. doi:10.1177/0963689719833305
Somaiah, C., Kumar, A., Mawrie, D., Sharma, A., Patil, S. D., Bhattacharyya, J., et al. (2015). Collagen promotes higher adhesion, survival and proliferation of mesenchymal stem cells. PLoS ONE 10 (12), e0145068. doi:10.1371/journal.pone.0145068
Srinivasan, B., Kolli, A. R., Esch, M. B., Abaci, H. E., Shuler, M. L., and Hickman, J. J. (2015). TEER measurement techniques for in vitro barrier model systems. J. Laboratory Automation 20 (2), 107–126. doi:10.1177/2211068214561025
Stutzki, H., Helmhold, F., Eickenscheidt, M., and Zeck, G. (2016). Subretinal electrical stimulation reveals intact network activity in the blind mouse retina. J. Neurophysiol. 116, 1684–1693. doi:10.1152/jn.01095.2015
Sung, H., Ferlay, J., Siegel, R. L., Laversanne, M., Soerjomataram, I., Jemal, A., et al. (2021). Global cancer statistics 2020: GLOBOCAN estimates of incidence and mortality worldwide for 36 cancers in 185 countries. CA A Cancer J. Clin. 71 (3), 209–249. doi:10.3322/caac.21660
Suzanne, M., and Steller, H. (2009). Letting go: modification of cell adhesion during apoptosis. J. Biol. 8 (5), 49. doi:10.1186/jbiol152
Tai, C., Xie, Z., Li, Y., Feng, Y., Xie, Y., Yang, H., et al. (2022). Human skin dermis-derived fibroblasts are a kind of functional mesenchymal stromal cells: judgements from surface markers, biological characteristics, to therapeutic efficacy. Cell. Biosci. 12 (1), 105. doi:10.1186/s13578-022-00842-2
Takimoto, C. H. (2003). Anticancer drug development at the US national cancer institute. Cancer Chemother. Pharmacol. Suppl. 52 (1), 29–33. doi:10.1007/s00280-003-0623-y
Thewes, R., Bertotti, G., Dodel, N., Keil, S., Schröder, S., Boven, K.-H., et al. (2016). “Neural tissue and brain interfacing CMOS devices - an introduction to state-of-the-art, current and future challenges,” in 2016 IEEE international symposium on circuits and systems (ISCAS), 1826–1829. doi:10.1109/ISCAS.2016.7538925
Tubiana, M. (1989). Tumor cell proliferation kinetics and tumor growth rate. Acta Oncol. 28 (1), 113–121. doi:10.3109/02841868909111193
Turner, A. P. F. (2013). Biosensors: sense and sensibility. Chem. Soc. Rev. 42 (8), 3184–3196. doi:10.1039/c3cs35528d
Vallicelli, E. A., De Matteis, M., Baschirotto, A., Rescati, M., Reato, M., Maschietto, M., et al. (2018). “Neural spikes digital detector/sorting on FPGA,” in 2017 IEEE biomedical circuits and systems conference (BioCAS), 1–4. doi:10.1109/BIOCAS.2017.8325077
Vallicelli, E. A., Fary, F., Baschirotto, A., De Matteis, M., Reato, M., Maschietto, M., et al. (2018). “Real-time digital implementation of a principal component analysis algorithm for neurons spike detection,” in 2018 international conference on IC design & technology (ICICDT), 33–36. doi:10.1109/ICICDT.2018.8399749
Viswam, V., Bounik, R., Shadmani, A., Dragas, J., Obien, M., Müller, J., et al. (2017). “High-density mapping of brain slices using a large multi-functional high-density CMOS microelectrode array system,” in 2017 19th international conference on solid-state sensors, actuators and microsystems (TRANSDUCERS), 135–138. Available at: https://ieeexplore.ieee.org/document/7994006.
Viswam, V., Bounik, R., Shadmani, A., Dragas, J., Urwyler, C., Boos, J. A., et al. (2018). Impedance spectroscopy and electrophysiological imaging of cells with a high-density CMOS microelectrode array system. IEEE Trans. Biomed. Circuits Syst. 12 (6), 1356–1368. doi:10.1109/TBCAS.2018.2881044
Vitale, F., Shen, W., Driscoll, N., Burrell, J. C., Richardson, A. G., Adewole, O., et al. (2018). Biomimetic extracellular matrix coatings improve the chronic biocompatibility of microfabricated subdural microelectrode arrays. PLoS ONE 13 (11), e0206137. doi:10.1371/journal.pone.0206137
Voelker, M., and Fromherz, P. (2006). Nyquist noise of cell adhesion detected in a neuron-silicon transistor. Phys. Rev. Lett. 96 (22), 228102. doi:10.1103/PhysRevLett.96.228102
Wegener, J., Keese, C. R., and Giaever, I. (2000). Electric cell-substrate impedance sensing (ECIS) as a noninvasive means to monitor the kinetics of cell spreading to artificial surfaces. Exp. Cell. Res. 259 (1), 158–166. doi:10.1006/excr.2000.4919
Weinreich, J., Archid, R., Bajaeifer, K., Hack, A., Königsrainer, A., and Schott, T. C. (2014). Growth and chemosensitivity of gastric adenocarcinoma and non-malignant cell lines in response to novel anti-cancer drug combinations. Chemotherapy 60 (5–6), 346–352. doi:10.1159/000438943
Widdershoven, F., Cossettini, A., Laborde, C., Bandiziol, A., Van Swinderen, P. P., Lemay, S. G., et al. (2018). A CMOS pixelated nanocapacitor biosensor platform for high-frequency impedance spectroscopy and imaging. IEEE Trans. Biomed. Circuits Syst. 12 (6), 1369–1382. doi:10.1109/TBCAS.2018.2861558
Witzel, F., Fritsche-Guenther, R., Lehmann, N., Sieber, A., and Blüthgen, N. (2015). Analysis of impedance-based cellular growth assays. Bioinformatics 31 (16), 2705–2712. doi:10.1093/bioinformatics/btv216
Xu, G. K., Qian, J., and Hu, J. (2016). The glycocalyx promotes cooperative binding and clustering of adhesion receptors. Soft Matter 12 (20), 4572–4583. doi:10.1039/c5sm03139g
Zeitler, R., and Fromherz, P. (2013). The thermal voltage fluctuations in the planar core-coat conductor of a neuron-semiconductor interface. Langmuir 29 (20), 6084–6090. doi:10.1021/la4002169
Zeitler, R., Fromherz, P., and Zeck, G. (2011). Extracellular voltage noise probes the interface between retina and silicon chip. Appl. Phys. Lett. 99 (26), 263702. doi:10.1063/1.3672224
Zhang, D., and Liu, Q. (2016). Biosensors and bioelectronics on smartphone for portable biochemical detection. Biosens. Bioelectron. 75, 273–284. doi:10.1016/j.bios.2015.08.037
Zhang, N., Yin, Y., Xu, S. J., and Chen, W. S. (2008). 5-Fluorouracil: mechanisms of resistance and reversal strategies. Molecules 13 (8), 1551–1569. doi:10.3390/molecules13081551
Keywords: CMOS microelectrode array, cell adhesion noise spectroscopy, colorectal cancer cells, human dermal fibroblasts, anti-cancer therapeutics
Citation: Ell M, Bui MT, Kigili S, Zeck G and Prado-López S (2024) Assessment of chemotherapeutic effects on cancer cells using adhesion noise spectroscopy. Front. Bioeng. Biotechnol. 12:1385730. doi: 10.3389/fbioe.2024.1385730
Received: 13 February 2024; Accepted: 12 April 2024;
Published: 13 May 2024.
Edited by:
Mehmet Senel, Biruni University, TürkiyeReviewed by:
Christiane Thielemann, Aschaffenburg University of Applied Sciences, GermanyCristina Polonschii, International Centre of Biodynamics, Romania
Copyright © 2024 Ell, Bui, Kigili, Zeck and Prado-López. This is an open-access article distributed under the terms of the Creative Commons Attribution License (CC BY). The use, distribution or reproduction in other forums is permitted, provided the original author(s) and the copyright owner(s) are credited and that the original publication in this journal is cited, in accordance with accepted academic practice. No use, distribution or reproduction is permitted which does not comply with these terms.
*Correspondence: Sonia Prado-López, sonia.lopez@tuwien.ac.at; Maximilian Ell, maximilian.ell@tuwien.ac.at