Characterizing Wealth Inequality in Cryptocurrencies
 Ashish Rajendra Sai
 Jim Buckley
 Andrew Le Gear2
- 1Lero, Tierney Building, University of Limerick, Limerick, Ireland
- 2Horizon Fintex Ireland DAC, Nexus Center, University of Limerick, Limerick, Ireland
Cryptocurrencies often tend to maintain a publically accessible ledger of all transactions. This open nature of the transactional ledger allows us to gain macroeconomic insight into the USD 1 Trillion crypto economy. In this paper, we explore the free market-based economy of eight major cryptocurrencies: Bitcoin, Ethereum, Bitcoin Cash, Dash, Litecoin, ZCash, Dogecoin, and Ethereum Classic. We specifically focus on the aspect of wealth distribution within these cryptocurrencies as understanding wealth concentration allows us to highlight potential information security implications associated with wealth concentration. We also draw a parallel between the crypto economies and real-world economies. To adequately address these two points, we devise a generic econometric analysis schema for cryptocurrencies. Through this schema, we report on two primary econometric measures: Gini value and Nakamoto Index which report on wealth inequality and 51% wealth concentration respectively. Our analysis reports that, despite the heavy emphasis on decentralization in cryptocurrencies, the wealth distribution remains in-line with the real-world economies, with the exception of Dash. We also report that 3 of the observed cryptocurrencies (Dogecoin, ZCash, and Ethereum Classic) violate the honest majority assumption with less than 100 participants controlling over 51% wealth in the ecosystem, potentially indicating a security threat. This suggests that the free-market fundamentalism doctrine may be inadequate in countering wealth inequality within a crypto-economic context: Algorithmically driven free-market implementation of these cryptocurrencies may eventually lead to wealth inequality similar to those observed in real-world economies.
1 Introduction
Economic freedom is one of the foundational pillars of the crypto-anarchist movement (Ludlow, 2001). Crypto anarchism is a political ideology that focuses on using cryptographic methods to attain anonymity, freedom of speech, and freedom of trade (May, 1992) often through a counter-economic environment. A counter-economic environment facilitates financial transactions beyond the purview of a government, leading to freedom of trade (London, 2018), where a counter economy includes the free market, the black market, and the underground economy.
These crypto-anarchist objectives are materialized primarily through recent developments in cryptography, privacy-focused distributed networks, and decentralized peer-to-peer currencies (Chohan, 2017), where their appeal is as an alternative to traditional financial system in that they embody increased freedom to trade (DeVries, 2016).
The adoption of trade-friendly regulations has been suggested to improve wealth distribution by encouraging the flow of wealth among nations (Bank, 2002; Irwin, 2020). This article explores that line of reasoning, evaluating the hypothesis that wealth distribution improves in the absence of restrictive trade regulation, in a cryptocurrencies context, using measures of wealth concentration. This is a contentious hypothesis because according to the inequality model developed by Boghosian (2021), the free market model adopted by cryptocurrencies is not without limitations in this regard, suggesting that wealth naturally trickles up in a free market economy leading to wealth inequality. This models’ observation is in line with Credit Suisse’s reports indicating that as of 2010, 388 individuals have higher wealth than the lower half of the world’s population combined, as assessed using traditional currencies (Suisse, 2018).
In contrast, many cryptocurrency researchers have suggested that blockchain might provide a solution to the issue of wealth inequality in a free market-based economy (Chohan, 2019; van den Hoven et al., 2019; Othman et al., 2020). For instance, Othman et al. (2020) have indicated that cryptocurrencies can contribute positively to reduce the global imbalance of income and wealth distribution, because cryptocurrencies provide for greater financial inclusion contributing to lower income/wealth inequality. However, it must be acknowledged that participation in these crypto economies is subjected to many barriers to entry, such as internet access requirement and high transaction fee.
Major cryptocurrencies tend to maintain an open distributed ledger of all financial transactions executed to date. This transparent nature of cryptocurrencies can be used to measure wealth concentration in these cryptocurrencies. Measuring the wealth concentration will allow us to understand cryptocurrencies’ potential as a replacement for fiat currency and traditional economies with increased wealth distribution. Thus, this research work assesses the following question:
Do Crypto Economies in Their Current State Provide Alternative Financial Systems That Attain Better Wealth Distribution Than Traditional Economies
Additionally, empirical insight into the trends in wealth inequality in cryptocurrency also allows us to better understand the security implications associated with crypto economies’ economic manipulation. Past reports such as Griffin and Shams (2020) have suggested that manipulation of exchange rates through wealth concentration is feasible and has been observed in the cryptocurrency market. According to Sai et al. (2019a), malicious manipulation of the exchange rate may be used to conduct security attacks on a blockchain. This potential for successfully executing security attacks due to large wealth concentration makes it essential to understand the current state of wealth distribution.
The exact implementation of a cryptocurrency-based financial system can vary significantly in different cryptocurrency implementations. Thus, this fairer wealth distribution hypothesis needs to be assessed for a range of cryptocurrencies to increase the generality of the findings.
This paper will conduct an empirical evaluation of wealth concentration in 8 major cryptocurrencies in two broad categories: Bitcoin-like (6 cryptocurrencies including Bitcoin) and Ethereum-like (2 cryptocurrencies including Ethereum). Bitcoin is currently the largest cryptocurrency by market capitalization, with a current valuation of USD 625 Billion (CoinMarketCap, 2021). Many prominent cryptocurrencies are based on the fundamental design of Bitcoin by forking (copying) the source code of Bitcoin (Neudecker and Hartenstein, 2019). We refer to these cryptocurrencies collectively as Bitcoin-like cryptocurrencies. For our empirical review, we shortlist the top six Bitcoin-like cryptocurrencies (including Bitcoin itself) based on the market capitalization: Bitcoin, Litecoin, Bitcoin Cash, Dash, ZCash, and DogeCoin.
The second category of cryptocurrencies selected for the analysis is Ethereum-like cryptocurrencies. Ethereum currently has a total market capitalization of USD 162 Billion (CoinMarketCap, 2021), is ranked as the second-highest valued crypto asset and allows for transactions to contain transactional logic in the form of Turing complete contracts. Ethereum is also an interesting case study for wealth inequality analysis as Ethereum has a provision to allow users to write smart contracts to dictate economic behavior over the cryptocurrency in the form of a crypto token1 (Buterin et al., 2013). Similar to Bitcoin forks, Ethereum also has several forks; among these, the most prominent example is Ethereum Classic. We review both Ethereum and Ethereum Classic for our study. We also review the current (January 2021) state of wealth distribution in the top five tokens issued on the Ethereum platform for our analysis.
We conduct an econometric analysis by calculating macroeconomic measures of inequality for these cryptocurrencies and contrasting these measures with traditional economies. We also examine an extrinsic factor, policy changes, to understand if factors outside the cryptocurrencies may influence the wealth distribution in the crypto economies. We also perform econometric analysis on the top five tokens deployed on the Ethereum platform, which helps us to understand the impact of policy configurability on wealth distribution as these tokens allow programmers to define the economic policies that govern these assets.
The paper makes the following contributions:
• It provides a high-level protocol for conducting an econometric analysis of cryptocurrencies, by adhering to the data engineering techniques employed in the big data analytics context. This methodology considers the volume, velocity, and variety of data generated by different forms of cryptocurrencies. The schema adopts the ETL (Extract, Transform and Load) (Galici et al., 2020) process for performing econometric analysis in both Bitcoin and Etheruem-like cryptocurrencies (Section 3).
• In terms of generality of findings, it reports on large-scale transaction data from 8 different but major cryptocurrencies: It processed over 1.2 Terabytes of data and over 1.84 Billion transactions to compare the wealth concentration of the shortlisted cryptocurrencies with the Credit Suisse statistics on global wealth inequality (Section 4).
• It provide evidence on the influence that extrinsic factors such as policies can have on the wealth distribution in Bitcoin. Specifically, it reports on the potential relationship between the type of policy changes and the wealth concentration (Section 4).
• It also provides evidence on how configurable economic policies in Ethereum based tokens fare compared to other crypto assets and world economies at large (Section 4).
• Our findings suggest that major crypto economies are similar to conventional economies in terms of wealth distribution adhering to the model proposed by Boghosian (2021); however, there is a trend towards more even wealth distribution among large cryptocurrencies over time.
In addition, based on our reflections on the empirical protocol adopted, the paper proposes a set of reverse engineering techniques that can be used by future researchers in their analysis of wealth concentration to partially circumvent cryptocurrency privacy provisions (Section 6).
We also specifically report on how the current state of econometrics analysis in cryptocurrencies is insufficient to capture the economic aspects of these complicated assets (Section 6).
2 Background
Economic inequality can be broadly categorized into income and wealth inequality (Simpson, 2009). Income inequality examines the distribution of income in a country or political union of nations. The notion of income inequality does not directly translate to crypto economies as the open ledger maintained by these crypto economies only contains information relevant to the wealth (determined by units of currencies) owned by each participant.
Wealth inequality examines the economic heterogeneity of a country or a political union (Cagetti and De Nardi, 2006). The exact definition of wealth varies depending on the application area; however, wealth is generally defined in terms of financial assets (Hamilton and Hepburn, 2014). A financial asset is defined as a non-physical or physical asset that can be used for financial transactions (Moles and Terry, 1997). Then wealth inequality is measured based on the distribution of these financial assets over a population. However, calculating wealth inequality is harder than income inequality as individuals can have negative wealth due to financial liabilities such as credit and loans. Current statistics from Alvaredo et al. (2016) indicates that the top 1% of world population control over 19.4% of the world’s wealth, twice as much as the bottom 50% of the population: notable wealth inequality.
2.1 Measuring Wealth Inequality
A standard method for calculating wealth inequality can be obtained through econometrics. The broad field of econometrics is concerned with applying statistical techniques to economic data to produce empirical evidence for the financial construct under examination (Stock and Watson, 2015). Such measures of statistical dispersion2 are commonly used for quantifying the wealth inequality in economies.
In 1905, Max Lorenz developed a graphical way of representing economic inequality through the use of Lorenz curve (Gastwirth, 1971). The Lorenz curve graphically represents the percentage of wealth accumulated by various portions of the population ordered by the size of their wealth (Gastwirth, 1971). On the x-axis, we plot the percentage of the population, and on the y-axis, we plot the percentage of wealth. As an illustrative example, we have plotted the Lorenz curve for Ireland based on the data obtained from (CSO, 2021) for 2018.
This curve can be used to extract useful insights about wealth distribution in Ireland, such as that the bottom 40% of the population constitutes 3% of its wealth. Another essential property of the Lorenz curve is the line of equality at the 45° angle. This line (illustrated by the blue line in Figure 1) represent the perfect distribution of wealth. The area between the line of equality and the Lorenz curve can be used to understand the spread of inequality.
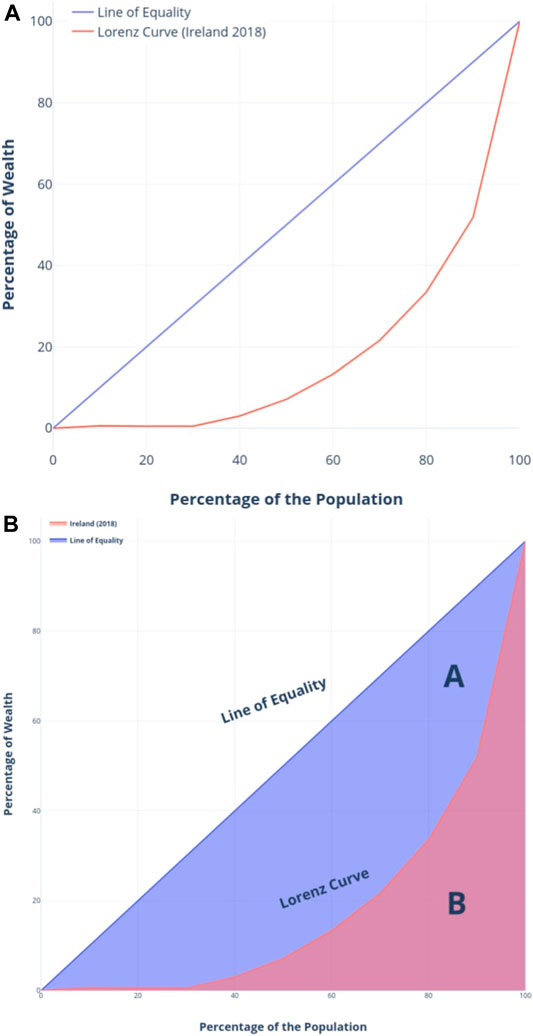
FIGURE 1. Lorenz curve for Irish Economy in Year 2018.
2.1.1 Gini Coefficient
An important statistical construct used to numerically describe this spread of wealth is the Gini coefficient. The Gini coefficient is a numeric value aimed at quantifying the inequality in the distribution (Gini, 1921). To calculate the Gini value for Ireland in 2018, we use the Lorenz curve. The Gini coefficient is defined as the ratio of the area under the line of equality and above the Lorenz curve (illustrated in Supplementary Figure S1 as A) over the total area under the line of equality (illustrated in Supplementary Figure S1 as A + B). We can calculate the Gini Coefficient as follows:
Following this approach, we report that the Gini value for Ireland in 2018 for wealth distribution is 0.67. Based on Eq. 1, we know that the Gini value can range between 0 and 1. A Gini value of 1 for wealth concentration would denote that a single household controls all of the country’s wealth. Similarly, a Gini value of 0 would represent the perfect distribution of wealth in the country, i.e., we would have a Lorenz curve on the line of equality. Thus, the Gini value calculated for Ireland (0.67) represents a high wealth inequality.
Thus far, we have discussed the meaning and measurement of wealth inequality in the context of world economies. In the following subsection, we review wealth inequality in a crypto-economic context.
2.2 Cryptocurrencies and Measuring Wealth Inequality
Considering cryptocurrencies as financial assets is a topic of much debate in the economic and financial research domain (Corbet et al., 2019). This is primarily driven by the argument regarding the intrinsic and extrinsic values associated with the crypto assets. For this article, we focus on the extrinsic value of cryptocurrencies by using their exchange rate to USD as a proxy. The use of USD as a proxy allows us to better draw parallels between crypto economies and traditional world economies.
Due to the open ledger nature of cryptocurrencies, it is easy to gain a macroeconomic view of the economy by conducting data analysis over the open ledgers. Most cryptocurrencies maintain a publically accessible ledger of all transactions in their financial system. This allows us to use data analytics to construct a macro view of these cryptocurrencies. Gini coefficient has been suggested as a useful metric for measuring economic centralization in cryptocurrencies (Kondor et al., 2014; Gupta and Gupta, 2017; Roubini, 2018; Sai et al., 2021).
Both Bitcoin and Etheruem employ different data structures to maintain records of transactions. Thus the deanonymizing process varies significantly depending on the type of blockchain under analysis. Bitcoin utilizes a transaction model known as UTXO (unspent transaction outputs) (Chakravarty et al., 2020). UTXO specifies the value and state3 of each Bitcoin present in the ecosystem. To calculate the balance of an address at a given time, we would need to review all the UTXO’s associated with that address to construct a list of inputs and outputs to that address. This list is then used to calculate the balance for the given address. The process of calculating balance is considerably simplified in Ethereum-like cryptocurrencies. Ethereums transaction data structure contains a balance field that can store and retrieve balance for a given address. Determining the balance of all addresses is fundamental to the calculation of wealth distribution in cryptocurrencies.
However, gaining a macro perspective is not sufficient to observe the wealth distribution in these cryptocurrencies. As indicated in Section 1, cryptocurrencies adhere to the crypto-anarchist ideology by employing privacy-preserving policies to maintain anonymity while retaining the freedom to trade. This is primarily achieved through the use of cryptology in constructing and executing transactions. A macro view of the crypto economy without explicit consideration of this privacy-preserving nature would likely yield an inaccurate measure for wealth distribution as identifying wealth associated with individuals is difficult.
That is, major cryptocurrencies, including Bitcoin and Ethereum, provide pseudo-anonymity to the users through cryptographically generated addresses. Most of these cryptocurrencies also offer provisions for generating a new address for each transaction (Gutoski and Stebila, 2015). This induces further complexity into the determination of wealth distribution as a single user in a cryptocurrency may have his wealth distributed over multiple addresses.
To avoid skewing the econometric analysis due to many addresses with a very small balance, Srinivasan and Lee (2017) propose using a monetary lower bound on balance. For instance, introducing a requirement of a minimum balance of USD 100 for inclusion in Gini calculation can significantly improve accuracy by eliminating several addresses with very low or zero balances. They justify this choice by arguing that many addresses in these cryptocurrencies are only used once for privacy reasons, and addresses with a low balance are unlikely to see future transactions (for example addresses employed for one transaction only).
Despite (or maybe because of) this tweak, it is hard to establish the accuracy of this method. Srinivasan and Lee (2017) suggest using an alternate metric to measure wealth, and other forms of distribution in cryptocurrencies. For example, many prevalent cryptocurrencies are subjected to an honest majority assumption. For the secure operation of these cryptocurrencies, it is assumed that at least 51% of participants are working in-line with the system goals of safe operations (Gervais et al., 2014, 2016; Karame, 2016; Sapirshtein et al., 2016; Chen et al., 2017; Gencer et al., 2018; Sai et al., 2019a; Zhang et al., 2019). Based on that insight, Srinivasan and Lee (2017) designed a metric to measure the number of addresses required to achieve 51% ownership of the total crypto asset in supply. They define the Nakamoto index as the minimum number of the entities needed to achieve 51% ownership of the total crypto asset in a system. Nakamoto index is a useful metric as it directly relates centralization with the security of these crypto assets.
2.3 Security Implications of Wealth Concentration
Cryptocurrencies rely on a complicated interaction of distributed systems and economic constructs for secure operation (Dos Santos, 2017; Sai et al., 2021). Thus it is crucial to understand the potential avenues for security threats. One such reported form of security threat relevant to this article is wealth centralization (Sai et al., 2021).
Wealth centralization-based security threats aim to exploit the concentration of wealth, often in the form of native cryptocurrency, to manipulate the system’s economic dynamics, for example influencing the exchange rate or the transaction fee (Liao and Katz, 2017; Sai et al., 2021). Manipulation of these economic constructs can pose a major threat to the incentive engineering-based security model adopted by major cryptocurrencies (Sai et al., 2019a).
In a report by Griffin and Shams (2020), the authors report on how Tether, a digital currency pegged to the USD4, was used to manipulate the price of Bitcoin and other cryptocurrencies in 2017. They theorize that several large traders generated unbacked Tether coins that were then used to buy Bitcoins, artificially creating a demand for Bitcoin, resulting in a higher exchange rate. However, these newly minted Tether coins were only used to inflate the price. The traders then sold these Bitcoins at a higher price, as the artificial demand stopped and the supply of coins increased.
This type of manipulation demonstrates how acquiring/having control over a large quantity of Bitcoin can allow a trader to manipulate the exchange rate. This example also highlights how traditional exploitative trading strategies can also be applied in the crypto economies. Sai et al. (2019a) provide further insight into potential security issues related to this artificial manipulation of the exchange rate and Bitcoin security. They suggest that a lower exchange rate would render it infeasible for smaller rational participants to validate transactions as the reward is worth less, due to the fall in that exchange rate. This may, in turn, incentivize participants to maximize the profit by acting against the system and conducting attacks.
Another form of reported security threat due to wealth concentration is the presence of whales in the ecosystem (Liao and Katz, 2017). A whale transaction is a cryptocurrency transaction with a high transaction fee. The high transaction fee is used as a reward to the cryptocurrency participant who validates this transaction. A whale transaction can cause a race among cryptocurrency participants to include this whale transaction, potentially leading to multiple forks5 of the cryptocurrency, each including this whale transaction (Liao and Katz, 2017). This can have a detrimental impact on the throughput6 of cryptocurrencies as this race slows down the consensus process considerably.
Alternatively, whales in cryptocurrencies can also slow down the whole cryptocurrency by inducing a large number of transactions with a higher than average transaction fee. As participants are incentivized to include transactions with a high transaction fee, the network will move towards only including the transactions issued by the whale, ultimately leading to an increased fee (reward) for each transaction. This attack has been observed in Ethereum with the curious case of the iFish attack in 2018 (Cryptoslate, 2018). This influx of transactions with high fees led to an increase of 37% in the transaction fee for Ethereum. This sudden growth in the transaction fee reduced the throughput of the network considerably. It also resulted in temporary censorship of transactions with lower transaction fees. This demonstrates the need to better understand and monitor the current state of wealth distribution in cryptocurrencies.
As discussed above, economic centralization may lead to numerous security threats. However, centralization in the context of cryptocurrencies extends to technical forms of centralization such as consensus and network-based centralization (Gencer et al., 2018; Gervais et al., 2014; Sai et al., 2021). Consensus-based centralization is observable and has been empirically measured by many studies (Gervais et al., 2016; Sai et al., 2019a,b; Gencer et al., 2018; Beikverdi and Song, 2015). Similarly, network-based centralization can also be empirically measured by utilizing a beacon network (Gencer et al., 2018). Prior work by (Gencer et al., 2018) suggests an increasing trend towards centralization in the network used by Ethereum and Bitcoin. We refer the reader to the survey on centralization by (Sai et al., 2021) for more reading on centralization in Blockchain-based systems.
In the next section, we review the methodology employed by this study to measure the current state of wealth inequality in major cryptocurrencies.
3 Methodology
To measure the inequality in cryptocurrencies, we devise a four-step process that helps us logically segment the study into the selection of the data sources (Part 1), processing the data and calculating the econometric measures (Part 2), and analyzing two of the most commonly used cryptocurrencies in depth (Parts 3 and 4). This breakdown of our study is visualized in Figure 2.
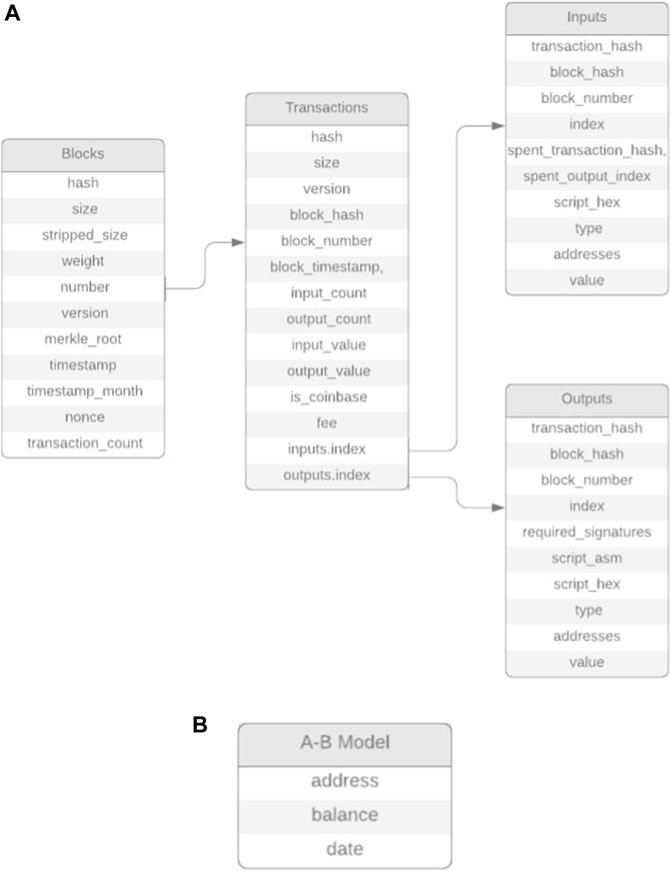
FIGURE 2. Methodology.
3.1 Part 1: Data Source Selection
While shortlisting the cryptocurrencies for this study, the intention was to generate a generic analysis approach that could be applied to more cryptocurrencies. To achieve this, we shortlist the two most common structural approaches taken by cryptocurrencies: the Bitcoin-like or Ethereum-like structures.
We describe Bitcoin-like cryptocurrencies as a subset of all cryptocurrencies that employ a transaction-based ledger while utilizing the UTXO model of transactions, i.e., not maintaining the balances of addresses on the ledger itself. Within the Bitcoin-like cryptocurrencies, we shortlist the top 6 cryptocurrencies based on the market capitalization (Supplementary Table S1). Of these, Bitcoin (Nakamoto, 2008) is the most prominent with a dominating market capitalization. Beyond Bitcoin, we shortlisted five other cryptocurrencies: Litecoin, Bitcoin Cash, Dash, ZCash, and Dogecoin. Litecoin is an example of an early bitcoin fork that only varies in some technical aspects, such as the time-step between adding new transactions to the ledger and the cryptographic algorithms used (Padmavathi and Suresh, 2019). Examining Litecoin and other cryptocurrencies with smaller market capitalization such as Dogecoin, Bitcoin Cash and ZCash allows us to a better understanding of the impact of a comparatively smaller market capitalization than Bitcoin on wealth concentration. Bitcoin Cash is yet another example of a fork based on the Bitcoin source code; however, Bitcoin Cash was subjected to a further hard fork in 2018 with “Bitcoin SV”s creation (Kwon et al., 2019). Examining the wealth distribution in Bitcoin Cash may allow us to better understand the potential impact of multiple forks on wealth distribution.
Unlike Bitcoin Cash and Litecoin, Dogecoin is an example of a forked cryptocurrency created as a parody coin (Button, 2019). However, since its introduction, Dogecoin has gained notable traction among the cryptocurrency community with the current market capitalization of USD 1 Billion (CoinMarketCap, 2021). The technical differences between Dogecoin and other Bitcoin-like cryptocurrencies are minimal, such as the interval time between two blocks of transactions.
ZCash is yet another fork of Bitcoin but with a heavy emphasis on the anonymity of transactions (Hopwood et al., 2016). ZCash has a provision for shielding transactions through the use of zero-knowledge proof (although researchers have argued that the privacy provisions of ZCash can be circumvented: for further reading on the zero-knowledge proof and its implementation in ZCash, we refer the reader to (Quesnelle, 2017)). The privacy-protecting nature of ZCash makes it hard to understand the wealth distribution; but, by applying the heuristics proposed by Kappos et al. (2018), we can report on the approximate state of wealth concentration.
Specifically, Zcash primarily has two main types of transactions, transparent and shielded. In a transparent transaction, it is possible for the public ledger to see the input and output address of the transaction. This type of transaction is referred to as a t-to-t transaction in Kappos et al. (2018). In a shielded transaction, the input or output or both can be of the hidden z-address form, in which the address (es) is (are) hidden from the public ledger. We extract the transparent transaction without applying any classification heuristics; however, we utilize the heuristic proposed by Kappos et al. (2018) if the transaction involves a hidden z-address. The first heuristic used in Kappos et al. (2018) assumes if two or more transparent addresses are inputs in the same transactions (shielded or transparent), then they are controlled by a single user. The second heuristic assumes that if one or more addresses is an input to a transparent transaction in a vJoinSplit (a Zcash construct used when shielded addresses are involved) and a second address is a transparent output address, then the second address belongs to the user with input transaction. We refer the reader to Kappos et al. (2018) for further reading on the structure, and deanonymizing the Zcash transaction.
The last Bitcoin-like cryptocurrency shortlisted for our study is Dash. Bitcoin and other Bitcoin-like cryptocurrencies discussed so far do not put a heavy emphasis on the governance and operational structure of the cryptocurrency (Duffield and Diaz, 2015). For example, the improvement protocol in Bitcoin is prominently dominated by a handful of developers. Dash varies considerably in terms of how it is governed. Dash’s governance model is defined as a decentralized autonomous organization run by a subset of its users known as masternodes (Mosley et al., 2020). Analyzing the wealth distributed in Dash allows us to potentially understand the impact of governance and policymaking on the state of wealth distribution.
As indicated earlier, Ethereum is the second-largest cryptocurrency by market capitalization (Supplementary Table S1). Ethereum follows a different approach to cryptocurrency than Bitcoin-like currencies by emphasizing the computability aspects of the cryptocurrency. According to the whitepaper on Ethereum (Buterin et al., 2013), it is designed as a global computing network capable of executing code known as smart contracts in a decentralized manner. Many newer cryptocurrency-focused projects have utilized this distributed computing network by designing virtual tokens on top of the Ethereum ecosystem (di Angelo and Salzer, 2020). Users can create newer tokens with custom policies on top of Ethereum. The most common forms of tokens generated on Ethereum are known as ERC-20 (Sai et al., 2020). Part 4 of this study focuses on this different-token aspect of Ethereum as it offers the potential for a greater understanding of the impact of configurable policies on the wealth distribution in economies with programmable cryptocurrencies such as Ethereum.
However, similar to Bitcoin, Ethereum is also reported to be dominated by a handful of developers in terms of governance. Ethereum classic, an Ethereum-like cryptocurrency, is a fork of Ethereum created after a disagreement among the Etheruem community regarding the immutability of the ledger, post a successful attack on a smart contract. We also examine the state of wealth distribution in Ethereum Classic and contrast it with Ethereum as it may allow us greater visibility of the impact of lower adoption (determined by market capitalization) on the wealth distribution in otherwise technically similar cryptocurrencies.
3.2 Part 2: Big Data Analysis
To accurately understand the wealth distribution over time in cryptocurrencies, we need to process all the successful transactions and construct a timeline of balances for all known addresses. The obtained dataset exhibits three characteristics of Big Data: volume, velocity, and variety (Russom et al., 2011).
1. The open nature of the ledgers maintained by these cryptocurrencies provides a large volume of data.
2. These cryptocurrencies also tend to include new transactions at a velocity; for example, Bitcoin, on average, has 2,200 transactions every 10 min (blo, 2021).
3. Another aspect of using cryptocurrency as a data source is the variety of the data, such as UTXO and Balance data structure as discussed in Section 2.2.
These three properties of cryptocurrencies (volume, velocity, and variety) make them suitable for Big Data analytics. Conventionally Big Data analytics is defined as the process of extracting useful insight from data that is large in volume, has high velocity and variety (Russom et al., 2011).
We adopt the approach used by Galici et al. (2020) to design a big data analytics pipeline for our study. In Galici et al. (2020), the authors propose an ETL (Extract, Transform and Load) approach to constructing a singular data store from different cryptocurrencies. ETL logically segments the data processing steps into a three-step process. In the first step, we extract the data from shortlisted data sources. Our study utilizes different client applications designed for each shortlisted cryptocurrency as the data source. Storing all of the data with a complete ledger as of January 30, 2021 required over 1.2 TB of storage.
The second step in the ETL model is to transform the data into a common unified structure for all data sources. We designed two transformation models for our study to convert the UTXO and Balances model to a unified “address-balance model”. The UTXO model splits the input, output, blocks, and transaction space into four separate entities. This separation approach is illustrated in Figure 3. We utilize this structure to construct the balance of each account by using the blocks to locate all transactions within that block. We then use the transactions index to locate that transaction in either inputs or outputs table. The total input or output from each transaction is then used to update the balance for each account.
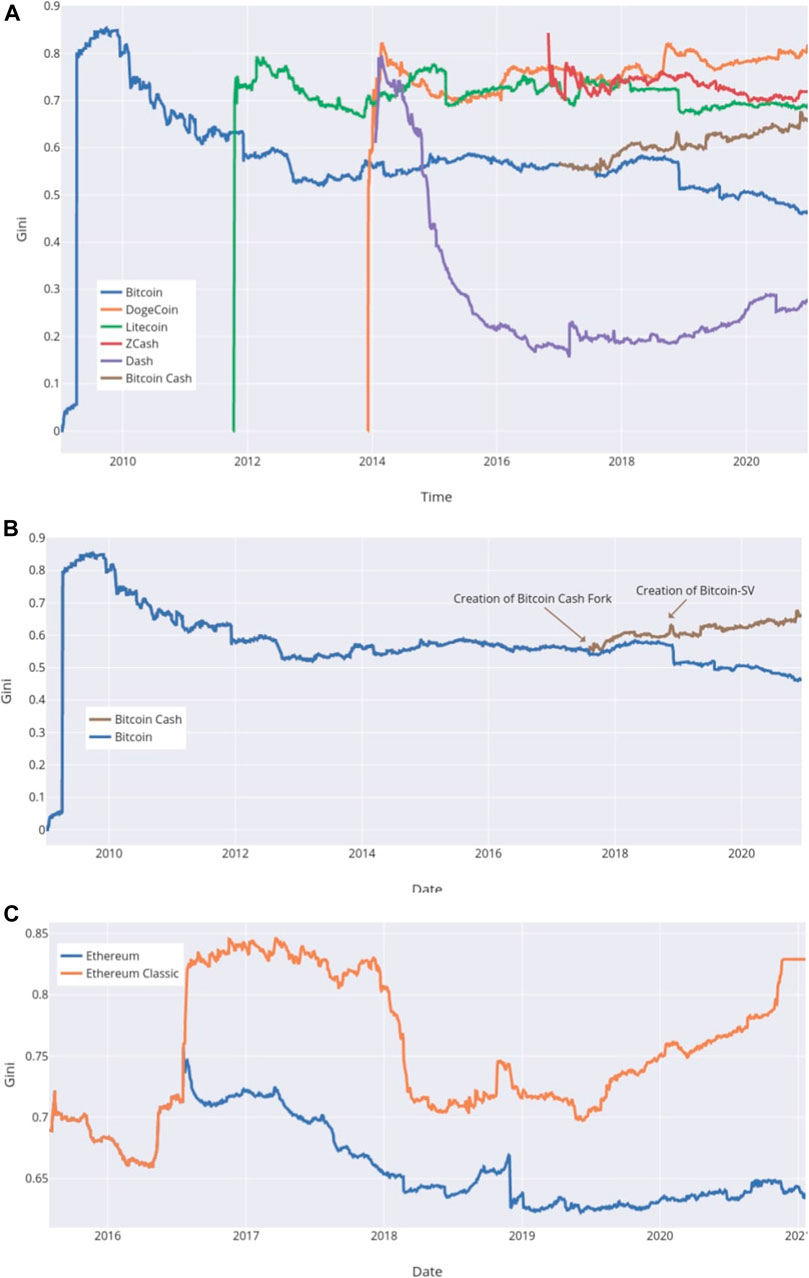
FIGURE 3. ERD diagram for Bitcoin-Like Cryptocurrencies.
Unlike Bitcoin, Ethereum simplifies the process of balance calculation by including a balance entity in the structure of each block of transaction. We convert both the Ethereum’s balance and Bitcoin’s UTXO model to our unified address-balance model. This unified address-balance model is illustrated in Figure 4. The unified address-balance model contains the address, balance in native cryptocurrency, and the date of that balance. The inclusion of date allows us to conduct a time-series analysis of wealth concentration.
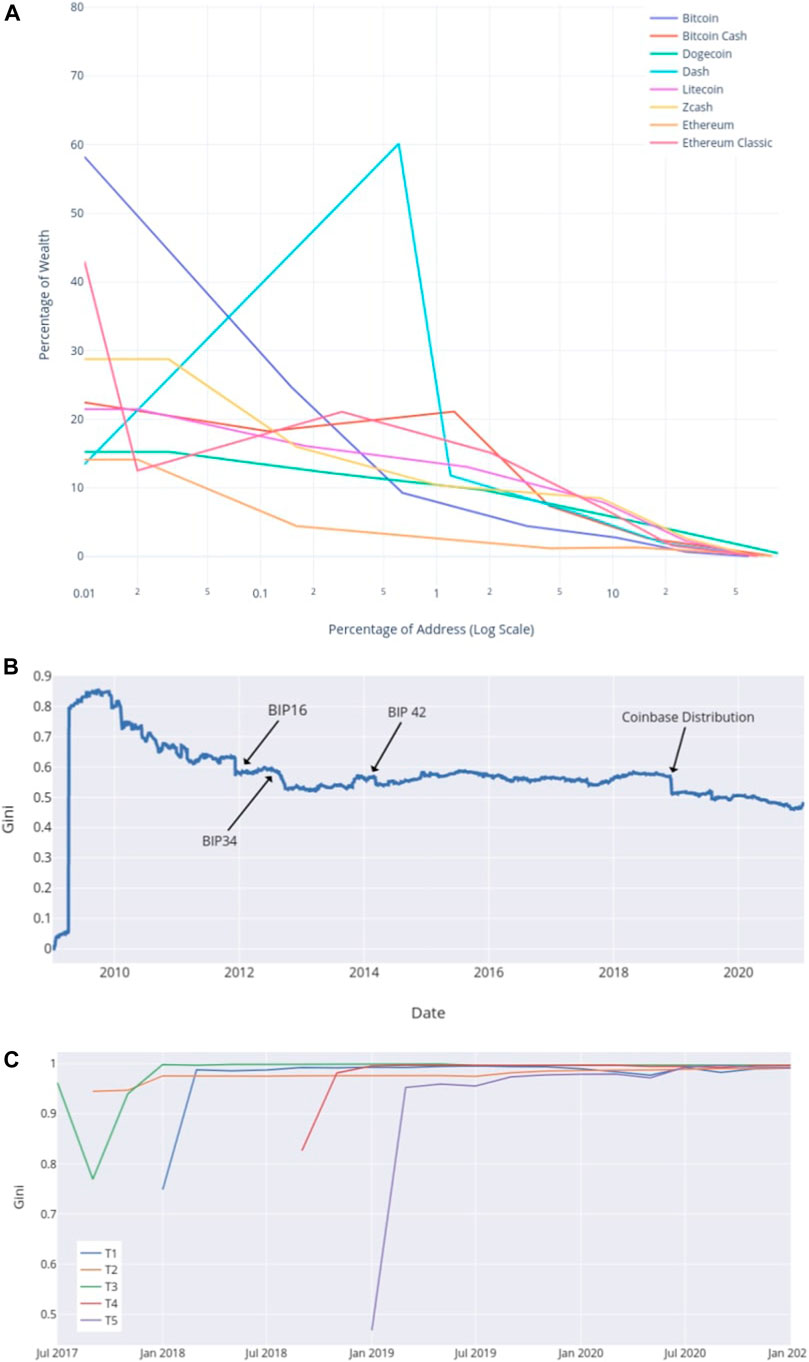
FIGURE 4. Unified address-balance (A–B) model.
After the transformation of data to the unified format, we load this new data in a central data store. Due to the dataset’s big data nature, in line with the recommendations of Moniruzzaman and Hossain (2013), we utilize a NoSQL database system (MongoDB) to store and process the data. The MongoDB data store contains one document (table) for each cryptocurrency. In the next step in Part 2, we utilize the MongoDB datastore to calculate both the Gini value and Nakamoto index for each cryptocurrency for given dates or range of dates.
3.3 Part 3: Bitcoin Analysis
Having gained a macro view state of wealth distribution in these cryptocurrencies, we then restrict our focus to the two most widely used cryptocurrencies: Bitcoin and Etheruem, to perform a more detailed analysis of interplay between policy and inequality in these ecosystems.
3.3.1 Qualitative Analysis of Policy Changes
In Part 3 of our study, we first examine Bitcoin to observe if there are relationships between the governance of Bitcoin and wealth accumulation. Bitcoin is a decentralized cryptocurrency with a focus on limiting the concentration of power. To this end, Bitcoin, like many other subsequent cryptocurrencies, designed an improvement protocol that, in theory, would allow any participant of the network to propose changes or assist in shaping the future of the network (Anceaume et al., 2016). However, as reported in Gervais et al. (2014); Sai et al. (2021); Azouvi et al. (2018), this protocol is primarily dominated by a few individuals in proposing and approving changes. We extract all the improvement proposals and their current state for Bitcoin from the official Bitcoin improvement protocol repository7. Each proposal is assigned a status tag depending on if the proposal was implemented, rejected, or still in draft state. Most of these proposals fall into predefined categories such as consensus improvement, peer-to-peer network improvement, and reference application (API/RPC) improvements. Supplementary Table S2 manifests all the improvement protocol categories and their occurrence in the repository.
We use this category-based coding to analyze the proposal and establish if there is a link between the types of proposals accepted and the distribution of wealth in Bitcoin.
3.4 Part 4: Ethereum Analysis
Like Bitcoin, we also conduct an extended analysis of Ethereum to capture the state of wealth concentration within the Ethereum ecosystem. As alluded to earlier, Ethereum acts as a global decentralized computational engine capable of executing user-defined source code. One of the most common use-cases for Ethereum’s computational engine is token generation. A token is a crypto-asset that exists within the Ethereum ecosystem allowing users to set their terms for the creation, distribution, and functioning of this asset. ERC-20 is a commonly used standardized method of generating these tokens (Sai et al., 2020).
In part 4 of our study, we look within the Ethereum ecosystem to understand how user-defined tokens are distributed. To this end, we shortlist 5 ERC-20 tokens based on the highest current capitalization of these tokens obtained from (CoinMarketCap, 2021). We refer to these five shortlisted tokens anonymously as T1, T2, T3, T4, and T5 ranked by market capitalization due to the economic sensitivity of the domain.
These shortlisted tokens primarily consist of pre-minted coins that facilitate transactions specific to the ecosystem associated with the tokens. While calculating wealth concentration for these tokens, we exclude the supplier(s) as the inclusion may skew the results towards more centralization. We then utilize the Ethereum ledger to extract all the transactions relevant to the token under examination. All of these relevant transactions are used to generate an Address-Balance model for the token, which is then used for calculating the Gini and Nakamoto Index.
We acknowledge that this examination is only focused on the information present within the transactional ledger of Ethereum. This narrow focus may exclude the technicalities associated with the token, such as a smart contract that distributes funds in a predefined manner. We leave further exploration of the code of smart contract as a potential avenue of future work. However, it is worth noting that the shortlisted tokens have a high market capitalization and demonstrate high user participation (determined by the number of transactions relating to the token), thus limiting the suggestion that the platform-specific configuration influences the wealth distribution.
In the next section of this study, we report the results from our 4 part analysis.
4 Results
By following the ETL approach discussed in Part 2 of the Methodology section, we calculate the Gini value and Nakamoto index for all shortlisted cryptocurrencies. It is worth noting that both the Gini value and Nakamoto index measure wealth concentration using different scaling mechanisms. Gini looks at the spread of wealth distribution over the whole population of participants. In contrast, the Nakamoto index is restricted to only the minimum number of participants that control 51% of the wealth in the ecosystem. Due to this difference, it is possible though unlikely to get a small Gini value (high wealth distribution) with a small Nakamoto index (a small number have 51% control). A small Gini value signifies a fairer wealth distribution among all the participants. A small Nakamoto index represents wealth concentration for only 51% of the wealth distribution in the ecosystem. This result indicates that only a small proportion of the whole population controls 51% of the wealth in the ecosystem; however, over the whole population of all participants, the wealth distribution may be more even. Similarly, it is also possible to get a big Gini value with a big Nakamoto index inferring an uneven wealth distribution over the whole participant population but a more fair distribution in the participants who control 51% of the wealth.
We segment the results discussions in three-part: Econometric measures, Bitcoin Analysis and Ethereum Analysis.
4.1 Econometric Measures
The data extracted by the client application is present either in UTXO or Balance Transaction form depending on the type of the cryptocurrency. We convert these distinct forms to a singular notation known as Address-Balance Model. The output of this Address-Balance Model is a data structure that contains relevant information for econometric analysis, notably: address, balance, and date. The date field assists us in analyzing the wealth distribution (balance) chronologically over the address space.
4.1.1 Bitcoin-Like Cryptocurrencies
Supplementary Figure S2 plots the evolution of Gini value for Bitcoin-like cryptocurrencies.
Among the currencies plotted in Supplementary Figure S2, Bitcoin holds the earliest and the largest market capitalization with the largest user-base8. In the early days of Bitcoin, a large proportion of wealth (native cryptocurrency) was primarily controlled by a select few users who used the cryptocurrency. That is, a lack of adoption may explain the high Gini value in the early days of Bitcoin. This trend of high Gini value when the adoption is low is prevalent in all other cryptocurrencies as well and manifested through the early rise of Gini values for each in Supplementary Figure S2. With the increase in adoption, we can see a steady trend towards a lower Gini value in Bitcoin. This indicates that, as more and more people adopt Bitcoin, the wealth in Bitcoin is distributed more evenly. We can also observe this trend towards more even distribution of Bitcoin-wealth in the form of the Nakamoto Index as manifested in Supplementary Table S3 contains the Nakamoto Index for the shortlisted Bitcoin-like cryptocurrencies for each year since their launch.
From this table, we can see that the Bitcoin Nakamoto Index stayed low in the early years, with only 1840 accounts controlling over 51% of all the Bitcoins in the ecosystem until 2012. This value has since increased to 4,652 in 2020, demonstrating a high wealth concentration. However, the trend towards more even distribution of wealth observed over time in the Gini value can also be seen through the steady increase in the Nakamoto Index’s value for Bitcoin from then on. The current (January 2021) overall wealth distribution of Bitcoin is summarized in Table 1. We report that 0.01% of the addresses contain over 58.21% of all Bitcoins in circulation. We also report that a single user holds over 0.78% of all Bitcoin that are currently in circulation. In Bitcoin, the top 100 addresses contain over 13.52% of all Bitcoins.
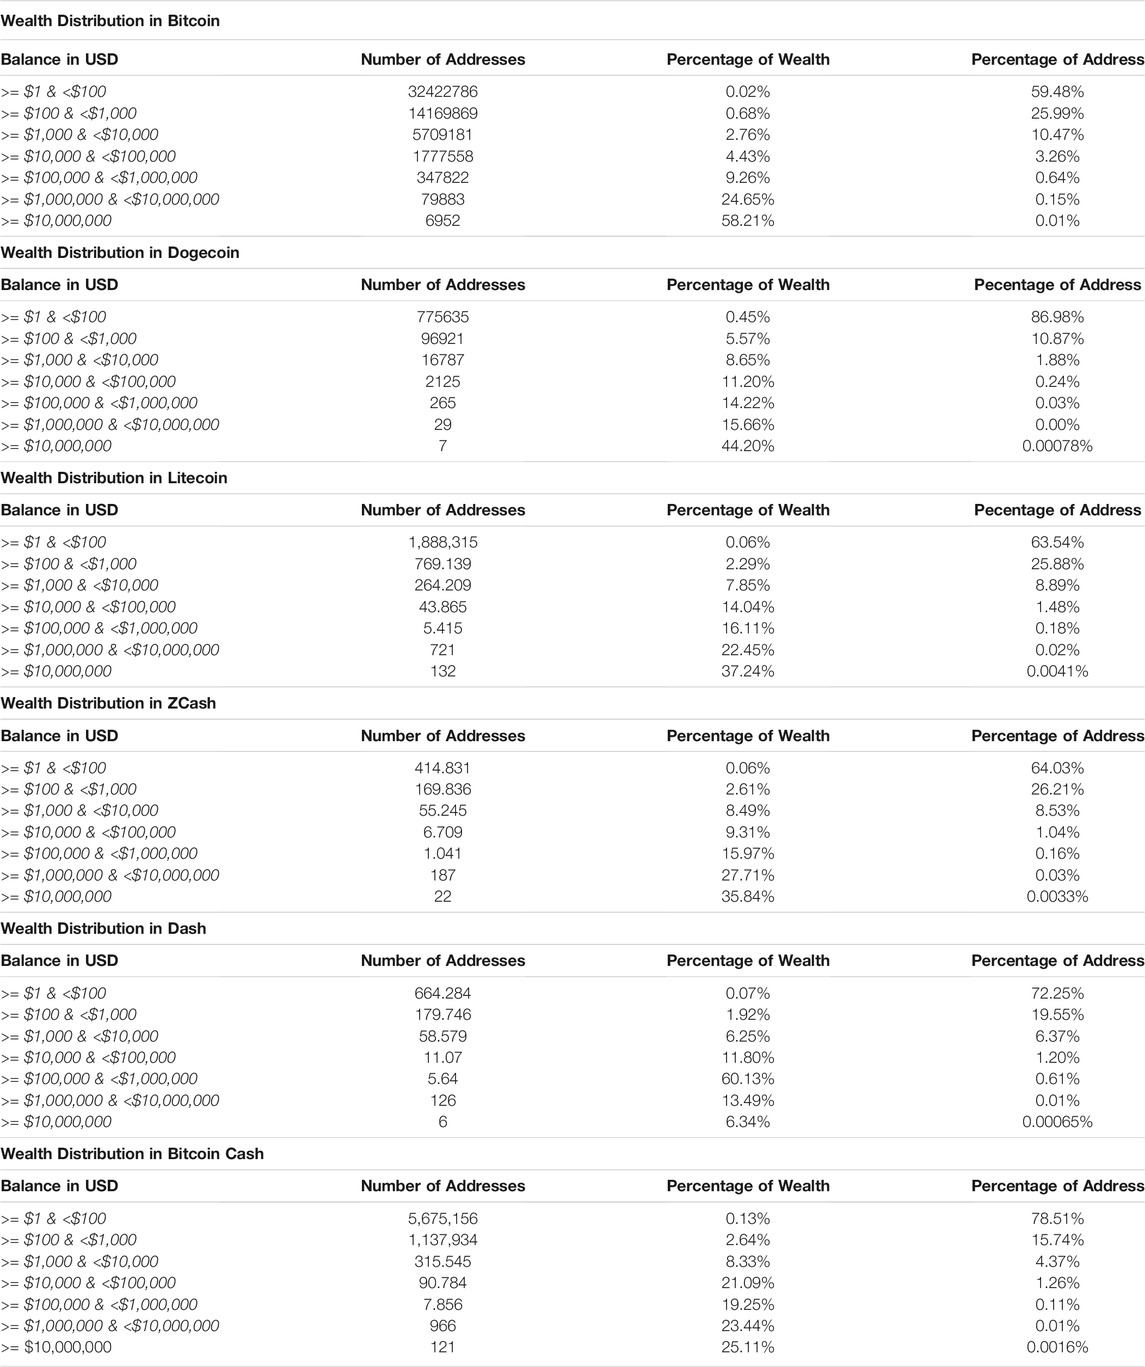
TABLE 1. Wealth distribution in bitcoin.
Overall, there seem to be three distinctive trends in terms of wealth concentration in Bitcoin-like cryptocurrencies: those that tend to on average9 stay at a higher Gini value than Bitcoin over time (Dogecoin and Bitcoin Cash), those that have a higher Gini value than Bitcoin but demonstrate a slightly downwards trend over time (Litecoin and ZCash) and finally those that have a lower Gini value than Bitcoin but have started to see an increase in their Gini value now (Dash). We will now review the results of other Bitcoin-like currencies based on the structure type.
Cryptocurrencies such as Dogecoin do not demonstrate a similar trend towards a fairer wealth distribution despite the increase in adoption. Dogecoin is an interesting example due to its parodic origins. It can also be seen from Supplementary Figure S2 that after the creation of the Dogecoin fork from the Bitcoins network, there is a notable increase in the Gini value. However, unlike Bitcoin, Dogecoin trends towards an increase in the overall wealth concentration. This growth in wealth concentration can also be observed in the constant decrease in the Nakamoto Index value (Supplementary Table S3). We have summarized the overall wealth distribution of Dogecoin in Supplementary Table S4. Here we can see a noteworthy concentration of wealth with 0.00078% of all participants controlling 44.20% of the wealth in the ecosystem. We also report that a single user controls over 23.54% of all dogecoins. The top 100 addresses, by balance, control over 64.67% of all dogecoins. This concentration moves towards violating the honest majority assumption for the secure operation of such crypto-assets potentially posing a security threat.
Like Dogecoin, we observe a similar trend in Litecoin, with an increment in the Gini value after the fork from Bitcoin followed by a consistently high Gini Value compared with Bitcoin. Unlike Dogecoin though, the overall trend for Litecoin is towards a slightly fairer distribution of wealth though at a slower rate than Bitcoin, as is visible in Supplementary Figure S2. This trend can also be observed in the rising trend of the Nakamoto value for Litecoin as observable in Supplementary Table S3. We also report that the overall wealth distribution in Litecoin is more spread out than Dogecoin, as presented in Table 210. As evident by the Nakamoto index of Litecoin, the wealth is not as concentrated as Dogecoin, with the largest single stakeholder controlling over 2.50% of all Litecoins and the top 100 addresses controlling over 32.45% of all Litecoins. This demonstrates how, despite having an almost identical structure to Dogecoin, Litecoin has a comparatively better distribution of wealth. We note that this wealth distribution in both econometric measures is considerably worse than Bitcoin.
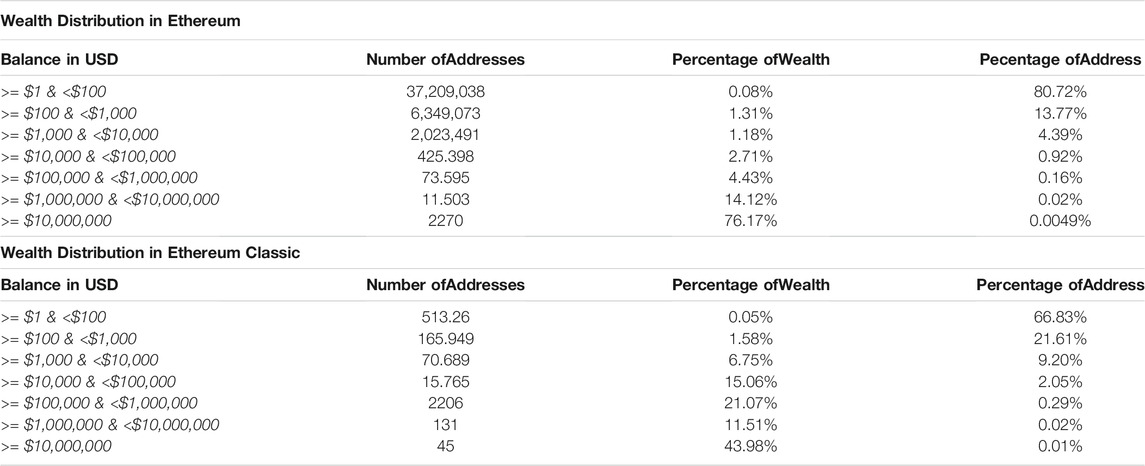
TABLE 2. Litecoin wealth distribution.
Unlike the almost identical fundamental structure of Bitcoin, Litecoin, and Dogecoin, ZCash differs by emphasizing transactions’ privacy aspects. ZCash has a provision of shielding transactions that make it hard to link the transaction to an account (Hopwood et al., 2016). Close to 25% of all ZCash transactions processed in our analysis were shielded. These transactions were excluded from our analysis, thus limiting the accuracy of our results for ZCash. That caveat exposed, in the processed dataset, we observe a trend of an initial spike followed by a sustained fall in the Gini value. In comparison to Litecoin, the wealth distribution is less even in the observed address space. This is also evident in the reported Nakamoto Index values (Supplementary Table S3). The overall wealth distribution is also less spread out over the address space than Bitcoin and Litecoin. We report the address based wealth distribution in Supplementary Table S5. The highest wealth accumulator in observed ZCash transactions controls over 2.56% of total ZCash supply. Like Dogecoin, the top 100 addresses in ZCash contain over 52.06% of all coins in supply, moving towards violating the honest majority assumption.
The most prominent outlier in the Bitcoin-like cryptocurrencies is Dash. Dash is also an interesting case study for wealth distribution in cryptocurrencies as Dash utilizes a privacy-enhancing technique known as coinjoin mixing (Amarasinghe et al., 2019), which, like ZCash, makes it harder to map transactions to individual users. Another important differentiating factor for Dash is its two-tier structure for transaction processing (Duffield and Diaz, 2015). In the first tier, users can operate computing nodes to participate in a race to include the next block of transactions in the ledger. This is similar to the approach adopted by Bitcoin and other Bitcoin-like cryptocurrencies. In the second tier, Dash defines a new entity known as Masternode. A masternode is a network participant that has staked 1,000 dash as collateral for validating all the transactions. This approach is often referred to as a type of hybrid consensus algorithm. We report that, out of all Bitcoin-like cryptocurrencies, Dash has the lowest Gini value with the current (January 2021) Gini value of 0.28 suggesting that this selective ability to trump others might prompt increased wealth distribution in the user population. It is worth noting that this Gini value is lower than the lowest observed Gini value for a real-world economy (Suisse, 2018).
Of course this might be due to the comparatively low market capitalization and overall utilization of the Dash ecosystem. The even wealth distribution is also observable in the second-highest Nakamoto index for Dash (Supplementary Table S3).
But likewise, the reason for a fairer wealth distribution may be the presence of masternodes in the two-tier operational model. Supplementary Table S6 helps us observe this trend as the total number of active masternodes at the time of this study there are 4,814 active11 masternodes with a somewhat uniform distribution of wealth as collateral. We reason that the requirement to have at least 1,000 Dash as collateral for consensus participation may incentivize users to split their Dash portfolio into multiple accounts, each containing the required 1,000 Dash. By doing this, the participants increase their likelihood of receiving a reward from the consensus mechanism. This also incentivizes a more even, if pseudo, distribution of Dash within the ecosystem as it is more profitable to have many accounts with 1,000 Dash each than a single account with a large Dash portfolio.
This more even wealth distribution can also be seen in the wealth distribution Supplementary Table S6, where more than 5,600 addresses contain over 1,000 dash each with a balance in USD greater than $161,801 based on the current (January 2021) exchange rate. The address with the highest wealth concentration contains 1.26% of all Dash in supply. Similarly, the top 100 addresses only have 16.52% of the total wealth in the Dash ecosystem. This is closer to the wealth distribution of Bitcoin and notably better than other Bitcoin-like cryptocurrencies.
Another cryptocurrency that close mimics the traits of Bitcoin is Bitcoin Cash. As observable in Supplementary Figure S3, Bitcoin Cash followed the Gini curve of Bitcoin before the fork in 2017. Like other cryptocurrencies, we observe that a fork leads to wealth redistribution before the network attains a more stable increasing trend (Dogecoin) or decreasing trend (Litecoin, Bitcoin and ZCash) in the value of Gini. As discussed earlier, Bitcoin Cash provides us with an interesting case study as Bitcoin Cash is a fork of Bitcoin that was subsequently forked to create Bitcoin SV (Kwon et al., 2019). The impact of the fork is visible in Supplementary Figure S3. As evident in Supplementary Figure S3 and Supplementary Table S6, Bitcoin Cash has been subjected to a trend of increasing wealth concentration despite the recent nature of the fork. This wealth concentration is also visible in the overall distribution of wealth as documented in Supplementary Table S7 with a vast proportion of the population (78.51%) only controlling 0.13% of the wealth. The highest balance for a single address constitutes 2.62% of all Bitcoin Cash coins in supply. We argue that this is primarily because Bitcoin Cash inherited the Bitcoin Ledger. The top 100 addresses aggregate 22.74% of the wealth within the ecosystem.
4.1.2 Ethereum-Like Cryptocurrencies
Bitcoin-like coins often have capped supply, i.e., the number of these coins are algorithmically limited to a predefined quantity to provide intrinsic value to the asset (Bação et al., 2018). Ethereum, on the other hand, does not impose a strict limit on the supply of Ethers. This property is also inherited by Ethereum-like cryptocurrencies such as Ethereum Classic. Thus the figures reported in this subsection will likely change significantly over time, unlike Bitcoin-like currencies in which a large proportion of wealth is already distributed. In this subsection, we review the current (January 2021) state of wealth distribution for Etheruem and Ethereum Classic.
The evolution of Gini in Ethereum and Ethereum classic is visualized in Supplementary Figure S4. Here we can observe that Ethereun has a higher Gini value than Bitcoin, but it has better wealth distribution than the fork, Ethereum Classic. Similar to the observations with Bitcoin-like cryptocurrencies, there is a trend of an increase in the value of Gini after the fork; however, Ethereum has since trended towards a more even wealth distribution.
Etheruem classic tends to have a higher Gini value with a poor wealth distribution when contrasted with Bitcoin and Ethereum12. The more concentrated wealth distribution is also observable with our Nakamoto Index calculation results, as manifested in Supplementary Table S8.
Both Etheruem and Ethereum Classic demonstrate poor wealth distribution, as manifested in Supplementary Tables S9, S10. Ethereum Classic has a high wealth concentration among the top 100 accounts with 51.92% of the wealth. The address with the highest wealth concentration in Ethereum classic contains over 6.47% of all Ethereum Classic coins in supply. This trend is also present in Ethereum, however, to a much lower extent. The account with the highest balance in Ethereum contains over 4.16% of all Ethers. The top 100 accounts in Ethereum constitute over 35.13% of the wealth.
Results from both Bitcoin-like and Ethereum-like cryptocurrencies suggest that the wealth distribution is initially poor likely due to only a select few participants controlling the majority of the wealth. But this concentration often dissipates as more participants join the system, as observed in Bitcoin and Ethereum. However, this trend towards fairer distribution is not universal as some cryptocurrencies have a strong trend towards an increasing Gini value, such as Dogecoin and Ethereum Classic. Based on our analysis, it seems that some algorithmic interventions such as the one in Dash could assist improve the distribution in the short term; however, it is still unclear if the approach adopted by Dash is sustainable in the long term.
We also note that 3 of the observed cryptocurrencies (Dogecoin, ZCash, and Ethereum Classic) violate the honest majority assumption with less than 100 participants. This may be an indication of a potential security threat.
We have also manifested results from our wealth distribution analysis for all cryptocurrencies in Supplementary Figure S5.
4.2 Comparison Between Crypto Economies and Traditional Economies
Based on the Gini values obtained thus far, we can draw a parallel between crypto and traditional economies’ wealth distribution. We utilize the Gini values of major economies reported by (Suisse, 2018).
The average Gini value for the world’s wealth distribution is 0.8; however, it is worth noting that the results vary considerably by country, with a median value of 0.73. This is in line with the results from the cryptocurrency analysis, where the median Gini value of the shortlisted cryptocurrencies is 0.71.
The highest observed Gini value in real-world economies is 0.95 for Ukraine. This Gini value is considerably higher than the worst-performing crypto asset in our dataset, Dogecoin, with a Gini value of 0.82. Similarly, the best performing cryptocurrency, Dash, has a Gini value of 0.28, which is lower than Slovakia, the country with the most equal wealth distribution with a Gini value of 0.48.
4.3 Qualitative Analysis of Policy Changes
In part 3 of our study, we analyze the impact of policy changes on the Gini value of Bitcoin. After extracting and analyzing the Bitcoin Improvement Protocol (BIP) Repository data, we report that improvement proposals for consensus-based forks seem to relate to a drop in Gini value. We have visualized this potential association in Supplementary Figure S6.
In Supplementary Figure S6, we plot the Bitcoin Improvement Protocol proposals that have demonstrated an impact on the wealth distribution within the Bitcoin ecosystem. BIP 16 implemented a new standard for conducting transactions using Bitcoin’s programming language script. According to the documentation of BIP 16 (Bitcoin, 2019), it is considered a controversial soft fork of the Bitcoin blockchain that implemented a change many in the community believed to be unnecessary. This controversial backdrop of BIP 16 might have promoted sell-outs or buy-ins, sequentially impacting the wealth distribution of the cryptocurrency as the total number of participants for Bitcoin was still considerably small in 2012. This proposal also defined additional validation rules for newer transactions. It can be seen from Supplementary Figure S6 that prior to the implementation of BIP 16, there is a drop in the value of Gini, indicating redistribution of Bitcoins before the change. A similar trend is observed with the introduction of BIP34, a change of structure for the representation of transactions. It is worth noting that BIP34 was implemented post the introduction of support for hierarchical deterministic (HD) wallets in Bitcoin. HD wallets allow users to generate and manage multiple addresses to enhance the privacy of transactions. We suggest that the fall in the Gini value in late 2012 may be due to the growth in the adoption of HD wallet schemes by wallet service provides and users.
The next notable move in the value of Gini for Bitcoin is before the introduction of BIP42, another consensus-based fork, which introduces a supply cap for Bitcoins. This newly induced supply cap for Bitcoin introduced a fundamental change to the economic underpinnings of Bitcoin by suggesting that Bitcoin had an intrinsic value due to limited supply. We reason that this shift in economic policy might have prompted buy-outs or buy-ins, resulting in a change in the wealth distribution. After this point, based on our dataset, we do not observe a relationship between the Gini Value and the policy changes in the improvement protocol repository. Another notable change in Gini value occurs in late 2018; as alluded to earlier, this can also be observed in other cryptocurrencies, primarily due to the redistribution of the crypto assets held by the coinbase exchange.
It is worth noting the information regarding the policy changes on Bitcoin present in the form of Bitcoin Improvement Proposals is limited in its nature and does not account for the overall sentiment towards Bitcoin during that time period. However, even in the small dataset related to the implemented changes in Bitcoin obtained from the BIP repository, we suggest that, depending on the implications of the improvement proposal specifically for the consensus aspects of Bitcoin, it can seem to impact the wealth distribution. It is also worth noting that these consensus-based forks have become considerably less common in recent years. The controversial origin of some of the BIP that were subsequently adopted may be an indicator of governance based centralization (Azouvi et al., 2018) that may pose security threats to the ecosystem (Sai et al., 2021).
4.4 Ethereum Analysis
The primary goal of Bitcoin’s economy is to facilitate the conduction of peer-to-peer transactions. However, the economic ecosystem of Ethereum is more complicated due to the possibility of creating newer tokens. This subsection provides an overview of the current (January 2021) state of wealth distribution in the top 5 tokens on Ethereum. Supplementary Figure S7 plots the Gini curve for these tokens, and Supplementary Table S11 contains the Nakamoto Index for each of these tokens.
As evident from Supplementary Figure S7, all of the shortlisted tokens currently have a Gini value of close to 1, which denotes an almost perfect inequality in these tokens. All of the shortlisted tokens start with a fairer distribution followed (with the exception of T2 and T3) by a steep trend towards wealth accumulation. This wealth accumulation is also visible in the Nakamoto Index values as well. It is worth noting that T1 and T2 have higher market capitalization than all shortlisted cryptocurrencies except Bitcoin and Ethereum. Similarly, T3, T4, and T5 currently have a higher market capitalization than Dash, ZCash, and Dogecoin. However, as evident from both Gini Value and Nakamoto Index, these tokens are more centralized in terms of wealth distribution.
5 Threats to Validity and Limitations
This study attempts to establish the current state of wealth distribution through an empirical analysis of prominent cryptocurrencies. We adopt the threat to validity framework utilized by Wohlin et al. (2012) to segment the threats to this experimental study.
5.1 External Validity
We begin our discussion by focusing on the threats to external validity. Threats to external validity limit our ability to generalize the results from our experiment. This is particularly important in our study as it is primarily restricted to Bitcoin and Ethereum like cryptocurrencies to produce a generic ETL model for further exploration in the field. This limited focus leads to the omission of other forms of cryptocurrencies such as Ripple (Armknecht et al., 2015) and Cardano (Bach et al., 2018). Having said that, at the time of writing, our analysis captured 6 out of the top 10 crypto assets by market capitalization based on data obtained from (CoinMarketCap, 2021).
Another external validity threat is the comparison between cryptocurrencies and traditional fiat currencies. It is essential to understand the difference between crypto-economics and real-world economies as these two have a fundamentally different structure. In its current form, using Gini value to compare a real-world economy to a cryptocurrency may be misleading due to the structural and functional differences between the two (Chiu and Koeppl, 2017). For instance, cryptocurrencies, except for Ethereum-like cryptocurrencies, tend to only serve a single purpose, such as peer-to-peer transactions. There is no direct equivalent to this in real-world economies as fiat currencies often only serve as a mode of exchange between conventional economies with a complex socio-political make-up (Zucman, 2019). In cryptocurrencies, thus far, it has been treated as a technical issue (Sai et al., 2021) and the participants are not necessarily as immersed as they are in their real world economy.
In part 4, we restrict our focus to the top 5 smart contracts by market capitalization; this is another external validity threat as it may skew our dataset to only the most widely used tokens. Another potential issue with the selection of tokens is the ecosystem that these tokens exist in beyond the Ethereum ledger, i.e., most tokens on Ethereum tend to have a purpose outside the Ethereum ecosystem, such as generating capital for a start-up through an initial coin offering (di Angelo and Salzer, 2020). Examining these tokens purely from a transactional focus may result in a bias towards wealth specific to the Ethereum ecosystem.
5.2 Construct Validity
The second threat to validity, construct validity, refers to the ability to extrapolate the results of an experiment to the idea or theory that underpins it. One empirical design issue important in this regard is in unambiguously identifying the owners of wallets. To do this, this work proposes utilizing established reverse engineering heuristics (Ghassemi Toosi et al., 2018), through a supervised clustering algorithm (Ermilov et al., 2017), can assist in current econometric analysis in the crypto economies context.
One pre-requisite for adopting the wallet clustering is the presence of a tagged dataset13 for training the classification model. Such a tagged dataset is often generated through the collection of known addresses and their type. For instance, knowing the address of an exchange platform allows our clustering algorithm to extract a transaction pattern that is common amongst all exchange platform in our tagged dataset and then we can utilize this learned pattern to classify yet unknown exchange platforms.
However, as reported by Sai et al. (2021), the studies within the cryptocurrency field are heavily focused on Bitcoin and Ethereum, and based on our literature review, we were only able to obtain a tagged training set for classifying Bitcoin addresses (Harlev et al., 2018).
In the following subsection, we first use this tagged training set to assess the implications of clustering on the accuracy of the wealth concentration results. We then attempt to replicate the experimental setup used in (Harlev et al., 2018) for Ethereum. However, the preliminary results from our experiment suggest that a further work on generating appropriate training sets is required for more accurate results.
5.2.1 Wallet Clustering in Bitcoin
In this section we suggest a refinement to our protocol in order to improve the construct validity. We utilize advances in de-anonymizing techniques to cluster similar wallets together towards gaining a better view of the macroeconomic (wealth-inequality) state of Bitcoin. To this end, we adopt the approach used by Harlev et al. (2018). Supplementary Table S12 lists the categories derived by Harlev et al. (2018) of Bitcoin addresses present in the training set. In their clustering analysis Harlev et al. (2018) utilized a dataset of 434 tagged Bitcoin users with over 200 million transactions. These tagged entities were then used to train a supervised machine learning model that could predict the type (tag) of an unknown Bitcoin address. In Harlev et al. (2018), the authors report that the Gradient Boosting algorithm they used results in the highest accuracy in prediction with an accuracy of 77%.
We adhere to the method used by Harlev et al. (2018) by utilizing the training set data and constructing a gradient boosting based classifier14. We perform the clustering on the UTXO transaction model in our ETL step before constructing a new Address-Balance model for Bitcoin that takes into account newly identified clusters. This new dataset with each cluster of wallets represnted as single account is then used for the calculation of the econometric measures.
Using this approach we were able to generate a list of wallet clusters present in Bitcoin’s network. We have reported the top 18 wallet clusters sorted by the number of addresses in each group in Supplementary Table S13. These results are in-line with (Wang et al., 2020), where they report that exchanges tend to have a large number of wallet clusters.
We recalculated the present Gini value for Bitcoin while considering all individual clusters as a single unit; the results from this clustering analysis suggest that the current Gini value increments by 0.08 points from 0.65 to 0.73.
Likewise, this only has a small impact on the Nakamoto Index. The index value changes from 4,652 to 4,428, indicating that the majority of these cluster addresses with high wealth were also included in the Nakamoto Index calculation. Supplementary Table S13, coupled with the wider analysis performed here allows us to observe how exchange platforms denominate the wealth distribution in Bitcoin. The second-largest group of known wealth accumulators is the merchant services, followed by mining pools. (Harlev et al., 2018). provide an in-depth characterization of these different categories.
While we demonstrate here how utilizing a machine learning based clustering approach could potentially improve the accuracy of the econometric analysis for cryptocurrencies, it is important to note that the degree to which this improvement impacts is quite small, and that the effect is probably consistent over time, meaning that the trends we report on in this paper are probably accurate.
5.3 Issues With Wallet Clustering in Ethereum
To generate a tagged training dataset for Ethereum, we utilize the API provided by Etherscan (Etherscan, 2019) and extract known addresses and their type. We utilize the type schema suggested by Harlev et al. (2018). However, we were only able to retrieve 297 tagged addresses belonging to the class Exchange and Mining Pool. This training dataset is considerably lower than the 438 tagged addresses in the Harlev et al. (2018) experiment. This likely has an adverse impact on the accuracy of our classification model.
Upon performing the clustering on Ethereum’s transaction ledger, we were only able to label 5,600,938 addresses that were part of 12 Exchange platform clusters. Due to the lack of publically available data, it may be speculative to assess the accuracy of this classification model. We suggest that further work is required to generate appropriate training data for Ethereum and other cryptocurrencies in our dataset before this approach can be applied when assessing wealth centralization.
One potential avenue to improve the accuracy of these results is the exploration of unsupervised clustering algorithms (O’Kane, 2018). However, this is beyond the scope of our study, and we leave this as a potential future work avenue.
5.4 Internal Validity
Internal validity examines if an experimental condition makes a difference in the causality of the independent variable without the researcher’s knowledge. To establish if policy changes impact wealth distribution, we only examine the improvement proposal repository. A majority of bitcoin and other cryptocurrency-related discussions take place in forums of these cryptocurrencies. Thus this limiting focus may omit potentially insightful qualitative data. The selection of BIPs is selective, primed by the changes in the Gini data. We acknowledge that a fuller investigation in the future is required. We also recognize that this study proposes relationships between the Gini behavior and market validation, the presence of masternodes and BIPs. However, as this is the first study in this field, additional work needs to be performed to probe the hypotheses derived from this study further.
6 Conclusion
This study is an initial probing of an under-studied area where the goal is not to test the validity of a hypothesis but more to explore the field towards hypothesis building. The conclusion section discusses the implications of our findings, pointing out the core contributions and potential avenues for future work.
6.1 Current State Wealth Inequality
Section 4 provides an empirical overview of the current state of wealth distribution in the shortlisted cryptocurrencies. We report that most shortlisted cryptocurrencies have a wealth distribution that is in-line with real world economies; for example, the current Gini value for Bitcoin, of 0.65 is similar to that of Australia (Suisse, 2018). On the other hand, Dogecoin results in the highest observed value of Gini in our dataset, with the current Gini value of 0.82, which is close to the current Gini value of the United States at 0.85. Unlike Dogecoin, Dash, the best performing cryptocurrency in terms of Gini value, has a current Gini value of 0.28, which is lower than the fairest real-world economy of Slovakia with a Gini value of 0.48. However, as indicated earlier, this low value of Dash may reflect the two-tier operational structure that requires select participants known as masternodes with a considerable proportion of Dash coins in their balance. This may lead to the incentivization for a more even wealth distribution (i.e., greater wealth distribution, caused by buying-in (from another currency) to achieve masternode status).
Cryptocurrencies analyzed in our study do not seem to have an apparent influential factor that impacts wealth distribution. However, we were able to identify some policy change incidents and their correlational impacts on wealth distribution.
The current wealth distribution in these cryptocurrencies is not necessarily a byproduct of these cryptocurrencies’ structure, as illustrated by the stark differences between the wealth distribution in Bitcoin and other Bitcoin-like cryptocurrencies such as Dogecoin and Bitcoin cash. This is also evident in the case of Ethereum and Ethereum Classic which, despite having identical functionality and structure, tend to have differing wealth distribution.
One factor that we can attribute to this disparity in the wealth distribution among otherwise similar cryptocurrencies is the market capitalization. Cryptocurrencies with higher market capitalization (Bitcoin and Ethereum) tended to have a fairer distribution of wealth15.
6.2 Contribution
Despite being limited by the aforementioned threats to validity, we believe that this study forms, and provides preliminary evidence for hypotheses that could prompt researchers to further examine the state of these crypto economies. Our study specifically provides the researcher with a generic mechanism for data analysis and processing that can be employed to conduct econometric analysis. We also discuss the impact of policy on the state of wealth distribution; this aligns well with the argument presented in Sai et al. (2019b), where authors argue for more investigation into the governance aspect of cryptocurrencies. We summarize contributions made by this study as follows:
• A generic model ETL-based data storage and analysis model for conducting econometric analysis on cryptocurrencies.
• Illustration of how the cryptocurrencies tend to be similar in terms of distribution of wealth to conventional economies.
• Illustration of how mainstream cryptocurrencies seem to be becoming increasingly wealth equal over time, although that could be just related to increasing user knowledge/trust and hence adoption.
• Highlights that the configurability of policies in Ethereum based tokens can lead to poorer wealth distribution.
• Illustration of how the current wealth inequality measure to measure in cryptocurrency could be improved by incorporating machine learning-based clustering techniques.
6.3 Future Work
We acknowledge that this is one of the first studies probing this aspect of cryptocurrencies. Its role is to assist in the formation of hypotheses on the wealth inequality in the crypto economies. In future work, we intend to conduct a more detailed analysis/assessment of the causes of wealth inequality in crypto economies.
The work presented in this article establishes the current state of wealth distribution in Bitcoin and Etheruem like cryptocurrencies. We wish to expand this analysis to other forms of cryptocurrencies with a different structure in the future. We would also like to extend our research to a wider variety of cryptocurrencies with varying mechanisms of consensus, such as Proof-of-Stake-based cryptocurrencies (Nguyen et al., 2019), as wealth concentration holds a high value in terms of security for Proof-of-Stake based cryptocurrencies (Fanti et al., 2019).
We also wish to expand the machine learning-based clustering approach to other cryptocurrencies in our dataset, specifically towards building a catalog of tagged entities that may be used by other researchers. Expansion of the clustering technique to other cryptocurrencies will also allow us to compare these assets more accurately.
The work presented in this paper only focuses on calculating two econometric measures of inequality that have already been utilized in the literature (Sai et al., 2019b). However, many other econometric measures of inequality in economies (Galbraith and Kum, 2002) may prove useful in a cryptocurrency context. This may also allow us to accurately compare cryptocurrency-based centralization in wealth to real world economies.
Data Availability Statement
The original contributions presented in the study are included in the article/Supplementary Material, further inquiries can be directed to the corresponding author.
Author Contributions
AS analyzed the ledger data, created the visualization, and wrote up the initial draft. JB and AL provided the feedback and review for article refinement.
Funding
This work was supported, in part, by Science Foundation Ireland grant 13/RC/2094_P2 and co-funded under the European Regional Development Fund through the Southern andamp; Eastern Regional Operational Programme to Lero - the Science Foundation Ireland Research Centre for Software (www.lero.ie).
Conflict of Interest
The authors declare that the research was conducted in the absence of any commercial or financial relationships that could be construed as a potential conflict of interest.
Publisher’s Note
All claims expressed in this article are solely those of the authors and do not necessarily represent those of their affiliated organizations, or those of the publisher, the editors and the reviewers. Any product that may be evaluated in this article, or claim that may be made by its manufacturer, is not guaranteed or endorsed by the publisher.
Footnotes
1In crypto-economics, a token is defined as a digital asset that may represent real-world, tangible objects or virtual vouchers. In the case of Ethereum, these tokens are often expressed in a standardized form known as ERC-20.
2Dispersion is the statical measure of a variation among given items or numeric values.
3The state of UTXO refers to the conditions imposed on the transaction such as only the owner of that Bitcoin can spend it.
4A pegged digital currency backs every unit of the digital coin with a real-world asset at a fixed exchange rate. Tether is a 1-1 pegged to the USD, i.e., every single Tether generated is backed by a single USD.
5Here the term fork is used to refer to a fork within a cryptocurrency, i.e., a disagreement among participants that lead to two versions of the same cryptocurrency. The fork adopted by a majority of the participants becomes the main chain.
6The throughput of Blockchain-based cryptocurrencies is often measured in the form of Transactions Per Second that represents the number of transactions that the network has validated.
7The Bitcoin improvement protocol (BIP) repository is publically available at www.github.com/bitcoin/bips
8We determine the user-base by the number of unique addresses present in the ledger.
9We calculate the average Gini value quarterly since the start of the cryptocurrency ledger to compare the trend.
10It is worth noting that the distribution of both Litecoin and Dogecoin are subject to different market capitalization, potentially leading to fewer participants falling into the higher wealth brackets for the lower market capitalization currency.
11Masternodes need to actively participate in the consensus process. According to our analysis, there are over 5,600 addresses that have a balance greater than 1,000 Dash; however, only 4,814 participate in the consensus process.
12As discussed earlier, Dash is an outlier in this observation, potentially, due to the presence of masternodes.
13In supervised machine learning, a tagged set refers to a set of entities with known attributes such as type or name. Usually, the intention is to use this training dataset with known attributes to predict the value/type of attribute on a non-tagged dataset (Jordan and Mitchell, 2015).
14We refer the reader to (Natekin and Knoll, 2013) for more details of how gradient boosting based classifiers function in supervised learning
15Dash is an exception to this observation, likely due to the presence of masternodes in the network.
References
Alvaredo, F., Atkinson, A. B., Piketty, T., Saez, E., and Zucman, G. (2016). The World Wealth and Income Database. Website. Available at: http://www. wid. world 2, 11–75.
Amarasinghe, N., Boyen, X., and McKague, M. (2019). “A Survey of Anonymity of Cryptocurrencies,” in Proceedings of the Australasian Computer Science Week Multiconference (ACM). doi:10.1145/3290688.3290693
Anceaume, E., Lajoie-Mazenc, T., Ludinard, R., and Sericola, B. (2016). “Safety Analysis of Bitcoin Improvement Proposals,” in 2016 IEEE 15th International Symposium on Network Computing and Applications (NCA) (IEEE). doi:10.1109/nca.2016.7778636
Armknecht, F., Karame, G. O., Mandal, A., Youssef, F., and Zenner, E. (2015). “Ripple: Overview and Outlook,” in International Conference on Trust and Trustworthy Computing (Springer), 163–180. doi:10.1007/978-3-319-22846-4_10
Azouvi, S., Maller, M., and Meiklejohn, S. (2018). “Egalitarian Society or Benevolent Dictatorship: The State of Cryptocurrency Governance,” in International Conference on Financial Cryptography and Data Security (Springer), 127–143.
Bach, L. M., Mihaljevic, B., and Zagar, M. (2018). “Comparative Analysis of Blockchain Consensus Algorithms,” in 2018 41st International Convention on Information and Communication Technology, Electronics and Microelectronics (MIPRO), 1545–1550. doi:10.23919/mipro.2018.8400278
Bank, W. (2002). Globalization, Growth and Poverty: Building an Inclusive World Economy (The World Bank).
Bação, P., Duarte, A. P., Sebastião, H., and Redzepagic, S. (2018). Information Transmission between Cryptocurrencies: Does Bitcoin Rule the Cryptocurrency World. Scientific Ann. Econ. Business 65, 97–117. doi:10.2478/saeb-2018-0013
Beikverdi, A., and Song, J. (2015). “Trend of Centralization in Bitcoin’s Distributed Network,” in 2015 IEEE/ACIS 16th International Conference on Software Engineering, Artificial Intelligence, Networking and Parallel/Distributed Computing (SNPD) (IEEE), 1–6. doi:10.1109/snpd.2015.7176229
Button, K. (2019). Travel Behavior and Travel Demand. UIC Rev. Intell. Prop. L. 19, 1–19. doi:10.1007/978-3-642-36203-3_46-1
Chakravarty, M. M. T., Chapman, J., MacKenzie, K., Melkonian, O., Peyton Jones, M., and Wadler, P. (2020). “The Extended Utxo Model,” in International Conference on Financial Cryptography and Data Security (Springer), 525–539. doi:10.1007/978-3-030-54455-3_37
Chen, L., Xu, L., Shah, N., Gao, Z., Lu, Y., and Shi, W. (2017). “On Security Analysis of Proof-Of-Elapsed-Time (Poet),” in International Symposium on Stabilization, Safety, and Security of Distributed Systems (Springer), 282–297. doi:10.1007/978-3-319-69084-1_19
Chiu, J., and Koeppl, T. V. (2017). The Economics of Cryptocurrencies—Bitcoin and beyond. Social Science Research Network.
Corbet, S., Lucey, B., Urquhart, A., and Yarovaya, L. (2019). Cryptocurrencies as a Financial Asset: A Systematic Analysis. Int. Rev. Financial Anal. 62, 182–199. doi:10.1016/j.irfa.2018.09.003
Cryptoslate (2018). Ethereum Network under Assault: Gas price Manipulation May Indicate covert Eos Attack [interview]. Dataset.
CSO (2021). Household Finance and Consumption Survey 2018 - Cso - central Statistics Office. Dataset.
DeVries, K. (2016). Violence against Children and Education. Int. Health 8, 1–2. doi:10.1093/inthealth/ihv076
di Angelo, M., and Salzer, G. (2020). “Tokens, Types, and Standards: Identification and Utilization in Ethereum,” in 2020 IEEE International Conference on Decentralized Applications and Infrastructures (DAPPS) (IEEE), 1–10. doi:10.1109/dapps49028.2020.00001
Dos Santos, R. P. (2017). On the Philosophy of Bitcoin/blockchain Technology: Is it a Chaotic, Complex System. Metaphilosophy 48, 620–633. doi:10.1111/meta.12266
Ermilov, D., Panov, M., and Yanovich, Y. (2017). “Automatic Bitcoin Address Clustering,” in 2017 16th IEEE International Conference on Machine Learning and Applications (ICMLA) (IEEE), 461–466. doi:10.1109/icmla.2017.0-118
Fanti, G., Kogan, L., Oh, S., Ruan, K., Viswanath, P., and Wang, G. (2019). “Compounding of Wealth in Proof-Of-Stake Cryptocurrencies,” in International Conference on Financial Cryptography and Data Security (Springer), 42–61. doi:10.1007/978-3-030-32101-7_3
Galbraith, J. K., and Kum, H. (2002). Inequality and Economic Growth: Data Comparisons and Econometric Tests.
Galici, R., Ordile, L., Marchesi, M., Pinna, A., and Tonelli, R. (2020). Applying the Etl Process to Blockchain Data. prospect and Findings. Information 11, 204. doi:10.3390/info11040204
Gastwirth, J. L. (1971). A General Definition of the Lorenz Curve. Econometrica 39, 1037–1039. doi:10.2307/1909675
Gencer, A. E., Basu, S., Eyal, I., Van Renesse, R., and Sirer, E. G. (2018). Decentralization in Bitcoin and Ethereum Networks. arXiv preprint arXiv:1801.03998.
Gervais, A., Karame, G. O., Capkun, V., and Capkun, S. (2014). Is Bitcoin a Decentralized Currency. IEEE Secur. Privacy 12, 54–60. doi:10.1109/msp.2014.49
Gervais, A., Karame, G. O., Wüst, K., Glykantzis, V., Ritzdorf, H., and Capkun, S. (2016). “On the Security and Performance of Proof of Work Blockchains,” in Proceedings of the 2016 ACM SIGSAC conference on computer and communications security, 3–16. doi:10.1145/2976749.2978341
Ghassemi Toosi, F., Buckley, J., Sai, A. R., and Le Gear, A. (2018). Reverse Engineering the Blockchain as Illustrated Using Eigen Decomposition.
Griffin, J. M., and Shams, A. (2020). Is Bitcoin Really Untethered. J. Finance 75, 1913–1964. doi:10.1111/jofi.12903
Gupta, M., and Gupta, P. (2017). “Gini Coefficient Based Wealth Distribution in the Bitcoin Network: A Case Study,” in International Conference on Computing, Analytics and Networks (Springer), 192–202.
Gutoski, G., and Stebila, D. (2015). “Hierarchical Deterministic Bitcoin Wallets that Tolerate Key Leakage,” in International Conference on Financial Cryptography and Data Security (Springer), 497–504. doi:10.1007/978-3-662-47854-7_31
Hamilton, K., and Hepburn, C. (2014). Wealth. Oxford Rev. Econ. Pol. 30, 1–20. doi:10.1093/oxrep/gru010
Harlev, M. A., Sun Yin, H., Langenheldt, K. C., Mukkamala, R., and Vatrapu, R. (2018). “Breaking Bad: De-anonymising Entity Types on the Bitcoin Blockchain Using Supervised Machine Learning,” in Proceedings of the 51st Hawaii International Conference on System Sciences. doi:10.24251/hicss.2018.443
Hopwood, D., Bowe, S., Hornby, T., and Wilcox, N. (2016). Zcash Protocol Specification. San Francisco, CA, USA: GitHub.
Jordan, M. I., and Mitchell, T. M. (2015). Machine Learning: Trends, Perspectives, and Prospects. Science 349, 255–260. doi:10.1126/science.aaa8415
Kappos, G., Yousaf, H., Maller, M., and Meiklejohn, S. (2018). “An Empirical Analysis of Anonymity in Zcash,” in 27th USENIX Security Symposium (USENIX). Security 18, 463–477.
Karame, G. (2016). “On the Security and Scalability of Bitcoin’s Blockchain,” in Proceedings of the 2016 ACM SIGSAC conference on computer and communications security (ACM)), 1861–1862. doi:10.1145/2976749.2976756
Kondor, D., Pósfai, M., Csabai, I., and Vattay, G. (2014). Do the Rich Get Richer? an Empirical Analysis of the Bitcoin Transaction Network. PloS one 9, e86197. doi:10.1371/journal.pone.0086197
Kwon, Y., Kim, H., Shin, J., and Kim, Y. (2019). “Bitcoin vs. Bitcoin Cash: Coexistence or Downfall of Bitcoin Cash,” in 2019 IEEE Symposium on Security and Privacy (SP), 935–951. doi:10.1109/SP.2019.00075
Liao, K., and Katz, J. (2017). “Incentivizing Blockchain forks via Whale Transactions,” in International Conference on Financial Cryptography and Data Security (Springer), 264–279. doi:10.1007/978-3-319-70278-0_17
May, T. (1992). The Crypto Anarchist Manifesto. High Noon on the Electronic Frontier: Conceptual Issues in Cyberspace.
Moniruzzaman, A., and Hossain, S. A. (2013). Nosql Database: New Era of Databases for Big Data Analytics-Classification, Characteristics and Comparison. arXiv preprint arXiv:1307.0191.
Mosley, L., Pham, H., Guo, X., Bansal, Y., Hare, E., and Antony, N. (2020). Towards a Systematic Understanding of Blockchain Governance in Proposal Voting: A Dash Case Study. Available at SSRN 3416564.
Natekin, A., and Knoll, A. (2013). Gradient Boosting Machines, a Tutorial. Front. Neurorobot. 7. doi:10.3389/fnbot.2013.00021
Neudecker, T., and Hartenstein, H. (2019). “Short Paper: An Empirical Analysis of Blockchain forks in Bitcoin,” in International Conference on Financial Cryptography and Data Security (Springer), 84–92. doi:10.1007/978-3-030-32101-7_6
Nguyen, C. T., Hoang, D. T., Nguyen, D. N., Niyato, D., Nguyen, H. T., and Dutkiewicz, E. (2019). Proof-of-stake Consensus Mechanisms for Future Blockchain Networks: Fundamentals, Applications and Opportunities. IEEE Access 7, 85727–85745. doi:10.1109/access.2019.2925010
O’Kane, E. (2018). Detecting Patterns in the Ethereum Transactional Data Using Unsupervised Learning. Trinity College, Dublin, Ireland: Ph.D. thesis, Master’s thesis, University of Dublin.
Othman, A. H. A., Alhabshi, S. M., Kassim, S., Abdullah, A., and Haron, R. (2020). The Impact of Monetary Systems on Income Inequity and Wealth Distribution. Int. J. Emerging Markets 15 (6), 1161–1183. doi:10.1108/ijoem-06-2019-0473
Padmavathi, M., and Suresh, R. M. (2019). Secure P2p Intelligent Network Transaction Using Litecoin. Mobile Netw. Appl. 24, 318–326. doi:10.1007/s11036-018-1044-9
Roubini, N. (2018). Blockchain Isn’t about Democracy and Decentralisation – It’s about Greed by Nouriel Roubini [Dataset].
Russom, P., et al. (2011). Big Data Analytics. TDWI Best Practices Report. fourth quarter, 19, 1–34.
Sai, A. R., Buckley, J., Fitzgerald, B., and Gear, A. L. (2021). Taxonomy of Centralization in Public Blockchain Systems: A Systematic Literature Review. Inf. Process. Manage. 58, 102584. doi:10.1016/j.ipm.2021.102584
Sai, A. R., Buckley, J., and Le Gear, A. (2019a). Assessing the Security Implication of Bitcoin Exchange Rates. Comput. Security 86, 206–222. doi:10.1016/j.cose.2019.06.007
Sai, A. R., Holmes, ., C., Buckley, J., and Gear, A. L. (2020). “Inheritance Software Metrics on Smart Contracts,” in Proceedings of the 28th International Conference on Program Comprehension, 381–385. doi:10.1145/3387904.3389284
Sapirshtein, A., Sompolinsky, Y., and Zohar, A. (2016). “Optimal Selfish Mining Strategies in Bitcoin,” in International Conference on Financial Cryptography and Data Security (Springer), 515–532.
Simpson, B. P. (2009). Wealth and Income Inequality: An Economic and Ethical Analysis. J. Bus Ethics 89, 525–538. doi:10.1007/s10551-008-0014-8
van den Hoven, J., Pouwelse, J., Helbing, D., and Klauser, S. (2019). “The Blockchain Age: Awareness, Empowerment and Coordination,” in Towards Digital Enlightenment (Springer), 163–166. doi:10.1007/978-3-319-90869-4_13
Wang, M., Ichijo, H., and Xiao, B. (2020). Cryptocurrency Address Clustering and Labeling. arXiv preprint arXiv:2003.13399.
Wohlin, C., Runeson, P., Höst, M., Ohlsson, M. C., Regnell, B., and Wesslén, A. (2012). Experimentation in Software Engineering. Springer Science & Business Media.
Zhang, R., Xue, R., and Liu, L. (2019). Security and Privacy on Blockchain. ACM Comput. Surv. 52, 1–34. doi:10.1145/3316481
Keywords: centralization, wealth centralization, cryptoeconomics, gini, nakamoto index
Citation: Sai AR, Buckley J and Le Gear A (2021) Characterizing Wealth Inequality in Cryptocurrencies. Front. Blockchain 4:730122. doi: 10.3389/fbloc.2021.730122
Received: 24 June 2021; Accepted: 23 September 2021;
Published: 20 December 2021.
Edited by:
Nicola Dimitri, University of Siena, ItalyReviewed by:
Tiziano Squartini, IMT School for Advanced Studies Lucca, ItalyMaurizio Pizzonia, Università degli Studi Roma Tre, Italy
Copyright © 2021 Sai, Buckley and Le Gear. This is an open-access article distributed under the terms of the Creative Commons Attribution License (CC BY). The use, distribution or reproduction in other forums is permitted, provided the original author(s) and the copyright owner(s) are credited and that the original publication in this journal is cited, in accordance with accepted academic practice. No use, distribution or reproduction is permitted which does not comply with these terms.
*Correspondence: Ashish Rajendra Sai , 17053145@studentmail.ul.ie