Structural Health Monitoring Methods for the Evaluation of Prestressing Forces and Prerelease Cracks
 Hiba Abdel-Jaber
 Branko Glisic
- Department of Civil and Environmental Engineering, Princeton University, Princeton, NJ, USA
Prestressed concrete bridges currently account for 45% of bridges built in the last 5 years in the United States. This has resulted in an increase in the number of deficient bridges composed of prestressed concrete, which requires a better understanding of the on-site performance of this building material. The use of new materials, such as high-performance concrete, in conjunction with prestressing provides additional motivation for the creation of structural health monitoring methods for prestressed concrete. This paper identifies two parameters relevant to prestressed concrete, along with methods for their evaluation. The parameters evaluated are the prestressing force value at transfer and the width of prerelease cracks, both of which are indicators of structural performance. Improper transfer of the prestressing force can result in tensile stresses in the concrete that exceed capacity and result in cracks and/or excessive deflections. Prerelease cracks occur in the concrete prior to transfer of the prestressing force and are mainly caused by autogenous shrinkage and thermal gradients. Closure of the cracks is expected by virtue of prestressing force transfer. However, the extent of crack closure is important in order to guarantee durability and structural integrity. This paper presents an integral overview of two novel methods for the statistical evaluation of the two monitored parameters: prestressing forces and the width of prerelease cracks. Validation of the methods is performed through application to two structures, both of which are components of Streicker Bridge on the Princeton University campus. Uncertainties are evaluated and thresholds for unusual behavior are set through the application.
Introduction
Structural health monitoring (SHM) is the process of measuring and analyzing parameters, on a continuous or regular basis, and deriving conclusions about the health condition or performance of a structure (Glisic and Inaudi, 2007). With infrastructure failure catastrophes and aging infrastructure, the need for SHM has increased, as timely maintenance decisions need to be made. The 2013 Infrastructure Report by the American Society of Civil Engineers (ASCE) rates U.S. bridges with a C+, indicating that bridges are in fair to mediocre condition and show significant deficiency (ASCE, 2013). Additionally, recent catastrophes, such as the I-35 Mississippi River bridge failure, expose the vulnerability of current infrastructure and the shortcomings of current inspection procedures.
Effective SHM of bridges requires, among other tasks, the identification of damage-sensitive parameters and the creation of methods for the monitoring and assessment of such parameters for every structure and material type. This study deals with the identification and monitoring of such parameters for prestressed concrete beam-like structures. Since the introduction of prestressed concrete, the number of prestressed concrete bridges has undergone a steady increase to comprise more than 45% of bridges built in the last 5 years, as shown in Figure 1 (Federal Highway Administration, 2014). This emphasizes the importance of an accurate assessment of their health condition and performance. This paper presents an integral overview of two monitoring methods for prestressed concrete structures using two important parameters: prestressing force distribution at transfer and the width (opening) of prerelease cracks.
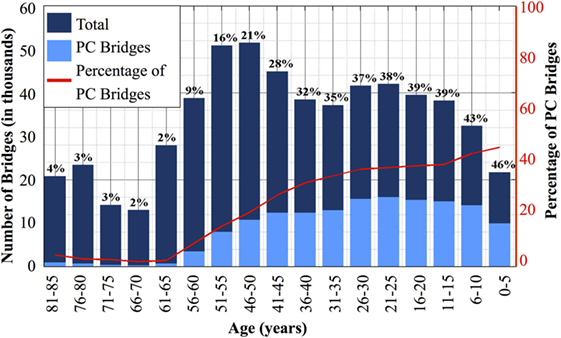
Figure 1. Proportion of prestressed concrete bridges by age [data from Federal Highway Administration (2014).
Monitoring of the prestressing force at transfer can indicate whether or not adequate transfer of the force between the prestressing strands and the concrete was achieved. Inadequate transfer of the prestressing force can result in unanticipated stresses in the concrete, leading to possible malfunction or failure of the structure at loads lower than predicted by the design.
Prerelease cracks are early-age cracks that occur in the concrete prior to the transfer of the prestressing force and are due to early-age thermal and shrinkage effects in the concrete (Green et al., 1984; Baran et al., 2004). Such cracks are believed to be closed after application of the prestressing force by virtue of force transfer. However, residual cracking can occur and has a significant impact on structural capacity and performance (Baran et al., 2004). Thus, monitoring the width of prerelease cracks after prestressing is important in order to guarantee structural integrity and durability.
This paper presents the two methods associated with the assessment of the two aforementioned parameters through application to a real life structure, Streicker Bridge. The structure is a pedestrian bridge on the Princeton University campus constructed in 2009, and it is composed of a main span and four approaching “legs.” Half of the main span and the longest of the approaching legs, namely, the southeast leg, were instrumented with fiber optic strain and temperature sensors at several locations for educational and research purposes.
The two parameters are monitored using the same sensor network, consisting of a series of parallel long-gage fiber optic strain sensors embedded in the concrete prior to pouring. The sensors measure strain and temperature, and the methods process the measurands into the monitoring parameters (prestressing force and prerelease crack width) in order to derive conclusions about the condition of the structure.
The methods are briefly presented in Section “Methods” followed by a description of the application structure and monitoring system in Section “Streicker Bridge Instrumentation.” Sections “Results and Discussion” and “Conclusion” present the results of the analyses and the conclusions, respectively.
Methods
The locations of the sensors within the structures were determined based on loose structural analysis and include locations of large bending moments, locations with small bending moments (close to inflection points), and locations close to extremities (anchorages) to capture force transfer (Abdel-Jaber and Glisic, 2014). Within a cross-section, two parallel sensors are installed such that one is above the centroid of stiffness (top sensor), and the other is below the centroid of stiffness (bottom sensor) of the cross-section. For illustrative purposes, an example of a sensor network is given in Figure 2. Such a network is suitable for structures predominantly under uniaxial bending, which is commonly the case for bridges.
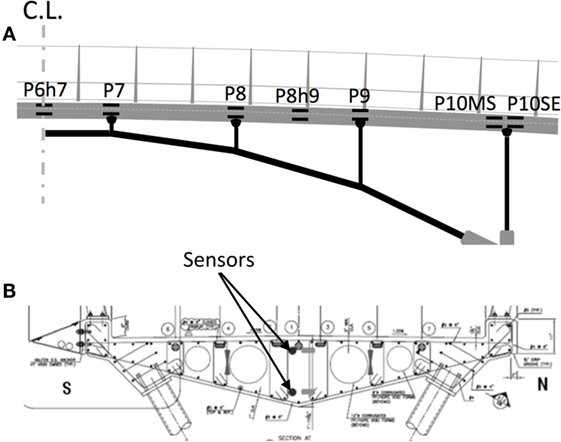
Figure 2. Monitoring system on the main span of Streicker Bridge: (A) elevation view and (B) cross-sectional view.
Prestressing Force
The value of the prestressing force at an instrumented cross-section can be computed using strain measurements at two locations along the cross-section and the relative locations of the sensors from the centroid of stiffness of the cross-section. Using linear beam theory, Eqs 1–3 derive the value of the prestressing force (Abdel-Jaber and Glisic, 2014).
where κ is the curvature at a cross-section, ɛt and ɛb are the elastic strain values at the top sensor and bottom sensor locations, respectively, h is the vertical distance between the sensors, ɛCS is the strain at the centroid of stiffness, yt,CS is the vertical distance between the top sensor and the centroid of stiffness, F is the value of the prestressing force, E is the modulus of elasticity of the concrete, and A is the cross-sectional area at a given location.
The elastic strain can vary significantly along in the depth of cross-section due to eccentricity of prestressing force (i.e., due to eccentricity of prestressing cables); however, this variability of the strain does not affect determination of prestressing force, which is calculated using only the value of the strain at the centroid of stiffness of the instrumented cross-section, as per Eq. 3.
The application of Eqs 1–3 is challenging in the case of cracked cross-sections. At the location of a crack, application of the prestressing force causes the interfaces of the crack to displace closer to each other to allow force transfer. Once the interfaces of the crack are sufficiently close, force transfer can occur and the concrete will experience compression due to the force application. A sensor placed across a crack will register such displacement as strain, in addition to registering the strain due to actual prestressing. Thus, strain values at cracked locations cannot be used in the above equations as they do not correspond to prestressing strain only, but to the sum of apparent strain due to displacement of crack interfaces (closing of crack mouth) and prestressing strain. Since the two effects cannot be simply separated, the equations cannot be directly applied. Instead, the prestressing forces can be determined through interpolation from nearby uncracked locations, assuming a sufficient number of uncracked locations have been instrumented.
It is important to note that the prestressing force usually vary along the length of the structure, and consequently, the accuracy of estimation of prestressing force at cracked locations, using interpolation from nearby uncracked locations, can be affected by this variation if all these instrumented locations are too far from each other. This represents potential limitation of the method, which can be overcome by proper design of the sensor network, i.e., by proper spacing of the instrumented locations. Variation of prestressing force along the length of the structure is mostly the result of combined effects of friction losses, variability of position of prestressing cables, and variability of geometrical and mechanical properties of the cross-sections along the structure. However, variability of these three parameters can be relatively accurately estimated using design models, and consequently, the distance between the cross-sections equipped with sensors can be established based on this estimation, so the error in determination of prestressing force at cracked location using interpolation from nearby uncracked locations can be evaluated and minimized.
However, even at healthy (uncracked) locations, the application of Eqs 1–3 is challenged by the accurate determination of the geometrical and mechanical parameters involved in equations, and the quantification of uncertainties. Key parameters that require accurate determination are the location of the centroid of stiffness and the modulus of elasticity. The location of the centroid of stiffness can be determined using geometrical and material properties of the cross-section, or using strain measurements from the same sensor network (Sigurdardottir and Glisic, 2013, 2014). Determination of the modulus of elasticity can be done directly, through testing of concrete samples of the bridge (rarely available), or indirectly, using the compressive strength of the concrete (usually available) and empirical equations from design codes, such as in Section 8.5.1 in ACI 318-08 (ACI, 2008). Such empirical equations result in large uncertainties. For example, ACI 318-08 specifies an uncertainty of ±20%, a rather large uncertainty that challenges threshold setting for anomaly detection.
Prerelease Crack Width
The evaluation of the width of prerelease cracks after transfer of the prestressing force is a two-step process. First, the occurrence of a crack must be discerned and its initial width determined. Next, the effect of prestressing on crack closure is considered, and the final width of the crack is determined.
Crack Width before Prestressing
In general, the occurrence of a crack can be determined using any available damage detection method, one of which uses the same sensor network suggested in this paper. Observing the time history of strain measurements at a sensor location from the time of pouring of the concrete until prestressing is performed, such as the one given in Figure 3, the occurrence of a crack is characterized by the sudden upward jump in the strain value at the sensor location. Such a jump does not occur at an uncracked location.
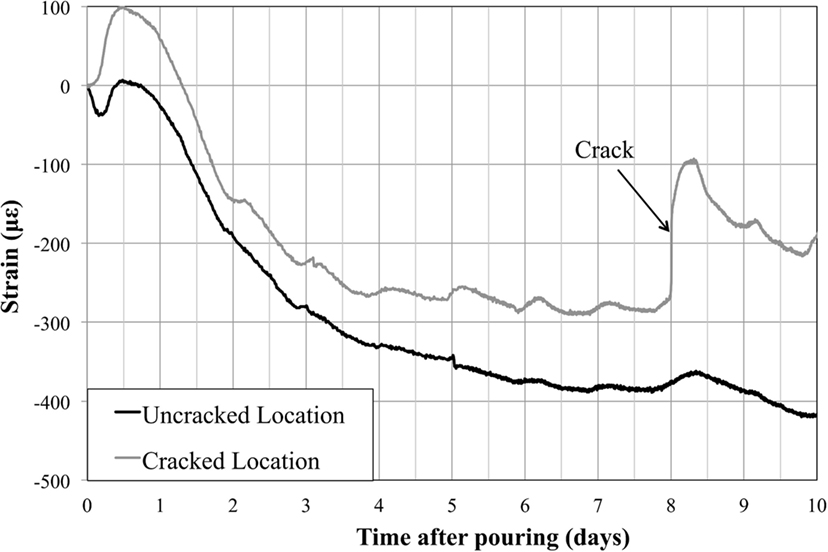
Figure 3. Example of a time history of strain measurements for healthy (uncracked) and cracked locations showing the occurrence of a crack.
When the occurrence of a crack has been determined, the initial crack width before prestressing can be determined using strain measurements at the two locations within the cross-section. The strain measurement at any sensor location is given by Eq. 4.
where ɛtot is the total strain (measured by the sensor), ɛE is the elastic strain, ɛT is the thermal strain, ɛφ is the strain due to creep, ɛsh is the strain due to shrinkage effects in concrete, and ɛother is the strain due to other effects, such as the occurrence of a crack.
Thus, to determine the strain change due to a crack, the strain change due to elastic, thermal, and rheological effects must be subtracted from the total strain change between two timestamps, such that one precedes the occurrence of the crack and the other succeeds it. To account for all aforementioned effects, strain changes at cracked locations can be compared to strain changes at uncracked (healthy) locations. The difference between the two should yield the strain due to the crack, i.e., the crack size. This procedure is illustrated in Figure 4. The reference and final times refer to the times between which strain changes are compared. The final time is the moment immediately preceding prestressing and thus the choice of this point is inflexible. The reference time can however be chosen as any point preceding the occurrence of the crack. It is recommended to choose this point such that the thermal gradient is not significantly different between reference and final times. This serves to minimize thermal effects in the structure, which can influence strain and cause uncertainties in the analysis. More details on the choice of the reference time and comparison sensor are presented in Abdel-Jaber and Glisic (2015).
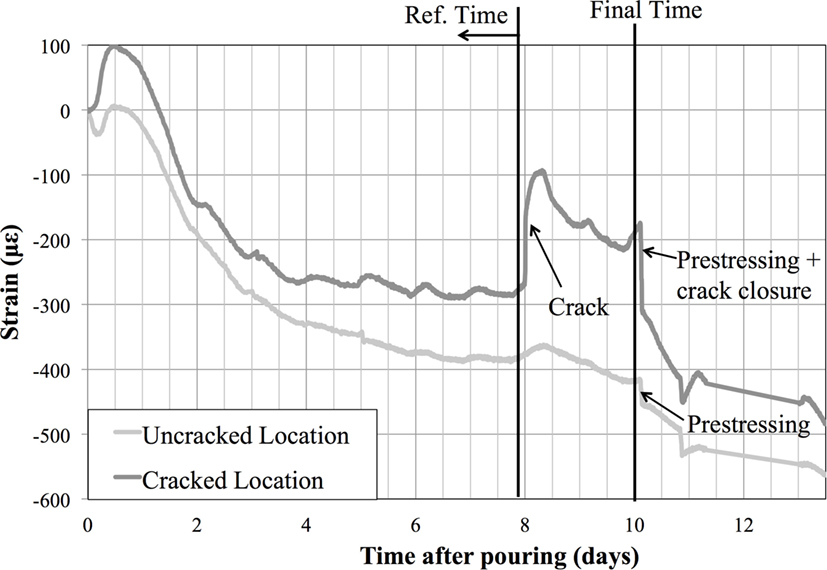
Figure 4. Example of a time history of strain measurements for healthy (uncracked) and a cracked locations showing crack occurrence, prestressing, and reference and final times.
Crack Width after Prestressing
As shown in Figure 4, the change in strain during prestressing is larger at cracked locations than at uncracked locations. This is due to the displacement effect during crack closure, i.e., the interfaces of the crack need to be displaced closer to each other in order for force transfer to occur. This displacement places the sensor across the crack in compression and is thus interpreted as strain by the sensor. Additionally, the sensor registers the strain that occurs during force transfer due to the compression in the concrete. Thus, the strain change registered by the sensor is a combination of displacement due to crack closure and prestressing of the concrete. The two effects must be separated in order to determine the final crack width.
The strain due to prestressing can be determined through interpolation from nearby uncracked locations using the method briefly outlined in Section “Prestressing Force.” Then, the strain due to crack closure can be determined as the difference between the total strain change measured by the sensor and the prestressing strain. Adding this strain (compressive) to the initial strain due to the crack (tensile) gives the residual strain due to cracking, if any.
A brief overview of the two methods discussed in Sections “Prestressing Force” and “Prerelease Crack Width” is shown in Figures 5A,B, respectively.
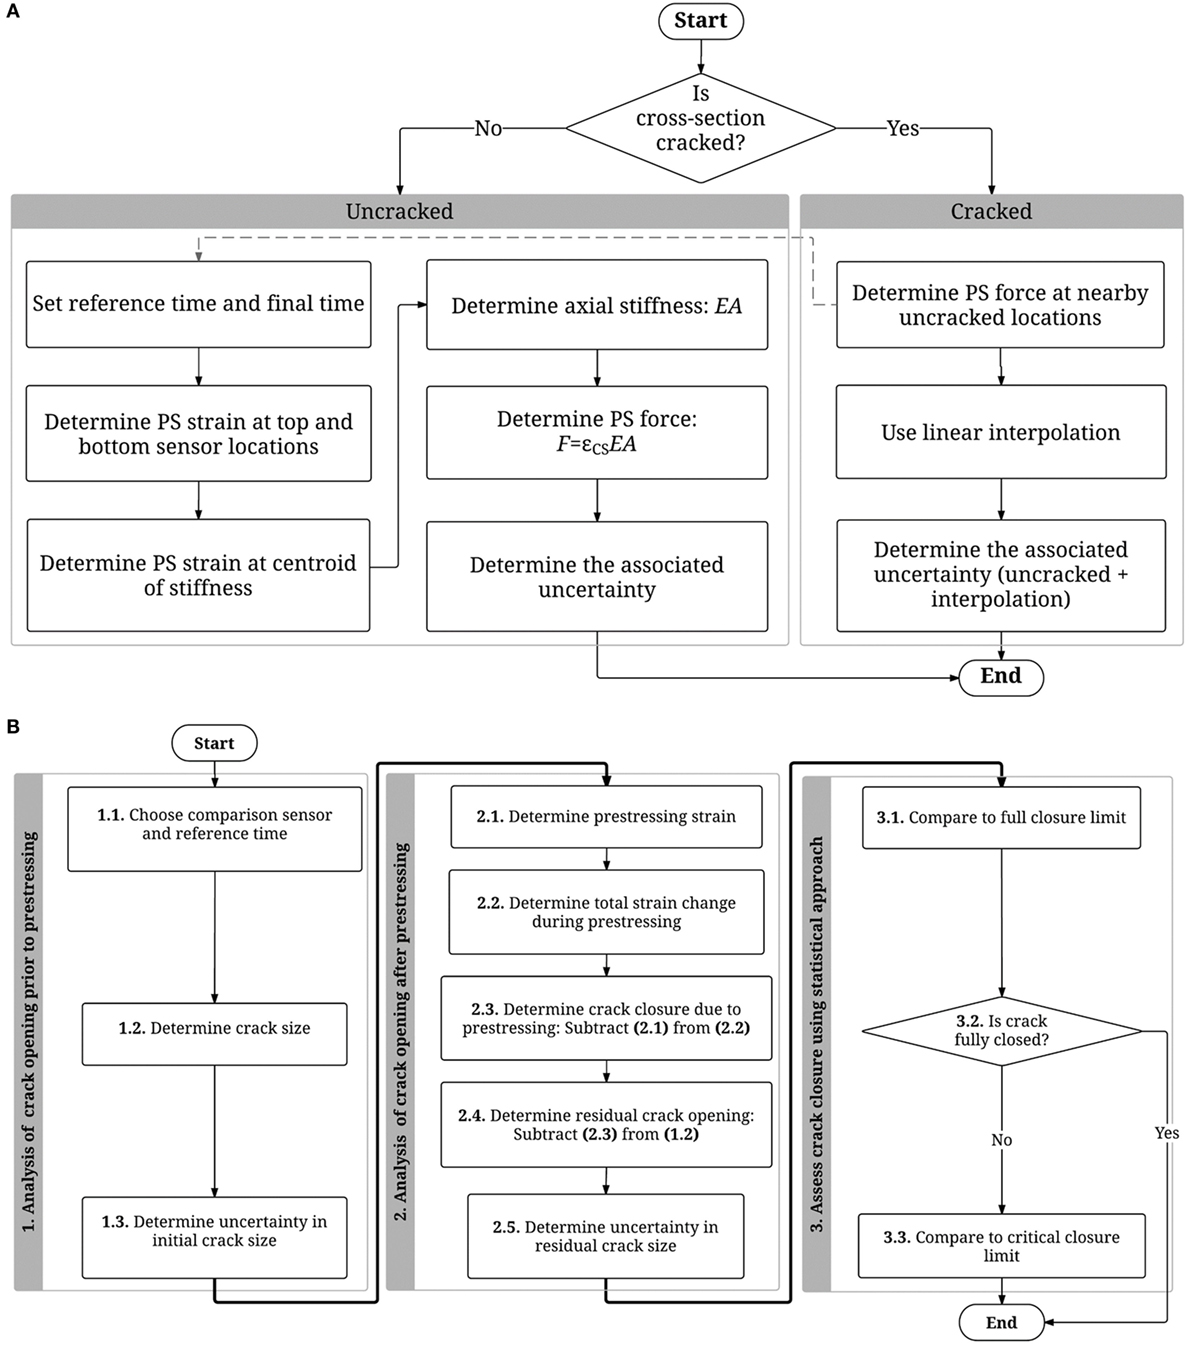
Figure 5. Flowcharts detailing the methods of analysis for the evaluation of (A) prestressing forces and (B) prerelease crack width.
Uncertainty Propagation
The uncertainties that affect the analysis in this study were considered and rigorously quantified. These include uncertainties in measurements, mechanical parameters, and geometrical parameters. For all variables, uncertainties were assumed to be 1 SD of a set of repeated measurements. Uncertainty propagation was then performed according to Eq. 5.
where y is a function of independent variables x1, x2, …, xn, and δxi is the uncertainty in variable xi.
Streicker Bridge Instrumentation
The methods presented in Section “Methods” were applied to data from a pedestrian bridge on the Princeton University campus, Streicker Bridge. The bridge was constructed in 2009 and is composed of a main span and four approaching legs, as shown in Figure 6. The overall length of the bridge is 104 m with a constant deck depth of 578 mm. The main span is a deck-stiffened arch, and the approaching legs are curved continuous girders supported on Y-shaped steel columns. The deck is made of post-tensioned high-performance concrete (NJ DOT Class A HPC), and the arch and columns are made of weathering steel (Yolloy).
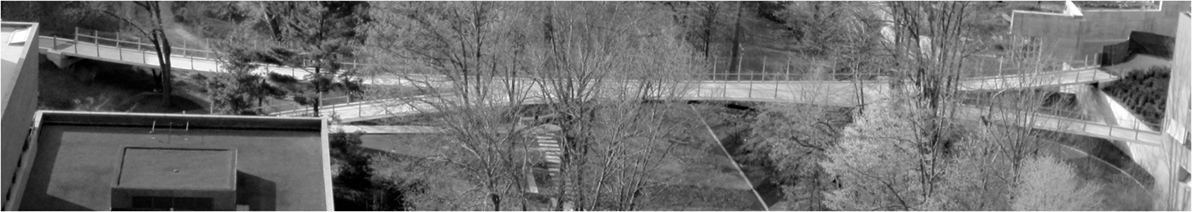
Figure 6. Top view of Streicker Bridge.
The main span and three of the approaching legs were constructed in August 2009. The construction of the southeast leg was delayed until October 2009. Thus, although the materials had the same nominal specifications for both the main span and the southeast leg, the different construction times resulted in different actual batches of the concrete used for the construction of the two parts of the bridge, in addition to different pouring and curing conditions. This fact, combined with the different structural systems of the two parts of the bridge, allows the treatment of the two parts as two separate structures for all practical purposes.
Because of symmetry and the purpose of instrumentation being research and education oriented, the instrumentation of the bridge was limited to the approaching leg with the longest span, the southeast leg, and half of the main span.
The bridge is instrumented with two different sensing technologies. The methods presented in this paper use long-gage fiber optic sensors and as such will only describe the relevant components of the corresponding monitoring system. More details regarding the full instrumentation of the bridge are given in Sigurdardottir and Glisic (2015). Prior to the pouring of concrete, parallel sensors were installed at several locations along the southeast leg, namely, at the extremities of the beam structure, above columns (maximal negative bending moments), in mid-spans (maximal positive bending moments), and at two additional locations, i.e., at the quarter-spans of the longest span. A gage length of 60 cm was selected based on the guidelines given by Glisic (2011). Plan view of the locations and naming conventions of the sensors are shown in Figure 7 (see also positions of the sensors in elevation of the main span in Figure 2A and in cross-section in Figure 2B).
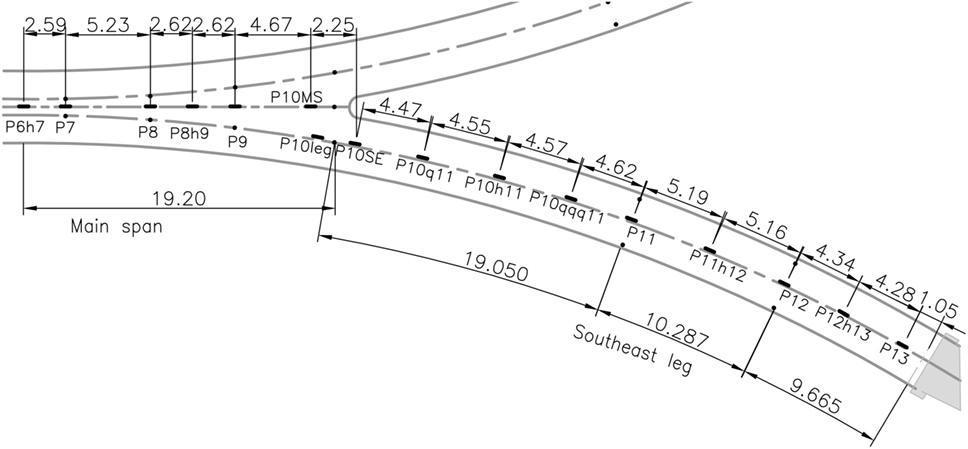
Figure 7. Top view of Streicker Bridge with sensor locations along the main span and the southeast leg (Sigurdardottir et al., 2012).
In this study, the uncertainties in temperature and strain measurements were ±0.2°C and ±4 με, respectively, based on the manufacturer’s specifications. The geometrical parameters considered were the locations of the sensors and the dimensions of the structure, for which the uncertainties were assumed to be ±5 and ±10 mm, respectively, based on site measurements and tolerances. The uncertainty in mechanical parameters, namely, the modulus of elasticity, was set at ±20% as specified by ACI 318-08 (ACI, 2008).
Results and Discussion
The methods presented in Sections “Prestressing Force” and “Prerelease Crack Width” were applied to the two parts of Streicker Bridge. The method for the determination of the prestressing forces (see Prestressing Force) was applied to both main span and southeast leg of Streicker Bridge, and a statistical approach was used to determine whether or not the deviation from design values is significant. The method for the determination of the width of cracks after prestressing (see Prerelease Crack Width) was applied to the southeast leg of the bridge, as only this part of the bridge experienced prerelease cracking. Prerelease cracks occurred at four locations along the deck of the southeast leg a few days after pouring and before prestressing were performed. They were detected and characterized using the same monitoring system presented in Section “Streicker Bridge Instrumentation” (Hubbell and Glisic, 2013). They were caused by thermal gradients during the early age in the concrete deck. A statistical method was applied to the results to determine whether or not residual cracks were within the critical crack width limits.
Prestressing Force
Using the strain measurements and the method presented in Section “Prestressing Force,” the value of the prestressing force at all instrumented locations along the main span and southeast leg was determined. Uncertainties in all the input parameters were considered in order to determine the uncertainty in the value of the force, as presented in Section “Uncertainty Propagation.” More details on the determination of the uncertainty are presented in Abdel-Jaber and Glisic (2014). Assuming the force values to have Gaussian distributions with means equal to the force values determined based on Section “Prestressing Force” and SDs equal to the determined uncertainties, confidence intervals were determined. A threshold of 80% was set on the confidence interval, such that any design value that falls outside the 80% confidence interval is considered significantly different from the value determined by the SHM method. The threshold was determined based on experience and engineering judgment. The example of results is presented in Figure 8 for the main span.
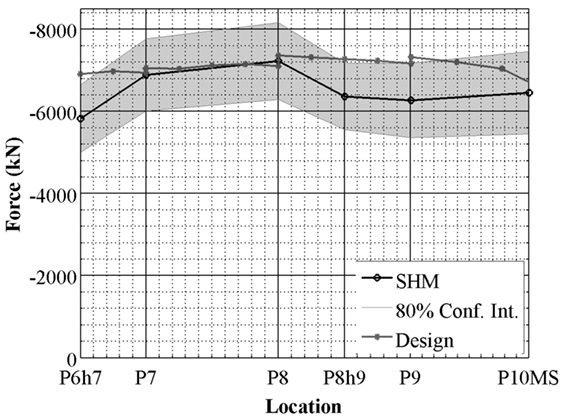
Figure 8. Comparison of SHM and design prestressing force values for the main span of Streicker Bridge.
As shown in Figure 8, the values at locations P6h7, P8h9, and P9 show a significant deviation from the design values. Based on the tests on the bridge, section P6h7 seems to perform with a higher stiffness than predicted by the design, possibly due to composite action between the deck and arch at that location (Sigurdardottir et al., 2012). At locations P8h9 and P9, the deviation is explained by the influence of the anchorage at location P10MS that was not previously accounted for in the design. The anchorage losses seem to propagate over a longer length than predicted by the design. Tests of the bridge indicate no significant consequence of the losses on the condition of the structure (Sigurdardottir and Glisic, 2015).
The prestressing force for the southeast leg was with 80% confidence equal to the design at all instrumented locations (Abdel-Jaber and Glisic, 2014), and the test of the bridge confirmed its expected performance.
Prerelease Crack Width
The method presented in Section “Prerelease Crack Width” was first applied to all locations (healthy and cracked) along the southeast leg to determine the accuracy of the method. Only locations P10, P10h11, P11, and P11h12 exhibited prerelease cracks. As shown in Figure 9, this is reflected in the results by the larger strain due to crack at these locations. At all other locations, the small value of the strain is due to the inaccuracy of the method, which is on the order of 5 μɛ on average. This model uncertainty was accounted for in subsequent analysis.
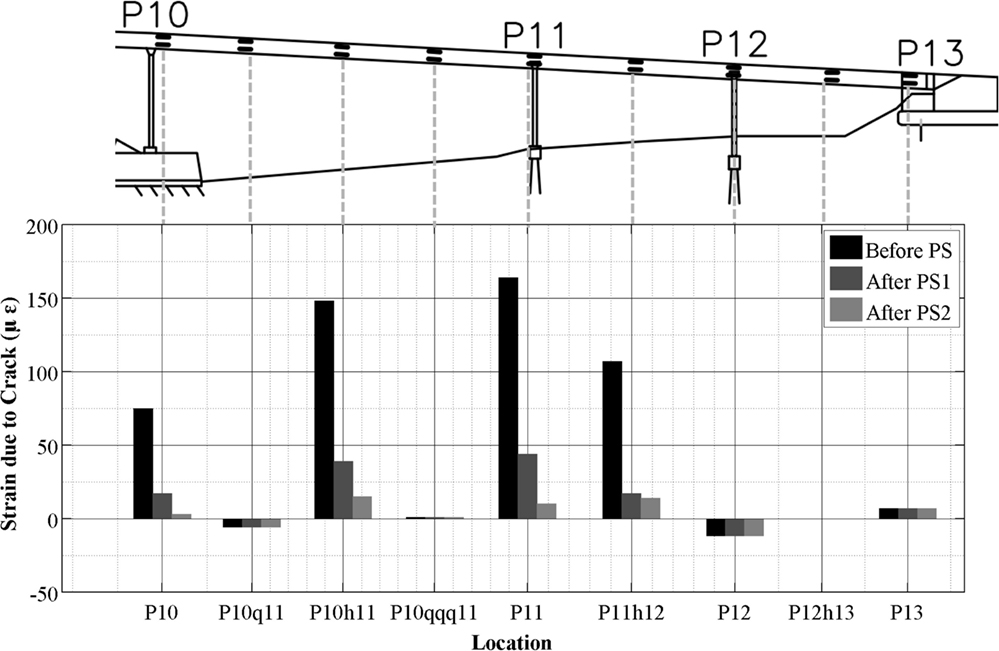
Figure 9. Summary of strain due to crack at the centroid of stiffness of all instrumented locations along the southeast leg of Streicker Bridge (grayed labels refer to cracked locations).
Prestressing was performed in two stages on the southeast leg. As shown in Figure 9, a large percentage of the crack closure occurred during the first stage, which is expected as the interfaces need to be sufficiently close for force transfer. Residual cracks after the second stage of prestressing were tested for statistical significance from the full closure limit (0 mm) and the critical closure limit for humid environments (0.3 mm) (Nilson, 1987). The results are presented in Table 1. The crack widths were assumed to have Gaussian distributions with means as determined in Section “Prerelease Crack Width” and SDs as determined based on uncertainty propagation in Section “Uncertainty Propagation.” A threshold of 20% was used for statistical significance, such that a confidence level below 20% indicates that the residual crack width and the limit under consideration are significantly different. Based on the results in Table 1, all crack widths are below the 0.3 mm limit with a confidence that exceeds the threshold of 20%. Additionally, the crack widths at all locations are not significantly different from the full closure limit of 0 mm based on the 20% threshold. Residual cracks in the order of 0.01 mm are possibly due to degradation of the crack interfaces that cause a mismatch preventing the interfaces from fitting together. Thus, structural capacity remains uncompromised due to locking of interfaces.
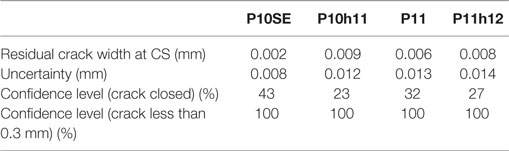
Table 1. Confidence levels for significance of residual cracks in the southeast leg of Streicker Bridge (Abdel-Jaber and Glisic, 2015).
Conclusion
Prestressed concrete structures represent a significant percentage of newly built bridges and thus require suitable monitoring parameters and methods, given the condition of current infrastructure and the need for SHM. This paper presents an integral overview of two monitoring parameters and methods for prestressed concrete, the distribution of prestressing forces, and the width of prerelease cracks. The methods outline the use of the parameters for condition assessment of prestressed concrete bridges.
The methods were applied to Streicker Bridge at the Princeton University campus. The analysis showed that the prestressing force transfer was mostly adequate except at three locations. At one location, previously observed higher stiffness was detected again. At two other locations close to one of the extremities of the main span of the bridge, anchorage losses higher than predicted in the design are suspected. Tests of the bridge confirmed that the differences are minor and do not impact the safety or performance of the structure. Additionally, analysis is performed on the southeast leg of the bridge where the deck experienced prerelease cracks at four locations. Results from the analysis indicate that minor residual cracking may persist. However, the cracks were closed beyond critical limits with high statistical significance and do not impact the structural safety and condition of the bridge.
Author Contributions
HA-J had substantial contributions to the creation of methods, and analysis and interpretation of data; she drafted the paper. BG advised and supervised the work, revised the draft of the paper, and approved the final version to be submitted. Both authors are accountable for all aspects of the work.
Conflict of Interest Statement
The authors declare that the research was conducted in the absence of any commercial or financial relationships that could be construed as a potential conflict of interest.
Acknowledgments
The Streicker Bridge project has been realized with the great help and kind collaboration of several professionals and companies. We would like to thank Steve Hancock and Turner Construction Company; Ryan Woodward and Ted Zoli, HNTB Corporation; Dong Lee and A G Construction Corporation; Steven Mancini and Timothy R. Wintermute, Vollers Excavating and Construction, Inc.; SMARTEC SA, Switzerland; Micron Optics, Inc., Atlanta, GA, USA; Geoffrey Gettelfinger; James P. Wallace; Miles Hersey; Paul Prucnal; Yanhua Deng; Mable Fok; and Faculty and staff of the Department of Civil and Environmental Engineering. The following students installed the sensors on Streicker Bridge: Chienchuan Chen, Jeremy Chen, Jessica Hsu, George Lederman, Kenneth Liew, Maryanne Wachter, Allsion Halpern, David Hubbell, Morgan Neal, Daniel Reynolds, and Daniel Schiffner. Special thanks to Dorotea Sigurdardottir for the permission to use her drawings.
Funding
This work was partially supported by the National Science Foundation Grant No. CMMI-1362723. Any opinions, findings, and conclusions or recommendations expressed in this paper are those of the authors and do not necessarily reflect the views of the National Science Foundation.
References
Abdel-Jaber, H., and Glisic, B. (2014). A method for the on-site determination of prestressing forces using long-gauge fiber optic strain sensors. Smart Mater. Struct. 23, 075004. doi:10.1088/0964-1726/23/7/075004
Abdel-Jaber, H., and Glisic, B. (2015). Analysis of the status of pre-release cracks in prestressed concrete structures using long-gauge sensors. Smart Mater. Struct. 24, 025038. doi:10.1088/0964-1726/24/2/025038
ACI. (2008). Building Code Requirements for Structural Concrete (ACI 318-08) and Commentary: An ACI Standard. Farmington Hills, MA: American Concrete Institute.
ASCE. (2013). 2013 Report Card for America’s Infrastructure. Available at: http://www.infrastructurereportcard.org/bridges/
Baran, E., Shield, C. K., French, C. E., and Wyffels, T. A. (2004). Analysis of the effects of vertical pre-release cracks on prestressed concrete bridge girders. PCI J. 49, 114–130. doi:10.15554/pcij.11012004.114.130
Federal Highway Administration. (2014). NBI ASCII Files. Available at: https://www.fhwa.dot.gov/bridge/nbi/ascii.cfm?year=2014
Glisic, B. (2011). Influence of the gauge length on the accuracy of long-gauge sensors employed in monitoring of prismatic beams. Meas. Sci. Technol. 22, 035206. doi:10.1088/0957-0233/22/3/035206
Glisic, B., and Inaudi, D. (2007). Fibre Optic Methods for Structural Health Monitoring. Chichester: John Wiley & Sons.
Green, J. K., Cookson, P. J., and Johnson, K. A. L. (1984). The performance of pretensioned concrete beams that have cracked before transfer of prestress. Struct. Eng. 62B, 79–85.
Hubbell, D., and Glisic, B. (2013). Detection and characterization of early-age thermal cracks in high-performance concrete. ACI Mater. J. 110, 323–330.
Sigurdardottir, D., Afonso, J. P. S., Hubbell, D., and Glisic, B. (2012). “Streicker Bridge: a two-year monitoring overview,” in Proc. 6th Int. Conf. on Bridge Maintenance, Safety and Management (Stresa, Italy), 790–797.
Sigurdardottir, D., and Glisic, B. (2013). Neutral axis as damage sensitive feature. Smart Mater. Struct. 22, 075030. doi:10.1088/0964-1726/22/7/075030
Sigurdardottir, D., and Glisic, B. (2014). Detecting minute damage in beam-like structures using the neutral axis location. Smart Mater. Struct. 23, 125042. doi:10.1088/0964-1726/23/12/125042
Keywords: prestressed concrete, prestressing forces, prerelease cracks, early-age cracks, continuous girder, long-gage fiber optic sensors, deck-stiffened arch
Citation: Abdel-Jaber H and Glisic B (2016) Structural Health Monitoring Methods for the Evaluation of Prestressing Forces and Prerelease Cracks. Front. Built Environ. 2:20. doi: 10.3389/fbuil.2016.00020
Received: 21 June 2016; Accepted: 16 August 2016;
Published: 31 August 2016
Edited by:
Babak Moaveni, Tufts University, USAReviewed by:
Kirk Grimmelsman, Intelligent Infrastructure Systems, USAJian Li, University of Kansas, USA
Copyright: © 2016 Abdel-Jaber and Glisic. This is an open-access article distributed under the terms of the Creative Commons Attribution License (CC BY). The use, distribution or reproduction in other forums is permitted, provided the original author(s) or licensor are credited and that the original publication in this journal is cited, in accordance with accepted academic practice. No use, distribution or reproduction is permitted which does not comply with these terms.
*Correspondence: Branko Glisic, bglisic@princeton.edu