A Cyber-Based Data-Enabled Virtual Organization for Wind Load Effects on Civil Infrastructures: VORTEX-Winds
 Ahsan Kareem
 Dae Kun Kwon
- NatHaz Modeling Laboratory, Department of Civil & Environmental Engineering and Earth Sciences, University of Notre Dame, Notre Dame, IN, United States
Despite many advances in the area of wind effects on structures in recent decades, research has been traditionally conducted within limited resources scattered geographically. With the trend toward increasingly complex designs of civil infrastructure combined with the escalating potential for losses by extreme wind events, a new culture of research needs to be established based on innovative and collaborative solutions for better management of the impact of extreme wind events. To address this change, this paper presents a new paradigm of a multiscale cyber-based laboratory framework for the analysis/design, modeling, and simulation of wind load effects based on an ongoing collaborative cyberinfrastructure-based platform, Virtual Organization for Reducing the Toll of EXtreme Winds (VORTEX-Winds, https://vortex-winds.org), and discusses its current status since its inception in 2007 and ongoing developments. This collaborative framework as it evolves would enable a paradigm shift by offering advanced cyber-enabled modules (e-modules) for accelerating advances in research and education to achieve improved understanding and better modeling of wind effects on structures. Accordingly, it will enhance wind community’s analysis and design capabilities to address next-generation challenges posed by wind. Through empowering those without computational or experimental resources, the e-modules will encompass a large set of subject areas and topics categorized as Database-enabled design, Full-scale/Field site data repository, Statistical/Stochastic toolboxes, Tele-experimentation, Uncertainty modeling, Damage assessment, and Computational platforms. This prototype will allow access to the individual e-module, while it is envisaged that next level of development in VORTEX-Winds will have the capability for an automated and integrated analysis/design through a nexus of e-modules. A highlight of the e-modules currently completed or in development is presented not only to show the efficacy of the framework to enhance and supplement the limitation of traditional off-line approaches but also to describe architecture and features of e-modules to promote additional cyber-enabled data-driven developments in the field.
Introduction
Wind-related catastrophes by extreme winds such as hurricanes, tornadoes, thunderstorms/downbursts, etc. inflict enormous devastation on the built environment and result in a staggering number of fatalities. A recent report by Munich Re Group (2012) showed that North America has been most affected by weather-related extreme events in the world in recent decades. To better understand and manage the impact of such extreme wind events, a new culture of research needs to be developed based on innovative solutions. In this regard, a virtual organization (VO) or cyberinfrastructure (CI) has been recognized as a possible means in many disciplines to offer real-time shared access to geographically dispersed resources, which would enable the pooling of resources reliant on Internet and information technology (IT) (Kijewski et al., 2003; Frame et al., 2009). A conceptual example framework for integrated design for wind effects is envisioned in Figure 1A in which computational, experimental, and other features are managed and coordinated by a cyber studio using a cloud platform.
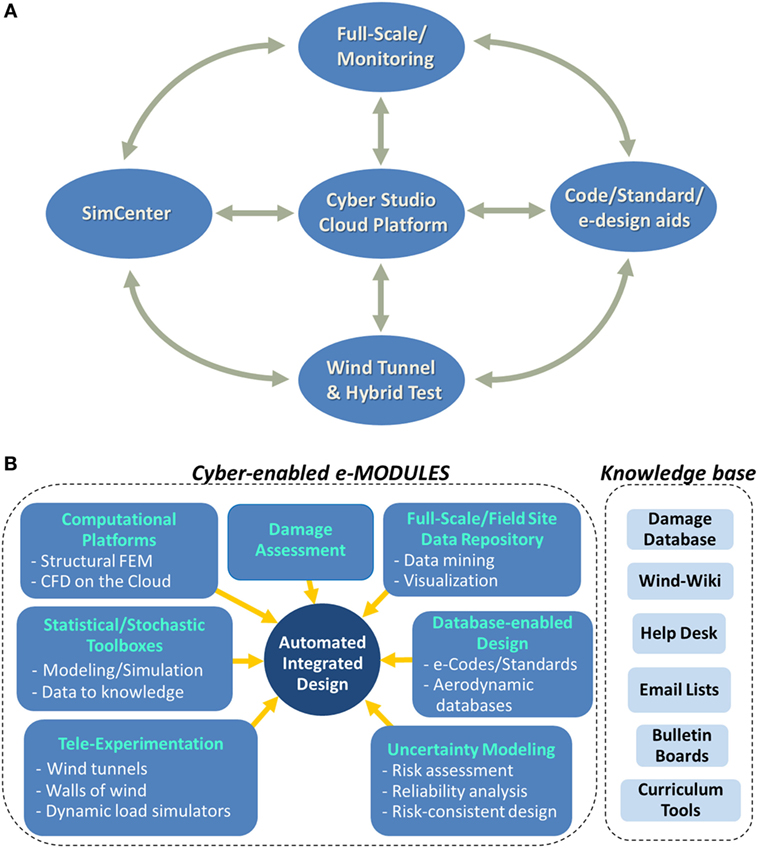
Figure 1. (A) Modeling wind effects. (B) Schematic of VORTEX-Winds capabilities.
Other fields are fast recognizing the potential impact of such a technology. An example is NERC environmental eScience consortia comprising a variety of VOs in the fields of environmental sciences to share resources and perform collaborator (Gurney et al., 2009). Similarly, the structural design field is currently at the dawn of adopting a new IT known as Building Information Modeling, which promises to revolutionize the design and the construction of buildings. Building Information Models are 3-D, smart, parametric e-models of buildings that are shared by a team of designers and builders to facilitate the exchange and interoperability of information in a digital format. However, such a conventional concept of VO or CI that simply shares valuable resources for collaboration has now evolved into the new stage with the rapid IT developments. For example, nanoHUB for nanotechnology offers not only community-contributed resources but also online computational tools based on grid computing (Goasguen et al., 2008). In structural engineering field, the Network for Earthquake Engineering Simulation (NEES) (Van Den Einde et al., 2007) offered a feature of networked facilities for enhancing seismic hazard research through hybrid tests. These facilities have made high-end resources accessible to groups otherwise limited by their personal research tools allowing them to expand the scope of their research to address complex problems. NEES also offered computational tools by adopting the framework of nanoHUB, named NEEShub (Rodgers, 2011). Although those advanced CI frameworks despite their promise were either to computational or experimental/hybrid methods.
Similar to other disciplines that usually include broad research subjects, the topic of wind effects on structures is of an interdisciplinary nature that requires a knowledge base from a large number of subject areas. It includes meteorology, structural engineering, engineering mechanics, probabilistic/statistical methods, fluid dynamics, turbulence, structural dynamics, experimental methods, risk, reliability, etc. (e.g., Kareem, 2005, 2008). For better quantifying the load effects, a new paradigm shift is required to provide efficient and reliable tools or procedures for both research and practice. Certainly, it is a daunting task to develop such innovative solutions by a group or two, thus community-level efforts are necessary. With the recognition of this demand, for example, the National Science Foundation (NSF) has recently launched a new initiative, Natural Hazards Engineering Research Infrastructure (NHERI) [National Science Foundation (NSF), 2014], replacing NEES, which is a distributed, multiuser, national platform to provide the natural hazards engineering community (e.g., earthquake and wind engineering) with access to research infrastructure. A CI underpins and integrates NHERI as a VO that offers researchers a platform for research collaboration and knowledge sharing (DesignSafe-CI1). Central to NHERI is the experimental testing, computational modeling and simulation, research data and their integration with theory for generating knowledge, and innovation needed to mitigate the impact of future natural hazards such as earthquakes, windstorms, etc. [National Science Foundation (NSF), 2014].
In anticipation of a CI based data-enabled engineering as a central component of a computational/experimental infrastructure, this study describes the evolution of a cyber-enabled framework for analysis/design, modeling, and simulation of wind load effects, Virtual Organization for Reducing the Toll of EXtreme Winds (VORTEX-Winds) at https://vortex-winds.org, and discusses its current status since its inception in 2007 and ongoing developments that predate the current CI-based initiatives. It aimed not only to facilitate an effective, transformative, and conveniently accessible methodology for the acceleration of advances in research and education in the broad area of wind effects but also offered initial developments in an end-to-end automated and integrated wind design approach for practical application in the end. This framework would enhance analysis and design capabilities to address the challenges of innovative structural systems needed to realize, in a cost effective manner, buildings with ever increasing heights, bridges that span oceans, and offshore platforms tapping hydrocarbons in deeper waters exposed to weather extremes like hurricanes. This challenge is envisaged to be accomplished by cyber-enabled e-modules classified into Database-enabled design (DED), Full-scale/Field site data repository, Statistical/Stochastic toolboxes, Tele-experimentation, Uncertainty modeling, Damage assessment, and Computational platforms. The prototype framework would allow access to the modules individually, while the fully functional VORTEX-Winds may also have the capability for automated, integrated analysis and design by interactively stitching multiple modules. Throughout a highlight of ongoing e-module projects encompassing broad wind research areas, the efficacy of the framework to enhance and supplement traditional off-line approaches is demonstrated. In addition, architectures and implementations of e-modules are described to serve as a reference or direction for prompting additional cyber-enabled developments by the community.
Overview of Vortex-Winds
The basic vision of VORTEX-Winds is the development of a comprehensive gateway for research and education to achieve improved understanding and modeling of wind effects on structures to counter the escalating loss of property and associated indirect losses and the increase in the sensitivity of emerging structural systems to winds. In response to this vision, the VORTEX-Winds was established in 2007 with the following goals:
(i) to establish and sustain a community contributing to and employing the resources integrated by CI technologies to facilitate the mitigation of escalating damage, loss of life, and disruption of local economies posed by wind;
(ii) to enhance analysis and design capabilities to address the challenges of innovative structural systems needed to realize, in a cost effective manner, buildings with ever increasing heights, bridges that span oceans, and offshore platforms in deeper waters exposed to weather extremes like hurricanes; and
(iii) to facilitate education and training of the future workforce in the field so that the growing competition in the global market is met through a cadre of well-trained professionals and educators.
VORTEX-Winds envisions offering all aspects of CI capabilities to research and engineering community in the area of wind effects on structures, including (1) communication tools to support collaboration, (2) high-performance computational infrastructure, (3) data storage, data mining, visualizations, and data warehousing, and (4) access to remote sensors and tele-experimentation. The structure of VORTEX-Winds consists of two main branches: the knowledge base and the cyber-enabled e-modules as shown in Figure 1B (Kareem et al., 2009). The knowledge base is similar to the functionality of a conventional VO to aggregate and centralize the shared knowledge of the collaboratory. Services in this area include the virtual encyclopedia, Wind-Wiki, encompassing basic terminology and concepts pertaining to wind–structure interaction, Damage database that is curated archives of postdisaster reconnaissance (e.g., Kareem, 1985, 1986), Help desk, where users can submit a question to the collaboratory and where past responses are archived as FAQ, Bulletin boards hosting open discussions, Email list servers for rapidly circulating announcements and other information, and Curriculum tools to provide educators a means to formally integrate VO services into their teaching.
A key component of VORTEX-Winds is the cyber-enabled e-modules to not only offer an automated and integrated design approach under CI but also facilitate research activities by researchers and students, which are developed by authors as well as harvested from the independent work of a number of universities (largely supported by federal funding) and government agencies such as NIST, etc. (Kareem et al., 2009). For wind design, a traditional off-line procedure for civil infrastructures as shown in Figure 2A relies on a broad-band knowledge and extensive procedures involving a variety of subjects. The integrated design approach proposed in this study mimics the traditional procedure schematically depicted in Figure 2B for providing more efficient and accurate assessment of wind effects on structures and design process. In view of the interdisciplinary nature of wind effects on structures requires knowledge from a large number of subject areas, the e-modules are classified into seven categories: Database-enabled design, Full-scale/Field site data repository, Statistical/Stochastic toolboxes, Tele-experimentation, Uncertainty modeling, Damage assessment, and Computational platforms (Figure 1B). Examples of the modules offered within each category are shown in Figures 3 and 4. The modules are currently interrogated independently but the final goal is that modules can be automatically queried and input into an integrated analysis and design approach by stitching together multiple modules. A more advanced framework will be the inclusion of a knowledge-based expert system in the loop of the integrated design concept (e.g., Kareem and Allen, 1990). Consequently, it is envisaged that VORTEX-Winds will provide access to communication, data, computational, and remote sensing and tele-experimentation services to generate a comprehensive, interactive design aid. Users will be able to execute either individual services or composite services integrated from multiple atomic services for the purpose of research activity or wind design process. This will require format conversion of data and those conversions will be provided as stand-alone services or directly integrated into the prepackaged web-service workflows. It should be noted that the interactive design aid will take the notion of hybrid simulation a step further by utilizing databases, experiments, full-scale measurements, and analytical models through repeated queries and multistage analyses.
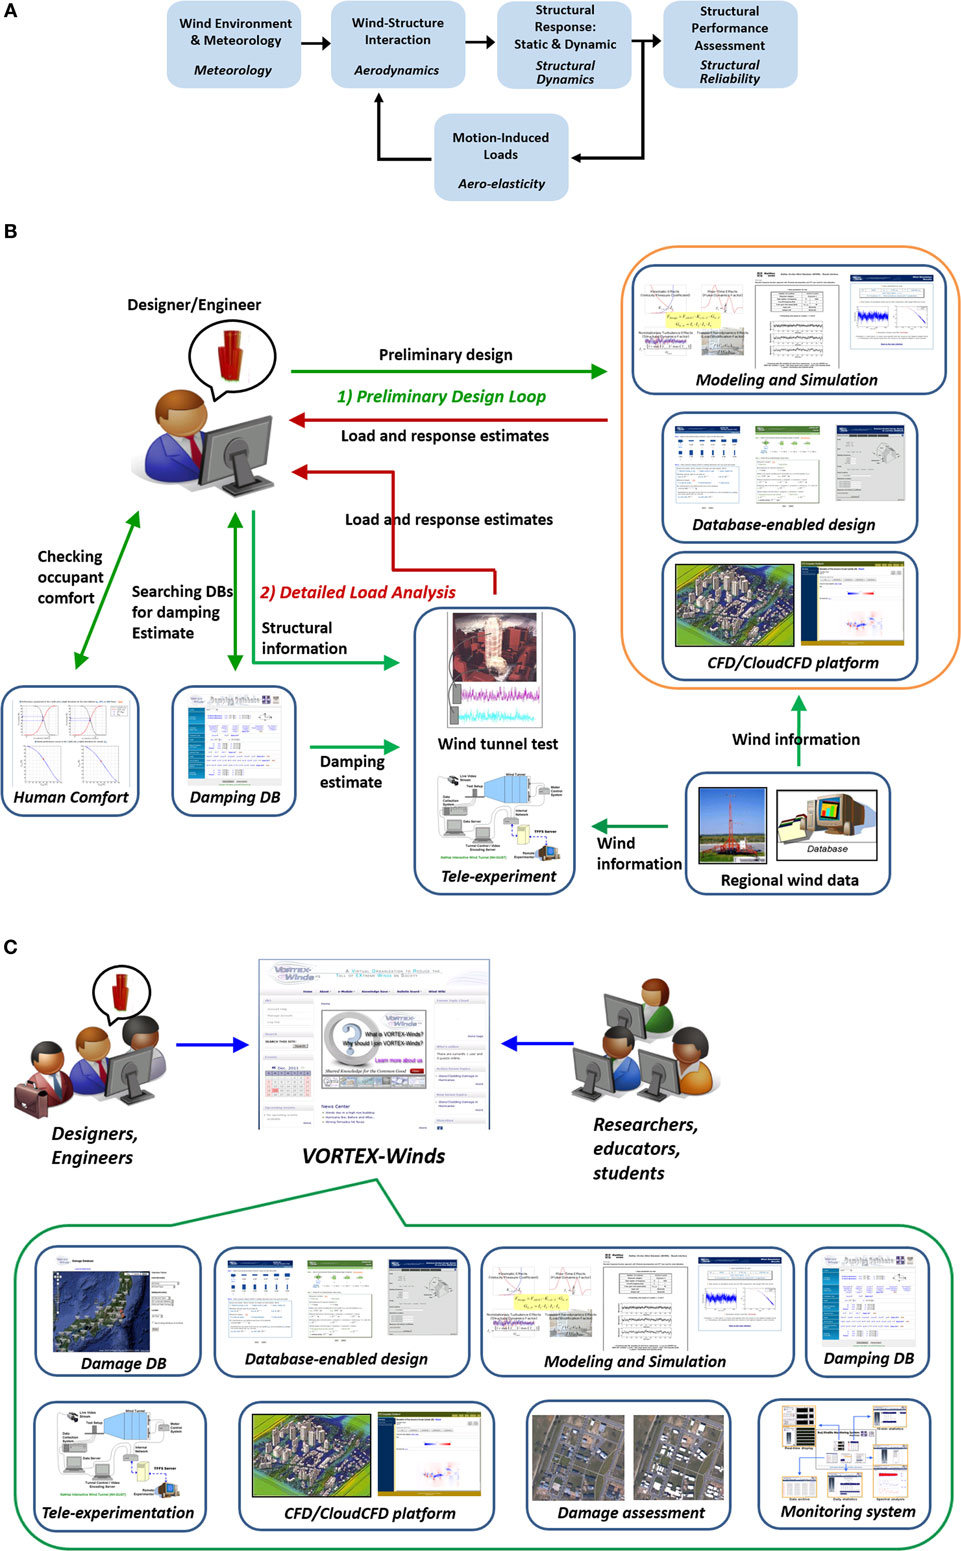
Figure 2. (A) Traditional off-line design. (B) Integrated analysis and design concept in VORTEX-Winds. (C) An overview of ongoing cyber-enabled modules.
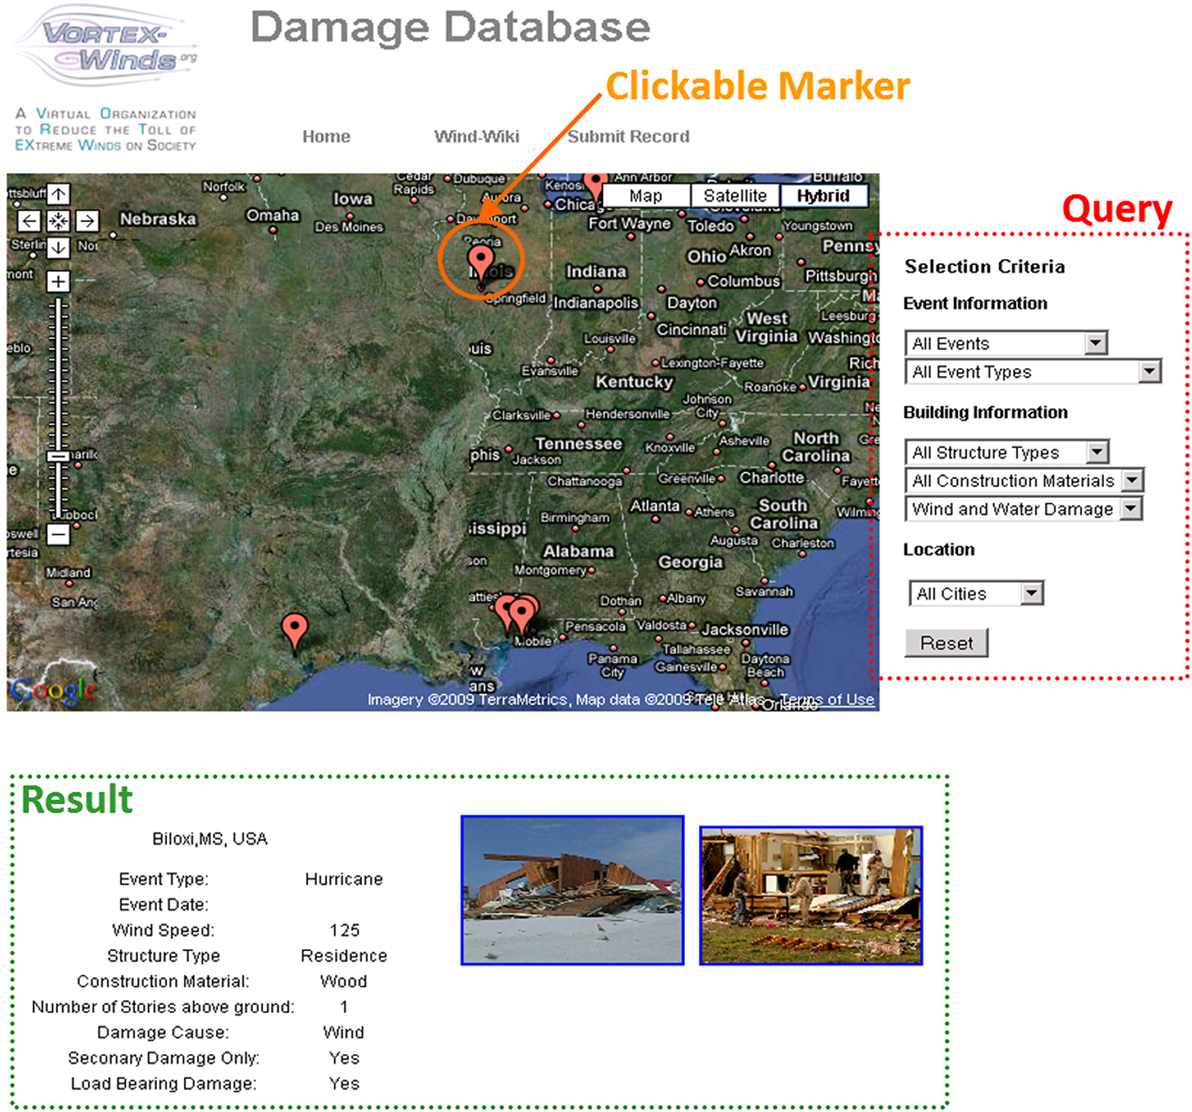
Figure 3. User interface of Damage database: damage archive in the Google map and query-based database search and damage information with photos.
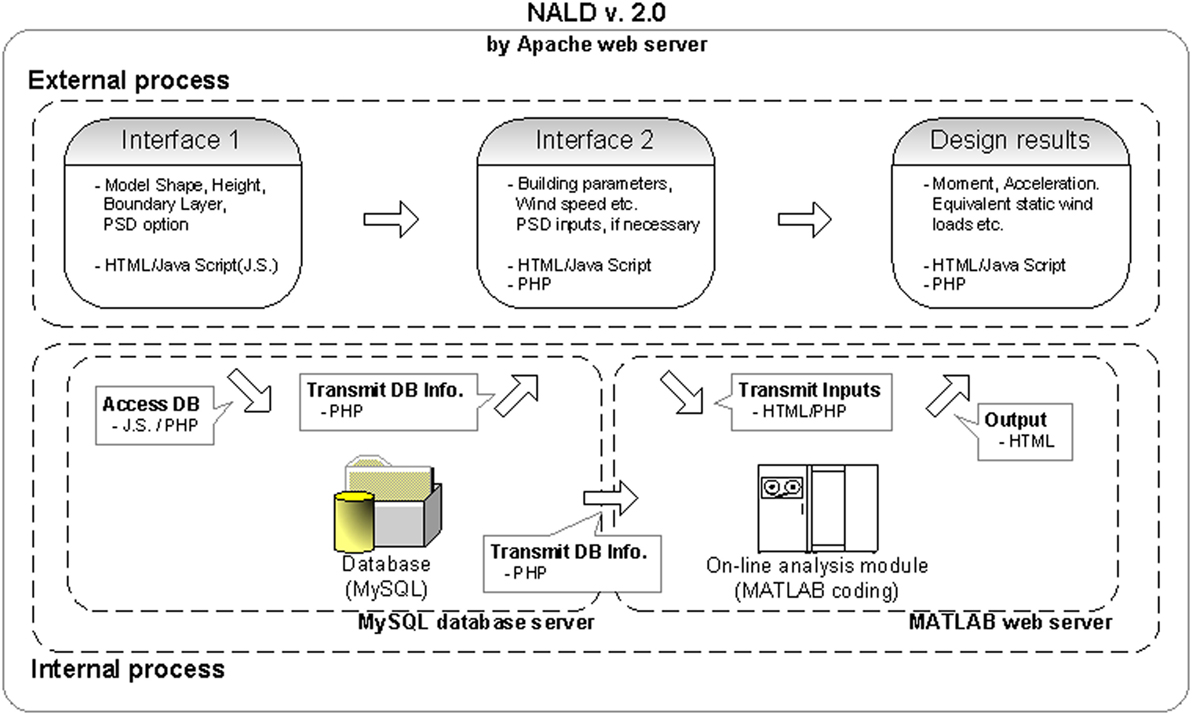
Figure 4. Schematic diagram of NatHaz aerodynamic loads database ver. 2.0 architecture.
From an educational perspective, VORTEX-Winds’ introduction of a knowledge-based framework and cyber-enabled e-modules can indirectly serve as educational tools to countless professional end users as well as K-12 and postsecondary education. This is particularly important considering the general shortage of engineers formally educated in wind effects in this country and requires intervention with K-12 students as early as possible as part of a STEM education. At the postsecondary level, for example, these services can be integrated into an introductory structural engineering course at the freshman level and a vital resource for the wind engineering and structural system courses for graduate students emphasizing the cross-disciplinary nature of modern design subject to winds. Similar efforts using web-based technology have been reported by researchers (e.g., Wang and Adeli, 2012a,b). In addition, educators such as K-12 teachers and college/university professors can use these services to develop curriculum tools. Then, these will be archived in the knowledge base for access by other educators nationwide so that VORTEX-Winds will provide an effective pedagogical tool to learn a highly technical subject, which has its roots in a host of interdisciplinary fields, through the use of cyberspace and visualization capabilities.
These services are hosted on the front end by a single gateway server with computation and analysis conducted on back-end parallel servers. The primary technical hurdle is in achieving e-module developments and their integration, which will require significant effort and coordination, particularly with respect to the integrated design feature. At this stage, VORTEX-Winds has been focusing on the achievement of individual e-modules. An overview of ongoing cyber-enabled modules is shown in Figure 2C and their current and ongoing statuses are listed in Table 1. More detailed information about the highlights of CI modules for analysis/design, modeling, and simulation modules of wind load effects on structures in the VORTEX-Winds is presented in the following sections. It is anticipated that the architecture and implementation of e-modules demonstrated in the following will serve as a reference or direction for prompting additional cyber-enabled developments by the community.
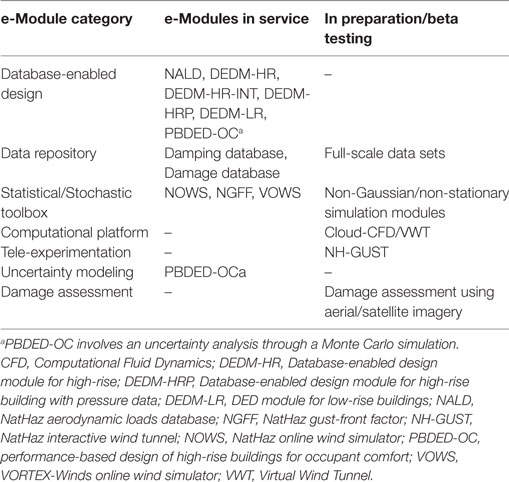
Table 1. Current and ongoing statuses of e-modules in the VORTEX-Winds.
Cyber-Enabled Analysis/Design, Modeling, and Simulation Modules
Damage Database
The Damage database is a digital repository of postdisaster investigation documenting damage to structures during extreme wind events such as hurricane/typhoon/cyclone, tornado, thunderstorm/downburst, extratropical winds, etc. The information provided by this database may be beneficial to a variety of studies, e.g., evaluation of extreme wind effects on structures in full-scale, learning lessons from extreme events to improve structural design, postdisaster assessment in a regional area, correlation between wind speed and structural performance in damage aspect, etc. (e.g., Kareem, 1985, 1986). The database was established based on a web-based database-query method and powered by Google Map/Earth API (Google, 2015), which allows users to geographically view submissions of fellow VORTEX-Winds members, sorting by location, event classification, and damage attributes automatically (Figure 3). Users can search damage archives either by pointing at a spot in the Google map or by using query-criteria in the right side of the map. Each damage report is comprised of wind event on damage, maximum wind speed, damage location in either addresses or GPS coordinates, structural properties, damage photos, etc. which registered members can upload their own damage reports to the database through a web interface.
It is worth noting that this Damage database is one of the first e-module developed for the VORTEX-Winds in 2009, thus rather old technology in view of current rapid developments in web-based technologies. For this reason, we are in the process of eventually retiring this module and transfer the existing data to newly developed “Data Intake and Discovery” module in CyberEye (Kijewski-Correa et al., 2014) in which authors are also involved. It is envisioned that this new module will be further enriched with the contribution of members over time.
DED Frameworks
Most international wind codes and standards traditionally have relied on reductive formats and simplifications, which often lead to tables and plots that describe wind loads on structures, especially, focusing primarily on the alongwind response owing to the introduction of the well-known quasi-steady/strip theories and gust loading factor approach introduced by Davenport (1967) and later further refined over the years by several researchers (e.g., Solari, 1993a,b; Solari and Kareem, 1998; Zhou and Kareem, 2001; Kareem and Zhou, 2003). However, failure of the basic assumptions in these theories and the gust loading factor approach in the acrosswind and torsional directions has precluded a formulation based on first principles. Some codes and standards do provide limited guidelines on these aerodynamic loads, however, they are restricted to empirical expressions based on measured response of limited number of building models tested in wind tunnels. Although these expressions are still valuable for assessing preliminary estimates of response, their accuracy may not be consistent for different shapes as often small changes in the shape result in major changes in the aerodynamic effects. In addition, the level of accuracy inherent in codification information in this format and the uncertainty associated with interpolation or extrapolation of information may compromise the overall accuracy in code-specified load effects.
To overcome the aforementioned limitation, a DED procedure has been gradually gaining acceptance. The basic concept of DED is to directly use wind tunnel-derived data to better estimate the response instead of relying on code/standard-based procedure. A DED generally offers convenient meshing of a database with analysis software for either low to mid-rise and high-rise buildings. The NatHaz aerodynamic loads database (NALD) ver. 1.0 introduced in 2000 has served an important first step in establishing a DED through online experimental archive of high frequency base balance (HFBB) data for use in the preliminary design of high-rise buildings subjected to wind loads. As a result, NALD ver. 1.0 was introduced in the Commentary of ASCE 7-05 (C6.5.8) [American Society of Civil Engineers (ASCE), 2005] and the latest ASCE 7-10 (C26.9) [American Society of Civil Engineers (ASCE), 2010] as an alternative means of assessing the dynamic wind load effects on high-rise buildings. This includes the web-enabled wind tunnel data dissemination to evaluate the response of tall buildings (Zhou et al., 2003). However, it required manual dynamic analyses based on random vibration theory for the preliminary design.
To overcome the last step in NALD v. 1.0 (Zhou et al., 2003) involving off-line calculations, a more advanced DED framework for estimating the wind-induced response of tall buildings has been proposed with the help of recent developments in IT (Kwon et al., 2008). This new paradigm offers an attractive solution with a concept of a cyber-based online on-the-fly analysis/design via user-friendly web interfaces. It is particularly useful for those who may not be very familiar with the details of the random vibration-based dynamic analysis procedure generally used in conjunction with wind tunnel-driven data. Accordingly, NALD evolved into version 2.0 in 2004 using this advanced framework. NALD ver. 2.0 (Kwon et al., 2005, 2008) has integrated the latest advances in data management and mining for interactive queries of aerodynamic load data and an integrated web-based analysis framework for determining the resulting maximum displacements, base moments, and equivalent static wind loads (ESWL) for survivability and peak/root mean square (RMS) accelerations for serviceability (habitability). The key feature of NALD ver. 2.0 is the flexibility that its analysis module offers: users may select not only the data from the online NALD but also may input desired power spectral density (PSD) expressions or wind tunnel-derived PSD data set obtained from HFBB experiment for the evaluation of wind load effects on high-rise buildings. Thus, it also serves as a stand-alone analysis engine. The NALD ver. 2.0 provides a platform that can be readily expanded and supplemented to yield a comprehensive, simplified, and efficient avenue for e-analysis/design of high-rise buildings. The architecture of NALD ver. 2.0 and the role of various web-based tools such as HTML/Java Script and PHP are summarized in Figure 4. It is basically operated by Apache web server with two main processes, i.e., external (foreground) process and internal (background) process. The external process includes user-friendly web interfaces for the selection of a desired analysis case (interface 1 as shown in Figure 5A), additional interfaces for design inputs such as structural parameters of building (interface 2), and display of analysis results for the user-specified building. On the other hand, the internal processes are server-side operations involving MySQL for database operations and MATLAB (Mathworks, 2015) for the computation, which are implicitly utilized in NALD ver. 2.0. The MySQL database server handles data transmissions between interfaces and if necessary transmits information stored in the database. Preprogrammed MATLAB and PHP codes function as a numerical analysis engine for on-the-fly calculations as well as serving as the nexus between interface 2 and the design results. The cyber-based online analysis module performs the requisite calculations and then generates meaningful figures such as the non-dimensional PSD and ESWL, as well as downloadable output file. This architecture became a prototype cyber-based framework, which prompted further development of DED modules such as DEDM-HR, Database-enabled design module for high-rise building with pressure data (DEDM-HRP), DED module for low-rise buildings (DEDM-LR), and performance-based design of high-rise buildings for occupant comfort (PBDED-OC), which will be discussed in the following.
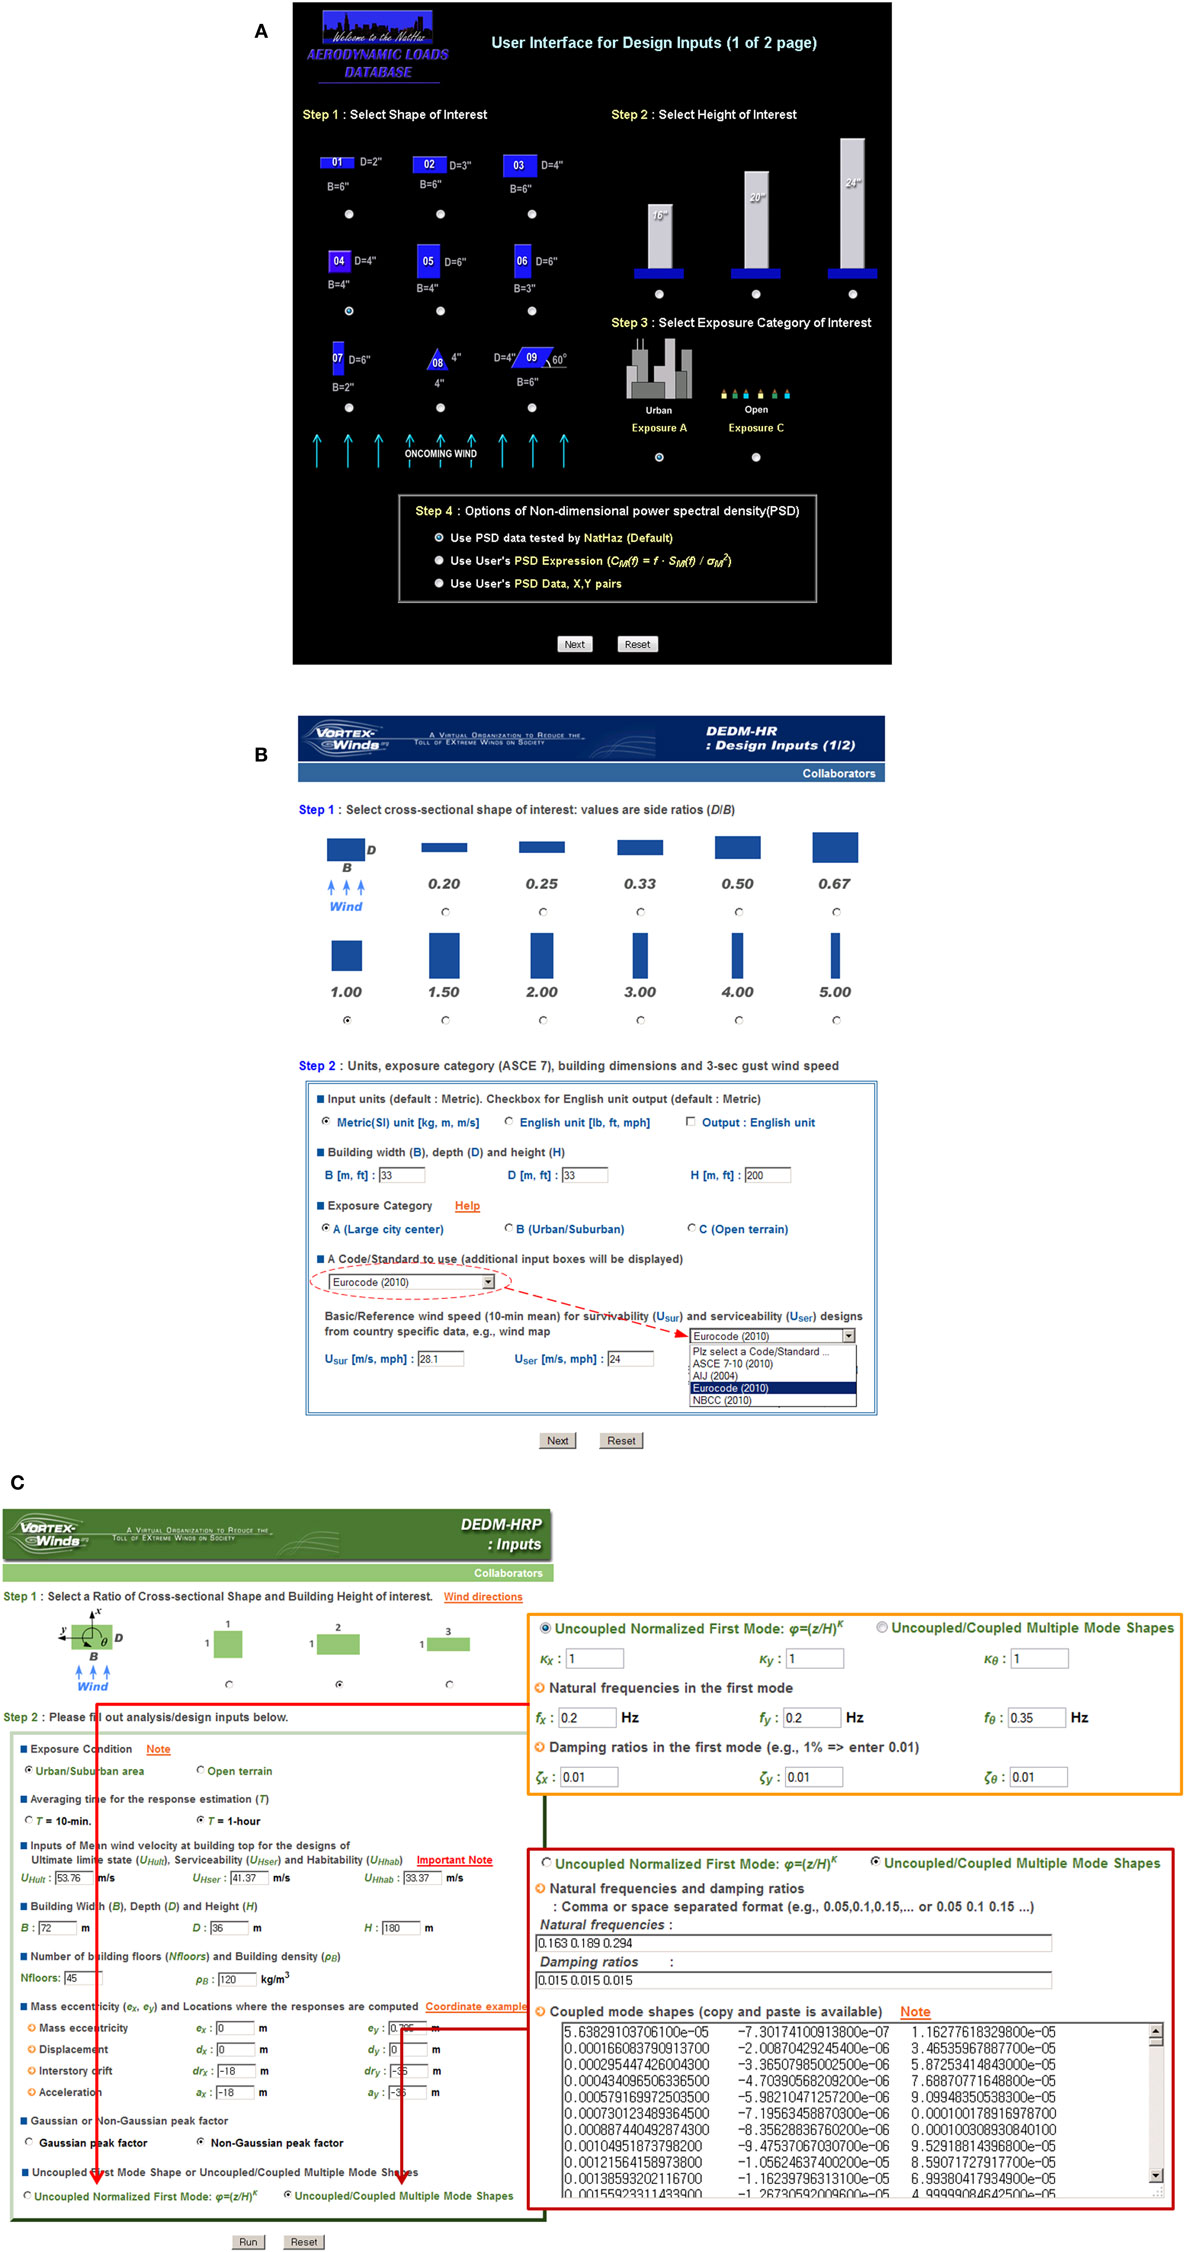
Figure 5. Examples of web-enabled Database-enabled design user interfaces (A) NatHaz aerodynamic loads database v. 2.0; (B) Database-enabled design module for high-rise. (C) User interface of Database-enabled design module for high-rise building with pressure data.
Database-Enabled Design Module for High-Rise
Although DED is a promising design procedure for better and more reliable wind-induced responses than conventional codes and standards, it requires a database of wind tunnel data, which are often limited in building shapes and configurations. As more data sets become available, the designers/researchers will have more flexibility. To alleviate this limitation, a DEDM-HR introduced a new concept of DED, which seamlessly pools multiple HFBB measurement databases from geographically dispersed locations and merges them efficiently to expand the number of available building configurations for the preliminary design (Kwon and Kareem, 2013a). This feature not only offers a new direction for the research and professional community that can be utilized to efficiently pool multiple databases, expand capability of individual database and ensures the reliability of design estimates to pool databases in the future. In addition, the DEDM-HR embeds a novel feature that allows the employment of wind characteristics defined differently between codes/standards to supplement the specifications of a specific code or standard, which in many cases lacks guidance on the acrosswind and torsional response estimates (Figure 5B). Currently, the DEDM-HR is associated with two databases: one is the NatHaz database from the NatHaz Modeling Laboratory, University of Notre Dame, USA, which is also the one used in the NALD (Zhou et al., 2003; Kwon et al., 2005, 2008), and the other is the Tamkang University database from the Wind Engineering Research Center, Tamkang University, Taiwan (Cheng and Wang, 2004).
Database-Enabled Design Module for High-Rise Building with Pressure Data
The aforementioned DED modules such as NALD and DEDM-HR have utilized HFBB database(s) resulting from the HFBB technique, which is a relatively simple and popular experiment to measure base forces/moments. Nonetheless, it involves some inherent drawbacks such as mode shape corrections and the assumption of wind pressure distribution over the building surface. On the other hand, the synchronous pressure measurement (SPM) technique in wind tunnel test is to synchronously measure the pressure fields using a test model with quite a number of pressure taps distributed at a model surface, which has the advantage to directly assess local and global aerodynamic loads acting on the structure without specific assumptions. Thus, the technique offers the direct estimation of the generalized forces including any coupled effects, non-linear and higher mode shapes (e.g., Kwon et al., 2005, 2008; Cluni et al., 2011). A drawback concerning the SMP technique is that a large number of pressure taps are required to accurately estimate wind loads, which may cause an issue of manufacturing test models, especially for complex geometries to locate pressure taps. In addition, the amount of data is generally much larger than HFBB experiments. Furthermore, the treatment and management of SMP datasets with the knowledge of complex background theories and procedures are often difficult. For an effective treatment of a large SPM data set within the concept of cyber-based DED framework, a DEDM-HRP has been developed (Kwon et al., 2014). It addresses the management of synchronously measured pressures and their reduction to global loads, which is often a daunting task due to the large amount of data information involving highly sampled time histories by its experimental nature. DEDM-HRP currently hosts a publicly available Tokyo Polytechnic University (TPU) aerodynamic database for a variety of building configurations for side and aspect ratios and various wind directions for each test model to account for directional effects of winds (Tamura, 2013). However, the e-module can be easily expanded to host multiple SPM databases similar to DEDM-HR. This framework is based on a time domain treatment of the random vibration (e.g., Simiu et al., 2008) and uses a minimal set of easily obtainable parameters as input such as wind speed, natural frequencies, and mode shapes of a target building etc., which the user can interact with user-friendly web interfaces (Figure 5C). For efficient calculation to minimize online computational time, this module employed a dynamic analysis based on floor level loads, precalculated and stored within the module. Estimated outputs are maximum base shears and moments, maximum top displacement/acceleration responses for alongwind, acrosswind, and torsional directions, and various oncoming wind directions. In addition, DEDM-HRP also offers the assessment of ESWL based on the formulation in Chen and Kareem (2005) for preliminary design purposes.
DED Module for Low-Rise Buildings
This new DED concept has been expanded to address a need for a preliminary design of low-rise buildings, namely, a DEDM-LR, which provides calculation of wind loads for main frames in low-rise buildings that make direct use of pressure time histories measured at a large number of pressure taps over building models in wind tunnel tests (Kwon et al., 2016). Presently, DEDM-LR works for a database constructed at TPU, Japan (Tamura, 2013), which includes various building configurations, but it will be expanded with more available databases. The main analysis/design engine inside DEDM-LR searches for extreme load effects based on pressure data at multiple locations and wind directions given the influence line coefficient for the load effect. The fundamental theory employed in DEDM-LR have mainly been adopted from a procedure developed at NIST (Main and Fritz, 2006), which utilizes synchronous pressure data sets measured in various wind directions of a test model to evaluate responses in a low-rise building such as base moments at knee, ridge etc. using influence line coefficient-based approaches, computed using a structural analysis program such as SAP2000, etc. The DEDM-LR is basically operated under an Apache web server with two main processes, i.e., foreground and background processes as shown in Figure 6, which is similar to the architecture used in other DED modules. Foreground process functions interactive web interfaces for user inputs and analyzed/designed results and background process performs database-query and computational analysis/design.
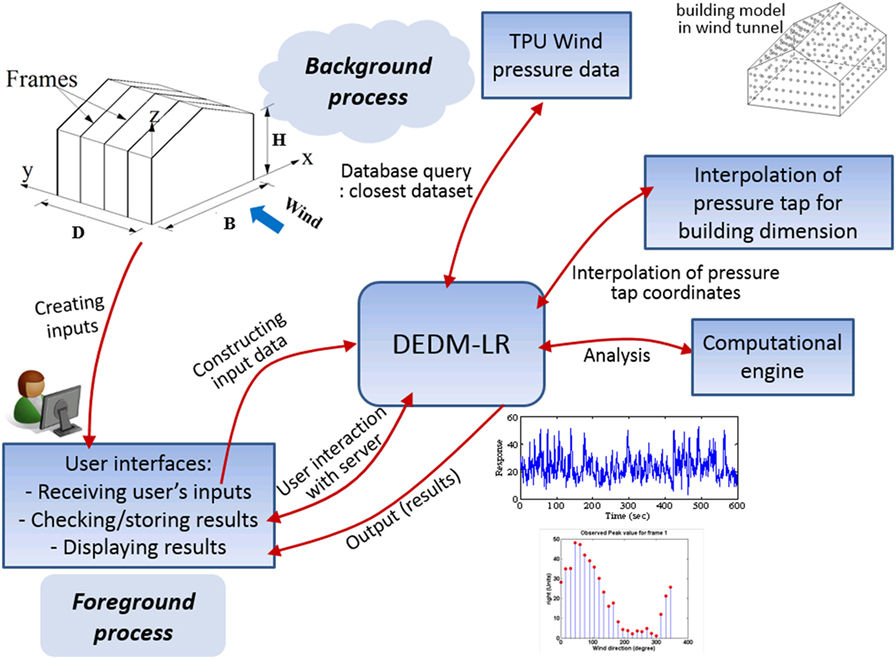
Figure 6. Schematic diagram of the Database-enabled design module for low-rise buildings framework.
Performance-Based Design of High-Rise Buildings for Occupant Comfort
Recently, the concept of web-enabled DED has also been applied to a newly developed probabilistic framework for the PBDED-OC (Bernardini et al., 2015). The performance is expressed in terms of the probability that the fraction of people on a target floor that perceive the motion exceeds a chosen value, given a mean recurrence interval for the wind event. In addition to the random perception threshold characterizing each individual occupant, other uncertainties affecting the structural response have been included concerning the wind speed, the modal characteristics of the structure, and the use of wind tunnel tests (in particular, HFBB tests), taking advantage of probabilistic models that can be found in the literature. Fully in accordance with the principles of performance-based design, the proposed framework provides the designer with a flexible tool for the description of the structural performance, where the acceptable probability of exceedance can be chosen by a team of decision-makers (designers, building owner, tenants, etc.) depending on the peculiarities of the structure, and is seen as an alternative to the use of prescriptive approaches, which are instead based on a simple comparison between demand and capacity and do not provide any information on the reliability of the structure. The input fields concern the building geometry, the 3-s gust wind speed, the type of exposure according to the ASCE Standards, and the averaging time for the response estimation (in particular a 10 min or a 1 h averaging time) can be selected, as these are the typical values adopted in most international codes and standards, the mean value of the building bulk density, the mean values of the natural frequencies and of the modal damping ratios for the first three modes (two sway modes and one torsional mode). Concerning the performance assessment, the user can choose the fraction of people perceiving the motion which is considered acceptable and the target floor. Another section of the input interface shows default values of the coefficients of variation (CoV) of the uncertain parameters considered in the analysis with a provision to change. It also offers the choice of carrying out the analyses with specific user-supplied HFBB data. In this case, the user needs to input their own PSD data. The default value for the number of samples utilized in the embedded Monte Carlo simulation for uncertainty analysis is currently set at 10,000. The results obtained from the analyses (Figure 7) are the probability of exceedance in the x and y directions, plots for performance assessment in the x and y directions for the user-defined acceptable% of people perceiving the motion (Xp%), and global performance curves for various Xp%, providing rapid estimate of the building’s performance on occupant comfort, which can be conveniently used in the preliminary design phase.
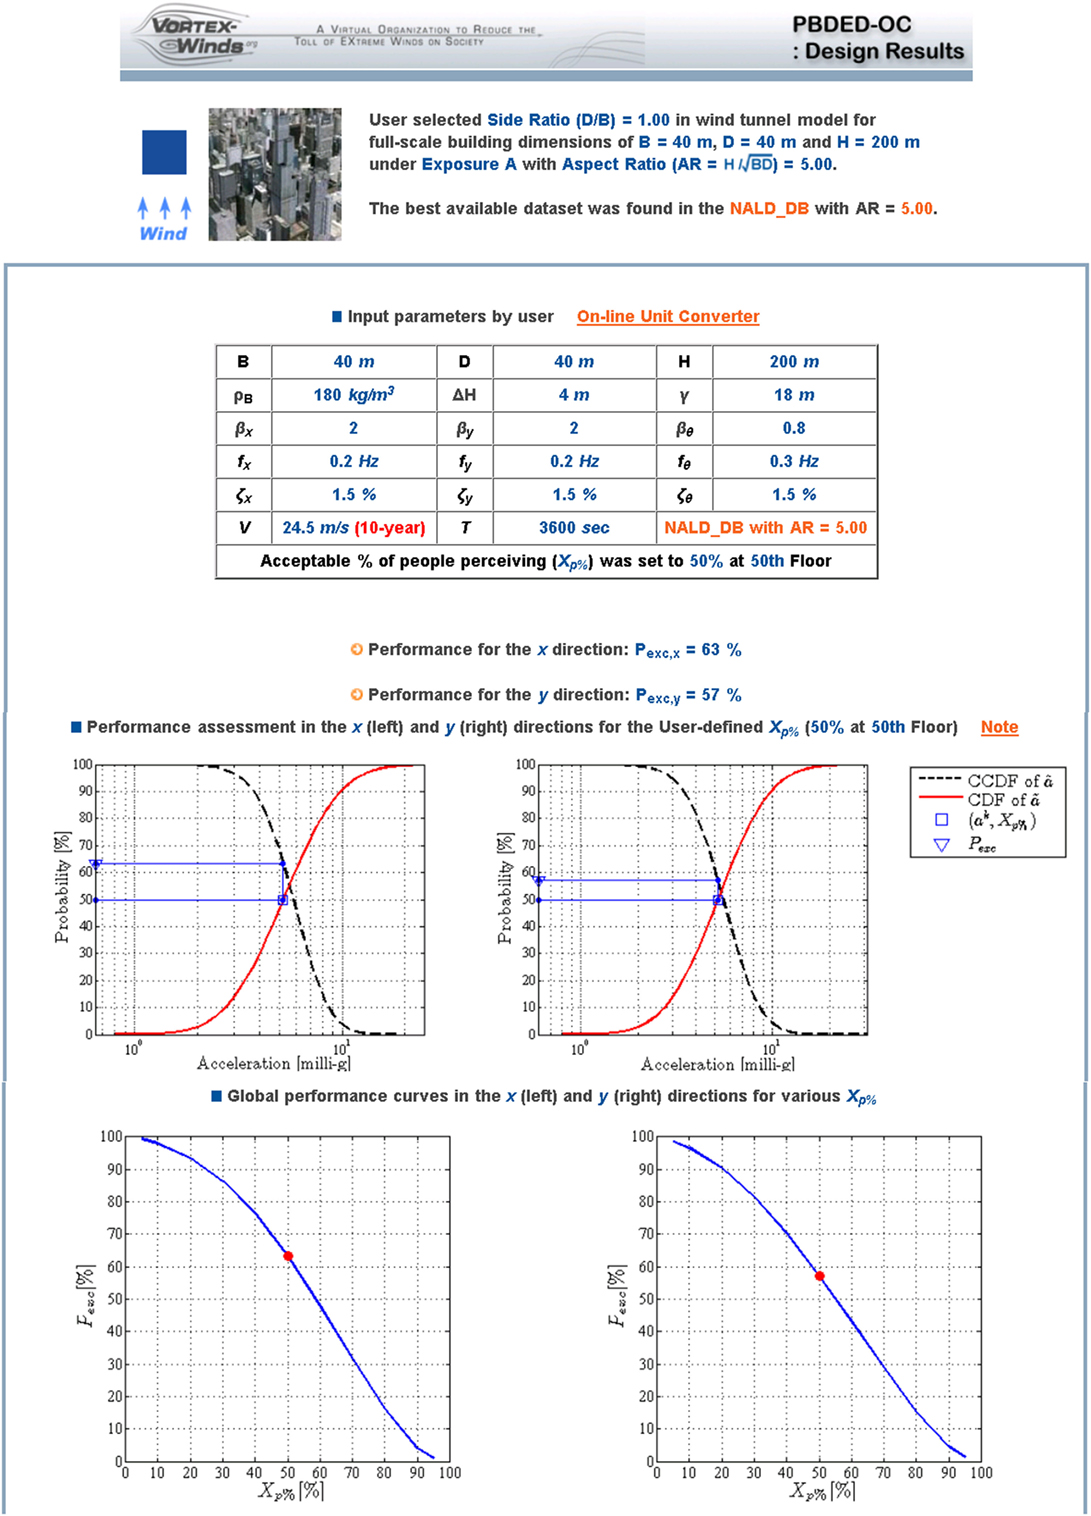
Figure 7. Result interface of performance-based design of high-rise buildings for occupant comfort.
Modeling and Simulation
Modeling of Gust-Front Winds: NatHaz Gust-Front Factor (NGFF)
In comparison with atmospheric boundary layer winds, which are customarily treated as stationary, winds associated with gust-fronts originating from a thunderstorm/downburst exhibit rapid changes during a short time period which may also be accompanied by changes in wind direction. This introduces non-stationarity both in the mean and the SD of wind fluctuations. In order to realistically capture characteristics of gust-front winds and their attendant load effects, a new analysis framework, gust-front factor, was proposed (Kwon and Kareem, 2009). This is akin to the gust loading factor format used in codes and standards worldwide for the treatment of conventional boundary layer winds. The gust-front factor expresses a generalized description of the genesis of the overall wind load effects on structures under both gust-front and boundary layer winds and it reduces to the gust loading factor for the case of conventional boundary layer winds. This approach encapsulates both the kinematic and dynamic features of gust-front induced wind effects on structures which distinguish themselves from those experienced in conventional boundary layer flows, i.e., variation in the kinematics of the velocity profile and its effects on the associated aerodynamics; dynamic effects induced by the sudden rise in wind speed; non-stationarity of turbulence in gust-front winds; and transient aerodynamics (Figure 8A).
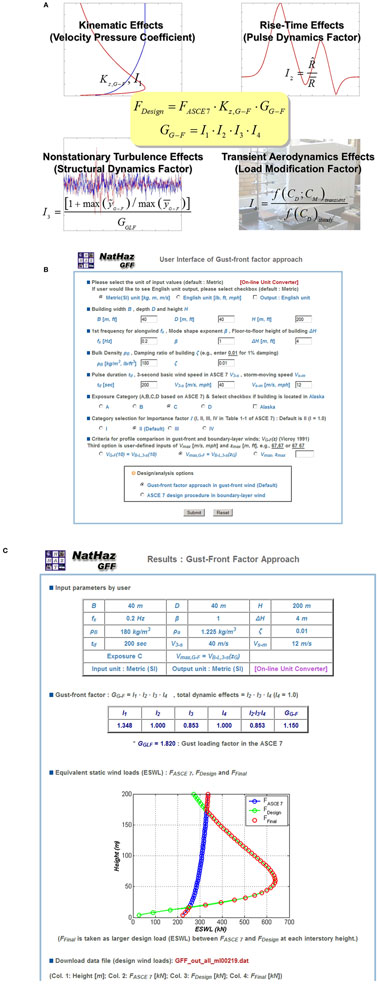
Figure 8. Gust-front factor framework: (A) Schematic diagram. (B) Web-based user interface. (C) Result interface.
To facilitate expeditious utilization of this framework in design practice and inclusion in codes and standards, the analysis framework and its workflow were introduced within a web-based portal. This eliminates the need for an in-depth understanding of the background within the framework and the need for associated computational effort. The portal has a user-friendly interface, permitting convenient analysis of several design scenarios with a host of potential loading conditions including the current ASCE 7 procedure in boundary layer winds for immediate comparison. Note that the user can utilize not only the two predefined profile criteria (see Kwon and Kareem, 2009) but also arbitrary Vmax and zmax values to determine the gust-front factor on-the-fly and corresponding design loads (ESWL). This offers a modeling capability of gust-front wind load effects on buildings. Based on the inputs, the following quantities are then shown in the output interface (Figures 8B,C): user inputs; gust-front factor and its subfactors (I1 to I4); a comparison between ASCE 7-based and gust-front-based ESWLs. More detailed information on the theoretical background can be found in the studies of Kwon and Kareem (2009, 2013b).
Wind Simulation: NatHaz On-Line Wind Simulator (NOWS) and VORTEX-Winds On-Line Wind Simulator (VOWS)
The NOWS introduced in 2005 was designed to provide users with on-line on-the-fly simulation of stationary Gaussian multivariate wind fields for the longitudinal direction. Simple and intuitive user-friendly interfaces (Figures 9A,B) easily allow user to input any terms and check simulation results such as simulated wind histories and comparison of target (analytical model) and simulated PSDs. This web framework features supporting both Metric (SI) and English units as input/output with on-line unit converter, location inputs for vertical, horizontal, or arbitrary 2-D coordinates, ASCE 7-based mean wind calculation in terms of terrain roughness to minimize user’s input, offering users the ability to download simulation results as a file for further off-line analysis such as structural dynamic analysis under wind loads. In particular, one unique feature of this module is a flexibility to choose one of four popular wind simulation schemes such as Discrete frequency function with FFT (Wittig and Sinha, 1975), Schur decomposition approach with autoregressive (Di Paola, 1998; Di Paola and Gullo, 2001), Ergodic spectral representation method (Deodatis, 1996; Ding et al., 2006), and Conventional spectral representation method (e.g., Shinozuka and Deodatis, 1991). A modified Kaimal spectrum was employed for the PSD of longitudinal wind velocity fluctuations (Kaimal et al., 1972), and Davenport coherence function (Davenport, 1967) was utilized to describe spatial correlation in the frequency domain.
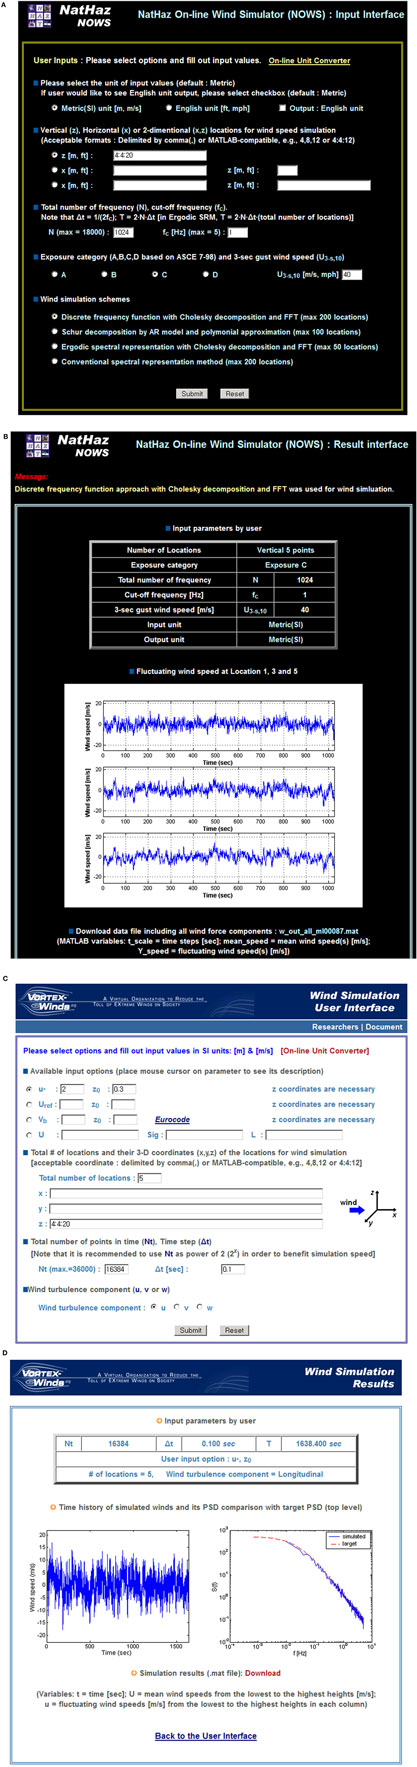
Figure 9. (A) User and (B) result interfaces of NatHaz on-line wind simulator (NOWS); (C) User and (D) result interfaces of VORTEX-Winds on-line wind simulator (VOWS).
Similarly, VOWS also offers wind simulations, but it features a wind simulation of three atmospheric turbulence components such as the longitudinal (u), lateral (v), or vertical (w) component, which the fluctuating component of the wind velocity is modeled as a Gaussian stationary random process with zero-mean. The three components of turbulence are considered as statistically independent and are simulated independently of each other. The wind profile in this module was described by a logarithmic law, and this module employs one of the four different input options: friction velocity and roughness length, reference velocity at 10 m and roughness length, Eurocode (CEN, 2010)-based inputs, and mean wind velocity and SD/integral length scale of wind components. In addition, users can select one of three wind turbulence components (u, v, or w) to be simulated (Solari and Piccardo, 2001; Carassale and Solari, 2006). The PSD function of the turbulence component (u, v, w) proposed by Solari and Piccardo (2001) and coherence function of the turbulence component by Vickery (1970) were employed in this module. The simulation of the turbulence field is carried out by the spectral representation algorithm described in Carassale and Solari (2006). Similar to NOWS, VOWS also offers the ability to download simulation results as a file in the result interface, in addition to a comparison between target and simulated PSD for verification (Figures 9C,D).
Damping Database
Despite the advances that have been made in structural engineering in the last century, one critical parameter, damping continues to remain a source of complexity which is due in part to the diversity of sources contributing to the overall energy dissipation. The viscous damping levels on the order of 1% critical damping for steel structures and 2% for concrete are commonly assumed as some codes recommend these values. However, measurements of light and flexible structures suggest that assumed levels of damping were often not realized in the constructed building (Kijewski-Correa et al., 2006; Spence and Kareem, 2014). For this class of tall buildings, the diminishing level of damping may cause issues related to habitability as damping plays a pivotal role in the building response estimates. This is a concern often experienced by design professionals. Since the inherent damping in these structures cannot be engineered, reliance is placed on augmenting damping through auxiliary damping devices. Introduction of these devices leads to measurable and controllable levels of damping in buildings (Kareem et al., 1999). The Damping database is an initiative to provide users with on-line damping information for various full-scale building structures in terms of a query-based database module. The query parameters include not only building information such as cross-sectional shapes, widths, depths, and heights but also test excitations, damping estimation methods, ranges of damping ratios, etc. (Figure 10). This database is currently established with the Japanese damping data sets [Architectural Institute of Japan (AIJ), 2000; Satake et al., 2003], but it is anticipated that the contents will be expanded with other damping datasets in the future (e.g., Kijewski-Correa et al., 2006, 2013).
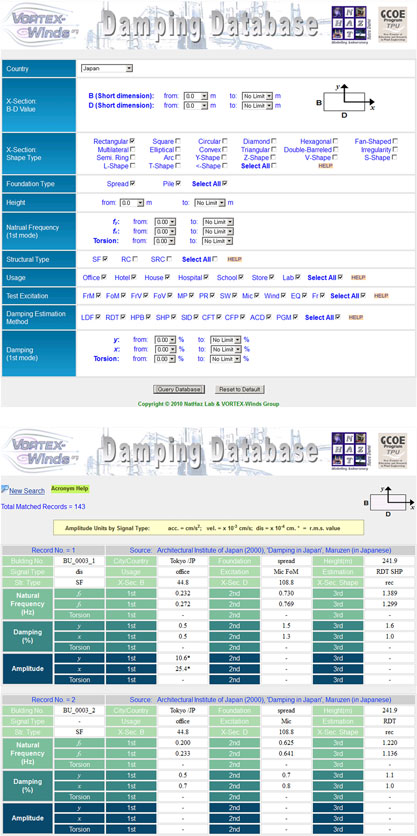
Figure 10. Damping Database: database-query (A) and result (B) interfaces.
Tele-Experimentation: NatHaz Interactive Wind Tunnel (NH-GUST)
Given the interconnectedness of research and the lack of available experimental hardware at every research location, developing a system that can bring the greatest amount of technology to as many people as possible is certainly warranted. To that end, a prototype system for an interactive wind tunnel, NH-GUST, has been developed as a proof-of-the-concept (Butler, 2010). This system, conceptualized in Figure 11, consists of various components arranged within a local network. The end user operates the wind tunnel remotely through a dedicated web interface that connects to the networked components, though test models need to be physically set up by on-site personnel before allowing remote users to perform the experiments. An interactive web user interface was introduced to be controlled using embedded LabVIEW software (National Instruments, 2015) to provide a cross-platform simulation framework. The software is designed to set the limits to protect wind tunnel system from unexpected or undesirable operations. In addition, it is preferable to have an on-site personnel to communicate with remote users and check out overall experiments. Similar to that of the NEES (Van Den Einde et al., 2007), this framework for severe wind experiments may offer a method for improving both the range and quantity of experimental data and for enhancing the wind engineering field as a whole. Instead of only a few schools sharing a limited number of wind tunnel facilities, a customizable (although limited) wind tunnel framework may be developed for anyone to input a wind field scenario to see how it will impact a physical model, either through SPM or through a HFBB technique. Modification of existing wind tunnels and the development of research portals can have the effect of quickly building the body of knowledge for the effect of severe storm events, matching the body of knowledge that has been produced over several decades regarding the effects of boundary layer flows on structures. The current NHERI wind tunnel facilities have similar features, which would permit sharing of advanced wind tunnel facilities with programs that do not have experimental capabilities.
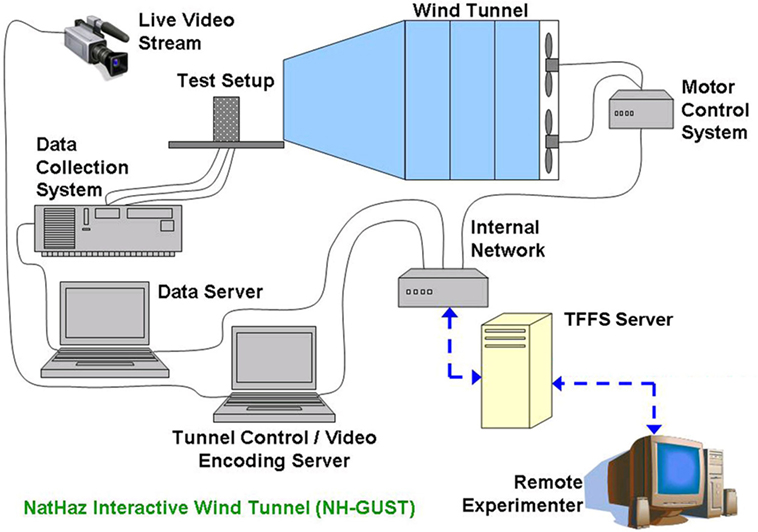
Figure 11. Prototype system for an interactive wind tunnel capable of generating gust-like events for remote experimentation.
Cloud-Computational Fluid Dynamics (CFD): A Virtual Wind Tunnel (VWT)
The complexity of multiscale turbulence–structure interactions has thus far precluded a functional relationship between wind speed and its load effects on structures immersed in atmospheric boundary layer. Recent advances in numerical schemes and escalating growth in computational resources have aided efforts in developing computational simulation of flow around structures using CFD. In order to capture multiple-scale interactions and to resolve small-scale fluctuations, one faces major challenges that include both computation speed as well as memory to manipulate millions of pieces of information at grid points or control volume nodes. These challenges have limited the success of CFD in simulating real world scenarios. Commercial software has provided access to CFD and is increasingly used in the industry which often lacks verification and validation of the codes. Users without the necessary background in fluid mechanics and numerical techniques embark on using these codes resulting in a product that may have inaccuracies and uncertainties. Users of these codes have been alerted in several earlier publications regarding the possible pitfalls (e.g., Castro and Graham, 1999). In this context, CFD is quite different from the use of numerical methods in structural mechanics. Proper training in fluid mechanics, numerical methods, and access to user friendly portals with embedded CFD codes would help to enhance the user community, which will lead to additional advances [National Science Foundation (NSF), 2014; NHERI SimCenter2].
Despite major challenges even for the experts, some groups around the world have made significant progress, especially in Japan where Architectural Institute of Japan [Architectural Institute of Japan (AIJ), 2004] now permits use of CFD in determining wind effects on structure with a caveat that it will be carried out under the direction of an expert and subjected to verification by a committee designated by the Building Law of Japan.
These challenges impose a steep learning curve and have kept this venue of quantifying wind loads on structures closed for the majority of wind engineering researchers and practitioners. To address these challenges, “Virtual Wind Tunnel (VWT)” has been developed to help people not fully versed in the nuances of CFD be able to simulate wind–structure interactions and benefit from the emerging power of simulation driven technologies. This effort combined with useful tutorials was intended to allay the very concerns raised in for example Castro and Graham (1999). Despite initial serious criticism by some with background in computational wind engineering, we are pleased to report that we have measureable success in the initial development and have noticed a step forward in potentially removing the commonly perceived fear out of CFD that has haunted many earlier users (Sempolinski et al., 2015). It has been demonstrated that the concept, though initially opposed by some experts, is feasible as a group of student engineers, low-skill volunteers from Amazon Mechanical Turks, graduate students, and postdoctoral graduates were able to simulate flow around a cross-section of the Empire State Building with very reliable results as the users went through helpful tutorials, explored various grid options, turbulence models, and undertook convergence studies (Staffelbach et al., 2015). VWT is a user-friendly web-enabled CFD collaborative platform that does not require expertise of CFD simulation and extensive computer resources. In place of this, it offers ample tutorial help and FAQs for CFD simulation. It employs Gmsh3 as the unstructured mesh generator and OpenFOAM (2015) as the CFD simulator and allows users to import various designs and run two dimensional wind simulations. The simulations are automatically sent to powerful cloud and/or grid-based computing backend. Figure 12A shows the login screen of the VWT portal.
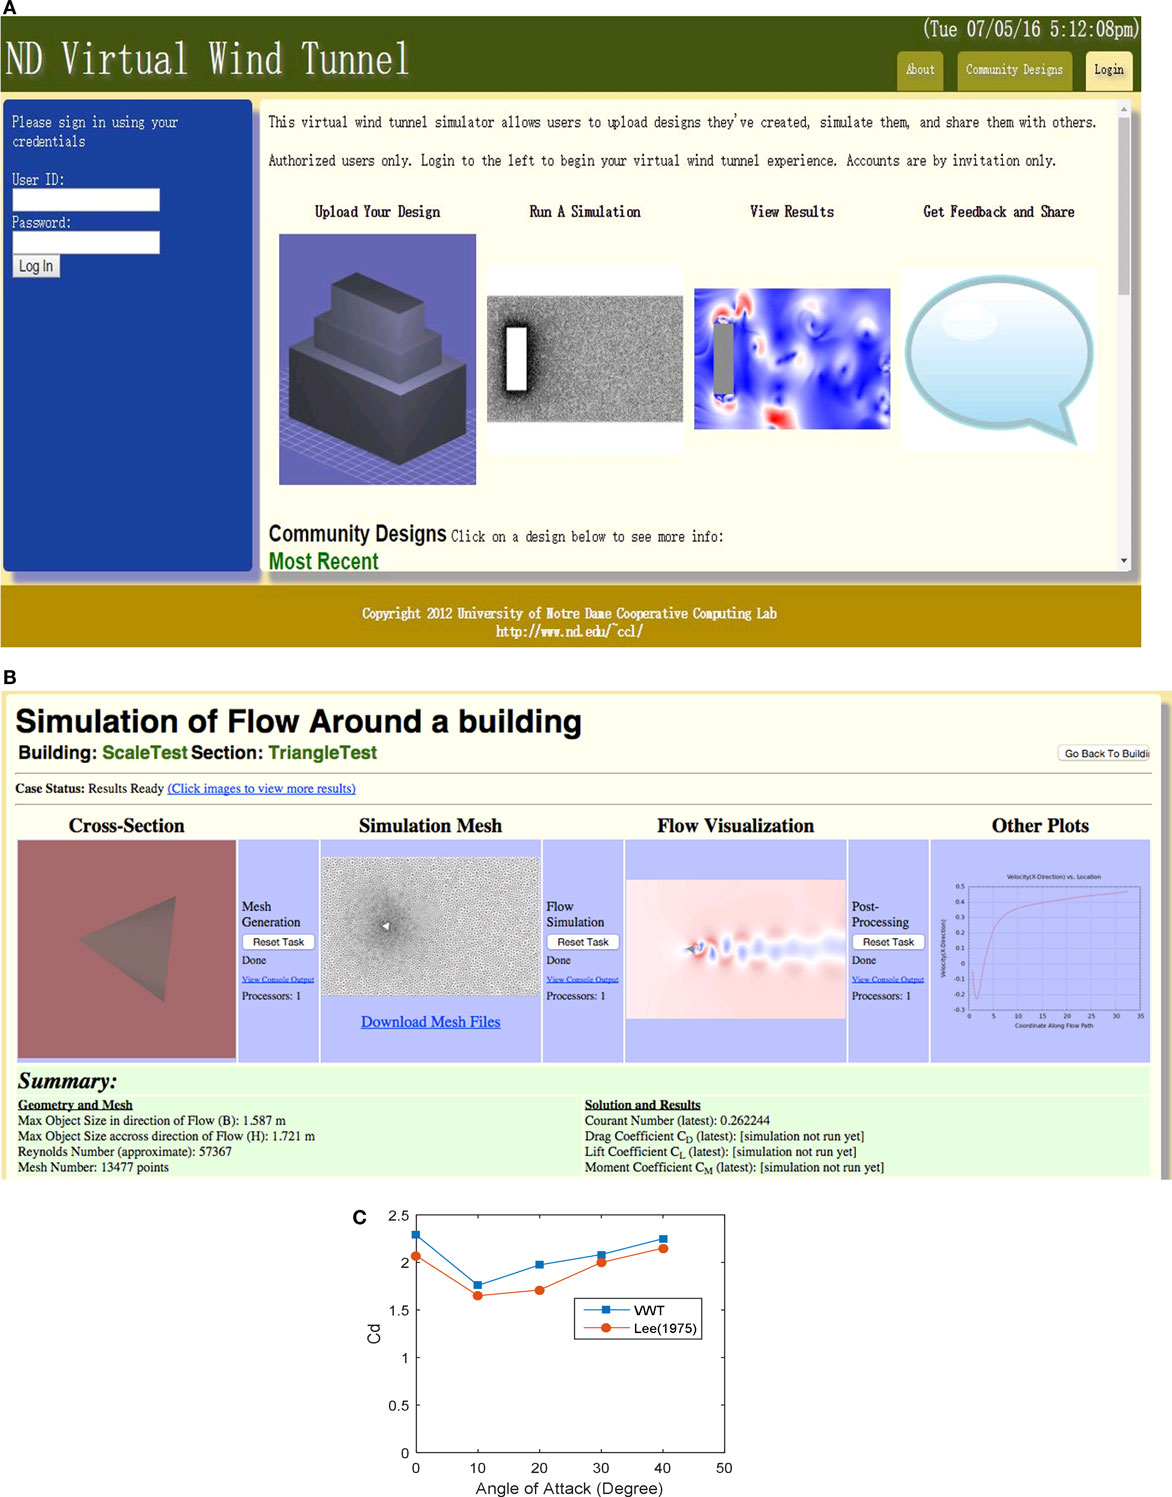
Figure 12. (A) Virtual Wind Tunnel login screen. (B) An example of a completed task. (C) Drag coefficient of a square cylinder at various angles of attack.
To help create a new geometry easier, users can use SketchUp.4 In SketchUp, users can either draw the design by themselves or download from its 3D warehouse where there are millions of models such as autos, aircrafts, buildings, including famous tall buildings like Burj Khalifa, World Trade Center, etc. Users can also create geometry from templates on the platform. With such templates, users can create new designs by specifying geometric dimensions such as height, width, etc., and control points, and the points can be segment end points or spine control points. The feature of Template makes creating the geometry easier when users want to change the location of some control points, and it can be particularly useful for exploring shape optimization.
Once the geometry is created, mesh control should be set. Mesh generation is the most complex part of CFD simulations and it requires necessary experience, thus it becomes a key problem for non-experienced CFD users. VWT makes the mesh generation task easier. It only requires simple mesh control parameters input such as the distances to four sides of the fluid domain, boundary conditions, and grid sizes. Subdomains can be created to refine the mesh in specified regions. By following the solution control setting, inflow velocity, simulation time step and duration, kinematic viscosity, turbulence model, etc. can be managed. Default values are automatically imported in on the setting page, which makes it easier for new comers in CFD use to start a simulation, it is especially helpful for the most difficult but important part of mesh generation. The system gives suggestions to modify the settings when errors occur during the simulation. In terms of turbulence models, there are laminar flow model, S-A one equation model, k-epsilon model, Smagorinsky turbulence model (large eddy simulation, LES), and Dynamic One Equation model (LES) to choose from at this stage.
New cases can be duplicated from existing ones, which makes it convenient to set similar cases, this feature is very useful for parameter comparison which is widely used in CFD. The user receives an email once the simulation is completed, and results of plots and data of pressures, velocities, force coefficients, and mean Reynolds stress are outputted automatically for further viewing and analysis. Users can also download the simulation which are OpenFOAM case files, as well as force coefficient data for further postprocessing. Users are also able to access the VWT portal through a console-based interface, which is useful when using tools like MATLAB (Mathworks, 2015). This makes it more convenient to run a large amount of simulations that share similar parameters, as well as to analyze the output data.
Virtual Wind Tunnel implements some of the ideas of collaborative software design in computational wind engineering, letting users edit structural geometries, compile geometries into usable models for simulation, perform wind simulations, evaluate results, and then share and discuss their work with other users. This feature is an attractive feature that promotes a culture of collaboration toward complex problems and empowers those who are beginning in the field. This has the promise of building a virtual community of users, especially in the era of ubiquitous internet, to reach a new level of potential.
These features make VWT helpful for different users, varying from CFD experts to initially untrained potential users with the aid of sufficiently comprehensive tutorials. Professional CFD users can employ VWT to get a quick and easy prediction and validation. Structural engineers without CFD background can run wind simulations to get a better understanding of aerodynamics of a building or a bridge cross-section by utilizing a tutorial detailing how to reject flawed simulations, along with some suggested parameter settings on VWT. Untrained workers can also run simulations by taking advantage of a bank of preliminary analyses of complex data they can import from the platform. Investigations to examine the feasibility of using crowdsourcing for various complexities of technical tasks using VWT have been carried out, and it shows that crowd workers with no background in engineering could follow tutorials and come up with acceptable solutions (Staffelbach et al., 2015). To complete a task on VWT, a user should create the design, generate the mesh, and run the simulation. The long-running simulations are automatically sent to powerful backend computing platforms. Figure 12B shows a completed task sequence.
An example case to demonstrate verification and validation involving flow around various shaped prism cylinders is presented. Figure 12C shows a comparison of the drag coefficient (Cd) of a 2D square cylinder at various angles of attack (α). For the simulation, LES scheme was employed with the Reynolds number (Re) of 105, while the experiment results were performed with Re = 1.76 × 10⁵. Mesh convergence study was first carried out at α = 0° with the number of cells that was chosen to be 83,582, 144,400, and 189,694, respectively, with corresponding Cd values of 2.26, 2.09, and 2.10, respectively. The difference in the Cd with respect to the number of cells was within acceptable range of ±10% compared to the experimental result, thus the lowest number of cells, 83,582, was chosen for this example because the larger number of cells is used, the more computational resources are demanded.
Table 2 shows the drag coefficient of various shapes performed in this study. Results obtained through the VWT simulations after mesh convergence tests were compared to the available wind tunnel data. A good agreement was observed as shown both in Figure 12C and Table 2. More examples can be found in Staffelbach et al. (2015).
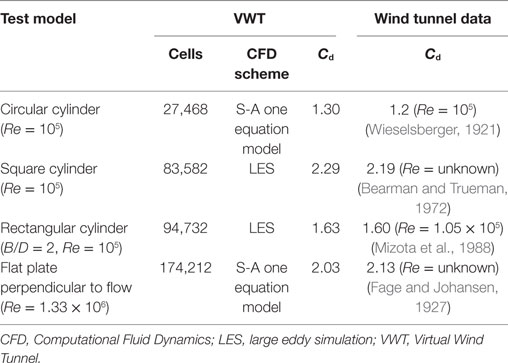
Table 2. Drag coefficient of various shapes.
The VWT has been expanded to include 3-D simulations and being transported through NHERI SimCenter to the NHERI DesignSafe CI for convenient distribution and computational resources needed for advanced simulations. After extensive verification and validation exercises it will be released to the NHERI community of users.
Damage Assessment from Aerial/Satellite Imagery
This module is focused on automating damage assessment schemes based on before-and-after storm satellite/aerial imagery to provide an accurate individual building assessment of damage (Thomas et al., 2011). The framework for damage estimation consists of three steps. First, objects of interests such as buildings are detected automatically from prestorm images. Next, correction of photometric and geometric differences between before and after image-pairs is done (Figure 13A). Third, change detection is performed, and the damage is classified based on quantitative measures of change (Figure 13B).
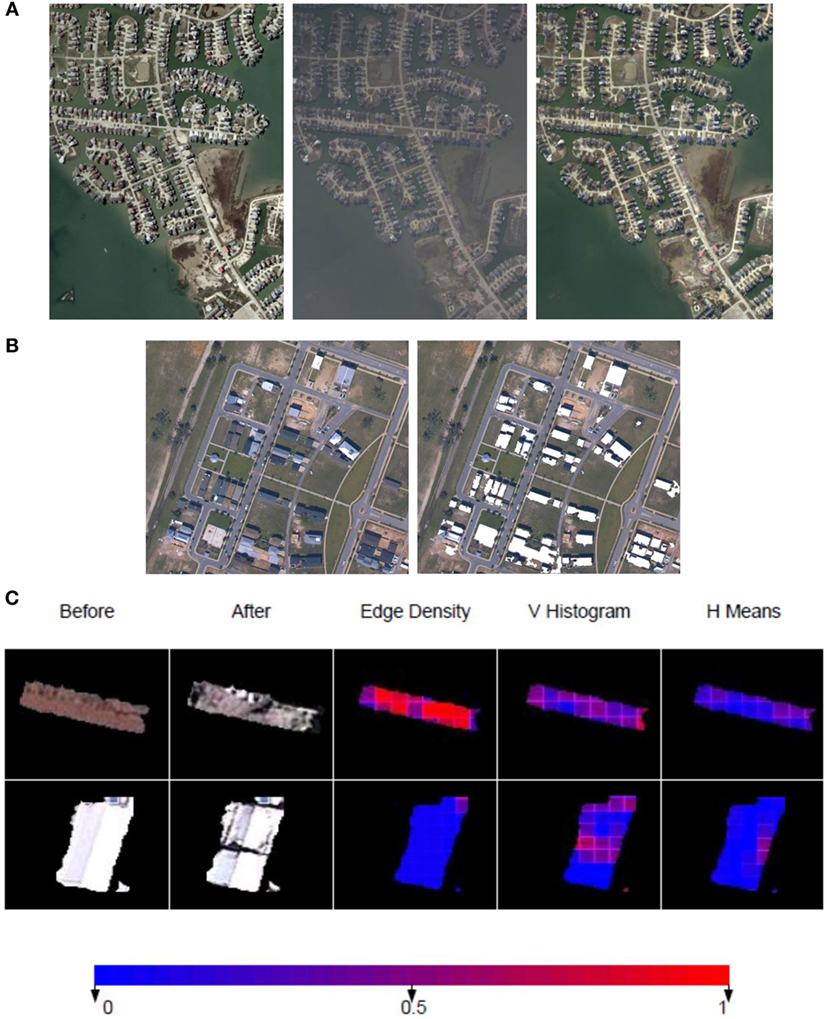
Figure 13. (A) Source images (left), Target images (middle) that have been corrected geometrically. New target image transformed using the proposed local color transfer technique (right). (B) Example of a satellite image (left) and extracted buildings in white (right). (C) Damage assessment: extracted features for a collapsed building (top) and a partially damaged building (bottom).
Note that Speeded Up Robust Feature, which is robust and fast, was employed (Bay et al., 2006) to extract features from the two images of before and after events. An approximate k-Nearest Neighbor algorithm (Muja and Lowe, 2009) is used for feature matching. A speed-up of 10× was achieved without compromising robustness through randomized Kd-trees and a constrained RANSAC algorithm (Thomas et al., 2012b).
Automatic color balancing approaches for different applications have been studied by different research communities in the past decade. For multitemporal images to identify damage, an ideal color correction approach should be effective at transferring the color palette of the source image to the target image for the unchanged areas while being able to transfer the global color characteristics for the changed area without creating visual artifacts. Toward this goal, a new local color balancing approach that uses adaptive windowing was proposed, which was evaluated against other state-of-the-art approaches using a database consisting of aerial image pairs (Thomas et al., 2012a). The test image pairs were taken at different times, under different lighting conditions, and with different scene geometries and camera positions (Figure 13A).
A segmentation-based scheme that uses a maximum likelihood classifier along with k-means clustering was adopted for building detection. Measure of Estimated and Predicted Shadows features along with shape-based features to combine segments together were utilized. In addition, a fusion of color- and edge-based features to classify rooftops into damage states was proposed. The evaluation was performed on a database of posthurricane rooftop images that is larger than the ones used in previous studies. The classifier was found to perform with 80% accuracy for a 3-scale damage metric and 72% accuracy for a finer grained 4-scale damage metric (Thomas et al., 2011). To further validate results of building segmentation and damage classification, preparation of ground truth data sets is in progress.
The first row in Figure 13C shows a collapsed building and the corresponding false color images for edge density, V histogram (edge-based features) and H means (color-based feature). Note that the edge density values are significantly higher in this case. The second row corresponds to a partially damaged building with a cavity in the rooftop. V histogram indicates a significant change in the cavity area and H means shows a minor damage on the roof (Thomas et al., 2011). This automated damage assessment scheme based on satellite imagery is being transported to a web-based portal for inclusion in VORTEX-Winds.
Monitoring System: Data Management Based on Cyber-Based Framework
Possibly the greatest challenge in long-term monitoring projects is the transfer, processing, dissemination, and management of collected data, in particular for geographically dispersed collaborators. The fusion of engineering and information technologies provides today’s engineer with the potential for analysis and research programs that defy geographic boundaries and create new venues for remote sensing and data analysis and archiving. The following two monitoring programs demonstrate the use of cyber-based technologies to enhance the accessibility, organization, interpretation, and dissemination of long-term data sets. The first example is an ongoing full-scale monitoring program involving several tall buildings in the city of Chicago, which was established in 2001 (Kijewski-Correa et al., 2006). As the management of years of full-scale data from this project poses a daunting task, information/Internet technologies provide an attractive solution, through local communication hubs and secured web interfaces to catalog, convert, download, and display the measured time histories. In the Chicago program, the dataloggers that store data at its backup storage module are remotely interrogated by Internet. This information is then uploaded to an Apache web server, called Windycity,5 for access by the geographically dispersed project team. A variety of IT tools such as HTML/Java Script, PHP (2015), etc. were utilized to create interactive displays allowing users to select any record available for a given building. An alternative mode of data access was provided via structured query language, enabling a database query using a database management system, e.g., MySQL (2015), to identify records with a desired level of wind velocity or response resulting in an automatically updated listing of the available files satisfying these criteria (Figure 14A). Upon selecting a record, a data set is postprocessed on-the-fly via preprogrammed MATLAB codes on the server side with JAVA (2015) technology providing the interfacing capabilities. Through this process, any spikes and drifts are removed to preserve data quality, voltages are converted to engineering units and responses at the corners of the building are decoupled to extract the sway and torsional accelerations in a computationally efficient manner (Figure 14B). Detailed information is given in the studies of Kijewski et al. (2003) and Kijewski-Correa et al. (2006).
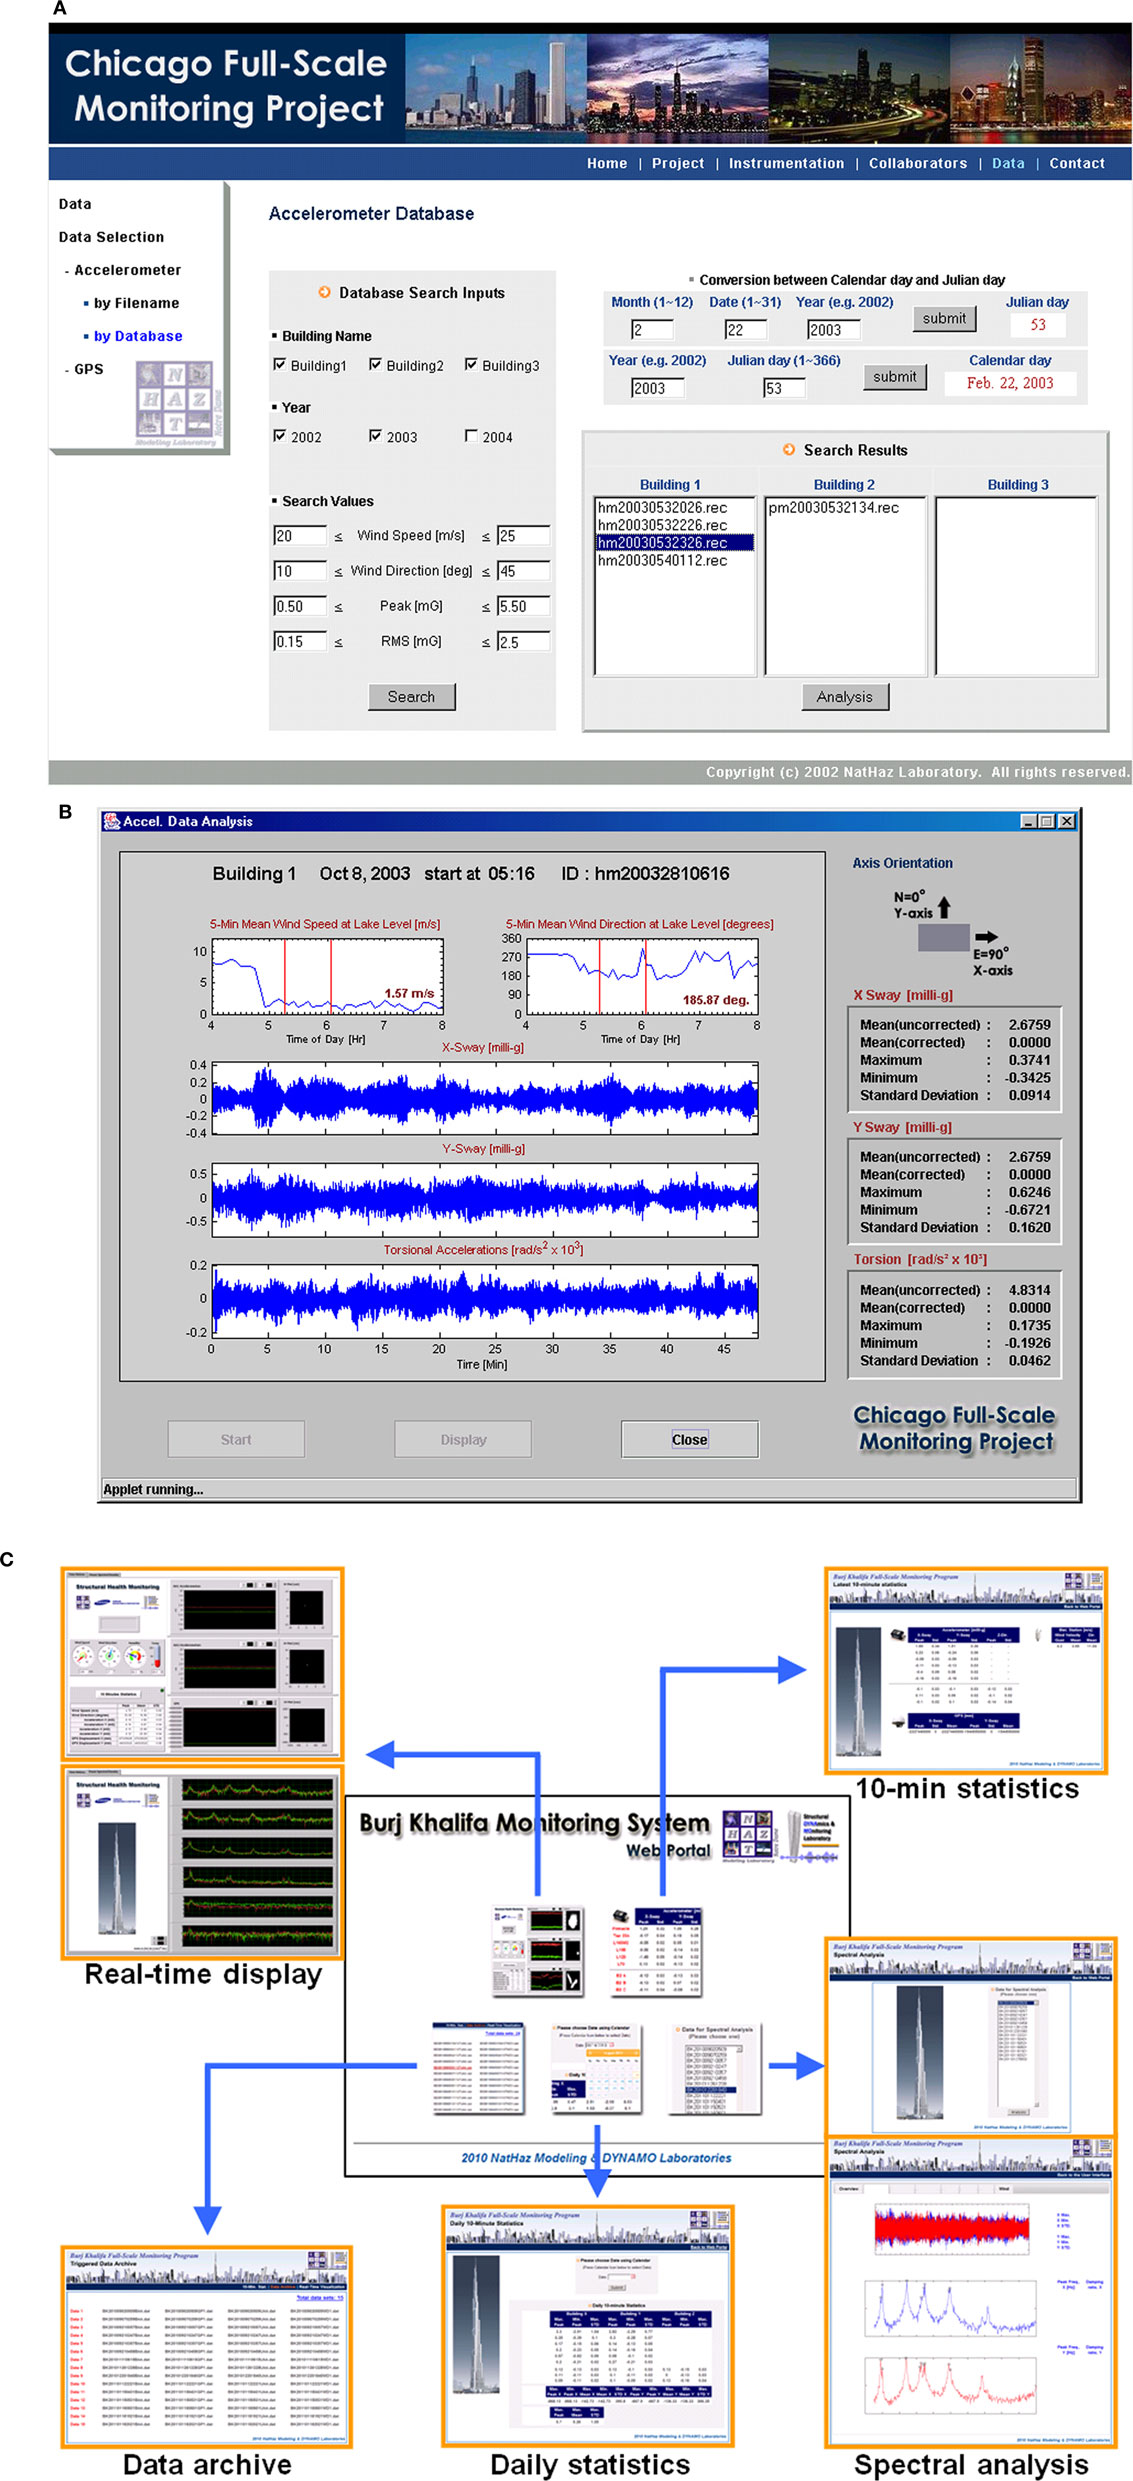
Figure 14. (A) Database query interface in the Chicago project. (B) Analyzed data display interface in the Chicago project. (C) Cyber-based e-modules in the SmartSync framework.
SmartSync System: Internet of Things (IoT)
Conventional monitoring program such as the Chicago Monitoring Program is often limited to being a manual or semi-automated system requiring several manual interventions by project teams due to the incapability of hardware/software configuration to autonomously comply with the central command. To overcome this limitation, a unique prototype system for full-scale measurement and long-term structural health monitoring (SHM), SmartSync, which utilizes the building’s existing Internet backbone as a system of “virtual” instrumentation cables to permit modular and largely “plug-and-play” deployments including advanced and automated software packages to establish a fully automated system has been introduced. Within this framework, data streams from distributed sensors are pushed through network interfaces in real-time and seamlessly synchronized and aggregated by a centralized server, which performs basic data acquisition, event triggering and database management, while also providing an interface for data visualization and analysis that can be securely accessed. The system enables a scalable approach to monitoring tall and complex structures that can readily interface variety of heterogeneous sensors and data formats (analog and digital) and can even accommodate variable sampling rates. With the help of rapid development in hardware systems that nowadays offers Ethernet-enabled hardware, e.g., dataloggers, all process can be automated without the need of human intervention. To insure reliability of the system, TCP/IP (Transmission Control Protocol/Internet Protocol) was invoked as a stable stream delivery service that guarantees transmission of data sent from one host to another without duplication or loss, ideally suited for data from variable sensors coordinated over local area network (LAN). Though, the realization of a network-based architecture significantly depends on the software development operating on the system’s centralized server housed within the building being monitored. To facilitate this, all data acquisition operations in SmartSync, including synchronization, are programmed in LabVIEW at the central server, while higher level processing and analyses are facilitated by cyber-based on-line modules on an additional analysis server with results pushed to web user interfaces that are streamlined in terms of cyber-based schemes described earlier. Note that the SmartSync framework has deployed to the world’s tallest building, Burj Khalifa, for a proof-of-concept in triggering under dual excitations (wind and earthquake) and has successfully been performing since 2008. For reference, cyber-based modules developed in this project are shown in Figure 14C including real-time display in both time and frequency domains, the latest 10-min statistics, archived daily statistics, triggered data depository, on-demand spectral analysis (Kwon et al., 2010, 2011; Kijewski-Correa et al., 2013). Note that these modules are not currently associated with VORTEX-Winds and operated independently due to agreements of confidentiality with building owners for monitoring datasets.
Near Real-time Monitoring
The concept of cyber-based SHM has also applied to a newly developed near real-time (NRT) hybrid framework (Guo et al., 2016). Particularly, a hybrid framework was introduced to enhance the damping estimation in terms of the combination of two system identification (SI) schemes such as WT-TSVD-Laplace wavelet filtering for non-stationary data, e.g., earthquake response and SSI-COV for stationary data such as wind response (e.g., Van Overschee and De Moor, 1996; Peeters and De Roeck, 1999). It is worth noting that an innovative web-based framework was designed and applied to the SHM of Burj Khalifa. This streamlines the overall procedure as an “Internet of Things” (IoT) concept in SHM. Figure 15A depicts a web-enabled NRT hybrid SI framework being employed in Burj Khalifa. Details can be found in Guo et al. (2016).
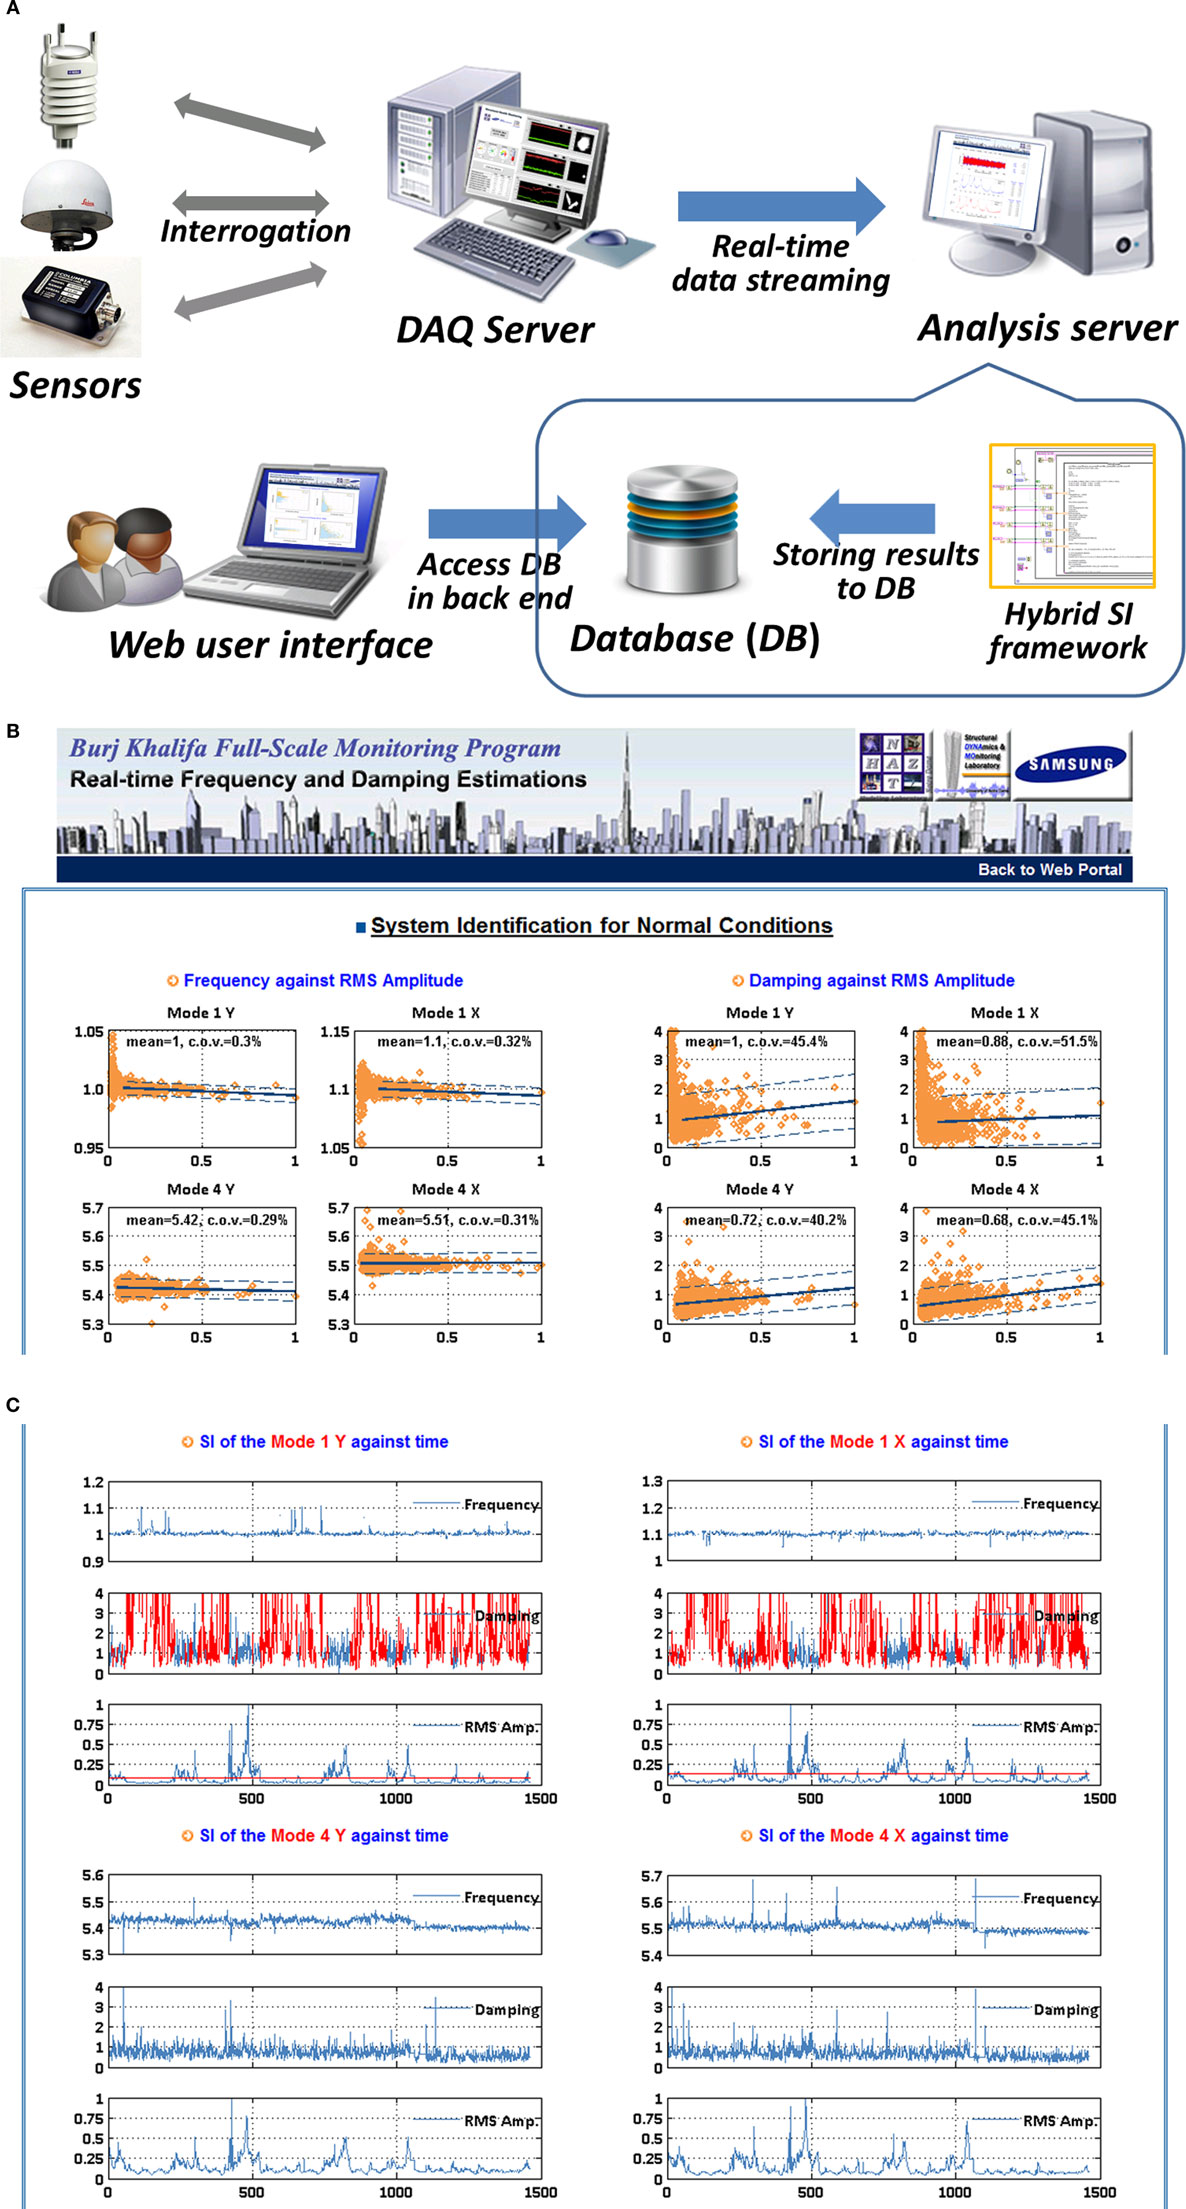
Figure 15. (A) Web-based automated NRT hybrid SI framework in Burj Khalifa. (B,C) Result web interface for normal conditions.
Through the back-end process, the hybrid SI framework embedded in the analysis server is continuously performed whenever a data segment is ready. After the analysis, the estimated results are automatically stored in the database management system, MySQL in this study, to gain more flexibility for additional data analysis with accumulated valuable SI datasets in the future. For a convenient data visualization, several web interfaces in the front-end process are established, where the interfaces implicitly interrogate with the database and then display the results on the interface on-demand, on-the-fly. In the case of transient events such as earthquake events, users can see a table containing event time, frequency and damping information for each mode. A table format is a better choice than a plot in this case due to the fact that such events are relatively rare, thus a collection of all extreme events would provide useful information for a user to grasp all past events. For the cases of normal conditions such as under extra-tropical winds and/or ambient excitations, two kinds of plots are illustrated in the result interface (Figures 15B,C). One is a plot to show the trend of accumulated frequency and damping information against RMS amplitude in each mode, which is valuable to examine the trend of amplitude dependence (Figure 15B). Updated statistics of estimates, i.e., mean and CoV, are also included inside each plot. The other is a display of time history of frequency, damping and RMS amplitude, which is very useful to check the variation of dynamic properties of the structure such as natural frequencies and damping over time (Figure 15C). In this manner, users can see both the latest and accumulated SI results whenever accessing to the web interface. It is anticipated that the proposed framework in the context of the IoT has the potential of being well-suited for the SHM system to meet the demand of quick near real-time structural performance assessment involving minimal human intervention and ultimately offering a decision-support system for the building operation regarding structural operation as currently employed by the owners. More detailed information can be found in the study of Guo et al. (2016).
Concluding Remarks
The enormous reported losses from wind-related events and the increased sensitivity of civil infrastructures such as freeform super tall buildings, long-span bridges, and deep water offshore platforms etc. to wind call for a new paradigm for their analysis, modeling, and performance assessment. A cyber-enabled framework based on a VO, VORTEX-Winds,6 presented in this paper offers these such analysis/design tools. VORTEX-Winds is viewed by some as a microcosm of the CI and SimCenter of the new NSF NHERI initiative. Through the development of e-modules stitched and networked with a flexible architecture and interfaces to support research and education objectives in real-time, these cyber-enabled analysis, modeling, and simulation tools in the VORTEX-Winds promise to enhance the capability of individuals beyond their current resources through a synergistic, integrative approach to understanding and modeling the complexity of wind–structure interactions. This framework can help the wind community minimize windstorm damage and meet the challenges posed by burgeoning emergence of wind-sensitive structures. Consequently, the result will be a community as a whole better positioned to address the next frontiers in the field. Currently, most of the modules are available to the general public via registration at https://vortex-winds.org and one of DED modules (VORTEX-Winds: DEDM-HR) has been ported to the NHERI DesignSafe Discovery portal at https://www.designsafe-ci.org. Some of the modules are still being beta tested and others are restricted and require additional registration and login for additional firewall equipment of cloud platform and external servers.
It is envisaged that this cyber-enabled framework would facilitate an effective, transformative, and conveniently accessible framework for the acceleration of advances in research and design practice, as well as teaching and learning, in the broad wind effects area and would have a revolutionary impact on this field due to its unprecedented potential of dissemination of knowledge and tools through easily accessible NHERI or NatHaz CI. In addition, the architecture and implementation of e-modules demonstrated in this study will serve as a reference or direction for prompting additional cyber-enabled developments by the community.
Author Contributions
AK has overseen the management of the project to build the cyber-enabled framework, VORTEX-Winds, taken lead in assessment of overall development and prepared and revised this paper with DK. DK has coordinated overall project among collaborators, developed, and validated a variety of e-modules with collaborators, and written this paper with AK.
Conflict of Interest Statement
The authors declare that the research was conducted in the absence of any commercial or financial relationships that could be construed as a potential conflict of interest.
Acknowledgments
The authors are greatly appreciated for the financial support by the National Science Foundation via grant CBET-0742191 and the matching support provided by the University of Notre Dame in the initial phase of the project. Support by the Global Center of Excellence (GCOE): New Frontiers of Education and Research in Wind Engineering at TPU, Ministry of Education, Culture, Sports, Science and Technology (MEXT), Japan, under the direction of Prof. Y. Tamura has been critical in sustaining the long-term goals of this cyber-based vision and it is gratefully acknowledged. The support for this paper was also in part provide by the National Science Foundation Grants # CMMI-1301008; CMMI-1520817; CMMI-1612843. The authors are grateful to their colleagues who kindly agreed to serve as members of the collaboratory and have contributed many fundamental developments at various stages of the project. The authors are indebted to Drs. Y. Tamura (Tokyo Polytechnic University, Japan), T. Kijewski-Correa, G. Madey, N. Regola, R. Lichtenwalter, J. Thomas, P. Sempolinski, D. Thain (University of Notre Dame, USA), C.-M. Cheng, and J. Wang (Tamkang University, Taiwan) for their many invaluable contributions, without their support this dream would not have been materialized. The authors also acknowledge students from the University of Notre Dame and Beijing Jiaotong University for their participation in the crowdsourcing experiment.
Footnotes
References
American Society of Civil Engineers (ASCE). (2005). Minimum Design Loads for Buildings and Other Structures. ASCE 7-05. Reston, VA: ASCE.
American Society of Civil Engineers (ASCE). (2010). Minimum Design Loads for Buildings and Other Structures. ASCE 7-10. Reston, VA: ASCE.
Architectural Institute of Japan (AIJ). (2004). RLB Recommendations for Loads on Buildings. Tokyo, Japan: Structural Standards Committee, Architectural Institute of Japan.
Bay, H., Tuytelaars, T., and Gool, L. V. (2006). “Surf: speeded up robust features,” in European Conference on Computer Vision, Graz, Austria. p. 404–417.
Bearman, P. W., and Trueman, D. M. (1972). An investigation of the flow around rectangular cylinders. Aeronaut. Qtrly. 23, 229–237.
Bernardini, E., Spence, S. M. J., Kwon, D. K., and Kareem, A. (2015). Performance-based design of high-rise buildings for occupant comfort. J. Struct. Eng. 141, 04014244. doi: 10.1061/(ASCE)ST.1943-541X.0001223
Butler, K. (2010). The Impact of Extreme Wind Events on Structures. Ph.D. Dissertation. Notre Dame, IN, USA: University of Notre Dame.
Carassale, L., and Solari, G. (2006). Monte Carlo simulation of wind velocity fields on complex structures. J. Wind Eng. Ind. Aerodyn. 94, 323–339. doi:10.1016/j.jweia.2006.01.004
Castro, I. P., and Graham, J. M. R. (1999). Numerical wind engineering: the way ahead. Proc. Inst. Civ. Eng. Struct. Build. 134, 275–277. doi:10.1680/istbu.1999.31569
CEN. (2010). Eurocode 1: Actions on Structures – Part 1–4: General Actions – Wind Actions. EN 1991-1-4:2005/AC:2010 (E). Europe: European Standard (Eurocode), European Committee for Standardization (CEN).
Chen, X., and Kareem, A. (2005). Dynamic wind effects on buildings with 3-D coupled modes: application of HFFB measurements. J. Eng. Mech. 131, 1115–1125. doi:10.1061/(ASCE)0733-9399(2005)131:11(1115)
Cheng, C.-M., and Wang, J. (2004). “Wind tunnel database for an intermediate wind resistance design of tall buildings,” in Proc. 1st Int. Sym. on Wind Effects on Buildings and Urban Env., Tokyo Polytechnic University (Tokyo, Japan).
Cluni, F., Gusella, V., Spence, S. M. J., and Bartoli, G. (2011). Wind action on regular and irregular tall buildings: higher order moment statistical analysis by HFFB and SMPSS measurements. J. Wind Eng. Ind. Aerodyn. 99, 682–690. doi:10.1016/j.jweia.2011.01.020
Deodatis, G. (1996). Simulation of ergodic multivariate stochastic processes. J. Eng. Mech. 122, 778–787. doi:10.1061/(ASCE)0733-9399(1996)122:8(778)
Di Paola, M. (1998). Digital simulation of wind field velocity. J. Wind Eng. Ind. Aerodyn. 74-76, 91–109. doi:10.1016/S0167-6105(98)00008-7
Di Paola, M., and Gullo, I. (2001). Digital generation of multivariate wind field processes. Probab. Eng. Mech. 16, 1–10. doi:10.1016/S0266-8920(99)00032-6
Ding, Q., Zhu, L., and Xiang, H. (2006). Simulation of stationary Gaussian stochastic wind velocity field. Wind Struct. 9, 231–243. doi:10.12989/was.2006.9.3.231
Fage, A., and Johansen, F. C. (1927). On the flow of air behind an inclined flat plate of infinite span. Proc. R. Soc. A 116, 170–197. doi:10.1098/rspa.1927.0130
Frame, I., Austen, K. F., Calleja, M., Dove, M. T., White, T. O. H., and Wilson, D. J. (2009). New tools to support collaboration and virtual organizations. Phil. Trans. R. Soc. A 367, 1051–1056. doi:10.1098/rsta.2008.0193
Goasguen, S., Madhavan, K., Wolinsky, D., Figueiredo, R., Frey, J., Roy, A., et al. (2008). Middleware integration and deployment strategies for cyberinfrastructures. Adv. Grid Pervasive Comput. 5036, 187–198. doi:10.1007/978-3-540-68083-3_20
Google. (2015). Google Maps API. Google Inc. Available at: https://developers.google.com/maps/
Guo, Y., Kwon, D. K., and Kareem, A. (2016). Near-real-time hybrid system identification framework for civil structures with application to Burj Khalifa. J. Struct. Eng. 142, 04015132. doi:10.1061/(ASCE)ST.1943-541X.0001402
Gurney, R. J., Badcock, N. S., Garnett, E. A., and Godfray, H. C. J. (2009). The environmental eScience revolution. Phil. Trans. R. Soc. A 367, 803–813. doi:10.1098/rsta.2008.0253
JAVA. (2015). JAVA Software. Oracle Corporation. Available at: http://www.java.com/
Kaimal, J. C., Wyngaard, J. C., Izumi, Y., and Cote, O. R. (1972). Spectral characteristics of surface-layer turbulence. J. R. Meteorol. Soc. 98, 563–589. doi:10.1002/qj.49709841707
Kareem, A. (1985). Structural performance and wind speed-damage correlation in hurricane Alicia. J. Struct. Eng. 111, 2596–2610. doi:10.1061/(ASCE)0733-9445(1985)111:12(2596)
Kareem, A. (1986). Performance of cladding in hurricane Alicia. J. Struct. Eng. 112, 2679–2693. doi:10.1061/(ASCE)0733-9445(1986)112:12(2679)
Kareem, A. (2005). “Bluff body aerodynamics and aeroelasticity: a wind effects perspective,” in Proc. the Fourth European and Africa Conference on Wind Engineering (Prague, Czech Republic).
Kareem, A. (2008). Numerical simulation of wind effects: a probabilistic perspective. J. Wind Eng. Ind. Aerodyn. 96, 1472–1497. doi:10.1016/j.jweia.2008.02.048
Kareem, A., and Allen, R. (1990). Development of knowledge-based systems in wind engineering. J. Wind Eng. Ind. Aerodyn. 36, 1245–1257. doi:10.1016/0167-6105(90)90121-R
Kareem, A., Kijewski, T., and Tamura, Y. (1999). Mitigation of motions of tall buildings with specific examples of recent applications. Wind Struct. 2, 132–184. doi:10.12989/was.1999.2.3.201
Kareem, A., Kijewski-Correa, T., Tamura, Y., and Madey, G. (2009). “Next frontiers of innovation, discovery and learning in wind engineering: a cyberinfrastructure perspective,” in Proceedings of 4th International Symposium on Wind Effects on Buildings and Urban Environment (Tokyo, Japan).
Kareem, A., and Zhou, Y. (2003). Gust loading factor – past, present and future. J. Wind. Eng. Ind. Aerodyn. 91, 1301–1328. doi:10.1016/j.jweia.2003.09.003
Kijewski, T., Kwon, D. K., and Kareem, A. (2003). “E-technologies for wind effects on structures,” in Proc, 11th Int. Conf. on Wind Engineering (CD-ROM) (Lubbock, TX: Texas Tech Univ.).
Kijewski-Correa, T., Kilpatrick, J., Kareem, A., Kwon, D. K., Bashor, R., Kochly, M., et al. (2006). Validating the wind-induced response of tall buildings: a synopsis of the Chicago full-scale monitoring program. J. Struct. Eng. 132, 1509–1523. doi:10.1061/(ASCE)0733-9445(2006)132:10(1509)
Kijewski-Correa, T., Kwon, D. K., Kareem, A., Bentz, A., Guo, Y., Bobby, S., et al. (2013). SmartSync: an integrated real-time structural health monitoring and structural identification system for tall buildings. J. Struct. Eng. 139, 1675–1687. doi:10.1061/(ASCE)ST.1943-541X.0000560
Kijewski-Correa, T., Smith, N., Taflanidis, K. A., Liu, C., Krusche, M., and Vardeman, C. II (2014). CYBER-EYE: development of integrated cyber-infrastructure to support rapid hurricane risk-assessment. J. Wind Eng. Ind. Aerodyn. 133, 211–224. doi:10.1016/j.jweia.2014.06.003
Kwon, D., Kijewski-Correa, T., and Kareem, A. (2005). “e-Analysis of tall buildings subjected to wind loads,” in Proc. 10th Americas Conference on Wind Engineering (Baton Rouge, LA: AAWE).
Kwon, D. K., and Kareem, A. (2009). Gust-front factor: new framework for wind load effects on structures. J. Struct. Eng. 135, 717–732. doi:10.1061/(ASCE)0733-9445(2009)135:6(717)
Kwon, D. K., and Kareem, A. (2013a). A multiple database-enabled design module with embedded features of international codes and standards. Int. J. High Rise Build. 2, 257–269.
Kwon, D. K., and Kareem, A. (2013b). Generalized gust-front factor: a computational framework for wind load effects. Eng. Struct. 48, 635–644. doi:10.1016/j.engstruct.2012.12.024
Kwon, D. K., Kareem, A., Kumar, D., and Tamura, Y. (2016). A prototype on-line database-enabled design framework for wind analysis/design of low-rise buildings. Front. Struct. Civil Eng. 10, 121–130. doi:10.1007/s11709-015-0329-3
Kwon, D. K., Kijewski-Correa, T., and Kareem, A. (2008). e-Analysis of high-rise buildings subjected to wind loads. J. Struct. Eng. 134, 1139–1153. doi:10.1061/(ASCE)0733-9445(2008)134:7(1139)
Kwon, D. K., Kijewski-Correa, T., and Kareem, A. (2010). “SmartSync: an integrated real-time monitoring and SI system for tall buildings,” in 2010 ASCE Structures Congress (Orlando, Florida: ASCE).
Kwon, D. K., Kijewski-Correa, T., and Kareem, A. (2011). “Event-driven SmartSync system for structural health monitoring of tall buildings,” in Proceedings of 13th International Conference on Wind Engineering (ICWE 13) (Amsterdam, Netherlands).
Kwon, D. K., Spence, S. M. J., and Kareem, A. (2014). A cyberbased data-enabled design framework for high-rise buildings driven by synchronously measured surface pressures. Adv. Eng. Softw. 77, 13–27. doi:10.1016/j.advengsoft.2014.07.001
Main, J. A., and Fritz, W. P. (2006). Database-Assisted Design for Wind: Concepts, Software, and Examples for Rigid and Flexible Buildings. Gaithersburg, MD, USA: NIST Building Science Series 180, NIST.
Mathworks. (2015). MATLAB. The Mathworks, Inc. Available at: http://www.mathworks.com/
Mizota, T., Yamada, H., Kubo, Y., Okajima, A., Knisely, C. W., and Shirato, H. (1988). Aerodynamic characteristics of fundamental structures. Part 1, Section 2. (in Japanese). J. Wind Eng. 1988, 50–52. doi:10.5359/jawe.1988.36_50
Muja, M., and Lowe, D. G. (2009). “Fast approximate nearest neighbors with automatic algorithm configuration,” in International Conference on Computer Vision Theory and Applications (VISAPP 2009), Lisboa, Portugal, 331–340.
Munich Re Group. (2012). Severe Weather in North America. Munich, Germany: Munich Re Group. Press Release.
MySQL. (2015). MySQL: The World’s Most Popular Open Source Database. Oracle Corporation. Available at: http://www.mysql.com/
National Instruments. (2015). LabVIEW – System Design Software. National Instruments Corporation. Available at: http://www.ni.com/
National Science Foundation (NSF). (2014). Natural Hazards Engineering Research Infrastructure (NHERI). Division of Civil, Mechanical and Manufacturing Innovation, NSF. Available at: http://www.nsf.gov/funding/pgm_summ.jsp?pims_id=503259
OpenFOAM. (2015). Open Source CFD Software Package. OpenCFD Ltd (ESI Group). Available at: http://www.openfoam.com/
Peeters, B., and De Roeck, G. (1999). Reference-based stochastic subspace identification for output-only modal analysis. Mech. Syst. Signal Process. 13, 855–878. doi:10.1006/mssp.1999.1249
PHP. (2015). PHP: Hypertext Preprocessor. The PHP Group. Available at: http://www.php.net/
Rodgers, G. (2011). “NEES cyberinfrastructure and cloud simulation features of the NEEShub,” in Advances in Real-Time Hybrid Simulation Workshop (Bethlehem, PA: NEES@Lehigh).
Satake, N., Suda, K., Arakawa, T., Sasaki, A., and Tamura, Y. (2003). Damping evaluation using full-scale data of buildings in Japan. J. Struct. Eng. 129, 470–477. doi:10.1061/(ASCE)0733-9445(2003)129:4(470)
Sempolinski, P., Wei, D., Kareem, A., and Thain, D. (2015). Adapting collaborative software development techniques to structural engineering. IEEE Comput. Sci. Eng. 17, 27–34. doi:10.1109/MCSE.2015.88
Shinozuka, M., and Deodatis, G. (1991). Simulation of stochastic processes by spectral representation. Appl. Mech. Rev. 44, 191–204. doi:10.1115/1.3119501
Simiu, E., Gabbai, R. D., and Fritz, W. P. (2008). Wind-induced tall building response: a time domain approach. Wind Struct. 11, 427–440. doi:10.12989/was.2008.11.6.427
Solari, G. (1993a). Gust buffeting. I: Peak wind velocity and equivalent pressure. J. Struct. Eng. 119, 365–382. doi:10.1061/(ASCE)0733-9445(1993)119:2(365)
Solari, G. (1993b). Gust buffeting. II: Dynamic along-wind response. J. Struct. Eng. 119, 383–397. doi:10.1061/(ASCE)0733-9445(1993)119:2(383)
Solari, G., and Kareem, A. (1998). On the formulation of ASCE 7-95 gust effect factor. J. Wind. Eng. Ind. Aerodyn. 7, 673–684. doi:10.1016/S0167-6105(98)00182-2
Solari, G., and Piccardo, G. (2001). Probabilistic 3-D turbulence modeling for gust buffeting of structures. Probab. Eng. Mech. 19, 73–86. doi:10.1016/S0266-8920(00)00010-2
Spence, S. M. J., and Kareem, A. (2014). Tall buildings and damping: a concept-based data-driven model. J. Struct. Eng. 140, 04014005. doi:10.1061/(ASCE)ST.1943-541X.0000890
Staffelbach, M., Sempolinski, P., Kijewski-Correa, T., Thain, D., Wei, D., Kareem, A., et al. (2015). Lessons learned from crowdsourcing complex engineering task. PLoS ONE, 10:e0134978. doi:10.1371/journal.pone.0134978
Tamura, Y. (2013). “TPU global COE program – new frontier of education and research in wind engineering,” in The 6th International Symposium on Wind Effects on Buildings and Urban Environment (ISWE6) – Current-State-of-the-Art in Wind Engineering and Outlook for the Future (Tokyo, Japan).
Thomas, J., Bowyer, K. W., and Kareem, A. (2011). “Towards a robust automated hurricane damage assessment from high resolution images,” in 13th International Conference on Wind Engineering (ICWE 13) (Amsterdam, Netherlands).
Thomas, J., Bowyer, K. W., and Kareem, A. (2012a). “Color balancing for change detection in multitemporal images,” in IEEE Workshop on Applications of Computer Vision (Colorado Springs, CO).
Thomas, J., Kareem, A., and Bowyer, K. W. (2012b). “Fast, robust feature-based matching for automatic image registration in disaster response applications,” in IEEE International Geoscience and Remote Sensing Symposium (IGARSS) (Munich, Germany).
Van Den Einde, L., Kinderman, T. L., Masuda, M., and Elgamal, A. (2007). “NEES IT tools to advance earthquake engineering research,” in Proceedings of Structures Congress 2007 (Long Beach: CD-ROM).
Van Overschee, P., and De Moor, B. (1996). Subspace Identification for Linear Systems. Dordrecht, Netherlands: Kluwer Academic Publishers.
Vickery, B. J. (1970). “On the reliability of gust loading factors,” in Proceedings of the Technical Meet Concerning Wind Loads on Buildings and Structures (Washington: National Bureau of Standards), 93–104.
Wang, N., and Adeli, H. (2012a). Web-based tutor for interactive design of single-span and continuous steel beams. Comput. Appl. Eng. Educ. 20, 383–389. doi:10.1002/cae.20474
Wang, N., and Adeli, H. (2012b). Web-based tutor for interactive design of connections in steel buildings. Comput. Appl. Eng. Educ. 20, 568–577. doi:10.1002/cae.20474
Wieselsberger, C. (1921). Neuere Feststellungen iiber die Gesetze des Fliissigkeits- und Luftwiderstands. Physics 2, 321–328.
Wittig, L. E., and Sinha, A. K. (1975). Simulation of multicorrelated random processes using the FFT algorithm. J. Acoust. Soc. Am. 58, 630–633. doi:10.1121/1.380702
Zhou, Y., and Kareem, A. (2001). Gust loading factor: new model. J. Struct. Eng. 127, 168–175. doi:10.1061/(ASCE)0733-9445(2001)127:2(168)
Keywords: virtual organization, cyberinfrastructure, extreme winds, wind load effects, modeling, simulation, analysis, design
Citation: Kareem A and Kwon DK (2017) A Cyber-Based Data-Enabled Virtual Organization for Wind Load Effects on Civil Infrastructures: VORTEX-Winds. Front. Built Environ. 3:48. doi: 10.3389/fbuil.2017.00048
Received: 09 January 2017; Accepted: 21 July 2017;
Published: 21 August 2017
Edited by:
Gregory Alan Kopp, University of Western Ontario, CanadaReviewed by:
Franklin Lombardo, University of Illinois at Urbana–Champaign, United StatesChris Letchford, Rensselaer Polytechnic Institute, United States
Copyright: © 2017 Kareem and Kwon. This is an open-access article distributed under the terms of the Creative Commons Attribution License (CC BY). The use, distribution or reproduction in other forums is permitted, provided the original author(s) or licensor are credited and that the original publication in this journal is cited, in accordance with accepted academic practice. No use, distribution or reproduction is permitted which does not comply with these terms.
*Correspondence: Ahsan Kareem, kareem@nd.edu