Real-time Application of the Multihazard Hurricane Impact Level Model for the Atlantic Basin
 Stephanie F. Pilkington
 Hussam N. Mahmoud
- Colorado State University, Fort Collins, CO, United States
Tropical cyclones are an example of a multihazard event with impacts that can highly vary depending on landfall location, wind speed, storm surge, and inland flooding from precipitation. These storms are typically categorized by their wind speed and pressure, while evacuation orders are typically given based on storm surge. The general public relies on these single hazard assessment parameters when attempting to understand the risk of an oncoming event. However, after the fact, these events are ranked by economic damage and death toll. Therefore, it is imperative that when these events are communicated to the public, during the forecast period, the multiple hazards are incorporated in terms the public can easily associate with, such as economic damage. This article provides an evaluation of the potential for real-time use of artificial neural networks, through the utilization of an already developed Hurricane Impact Level (HIL) Model, to forecast a range of economic damage from tropical cyclone events, during the 2015 and 2016 United States hurricane season. The HIL Model is built prior to the start of each season and simulated every 3 h, in conjunction with National Hurricane Center (NHC) issued advisories, for oncoming tropical cyclones forecasted to make landfall. Weaker and more common tropical cyclones have a less varied forecast and produce more accurate impact level (IL) predictions. More complicated and uncertain events, such as 2016 Hurricane Matthew, require the user’s discretion in communicating varying landfall locations for a complex track forecast to the model. As NHC forecasts change with respect to both track and meteorological hazards affecting land, the estimated IL and the HIL model confidence will also change. In other words, if a track shifts to a more vulnerable location, or to more locations, or the meteorological hazards increase, the IL will subsequently increase. All tropical cyclones from the 2015 and 2016 seasons demonstrate the validity of the HIL Model with a forecast confidence of at least 60% for up to 30 h out from an impending landfall.
Introduction
Infrastructure damage and corresponding casualties can result from a wide array of natural events. A multihazard event involves more than one natural hazard where the hazards are correlated or uncorrelated and simultaneous, cascading, or distributed over time. A community subjected to extreme hazard events must have increased awareness, preparedness, and stricter building codes. The multihazard events that will be focused on herein are related to tropical cyclones, which inherently involve three different hazards: wind, storm surge, and inland flooding due to precipitation.
The majority of current studies assess the wind hazard of tropical cyclones due to the main focus within building codes in tropical cyclone prone areas, at least in the US. The Saffir-Simpson Scale Hurricane Wind Scale, which is commonly used in the US to rank hurricanes, categorizes tropical cyclones by wind speed and the level of corresponding damage as shown in Table 1 [National Oceanic and Atmospheric Administration (NOAA), 2013]. Winds act on a structure by creating uplift, mainly on the roof, due to resulting pressure distributions from the fluid flow patterns around a structure. Potentially, wind will also carry debris, which can negatively affect structures downwind (Yau et al., 2011).
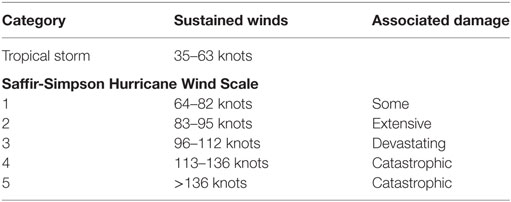
Table 1. Tropical cyclone ranking system for the western hemisphere.
Tropical cyclones also bring storm surge (rise in sea level) and heavy rains. The damage from these is mainly of focus to damage of interior items in buildings or residential homes (Li et al., 2012; Dao et al., 2013). However, infrastructure wise, flooding due to heavy rains and storm surge can also cause erosion, overwhelm underground systems, and carry large debris (Morton, 2007; Peters et al., 2007; Blake et al., 2011; Chisolm and Matthews, 2012; Kaufman et al., 2012; Lwin et al., 2014). All these factors interact within the local community to create the total damage. However, the public relies heavily on ranking systems based only on wind speed, such as the Saffir-Simpson Hurricane Wind Scale, for information as to the potential risk and impact of an oncoming event. Part of the difficulty in relaying the whole picture to the public is that there are many variables involved, which may relate to each other, not necessarily in a straightforward or linear manner. Ideally, the goal would be to tie all variables together and communicate their effect in terms the public can easily understand: causalities and/or cost. In line with this goal, a recent Hurricane Impact Level (HIL) Ranking System, shown in Table 2, was developed by Pilkington and Mahmoud (2016) to correlate total economic damage to an impact level (IL). The economic damage referenced in the HIL Ranking System is based on National Hurricane Center (NHC) reporting, which account for all infrastructure damage and insurance payouts for things such as temporary housing when a home is uninhabitable. This economic damage is the same value that is later used to rank hurricanes by costliest disasters (after-the-fact).
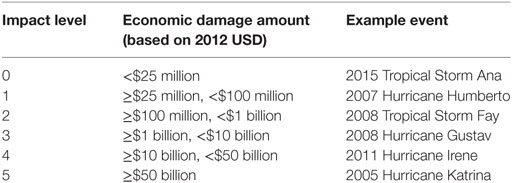
Table 2. Hurricane Impact Level ranking system (Pilkington and Mahmoud, 2016).
To relate the multiple hazards to their effects on infrastructure damage and the subsequent economic cost of such an event, a complex nonlinear mathematical interaction model is needed. Artificial neural networks (ANNs) are artificial intelligence programs capable of learning from historical events through pattern recognition, similar to how the human brain learns. These networks establish nonlinear connections between artificial neurons, or nodes, in multiple layers to capture the impact of the above-mentioned hazards in relation to landfall location and population affected. The build process of ANNs involves training, validation, and testing phases to establish such connections. This structure allows for the interaction among many variables contributing to the resulting outcome from a multihazard event and ranking an on-coming storm by the potential impact instead of intensity in terms the general public can easily relate to: economic damage.
This article addresses whether using an ANN model developed by Pilkington and Mahmoud (2016), can be applied real-time as an accurate forecasting tool to communicate the overall impending impact of a land-falling hurricane within the US. The economic damage is surveyed and tallied after the storm passes, insurance claims are filed, and federal funding is distributed in response. However, in order to better inform the public of the impacts resulting from all hazards of a hurricane, a forecasting method of categorizing storms by impact could tie together both hazard and outcome. In other words, storms such as Hurricane Sandy that are weak intensity could be misinterpreted as low impact. With an ability to forecast a general impact, Hurricane Sandy would forecast as a dangerous (not weak) storm. By assessing the accuracy of this ANN model, hurricanes could be categorized and communicated to the public real-time by impact instead of solely relying on wind speed (intensity).
Methodology
Overview of the Hurricane Impact Model
The HIL Model is originally developed using ANNs, trained with a Bayesian approach, to address the complexities the interaction of many parameters that drive the outcome of this type of natural hazard. The HIL model uses multiple neuron layers consisting of an input layer, hidden layer, and output layer. The input layer consists of 13 user-determined inputs from an oncoming hurricane event, as expected at landfall (shown in Figure 1): population affected (failing within tropical storm force wind radius for the expected track), maximum wind speed (mph), minimum pressure (mbar), maximum storm surge (feet), total precipitation (inches), and four landfall locations (optional past the first landfall) in terms of degrees latitude and longitude. The use of four potential landfall locations assists in illustrating storm track, since storms such as 2011 Hurricane Irene technically landfall more than once as it travels up the East Coast. The hidden layer serves as additional nodal connections to transfer and relate the inputs to each other and the resulting output: the IL (Pilkington and Mahmoud, 2016). Each hurricane season, the model networks are built (trained, validated, and tested) using all land-falling historical events since 1998 (data are not consistent prior to this date). The first model built, as discussed in Pilkington and Mahmoud (2016), used one network of the lowest possible percent error. There may be more than one network with such a low error but it may not produce the same output results or confidence in those results. Additionally, overfitting is a common problem with Bayesian methods and neural networks. In order to correct for this, the following season models are built with multiple different networks. These networks produce individual results, which contribute to an average that assesses agreement amongst the multiple HIL model networks (or ANNs).
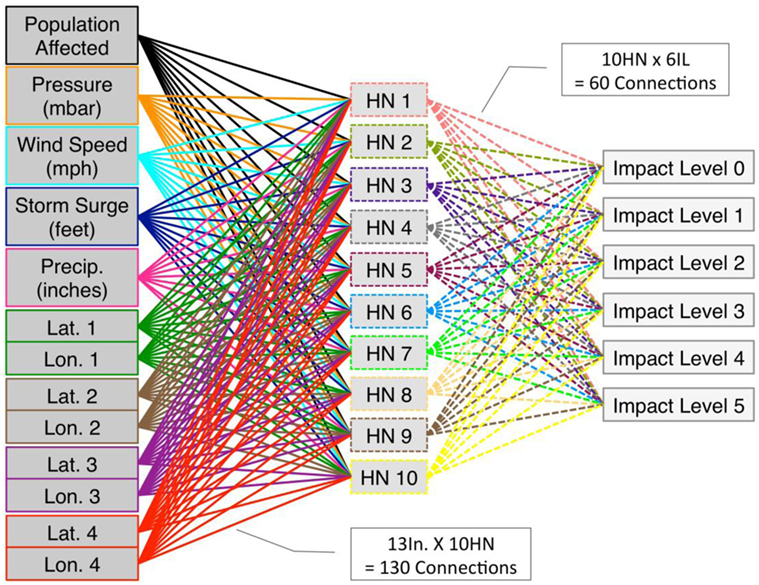
Figure 1. Hurricane Impact Level (HIL) Model neural network general structure (Lat. = latitude in degrees North, and Lon. = longitude in degrees West, HN = hidden neuron, units are shown as those in use within the HIL Model).
Real-time, the inputs are mainly found within US NHC advisories and graphics [National Hurricane Center (NHC, 2015b, 2016)]. Available shapefiles for the projected storm track and US Census population by county allow for real-time determination of the population to be affected (National Hurricane Center, 2017; Census Bureau, U.S., 2014). The track also provides an approximate landfall location for model input. The NHC releases advisories at least every 3 h, during which meteorological parameters may change and the storm track may shift. In building the model networks these same input parameters are from historical Tropical Cyclone Reports (TCRs) with the accurately measured data upon landfall.
The current approach, used by the US NHC, is to show wind speed probabilities, storm surge forecast, and rainfall forecast all separately. The Federal Emergency Management Agency does have a GIS program, Hazard US, that can be used to run hypothetical scenarios of specified wind speed and rainfall at certain locations in order to predict overall loss (Schneider and Schauer, 2006; Vickery et al., 2006). Recently, there has been success in applying machine learning and ANNs to the areas of medicine and finance. These applications have been found to better predict heart disease, read biopsy results, forecast stock-market prices, and safe guard against potential terror threats through banks (Baxt, 1995; Lu Dang Khoa et al., 2006; Hutson, 2017; Lapowsky, 2017). The challenge in using such an approach lies in setting up the network accurately for applicable use as well as realizing that the model is built with respect to the previously supplied data, in this case available (and consistent) historical tropical cyclone data.
With the inspiration from the applications in different fields, the HIL Model uses ANNs to predict the outcome of a tropical cyclone real-time based on currently available data. These real-time input variables (shown in Figure 1) are the tropical cyclone parameter equivalents to reading an electrocardiogram, or biopsy, with family medical history as indicators of a predictable outcome. For this study, the changes in these variables are assessed with every 3-h NHC issued advisory and rerun within the HIL Model to evaluate the effect of these changes to the impact forecast. If no changes occur, the IL remains the same.
The 2015 Hurricane Impact Model
Each year, once the NHC produces the TCRs for the following season, the neural network can be rebuilt with the additional data and associated known target outcome [National Hurricane Center (NHC), 2015a]. In addition, the 2015 HIL Model now consists of multiple networks, which run simultaneously to produce numerous results that are then averaged to establish the overall resulting IL. This approach is taken in the interest of mitigating possible over-fitting issues from network use, especially for outlier events. For more commonly occurring events, each network returns similar results.
The 2015 HIL Model consists of seven ANNs (designated a through g) that are built to result in 3% error or less. This percent error is based on how well the network places events during its training and testing phase (Pilkington and Mahmoud, 2016). Using Bayesian methods, this percent error could range from 0 to 8%. Additionally, the receiver operating characteristic (ROC) curves are evaluated for results in the true-positive range. This leads to building ANNs with a false-positive rate near zero. Both of these build decisions are made based on there being greater than five ANN options fitting these parameters as a minimum to provide thorough results, while not too many as to decrease model run time. In total, 69 events are trained and tested. The final networks then have the lowest error neuron connection parameters (biases and connection weights). These results are shown through confusion matrices in Figure 2 for Models a through d and Figure 3 for Model e through g, where the network produces the output IL during building, while the target IL is known from the historical data. Correctly placed events will follow the diagonal of the confusion matrix with the resulting overall percent error following at the bottom right corner. The confusion matrices best show the accuracy, and potential errors in these networks, by illustrating what events the ANNs struggle to correctly place and if these events are commonly misplaced. Since no networks with false-positive rates are chosen for the HIL Model, the ROC curves are not shown in this article, as these would just show a grouping of lines in the top of the true-positive section but give no additional insight into the potential flaws of each network.
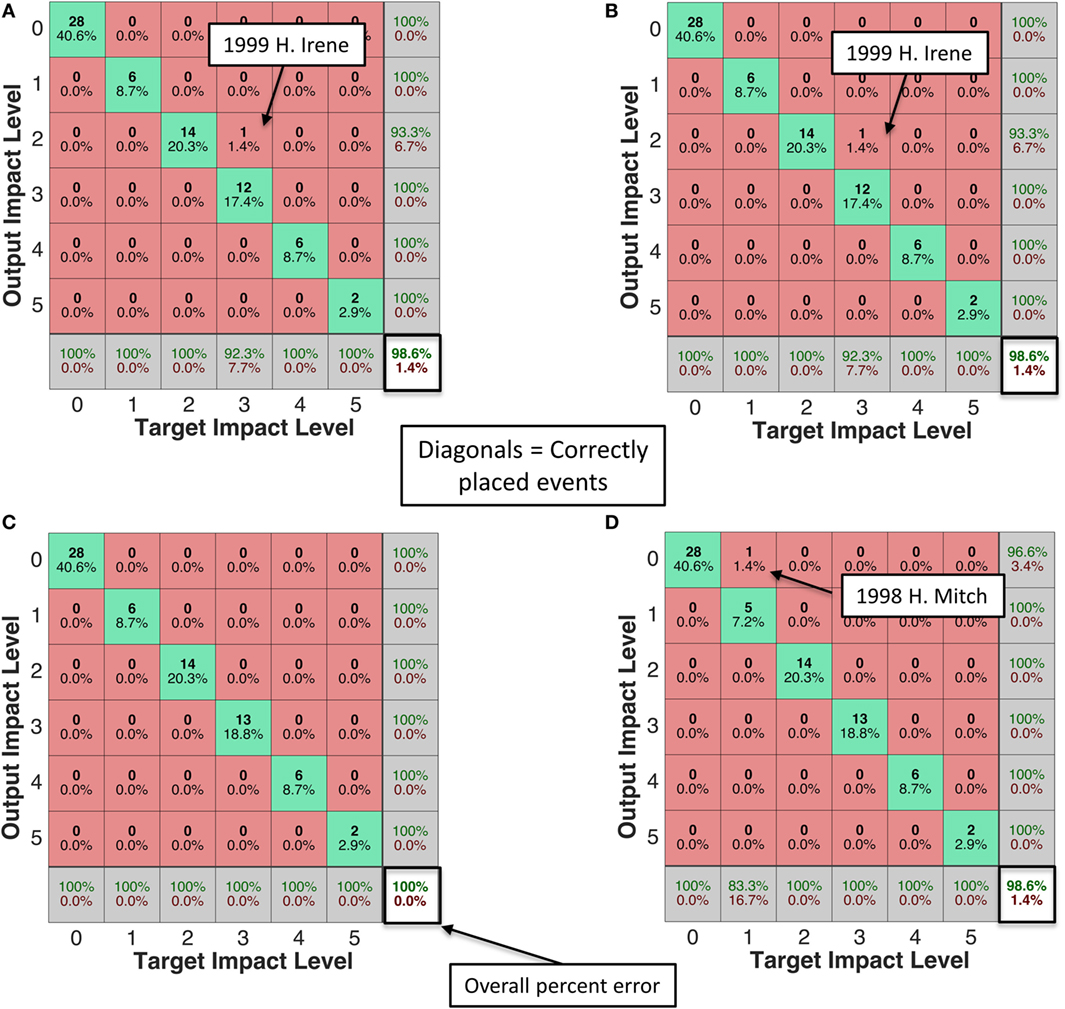
Figure 2. Storm event placement in building Hurricane Impact Level (HIL) Models (A) 2015a, (B) 2015b, (C) 2015c, and (D) 2015d (H = hurricane, TS = tropical storm).
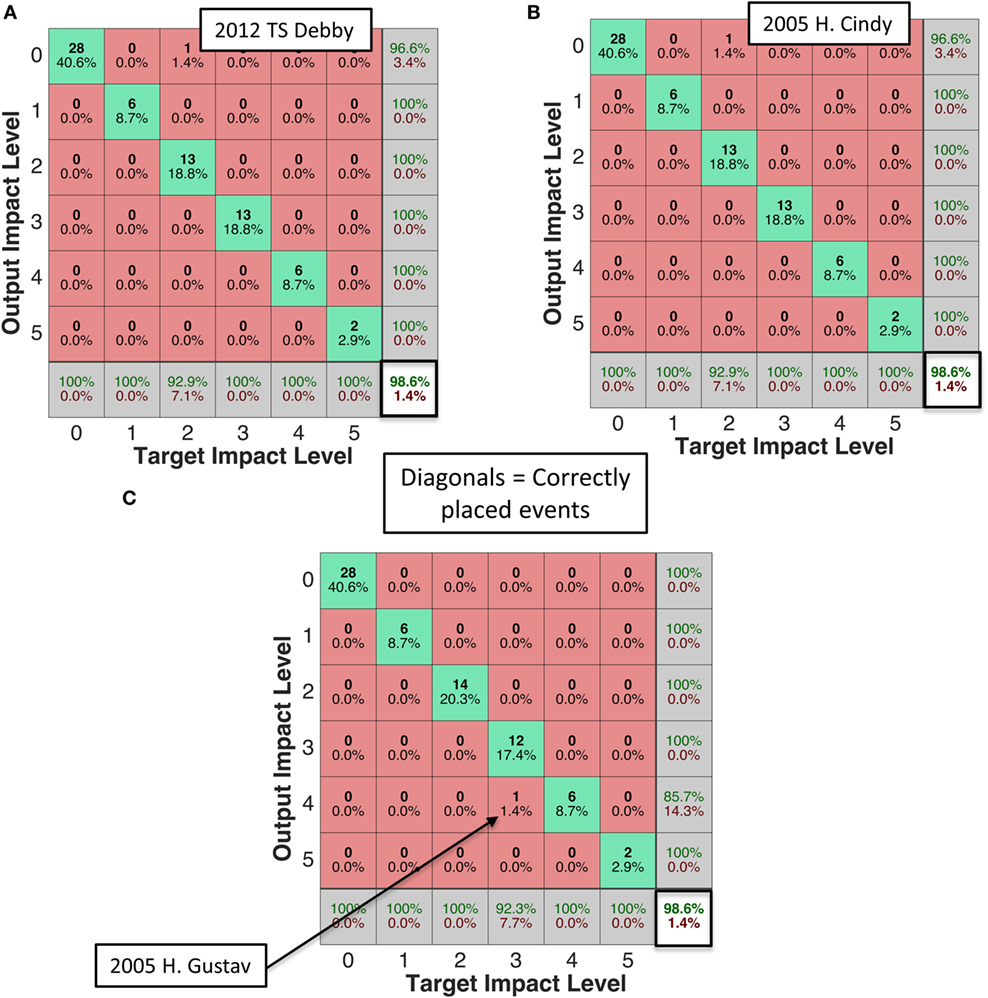
Figure 3. Storm event placement in building HIL Models (A) 2015e, (B) 2015f, and (C) 2015g (H = hurricane, TS = tropical storm).
Overall each network does not misplace more than one event out of 69 total historical events. In summation with all the networks, this is equivalent to five different misplaced events out of 483 events through all seven networks. As shown in Figures 2 and 3, the misplaced events are 1999 Hurricane Irene, 1998 Hurricane Mitch, 2012 Tropical Storm Debby, 2005 Hurricane Cindy, and 2005 Hurricane Gustav. Hurricane Irene (1999) is misplaced twice as an IL 2 event, when it is actually an IL 3 event. When the economic damage from Irene is normalized to 2012 US Dollars (USD), it is one of the few events that jumped ILs from where it would be categorized, before normalization, up one IL after normalization as a lower IL 3 event. Tropical Storm Debby is the first event, in building these models, to be misplaced two ILs over. Debby is an IL 2 event but is incorrectly placed at an IL 0. While Debby’s wind speed is exceptionally low (35 knots) with moderate storm surge (1.37 m), its maximum precipitation is very high with 73 cm. This coupled with affecting 9 million people in the state of Florida, accounted for its higher actual IL. This event is correctly placed in the other six networks allowing for any subsequent miscue in neuron connections of network 2015f to be counteracted in the subsequent overall resulting IL when using the 2015 HIL Model during real-time analysis.
The 2016 Hurricane Impact Model
The 2016 HIL Model consists of nine ANNs (designated a through i) that are built to result in 3% error or less. There are more networks for this year’s model with 2.8% error than the 2015 HIL Model networks. This is not necessarily a negative for the 2016 HIL Model, since this is still an acceptable error and the combination of these nine artificial networks is designed to catch overfitting, which is more common in models with 0% error. The results for the 2016 HIL Model are shown through confusion matrices in Figure 4 for Models a through e and Figure 5 for Models f through i, where the network produces the output IL during building, while the target IL is known from the historical data. Correctly placed items will follow the diagonal of the confusion matrix with the resulting overall percent error following at the bottom right corner. Note that HIL Model 2016f is left out of these figures since it results in a zero percent error and would only show correct placement along the diagonal.
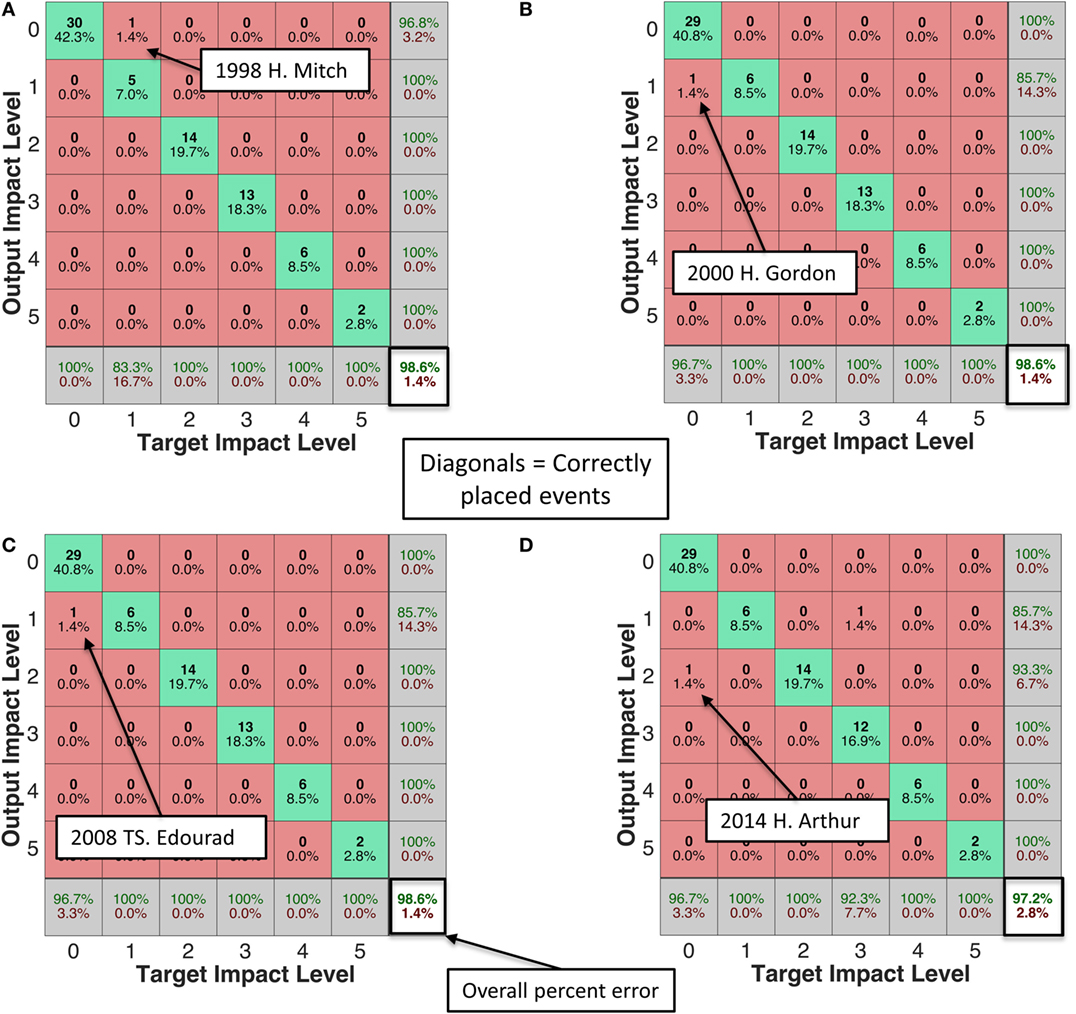
Figure 4. Storm event placement in building HIL Models (A) 2016a, (B) 2016b, (C) 2016c, and (D) 2016d (H = hurricane, TS = tropical storm).
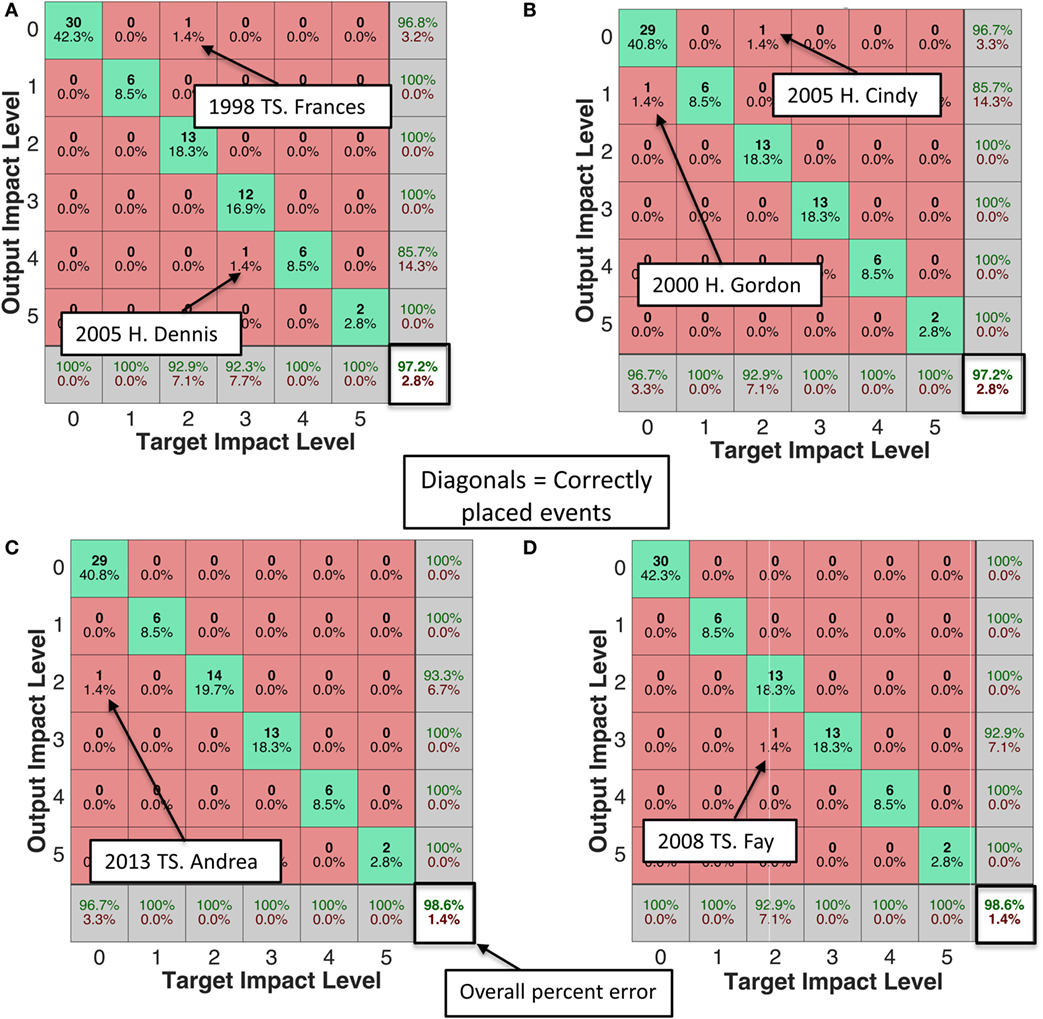
Figure 5. Storm event placement in building HIL Models (A) 2016e, (B) 2016g, (C) 2016h, and (D) 2016i (H = hurricane, TS = tropical storm).
Overall each network does not misplace more than two events out of 71 total historical events. In summation with all the networks, this is equivalent to ten different misplaced events out of 639 events through all nine networks. As shown in Figures 4 and 5, the misplaced events are 1998 Hurricane Mitch, 1998, 2000 Hurricane Gordon, 2008 Tropical Storm Edouard, 2008 Hurricane Dolly, 2014 Hurricane Arthur, 1998 Tropical Storm Frances, 2005 Hurricane Dennis, 2005 Hurricane Cindy, 2013 Tropical Storm Andrea, and 2008 Tropical Storm Fay. Both the 2015 and 2016, HIL Models have 1998 Hurricane Mitch and 2005 Hurricane Cindy misplaced. These are events to continue to observe in future year builds for a subsequent pattern in why they are being misplaced. Hurricane Mitch is the first storm in this data set from the earliest year of available data. Hurricane Cindy, in 2016 HIL Model (g), very nearly tied at ILs 0 and 2, if the decimal places are rounded to the nearest thousandths both would have reported as Level 1.000 for the network confidence. This also occurs for 2008 Tropical Storm Fay. Only Hurricane Gordon misplaces twice within all 9 model builds. Additionally, when evaluating the real-time results of these models, some user evaluation would be recommended to account for low and nearly matching confidences. These are cues from the model that there may be some variation in impact due to the storm’s multiple hazards or its location. For example, Hurricane Cindy’s second landfall is near New Orleans, but had relatively low precipitation (23 cm) and wind speed (65 knots), causing the model to oscillate between a lower and higher IL. The modeler’s discretion can also help catch this by exploring variations within the meteorological forecast. This will be discussed further in the Results section for 2016 Hurricane Matthew.
Evaluation and Comparison Approach
These models are used real-time during their respective seasons for evaluation within this study. The TCRs are typically released in the following spring and provide the actual meteorological data, landfall location(s), and the damage statistics. The economic damage is reported in that year’s dollar amount and requires adjustment to 2012 US dollars in order to match the current ranking system. This is done using the same US Census construction price indices and ratio as outlined by Pilkington and Mahmoud (2016). For tropical cyclones with notable damage (ranking higher than an IL 0), bounds are given in the 2016 TCRs (Berg, 2017; Stewart, 2017). Both the damage estimate and the confidence interval are normalized to 2012 USD to create applicable bounds.
During the real-time model simulations, variations to the model usage are tracked for the purpose of comparison once the actual results are released. This is done to determine the source of potential issues within the model in forecasting the correct IL. The HIL Model is heavily reliant on the available forecast data and the closer the tropical cyclone to landfall, the more accurate the input data will be from meteorological forecasting.
Forecasting Results
The 2015 US Hurricane Season
For the 2015 US hurricane season there are two land-falling events: Tropical Storm Ana (South Carolina) and Tropical Storm Bill (Texas). The 2015 HIL Model is implemented for each NHC issued advisory as available [National Hurricane Center (NHC), 2015b]. Table 3 shows data from the advisory just prior to landfall and the actual TCR values. For such events, the model cannot be run until the storm is officially past the classification of tropical depression and/or until the storm surge data is made publicly available, which is typically the last parameter provided in these advisories. Once able, the data from NHC advisories (issued every 3 h) are supplied to the HIL model for which the results are shown in Figure 6, in terms of the projected IL hours out from actual landfall. The confidence in model ILs are tied to input changes; therefore, when hazard changes are made in the advisories, a shift in model confidences may occur (since wind speed is estimated for landfall, this usually requires enough of a change to jump Category ranking).
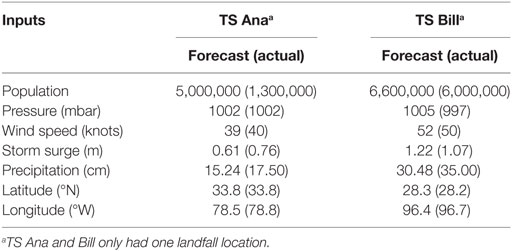
Table 3. Input data for tropical storms (TS) Ana and Bill.
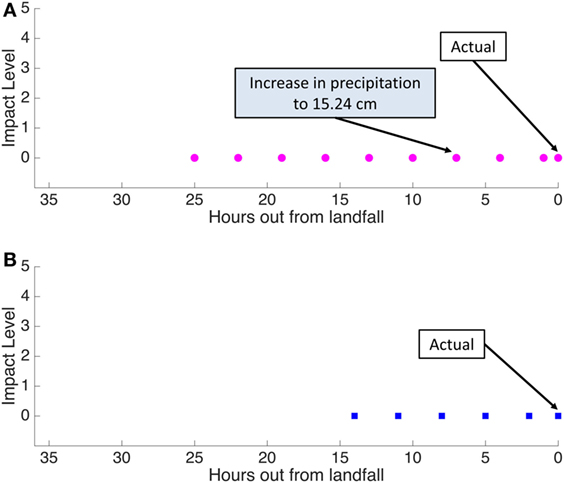
Figure 6. 2015 Hurricane Impact Level (HIL) Model forecasting results, with comparison to actual impact level, for (A) Tropical Storm Ana and (B) Tropical Storm Bill. Model confidence in forecast impact level shown in bold.
The resulting ILs, produced from this model real-time, are dependent on the meteorological forecasts. For weaker, and more common events, such as those that occurred in 2015, high confidence in the model IL forecasts indicates ease of prediction for the HIL Model. The model confidences are only shown for advisories where input parameters changed. For both events, the meteorological factors remained fairly consistent throughout the issued advisories. The biggest change between both is for Tropical Storm Bill’s population affected, which increases when four additional inland counties (near Corpus Christi and Galveston areas) are included. Since the landfall location does not shift too much and the major cities remain in the population estimation, this does not alter the results for Tropical Storm Bill as it neared the coastline and further advisories are issued. Tropical Storm Ana has a meteorological hazard variation where the precipitation increased from 7.62 to 10.16 to 15.24 cm throughout its forecast. Additionally, for Tropical Storm Ana, the actual population affected did end up varying from the forecast value. The population affected is originally meant to be an estimated value and the networks are trained as such so that use during real-time forecasting allows for some error within this parameter.
For both storms, the 2015 HIL Model remained precise as well as accurate in terms of the actual results. The TCR for Tropical Storm Bill does not list the final estimated economic damage as of yet; however, it is expected to remain below the $25 million threshold (Berg, 2015). There is flooding that occurred in Texas before Bill made landfall for which damage also occurred and would need to be sorted out from damage specifically resulting from Tropical Storm Bill.
Use during the 2016 US Hurricane Season
The 2015 US hurricane season events assessed above are subsequently part of the data set for the 2016 HIL Model. For the 2016 US hurricane season there are three land-falling events to be analyzed real-time: Tropical Storm Colin (Florida), Hurricane Hermine (Florida), and Hurricane Matthew (South Carolina). There is one additional storm that technically had a US landfall while at least a tropical storm. However, Tropical Storm Julia became a named storm over land and only lasted for approximately 6 h. Julia is therefore not included in this study. Table 4 shows the data from the NHC advisory issued just prior to landfall and the actual reported values. The first storm of the season, Tropical Storm Colin, and its subsequent 2016 HIL Model forecast results are shown in Figure 7.
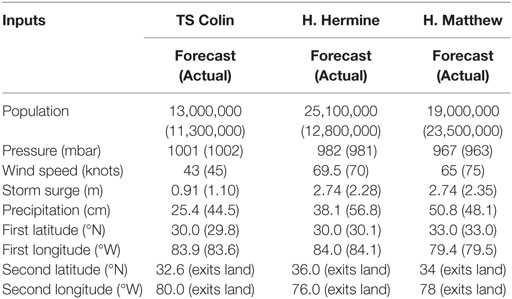
Table 4. Input data for 2016 storm events (H. = Hurricane).
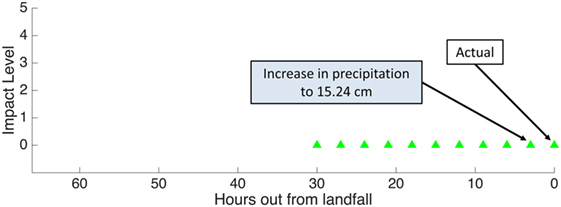
Figure 7. 2016 Hurricane Impact Level (HIL) Model forecasting results, with comparison to actual impact level, for Tropical Storm Colin. Model confidence in forecasted impact level shown in bold.
Tropical Storm Colin appears similar to the storms from the 2015 season as a weaker and more common event. Colin’s winds varied from 35 to 52 knots throughout its forecast. The 52 knots is a user defined increase from current wind speed of 43 knots due to a forecast discussion of expected strengthening [National Hurricane Center (NHC), 2016]. Colin’s precipitation also varied from 10.7 to 15.2 cm during the forecast. Both wind speed and precipitation changes cause the model confidence in an IL 0 event to lower slightly while remaining significantly confident (>60%) in the HIL Model forecasts. The landfall location remained similar; however, the population varied from 11.2 to 13 million as a result of additional county warnings. Even with the parameters varying slightly with Tropical Storm Colin, the model remains at a forecast IL 0 event prior to landfall, which is then confirmed by the TCR (Pasch and Penny, 2017). Following Colin is Hurricane Hermine with a similar track initially but more severe meteorological hazards. The results from the 2016 HIL Model forecast are shown in Figure 8. Note that for Hurricane Hermine, its status at tropical depression is included due to the high confidence in a potential landfall and a corresponding estimate for storm surge values.
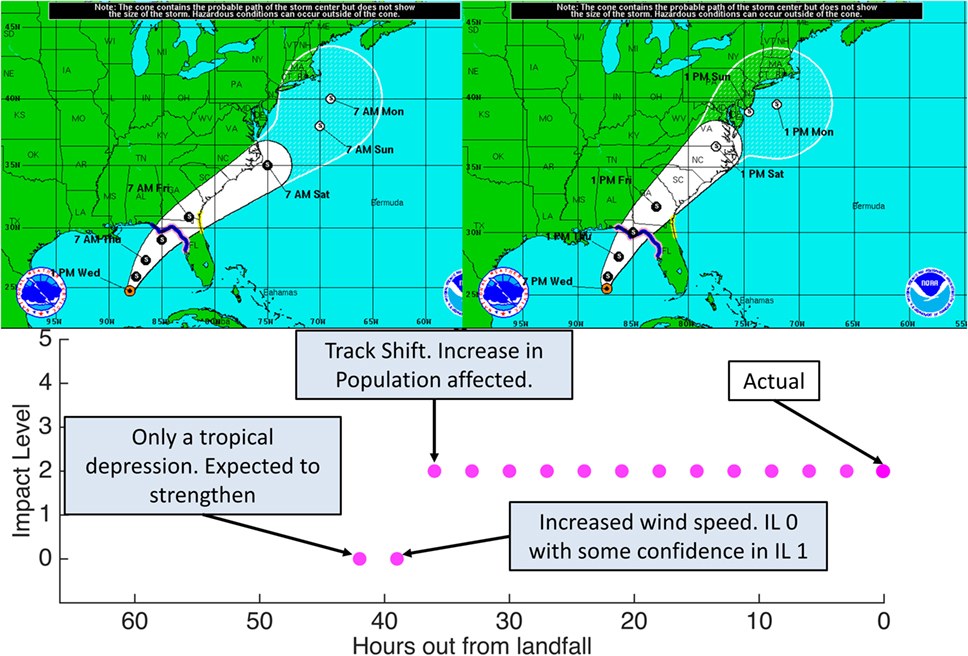
Figure 8. 2016 Hurricane Impact Level (HIL) Model forecasting results, with comparison to actual impact level, for Hurricane Hermine. Model confidence in forecast impact level shown in bold and NHC track images are from August 31, 2016 (1PM CDT and 7PM CDT, respectively).
Hurricane Hermine is the first real-time forecast event for this model that results in a change in IL as well as an IL beyond the common IL 0 events. Hermine’s winds varied from 35 to 70 knots throughout its forecast and its forecasted precipitation oscillate between 13.03 and 17.37 cm. Hermine’s storm surge starts at a forecast of 1.52 m and increases to a maximum of 2.74 m [National Hurricane Center (NHC), 2016]. When the wind speed increases, the forecast IL confidence begins to waiver with a much lower confidence of 34% for an IL 0 event. The biggest change for Hurricane Hermine is when the forecast track shifts to cover more of the East Coast and more than doubles the expected population affected, bringing it up to an estimated 25.1 million people. However, the actual population affected from the best track is closer to 12.8 million people. Once this shift occurred, the model became more confident in a higher IL forecast. A couple of days after landfall in Florida, Hermine is forecast to linger off the Northeastern Seaboard extending advisories up into Massachusetts. While this is not shown in Figure 8, the IL held at an IL 2 with the addition of the coastal counties in the population affected. The TCR damage estimation ranged from $318 million to $557 million, placing it firmly as an IL 2 event (Berg, 2017). Hermine is the first real test for the HIL Model, and Hurricane Matthew following with a much more varied and uncertain forecast. Hurricane Matthew’s results are shown in Figure 9.
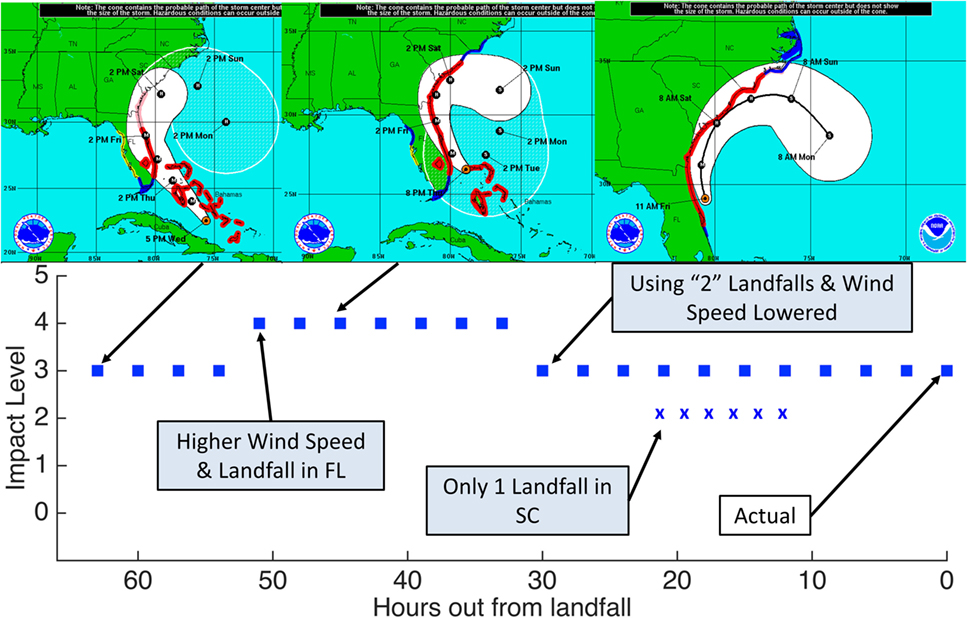
Figure 9. 2016 Hurricane Impact Level (HIL) Model forecasting results, with comparison to actual impact level (IL), for Hurricane Matthew. Model confidence in forecast IL shown in bold.
Hurricane Matthew is the big storm of the 2016 US hurricane season since it originally forecast to strike the East Coast as a major hurricane. The IL forecast began as soon as all data is available; however, in the initial forecasts there is no indication of the storm crossing over land. Due to Matthew’s forecast strength, for these beginning tracks, the closest point(s) to the coastline are used (along Florida). Since Matthew is forecast to track its left side along the coast, projections from The Weather Channel graphics are used for storm surge and wind speed due to the fact the maximum values occur on the right side of the storm and the HIL model requires forecasts for the continental US (The Weather Channel, 2016). The track for Matthew varied throughout the forecast and ended up not technically making landfall in Florida, but in South Carolina and then projected to strike the southern North Carolina coast briefly.
During real-time use, this sweep along the coastline must be communicated to the model in some way. The forecast IL 4 corresponded to a landfall in Florida at higher wind speeds ranging from 100 to 113 knots. However, once the meteorological forecast does not include a landfall in Florida, Matthew is mostly past the Florida coast and tracking northward. At this point the projected landfall would be in South Carolina. However, if only the definite landfall in South Carolina is used, the resulting forecast is an IL 2 event. Matthew had weakened some and the actual wind speed affecting land is now between 61 and 65 knots. The storm surge forecast ranges from 2.74 to 3.35 m as well. If a first hypothetical landfall in Florida is used (with second landfall being in South Carolina), Matthew would forecast as an IL 4, but if the second landfall is in North Carolina (where it is tracking with the first landfall in South Carolina) the forecast would be for an IL 3. Throughout its forecast, Matthew essentially oscillated between an IL 2 and an IL 4 event, as can be seen by a low confidence between ILs 3 and 4 of 21 and 42%, respectively, for the addition of a Florida landfall. With the only officially defined landfall being on the South Carolina coast, the confidence is somewhat significant (> 60%) at 63%. However, due to the track nature of Matthew, and how long it tracked along the coast, it is determined best to report the IL at an IL 3. The TCR estimates the damage top bound to be $9.5 billion and the lower bound to be $6.4 billion in 2012 USD (Stewart, 2017). This puts Matthew as a high IL 3 event. The use of a “second” hypothetical landfall in North Carolina, along with variances in landfalls for track purposes, allowed for accurate forecasting of Hurricane Matthew.
Discussion
Using ANNs to correlate the multiple hazards and how each interact together with the infrastructure and locational communities provides a surrogate model option for estimating damage and forecasting in terms of impacts from multihazard events. The HIL Model developed by Pilkington and Mahmoud (2016) can accurately forecast encroaching tropical cyclone events impacting the US. The real-time use of the HIL Model requires meteorological forecasts, whereas the neural network is built with known measured parameters from the TCRs. This draws attention to potential concerns in using this model for real-time forecasting due to meteorological hazard changes and track shifts. The overall performance of the HIL Model for real-time use during the 2015 and 2016 hurricane seasons demonstrates reliability in using the HIL model alongside NHC forecasts with additional challenges in track shifts highlighted by 2016 Hurricane Matthew.
Hurricane Matthew is the most significant tropical cyclone in this study as it illustrated the importance of user interpolation when relaying the forecast IL specifically in the event of a storm tracking just along the coastline without an explicit landfall. To address the challenge in communicating such a track to the HIL Model, multiple hypothetical landfalls should be used along its track. Additionally, the wind swath will still capture affected coastal counties. This approach becomes vital in storm events with forecasts that shift more. The biggest catalyst for changing IL is the track, as the meteorological parameters for these two seasons do not play as big of a role in shifting the IL up or down. By preliminary observations from these five storm events, when the hazards are altered the confidence in an IL may change, however when the track shifts to encompass more land area (and therefore population and infrastructure) the IL will increase for two out of the two events where this occurs (Hurricane Hermine and Hurricane Matthew).
In real-time use, Tropical Storms Ana, Bill, and Colin would be referred to as a Tropical Storm IL 0 during forecasting. Hurricane Hermine would forecast as a Category 1 IL 2 and Hurricane Matthew a Category 1 IL 3 event upon landfall. This now relates both the storm intensity, as commonly categorized, and the expected outcome, formulated from meteorological hazards and the locational properties for which they occur. Both Hurricane Hermine and Matthew are excellent examples of storms that made landfall at a lower category while actually having a higher IL. The real-time use validation of the HIL model’s ability to forecast, for both seasons, is indicative of an accurate and highly useful model in communicating impact and risk, instead of the public maintaining focus on the Saffir-Simpson Hurricane Wind Scale. For 80% of the forecast storms, the HIL Model is not only accurate but with significant (>60%) confidence in the forecast IL days out from landfall. The HIL Model confidence tends toward less confident values when it is oscillating between ILs (as shown with Hurricane Hermine and Hurricane Matthew) or is about to shift in IL. These results also indicate validity in the defined build decisions of multiple neural networks, within the HIL Model, of 3% error or less and only selecting networks with no (or a near zero) false-positive rate. As more events are added to the training data set after each season, these decisions may be reevaluated.
Future work with the HIL Model would involve continual use each hurricane season, while tracking the results to potentially develop statistics on how the parameter changes alter the IL forecast. This work would require a larger sample size than the five storms. The ANN builds will also be continually tracked to develop more significant statistics on what events are being misplaced, consistency, and how that might be affecting the results. Currently the only forecasting challenges occur with Hurricane Matthew, and of the misplaced events in the ANNs, only 2014 Hurricane Arthur had a similar track but is a weaker storm. Future considerations to monitor with continued use will be the accuracy of forecasting in regions with sparse historical data, such as the Northeast. The HIL Model assesses landfall locations as a relationship to the closest points within the data set; however, regions in the northeast have less densely packed data points with most storms tracking up the eastern seaboard, for which there are more data showing this track pattern. If the model continues to forecast well, hypothetical scenarios could be explored for the effects of hazard and locational changes. As meteorological forecast models continue to improve further out from landfall, so will the HIL Model IL forecast since these relate.
Author Contributions
With the submission of this manuscript I would like to undertake that the above-mentioned manuscript has not been published elsewhere, submitted for publication elsewhere or under editorial review for publication elsewhere. All of the material in the article is original so there is no need to take any permission. The full names of the authors and their affiliations are: HM, Associate Professor, Department of Civil and Environmental Engineering, Colorado State University, Fort Collins, CO, USA. SP, Graduate Research Assistant, Department of Civil and Environmental Engineering, Colorado State University, Fort Collins, CO, USA.
Conflict of Interest Statement
The authors declare that the research was conducted in the absence of any commercial or financial relationships that could be construed as a potential conflict of interest.
Acknowledgments
The authors would like to acknowledge the financial support provided by the Department of Civil and Environmental Engineering at Colorado State University through the Mrs. Mary Medea is Scholarship, which is established in memory of Mr. Kenneth G. Medearis.
References
Baxt, W. G. (1995). Application of artificial neural networks to clinical medicine. Lancet 346, 1135–1138. doi: 10.1016/S0140-6736(95)91804-3
Berg, R. (2015). National Hurricane Center Tropical Cyclone Report Tropical Storm Bill (AL022015). Miami, FL.
Blake, S., Walker, R., and Walker, R. (2011). “Potable water issues during disaster response and recovery: lessons learned from recent coastal disasters,” in Solutions to Coastal Disasters, eds L. A. Wallendorf, C. Jones, L. Ewing, and B. Battalio (Anchorage, AK: ASCE), 779–794.
Census Bureau, U. S. (2014). Geography – TIGER Products. Available at: https://www.census.gov/geo/maps-data/data/tiger.html
Chisolm, E. I., and Matthews, J. C. (2012). Impact of hurricanes and flooding on buried infrastructure. Leader. Manage. Eng. 12, 151–156. doi:10.1061/(ASCE)LM.1943-5630.0000182
Dao, T., Li, Y., van de Lindt, J. W., and Bjarnadottir, S. (2013). “Combined loss due to hurricanes and storm surge,” in Structures Congress, Vol. 4 (Pittsburgh, PA: ASCE), 2020–2031.
Hutson. (2017). Self-Taught Artificial Intelligence Beats Doctors at Predicting Heart Attacks. Available at: http://www.sciencemag.org/news/2017/04/self-taught-artificial-intelligence-beats-doctors-predicting-heart-attacks
Kaufman, S., Qing, C., Levenson, N., and Hanson, M. (2012). Transportation during and after Hurricane Sandy. New York: NYU Wagner Graduate School of Public Service.
Lapowsky, I. (2017). Banks Deploy AI to Cut off Terrorist Funding. Available at: https://www.wired.com/story/quantaverse-ai-terrorist-funding
Li, Y., van de Lindt, J. W., Dao, T., Bjarnadottir, S., and Ahuja, A. (2012). Loss analysis for combined wind and surge in hurricanes. Nat. Hazards Rev. 13, 1–10. doi:10.1061/(ASCE)NH.1527-6996.0000058
Lu Dang Khoa, N., Sakakibara, K., and Nishikawa, I. (2006). “Stock price forecasting using back propagation neural networks with time and profit based adjusted weights factors,” in SICE-ICASE International Joint Conference (Busan, Korea: Bexco), 5484–5488.
Lwin, M. M., Yen, W. P., and Shen, J. J. (2014). Effects of hurricane Katrina on the performance of U.S. Highway Bridges. J. Perform. Construct. Fac. 28, 40–48. doi:10.1061/(ASCE)CF.1943-5509.0000507
Morton, R. A. (2007). Historical Changes in the Mississippi-Alabama Barrier Islands and the Roles of Extreme Storms, Sea Level, and Human Activities. St. Petersburg, FL: U.S. Department of the Interior, U.S. Geological Survey.
National Hurricane Center. (2017). NHC Data in GIS Formats. Available at: http://www.nhc.noaa.gov/gis/
National Hurricane Center (NHC). (2015a). 2015 Atlantic Hurricane Season. Available at: http://www.nhc.noaa.gov/data/tcr/index.php?season=2015&basin=atl
National Hurricane Center (NHC). (2015b). 2015 Tropical Cyclone Advisory Archive. Available at: http://www.nhc.noaa.gov/archive/2015/
National Hurricane Center (NHC). (2016). 2016 Tropical Cyclone Advisory Archive. Available at: http://www.nhc.noaa.gov/archive/2016
National Oceanic and Atmospheric Administration (NOAA). (2013). The Saffir-Simpson Hurricane Wind Scale. Available at: http://www.nhc.noaa.gov/aboutsshws.php
Pasch, R. J., and Penny, A. B. (2017). National Hurricane Center Tropical Cyclone Report: Tropical Storm Colin.
Peters, G., DiGioia, A. M. Jr., Hendrickson, C., and Apt, J. (2007). Transmission line reliability: climate change and extreme weather. Elec. Trans. Line Subs. Struct. 12–26. doi:10.1061/40790(218)2
Pilkington, S. F., and Mahmoud, H. N. (2016). Using artificial neural networks to forecast economic impact of multi-hazard hurricane-based events. Sustain. Resilient Infrastruct. 1, 63–83. doi:10.1080/23789689.2016.1179529
Schneider, P. J., and Schauer, B. A. (2006). HAZUS—its development and its future. Nat. Hazards Rev. 7, 40–44. doi:10.1061/(ASCE)1527-6988(2006)7:2(40)
Stewart, S. R. (2017). National Hurricane Center Tropical Cyclone Report: Hurricane Matthew. (AL142016). Available at: http://www.nhc.noaa.gov/data/tcr/AL142016_Matthew.pdf
The Weather Channel. (2016). Hurricane Matthew. Available at: https://weather.com/storms/hurricane/news/hurricane-matthew-united-states-impacts
Vickery, P. J., Lin, J., Skerlj, P. F., Lawrence, T. A. Jr., and Huang, K. (2006). HAZUS-MH hurricane model methodology. I: hurricane hazard, terrain, and wind load modeling. Nat. Hazards Rev. 7, 82–93. doi:10.1061/(ASCE)1527-6988(2006)7:2(82)
Keywords: hurricane, tropical cyclone, neural network, Hurricane Matthew, forecasting
Citation: Pilkington SF and Mahmoud HN (2017) Real-time Application of the Multihazard Hurricane Impact Level Model for the Atlantic Basin. Front. Built Environ. 3:67. doi: 10.3389/fbuil.2017.00067
Received: 29 May 2017; Accepted: 11 October 2017;
Published: 06 November 2017
Edited by:
Matthew Mason, The University of Queensland, AustraliaReviewed by:
Ning Lin, Princeton University, United StatesRichard J. Krupar III, University of Maryland, College Park, United States
Copyright: © 2017 Pilkington and Mahmoud. This is an open-access article distributed under the terms of the Creative Commons Attribution License (CC BY). The use, distribution or reproduction in other forums is permitted, provided the original author(s) or licensor are credited and that the original publication in this journal is cited, in accordance with accepted academic practice. No use, distribution or reproduction is permitted which does not comply with these terms.
*Correspondence: Hussam N. Mahmoud, hussam.mahmoud@colostate.edu