Utilizing UAV and 3D Computer Vision for Visual Inspection of a Large Gravity Dam
 Ali Khaloo
 David Lattanzi
 Adam Jachimowicz
 Charles Devaney
- 1Department of Civil, Environmental, and Infrastructure Engineering, George Mason University, Fairfax, VA, United States
- 2Argonne National Laboratory, Washington, DC, United States
- 3Quadrocopter, Las Vegas, NV, United States
Dams are a critical infrastructure system for many communities, but they are also one of the most challenging to inspect. Dams are typically very large and complex structures, and the result is that inspections are often time-intensive and require expensive, specialized equipment and training to provide inspectors with comprehensive access to the structure. The scale and nature of dam inspections also introduce additional safety risks to the inspectors. Unmanned aerial vehicles (UAV) have the potential to address many of these challenges, particularly when used as a data acquisition platform for photogrammetric three-dimensional (3D) reconstruction and analysis, though the nature of both UAV and modern photogrammetric methods necessitates careful planning and coordination for integration. This paper presents a case study on one such integration at the Brighton Dam, a large-scale concrete gravity dam in Maryland, USA. A combination of multiple UAV platforms and multi-scale photogrammetry was used to create two comprehensive and high-resolution 3D point clouds of the dam and surrounding environment at intervals. These models were then assessed for their overall quality, as well as their ability to resolve flaws and defects that were artificially applied to the structure between inspection intervals. The results indicate that the integrated process is capable of generating models that accurately render a variety of defect types with sub-millimeter accuracy. Recommendations for mission planning and imaging specifications are provided as well.
1. Introduction
Dams provide vital service and protection for many communities, however, their complex nature poses many challenges for an efficient and reliable inspection. These infrastructure systems can experience a range of problems during their service life, and improper operation and maintenance result in major issues. Furthermore, dams can be deteriorated due to weathering, alkali-aggregate reaction (AAR, or alkali-silica reaction, ASR), freezing and thawing, or other chemical reactions. The Federal Emergency Management Agency (FEMA) publishes the Guidelines for Dam Safety (U.S. Dept. Of Homeland Security, Federal Emergency Management Agency, 2004), and suggests that formal inspections occur at least every 5 years. They also recommend informal, intermediate and special inspections as needed. The Maryland Department of Environment also recommends that owners inspect their dams after extreme rainfall and formally once every 5 years (Maryland Department of Environment, 1996). According to the American Society of Civil Engineers' (ASCE) 2017 Infrastructure Report Card (ASCE, 2017) the average age of the 90,580 dams in the United States is 56 years, with 17% rated as high-hazard potential dams necessitating additional inspections.
The conventional standard of practice requires a detailed visual inspection not just of the primary structure, but of the subsystems and the surrounding watershed as well. Dam inspections often require expensive and specialized equipment to provide inspectors access to difficult to reach regions of the structure and the costs for these inspections typically range into the hundreds of thousands of dollars, comprising an outsized portion of annual operating budgets. The scale and nature of dam inspections also introduce additional safety risks to the inspectors. Typically, a limited number of photographs, and occasionally videos, are captured to provide a visual record of the current state of the structure. By themselves, these recordings are not ideal data products, as reviewing them can be tedious and the lack of spatial context can prove disorienting to data analysts and engineers.
Among conventional nondestructive evaluation (NDE) techniques, Impact-Echo has been widely used to investigate the condition of concrete and extent of cracking in concrete dams (Sack and Olson, 1995). This stress-wave propagation method is one of the most promising NDE approaches due to the fact that it only requires to access one side of a test member, and is capable of determining member thickness as well as flaw depth while being less sensitive to the heterogeneity of concrete in comparison to other methods (e.g., ultrasonic) (Malhotra and Carino, 2003). In the work by Olson and Sack (1995), the Spectral Analysis of Surface Waves (SASW) method was utilized for evaluation of surface damage and determining the depth of freeze/thaw defects in a large concrete dam located on the Muskegon River in western Michigan. For monitoring of a large hydraulic structure affected by ASR, an Ultrasonic Pulse Velocity (UPV) method was used, which enabled the identification of a major tensile crack (Rivard et al., 2010). UPV is an effective way for detecting internal cracking and other defects as well as changes in concrete such as deterioration due to aggressive chemical environment and freezing and thawing (Malhotra and Carino, 2003). In the study by Colombo and Comi (2016), a bi-phase damage model of an existing concrete arch dam subjected to ASR was generated by taking into account the effects of both temperature and humidity on the hydraulic structure through a heat diffusion analysis and a moisture diffusion analysis, respectively. Although these NDE methods can be used to further evaluate the condition of the concrete structures, periodic visual inspection is still the dominant method to assess the structural integrity of dams and appurtenant structures (U.S. Dept. Of Homeland Security, Federal Emergency Management Agency, 2004).
Recently, there have been advancements in the use of 3D imaging systems for capturing the in-situ 3D state of civil infrastructure systems (Fathi et al., 2015). The most widely used technology for generating 3D models, or point clouds, is Terrestrial Laser Scanning (TLS). A lower-cost alternative and somewhat complimentary approach is to use photogrammetric methods to extract 3D geometries from large sets of two-dimensional (2D) digital images. In either case, the result is a scale-accurate, high-resolution virtual model of a structure and its surrounding areas. These digital models capture current conditions of the entire structure that can be used for archival and analytical purposes (Ghahremani et al., 2016; Jafari et al., 2017; D'Altri et al., 2018). However, both 3D imaging approaches suffer from the same access challenges that hinder conventional visual inspections.
Unmanned aerial vehicles (UAV) are a disruptive innovation (Christensen, 1997) with potential to transform traditional dam inspection methodologies by expanding the capabilities of 3D imaging in these environments. While UAV have been in use for some time, their recent popularity is in part due to reductions in hardware costs, improvements to software interfaces, and to the expanded range of sensor payload options (Turner et al., 2012). The portability, mobility, and low cost of UAV can mitigate the need for expensive inspection access equipment and reduce safety risks to inspectors (Khaloo et al., 2018). Furthermore, UAV serve as an almost ideal data collection platform for modern 3D reconstruction techniques. Critically, the nature of both UAV and 3D reconstruction methods necessitate careful planning and coordination to properly integrate and tailor these technologies for dam inspection.
1.1. Prior Work on Modern Dam Inspection
The reduced accessibility of dams, both for uptake needs and for their strategic nature, and the large amount of time needed for an inspection by traditional methods do not facilitate direct visual inspection. Therefore, novel methods that integrate modern remote sensing tools, robotics and computer vision techniques have been investigated in the past few years. In the work by Ridao et al. (2010), an Autonomous Underwater Vehicle (AUV) was designed to collect images from a hydroelectric dam which was later used to generate photomosaic (with approximate resolution of 1 pixel/mm) of the inspected area to help with the visual inspection. González-Aguilera et al. (2008) studied the viability of utilizing TLS systems to generate 3D models of a large concrete dam and further assessed its capability for structural monitoring. However, due to the limited access for data acquisition, the final model lacked the necessary completeness to capture the entire dam. Berberan et al. (2011) studied using TLS for deformation monitoring of the downstream face of the Cabril Dam in Portugal using 3D models generated at two different times for comparison purposes. Although both of the aforementioned studies proved the value of 3D modeling using TLS for dam inspection, they were not able to capture the overall geometry and resolve the fine-scale (1-mm) details needed for accurate visual inspection.
There have also been a series of recent studies on the use of UAV for dam inspection. In the study by González-Jorge et al. (2014), photogrammetric 3D modeling using UAV acquired imagery was tested for the monitoring of dam breakwaters. Recently, researchers have focused on using camera-equipped UAV to facilitate dam visual inspection through 3D modeling (Henriques and Roque, 2015; Ridolfi et al., 2017). In the work by Ming-Der et al. (2016), the capability of rotary UAV platform for image data collection and later 3D model generation was investigated for landslide dam monitoring. A full-scale test structure was built and two sets of image data was collected before and after damaging it, in order to mimic dam failure due to severe flooding. The generated 3D data was later used to identify the reduced volume upon dam failure. In a similar effort by Zekkos et al. (2016), the image data of a collapsed uniform earthfill dam, captured using a rotary UAV, was used to generate a 3D model which later utilized for cross-sectional analysis of the failure region. Hallermann et al. (2015) used 1600 high-resolution aerial images to generate a 3D model of the Rappbode Dam, the highest dam in Germany, as well as an orthomosaic image of the downstream face. In the study by Oliveira et al. (2014), an orthomosaic image of the downstream face of a concrete dam, located in Portugal, was generated using 99 UAV-acquired images. Later, a defect map was manually generated by overlaying the marked anomalies on the orthomosaic image in AutoCAD. In the recent work by Buffi et al. (2017), UAV-based photogrammetry was used as a new tool for surveyors to generate a complete 3D model of the Rideacoli Dam in Italy. The generated model was compared against conventional techniques such as total stations, TLS and Global Positioning System (GPS) to assess the overall geometry captured through 3D photogrammetric approach. The evaluation results showed an accuracy within 2 cm, but the surface resolution (point density) of the model was estimated to be an average of one point every 1 cm2 which may be inadequate for detailed visual inspection of smaller scale damages such as cracks.
1.2. Contributions of This Work
While UAV have previously been used to generate 3D reconstructions of dams, a multi-UAV approach has yet to be evaluated. Furthermore, the efficacy of such an approach for representing small scale inspection details has not been evaluated, rather only large volumetric analyses have been undertaken in prior works. To address these needs, this paper presents a case study on integrating multiple UAV platforms and 3D computer vision for the visual inspection of a large gravity dam in the United States. The results of this case study indicate how these technologies can be integrated and evaluated for suitability in inspection scenarios, and provide guidance to future efforts with regards to the imaging and flight operations specifications necessary to attain a desired level of 3D model quality.
In this study, a combination of multiple UAV platforms and photogrammetric approaches was used to create two comprehensive 3D point clouds of a dam and surrounding environment that were then assessed for their relative quality and ability to render artificially applied defects. The Brighton Dam, located in Brookeville, Maryland and managed by the Washington Suburban Sanitary Commission (WSSC), was selected as the subject of this study (Figure 1). The dam was put into service in 1944, and is representative of a large-scale gravity dam in-service across the United States.
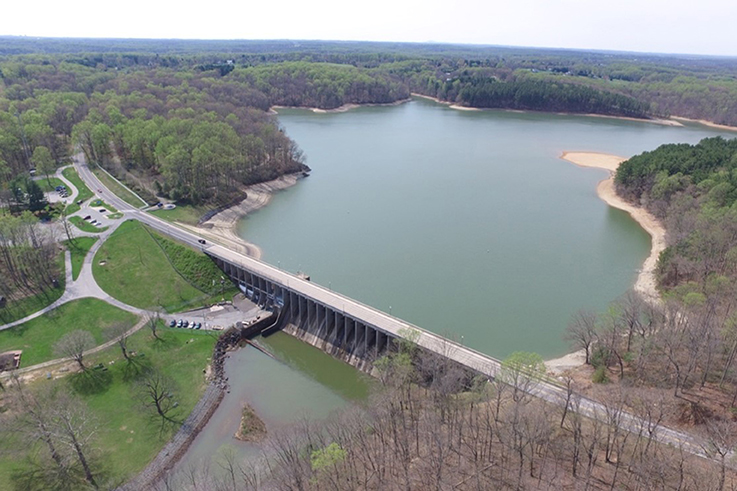
Figure 1. The Brighton dam.
The key technical contributions of this work include the development and assessment of a multi-UAV system for generating massive, dense, and comprehensive 3D point clouds (contain more than one billion points) of the targeted dam system, as well as an evaluation of the imaging specifications necessary to render small-scale inspection details. It is also the first time, to the authors' best knowledge, that a multi-scale photogrammetric 3D reconstruction technique has been used to capture the overall geometry of a large-scale complex gravity dam, capable of resolving fine structural flaws on the order of 1 mm using multiple UAV platforms for data acquisition.
The details of the data collection procedure are presented first, followed by reporting of the operations on two inspection mission days. This is followed by a presentation of the data processing and analysis methodologies. An evaluation of the results of the methodological approach for the Brighton Dam inspection is included as well. The paper concludes with a summation of the findings of the research team and avenues for future work in this domain.
2. Data Collection
2.1. Logistics and Planning
The goal of the field testing was to collect two comprehensive sets of digital images to be converted into 3D point clouds, using a combination of DSfM and rigid registration techniques. The point clouds needed to have the point density—analogous to resolution—necessary to resolve inspection details on the millimeter scale while comprehensively capturing the overall spatial context of the dam. To achieve this, image acquisition in terms of camera positioning, the number of captured images, adjacent image overlapping, and image quality were all carefully considered.
A variant of the DSfM process previously developed by the research team was chosen to generate 3D point clouds (Khaloo and Lattanzi, 2016; Khaloo et al., 2018). This process, referred to as Hierarchical Point Cloud Generation (HPCG), is designed to integrate images captured at a wide range of standoff distances from a structure into one complete model. From a data collection standpoint, images were collected in networks of similar standoff distances. The images from each network were then integrated and merged into a global, multi-scale point cloud model, as presented in the later sections of the paper.
Both fixed-wing and multi-rotor UAV platforms with mounted cameras were used to acquire image networks. The concept was to use the fixed wing UAV to capture the global geometry of both the upstream and downstream faces of the dam, and for the multi-rotor UAV to generate a series of oblique image networks from varying standoff distances. UAV flight planning that resulted in images with greater than 80% overlap between adjacent photos was desired to minimize the ground sample distance (GSD) and consequently maximize the spatial resolution. The minimum standoff distance from the dam was held to approximately 2.5 m. This corresponded to a pixel size of approximately 0.0024 (mm/pixel) and a GSD of 0.6 mm in the plane of the dam façade for the lowest resolution sensor used during the project.
These images networks were collected over the course of two distinct days, in order to simulate variances in field conditions between inspection intervals and provide a basis for temporal analysis between the subsequent models. Data collection on the first day was designed to comprehensively image the entire dam and environs using a combination of three different UAV. Data collection on the second day focused on an isolated section of the dam that was selected for the defect analysis portion of the study, as will be discussed later.
A custom-built fixed wing mounted with a Sony Alpha Series 5100 camera (24.3-megapixel) with a Sony E-PZ 16–50 mm lens was used to capture a series of nadir angle shots that covered the dam and the surrounding area. The utilized UAV's airframe was the Super Sky Surfer fixed wing expanded polyolefin (EPO) foam frame. It was modified in order to custom fit various components, such as the autopilot, GPS module, airspeed sensor, camera payload, motor and batteries. The communication between the UAV and ground control station (GCS) was done through radio telemetry.
Two DJI Inspire 1 aircrafts mounted with 12-megapixel (MP) cameras were used to separately capture oblique imagery of the downstream and upstream portions of the dam. On the second day of data collection, in addition to capturing the entire dam structure, the mission was to focus on a specific region of the dam, Bay #5 of the downstream facade with preinstalled targets, which required maneuvering a UAV in a confined space. For this task, a DJI Phantom 4 Pro with a 16-MP camera, a smaller quadcopter aircraft, was selected due to its better maneuverability and collision avoidance features relative to the other available aircraft.
The logistics of flying multiple UAV over the two mission days, along with the complexities of the dam environment, meant that proper planning was essential. After the UAV pilots confirmed the test site was not in a restricted airspace, and that safe operations were feasible, the team began to target dates for data collection.
The performance of UAV inspection imaging is primarily dependent on operating conditions that do not impede piloting of the UAV itself. In particular, cold weather was a key consideration when identifying mission dates. The team determined that the battery life of the selected UAV would not operate sufficiently in temperatures below 5 degrees Celsius. Rain, snow, and high winds were also weather phenomena that dictated the ability to operate the UAV safely. Secondary to selecting mission days with viable UAV operating conditions, radiometric conditions that optimized the consistency of UAV imagery were preferred. High contrast lighting, typically due to bright sun conditions, can create strong shadows that degrade the performance of the DSfM process (Remondino et al., 2014; Khaloo and Lattanzi, 2016). Having considerable changes in exposure, white balance and lighting can cause inaccuracies at both image matching and dense multi-view reconstruction stages (see section 3).
Recently, researchers (Gaiani et al., 2016) have developed methods to lessen the impact of radiometric factors through series of 2D image processing algorithms such as color enhancement, image denoising, and image content enrichment prior to initiating the 3D scene reconstruction. However, due to the relatively high quality of the acquired images, these pre-processing steps were not implemented in this study.
2.2. Day One Operation
Mission planner software was used to develop a flight plan for the fixed wing nadir imaging that would allow the aircraft and camera to operate autonomously. A lawnmower pattern for an area of 174,502 m2 (Figure 2) was selected, at an elevation of 75 m. A camera intervalometer frequency of 1.69 seconds/image was specified, resulting in 558 nadir images (Figure 3). Total flight time for the fixed wing UAV was 26 min.
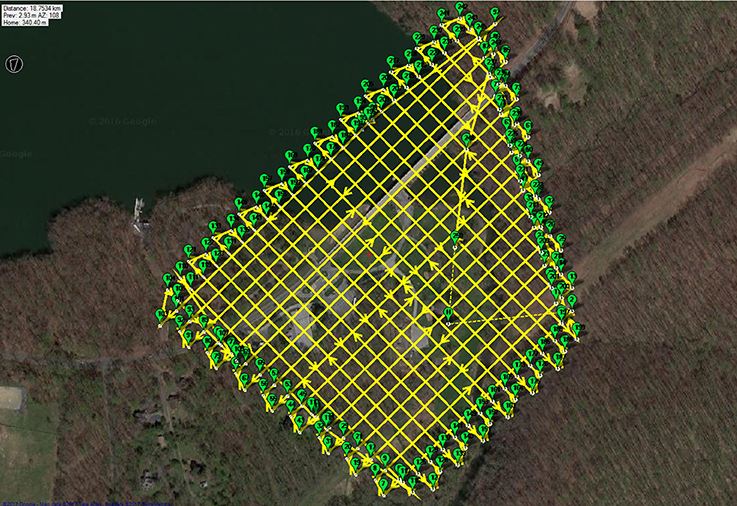
Figure 2. Flight path for fixed wing UAV.
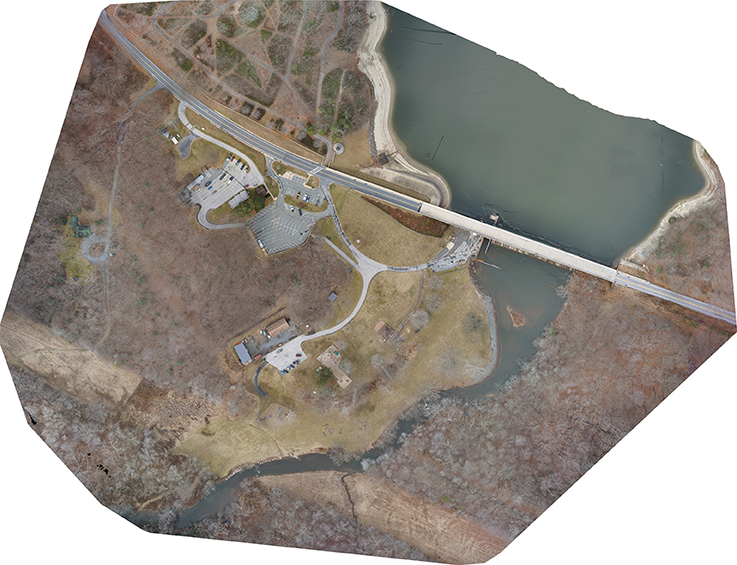
Figure 3. Orthomosaic generated using the fixed wing imagery dataset.
The two rotary UAV were piloted manually, with a second operator controlling the camera and gimbal in order to guarantee the specified 80% overlap between images and maintain standoff distances, specified to maximize the quality of the DSfM reconstructions (Figure 4).
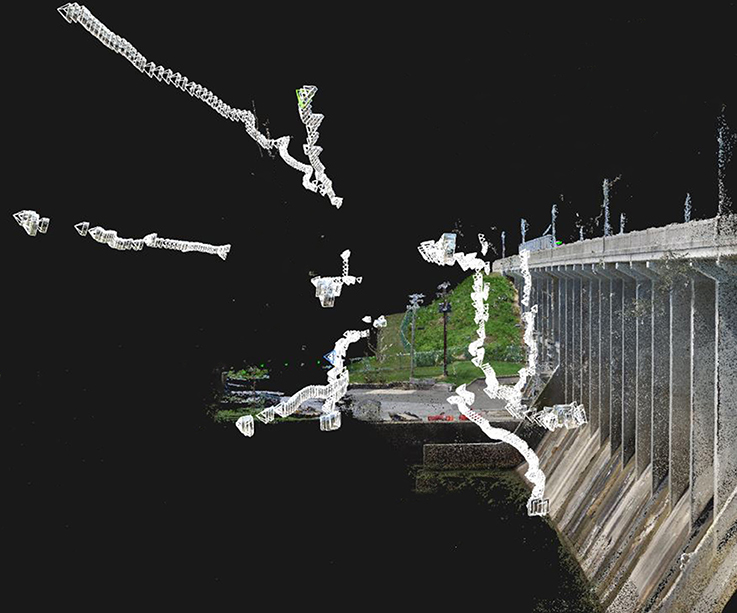
Figure 4. Camera poses using oblique imagery dataset captured by rotary UAVs (downstream face).
In total 2,020 images of the structure were captured using all three aircrafts.
2.3. Day Two Operation
The second day of operations also focused on Bay #5, on the downstream face of the dam. The goals of this day's operations were to generate a point cloud for comparisons with the point cloud generated through Day One operations, as well as to assess the quality of the UAV point cloud generation process for resolving small-scale structural defects.
Prior to UAV flight and imaging inside Bay #5, a series of controlled and simulated defects with known dimensions were applied to the dam structure, serving as a benchmark for reconstruction accuracy and analytical testing. Overall, three different types of defects were applied: linear markings with controlled thickness (Type 1), square surface area markings (Type 2), and spherical volumes (Type 3).
Type 1 defects were designed to simulate cracking and crack-like defects. Line thicknesses of 0.7 mm, 1 mm, and 3 mm widths were applied, with lines varying in length from 12.7 to 152.4 mm for each width. The sets of lines were applied using both black and white chalk on the sides of Bay #5 (Figures 5A,B). Type 2 defects were designed to simulate localized area defects such as concrete efflorescence, or staining due to corrosion. These defects took the form of a series of square chalk markings (Figure 5A) with dimensions varying from 645 to 1,6129 mm2. Type 3 defects simulated volumetric changes, such as concrete spall off. As physically removing portions of the dam structure was not permissible, volumes were instead temporarily added to the structure. Three Styrofoam hemispheres, with diameters of 127, 203.2, and 304.8 mm (Figures 5C,D) were painted and textured to have the visual appearance of concrete, and placed on the lateral brace of Bay #5.
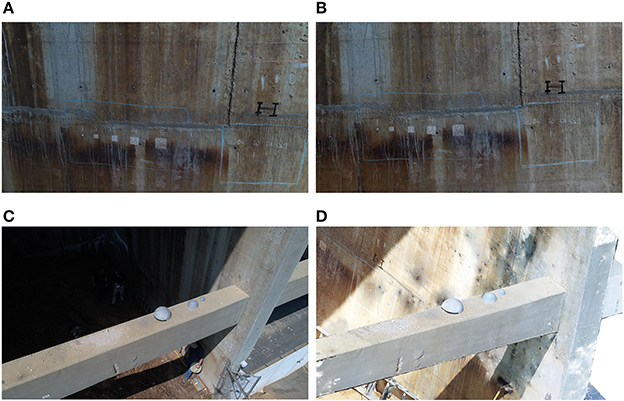
Figure 5. Controlled simulated damages: (A) 2D image of Type 1 and 2 defects; (B) 3D point cloud rendering of Type 1 and 2 defects; (C) 2D image of Type 3 volumetric defects; (D) 3D point cloud rendering of Type 3 volumetric defects.
2.4. Laser Scanning
For comparative purposes, a phase-shift based Faro Focus3D laser scanner was used to collect data from downstream face of the dam. The quality of the data collection was set to 6x in order to reduce the noise in the scan data and thus increases the scan quality. Due to placement limitations, it was not possible to capture the upstream face of the dam with the scanner. A total of 9 scans was collected and merged using the Faro SCENE software.
3. 3D Point Cloud Generation
From the available algorithms for image-based 3D reconstruction techniques, in this work a variant of the Structure-from-Motion (SfM) process was chosen. SfM is based on the simultaneous recovery of both the 3D geometry (structure) of a scene and the camera pose (motion) using a sparse set of correspondences between image features, and has been shown to produce results comparable to laser scanners (Seitz et al., 2006; Remondino et al., 2014).
Generally speaking, the first step in the SfM process is to automatically detect keypoint feature descriptors (pixel locations that are highly distinctive) such as the Scale Invariant Feature Transform (SIFT) (Lowe, 2004) in each input image. Next, feature descriptors are matched between pairs of images by finding a correspondence in the second image using a nearest neighbor similarity search (Muja and Lowe, 2014) to construct the relationship of feature points between image pairs, called tracks.
Because corresponding points in two images are subject to the epipolar constraints (describe by the fundamental matrix), filtering the matches by enforcing these constraints removes false correspondences (Hartley and Zisserman, 2003). By using the normalized eight-point algorithm (Hartley, 1997) in tandem with the RANSAC (RANdom SAmple Consensus) (Fischler and Bolles, 1981) paradigm, it is possible to minimize the number of wrong matches across images.
Next, an initial image pair with a large number of matched features and a long separation distance is selected and their camera parameters are estimated using the 5-point algorithm (Nistér, 2004), followed by triangulation of the matched features using the polynomial method (Hartley and Sturm, 1997). Subsequently, new images are added by using the correspondences between 3D points and image features through the Perspective n-Point (PnP) algorithm with RANSAC and Gauss-Newton optimization (Lepetit et al., 2009).
After the orientation of each image, bundle adjustment (a nonlinear least-squares problem) is performed to minimize the sum of re-projection errors using the Levenberg-Marquardt algorithm (Wu et al., 2011). In this process intrinsic camera parameters matrix, K, along with the pose of each particular camera described by rotation, R, and the position of its optical center, C, as well as the positions of the 3D points X are optimized simultaneously.
Where i ∈ j indicates that the point Xi is visible in image j, and xij denotes the projection of 3D points Xi onto image j. This procedure is repeated until an orientation is available for all images within each imaging network. The result of this pipeline is a relatively sparse set of 3D points, due to only utilizing extracted feature points in the 3D reconstruction. For this study, Agisoft PhotoScan software (Agisoft, 2014) was used to register images and generate sparse 3D point clouds.
In order to densify the reconstructed models and produce a model dense enough to capture small geometric changes, multi-view stereo algorithms (Seitz et al., 2006) are used to capture information from all pixels in the input 2D images. In this work, the Semi-Global Matching (SGM) algorithm (Hirschmüller, 2008) was used to perform pairwise dense matching, as it has been shown to provide a high level of point density relative to other methods utilized for densification (Remondino et al., 2014; Khaloo and Lattanzi, 2016). The SGM algorithm uses a pixel-wise matching cost for compensating radiometric differences of registered images within the depth map estimation. Later, individual depth maps are merged together through depth map fusion technique to generate a single, globally consistent 3D representation (Fuhrmann and Goesele, 2011). In this work, SURE (SUrface REconstruction from imagery) (Rothermel et al., 2012) software was used, which implements an adaptation of the SGM algorithm that reduces processing time with low memory consumption. This software is based on Libtsgm, which prepares a core functionality for image rectification, dense matching, image triangulation and a user interface for C/C++ programming.
The HPCG approach used in this study is designed for seamlessly matching and integrating images with different scales, viewpoints, and cameras into one single reconstruction (Khaloo and Lattanzi, 2016). The HPCG process begins by first generating 3D point clouds separately for each image network, using the aforementioned photogrammetric process. The point clouds generated for each network are then merged together into a single model using the Iterative Closest Point (ICP) algorithm (Besl and McKay, 1992). The ICP approach refines the alignment assuming an initial coarse registration of the 3D models is provided. This initial alignment can be performed through pair-wise matching of 10 manually selected point correspondences in order to reduce the inherent sensitivity of the ICP algorithm regarding the initial positions of the 3D models.
The rigid transformation between two sets of corresponding 3D point sets X = {x1, x2, …, xN} and Y = {y1, y2, …, yN} extracted through utilizing kd-trees (Friedman et al., 1977; Muja and Lowe, 2014), can be formulated as the solution of the least-squares problem:
Where rotation matrix R and translation vector t can be derived by arranging the point in two 3 × N matrices and Ȳ that have and ȳn as columns:
By computing the Singular Value Decomposition (SVD) of the 3 × 3 covariance matrix , , the optimal R and t are given by:
These rotations and translations are then used to align the individual point clouds for each network and form the complete global model. The result is a multi-scale/resolution 3D model that allows for higher resolution and emphasis in critical regions of structures. This approach also increases the rate of image registration during the SfM process, thereby improving model accuracy, resolution and completeness.
3.1. Brighton Dam Model Generation
For this process to work properly there must be a global point cloud that captures the overall geometry of the structure, and into which the other point clouds are merged through ICP. In this work, this geometry network was captured using the fixed wing UAV. The second key criterion is that the standoff distances between merged point clouds cannot vary excessively. This was accomplished by capturing images at varying standoff distances (range from 2.5 to 10 m).
4. Case Study Results
The images collected on Day One and processed using the HPCG technique yielded a point cloud of 1,469,690,005 points (Figure 6). The Day Two mission resulted in a model with 997,799,119 points.
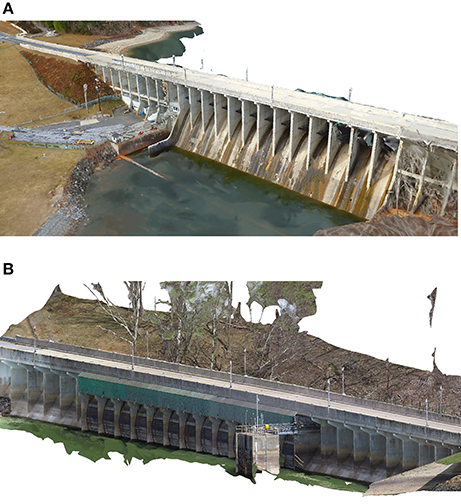
Figure 6. Generated 3D Point cloud of the Brighton Dam: (A) Downstream face; (B) Upstream face.
4.1. Point Cloud Quality Analysis
Four metrics were used to assess the generated point clouds: (i) local noise level, (ii) local point density, (iii) dimensionality descriptors, and (iv) ability to resolve the controlled synthetic defects applied on mission Day Two.
The noise level in a point cloud is defined as the residual between each point and the best fitting plane computed on its local k-sized nearest neighbours (k-NN). Digital image noise, radiometric parameters, nonconformity of the neighbourhood of a point, imperfect data registration, and DSfM reconstruction inaccuracies can all affect this characteristic.
This noise residual is defined as the lowest valued eigenvalue of the covariance matrix for a local neighborhood around a point in a cloud. For the k points that form the neighborhood of a 3D point pi in a point cloud, the 3 × 3 covariance matrix, C, is defined as (Hoppe et al., 1992):
where is the arithmetic mean within pi's neighborhood (Npi) and C represents a symmetric positive-definite matrix. By performing Singular Value Decomposition (SVD) on the covariance matrix, it is possible to compute the eigenvectors V (v2, v1 and v0) and their corresponding eigenvalues λ (λ2 ≥ λ1 ≥ λ0). Within this approach v0 approximates the point's pi normal, while λ0 quantitatively describes the variation along the normal vector to provide an estimation of the local noise level (i.e., roughness). In addition, the normalized surface variation or change of curvature (σ) can be defined as , which is invariant under rescaling (Pauly et al., 2002). For this study a value of k=30 nearest neighbour points was empirically specified for roughness calculations (Figure 7). Utilizing k-NN rather than the fixed distance neighbourhood (FDN) avoids the problem of point density variation within point clouds (Samet, 2006; Khaloo and Lattanzi, 2017).
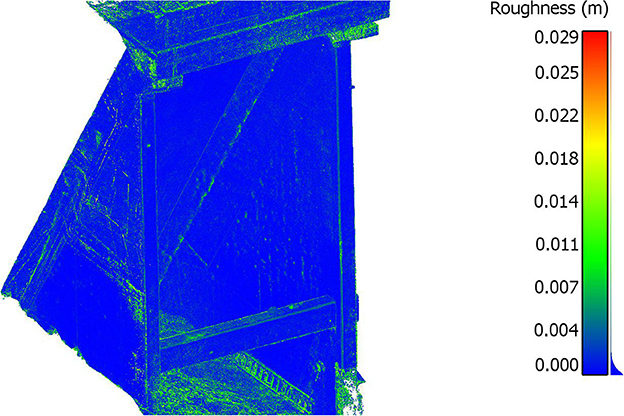
Figure 7. Estimated noise level (lowest eigenvalue λ0) for Bay#5; low to high noise level ranges from dark to light intensity.
Although surface variation (σ) can be used to estimate the change in curvature, as defined by Pauly et al. (2002), for local shape analysis other fundamental quantities defined in differential geometry such as local Gaussian, mean and principal curvature values were taken into account (Crosilla et al., 2009).
The second metric, local point density, is a characteristic analogous to pixel resolution in 2D digital images. It corresponds to the ability of a 3D point cloud to resolve structural defects and small-scale details. It also provides insight in the variations in point cloud quality that stem from the multi-UAV imaging approach. The local density ρ at a point pi is defined as , where rk−NN is the radius of the spherical neighbourhood of the k closest neighbours of a 3D point. In this study, rk−NN was set to 0.62 cm to achieve an enclosing volume of 1 cm3.
For a given 3D point pi and its k closest neighbourhood, the derived eigenvalues (λ2 ≥ λ1 ≥ λ0) using the described method can directly be exploited to estimate the order/disorder of 3D points within the local neighbourhood (Weinmann et al., 2014). In order to achieve this, a series of local features were defined to characterize the geometrical representation of pi and its k-NN as linear (1D), planar (2D), or volumetric (3D) features.
Dimensionality features represent by linearity Lλ, planarity Pλ, and scattering Sλ can be defined as:
Where e2, e1 and e0 are the normalized eigenvalues derived by dividing the three eigenvalues λ2, λ1 and λ0 by their sum Σλ. By choosing e2 as the denominator, the dimensionality features can be considered as the probabilities (since Lλ + Pλ + Sλ = 1) of each point to be labelled as 1D, 2D, or 3D (Weinmann et al., 2014). These features can be used as metrics to evaluate the quality of the point clouds in reconstructing geometrically accurate models. Figure 8 illustrates a representation of the aforementioned dimensionality features for Bay#5. Since this part of the dam consists of planar surfaces, it was expected to have higher values of Pλ in comparison with other dimensional features, indicating with a high probability that the majority of the points can be labeled as 2D features (Figure 8). Furthermore, the sum of the eigenvalues Σλ can represent the total amount of variation in all three directions, an additional evaluation of the level of noise in the 3D point clouds (Weinmann et al., 2014).
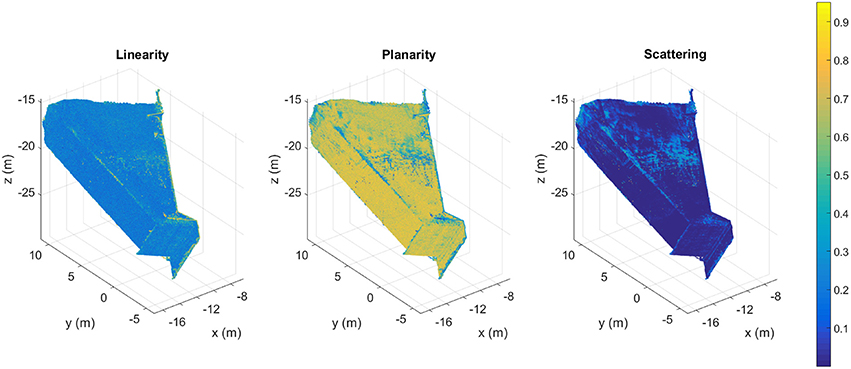
Figure 8. Illustration of the three dimensionality features for Bay#5. Color bar represents the normalized value of each descriptor.
The last evaluative metric was to measure the defects applied to Bay #5 during the second mission day, in the resulting 3D point cloud. Both Type 1 and 2 simulated damages were manually measured from the point cloud models and the results was compared against the field measurements. In order to lessen the error, the Euclidean distance measurement for each pairwise point selection was repeated 10 times and the average values were compared against the ground-truth values measured in the field.
Volumetric defects (Type 3) were measured by using the direct cloud-to-cloud (C2C) distance estimation technique (Girardeau-Montaut et al., 2005) to track and quantify geometrical changes in the already registered 3D point clouds. Upon finding the closest point correspondences in the two registered clouds, the Hausdorff distance (Huttenlocher et al., 1993) was utilized to find the distance between points in the first dataset and their closest points in the second dataset. Given two finite point sets P = {p1, p2, …, pn} and Q = {q1, q2, …, qm}, the two-sided Hausdorff distance H(P, Q) is defined as:
Note that this notation of distance is purely geometric and does not make any assumptions on the uniformity of the point cloud density. By using the Hausdorff distance method, it was possible to automatically estimate the radius of the hemispheres used in experimental testing, which was then used to estimate their volumes. This measurement process was not intended to serve as a general-purpose volumetric analysis technique.
4.2. Point Cloud Analysis Results
The results of the point cloud quality analysis are shown in Table 1. Model density from the January UAV flights was substantially higher than those generated through TLS or during the April flights. The differences between the two HPCG models is likely due to the change in sensor resolution between mission days and changes in the flight protocols, as the April flights focused on Bay #5. Average roughness and curvature values for the three models are all of a similar order of magnitude, indicating relatively similar 3D geometric accuracy. As can be seen, the point cloud generated by the laser scanner consists of significantly fewer points than the models generated through HPCG. This was due to the limited options for scanner placement, particularly with respect to the higher elevation regions of the dam facade and the upstream facade. Point cloud quality analysis for the Bay #5 region of the dam are shown in Figure 9 and Table 2.
Table 1. Point cloud quality analysis.
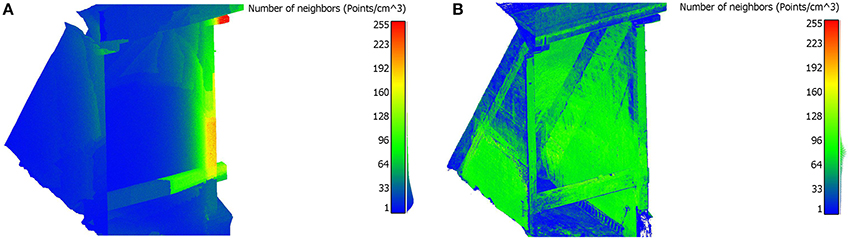
Figure 9. Local point density for Bay#5; low to high density ranges from dark to light intensity: (A) Day One dataset; (B) Day Two dataset.
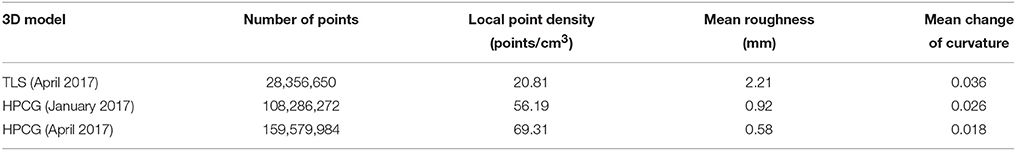
Table 2. Point cloud quality analysis for Bay #5.
These results highlight the advantages of using a UAV for point cloud generation. Both HPCG models had over twice the density and mean roughness values less than half those of the laser scanner. These performance improvements can be attributed to the ability of the UAV to capture high-resolution images at the higher elevations of the bay, whereas the laser scanner could only scan those areas from the ground. Compared to the overall point cloud models, the results for the HPCG models are more similar for Bay #5.
Table 3 presents the analysis of the local dimensionality features in the Bay#5 region of the model. These results indicate that, by utilizing the multi-scale HPCG approach in tandem with smaller quadcopter to capture image data from inside of the targeted part of the dam, it was possible to reconstruct the planar surfaces with a higher accuracy (higher planarity mean value). The Generalized Extreme Value (GEV) probability density function (PDF) was determined to be the most accurate representation of the dimensionality features distribution characteristics and the presented mean values are based on the estimated GEV parameters.
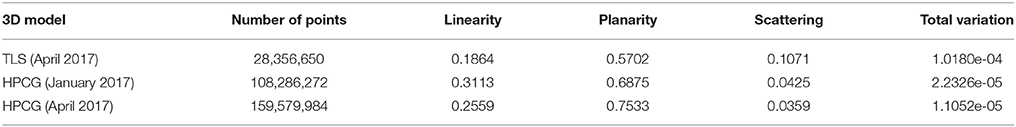
Table 3. Point cloud quality analysis for Bay #5 using mean values of dimensionality features.
In addition, similar to both mean roughness and change of curvature values, the total variation metric also illustrates a lower noise level in the image-based model generated using the data from April 2017.
In order to assess how image resolution affected model quality, the images captured via UAV during the April mission were downsampled to 50, 25, and 12.5% of the original image size using the bicubic image interpolation. The downsampled images were then used to regenerate point clouds of Bay #5. The resulting model assessments are shown in Table 4.
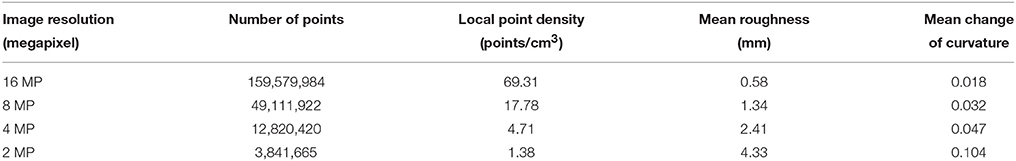
Table 4. Bay #5 3D point cloud generation using various image resolutions.
With a loss of image resolution, the density of the models was reduced, as expected. This reduction did not scale linearly with the number of pixels, but quadratically. Notably, the average cloud roughness increased with a reduction in image resolution, as can be seen in the images disparity maps (Figure 10). This suggests that the reduced number of feature points used for SfM reconstruction along with excessive noise within the depth map estimation and fusion (Figure 10) affected the accuracy and quality of the resulting dense 3D point clouds.
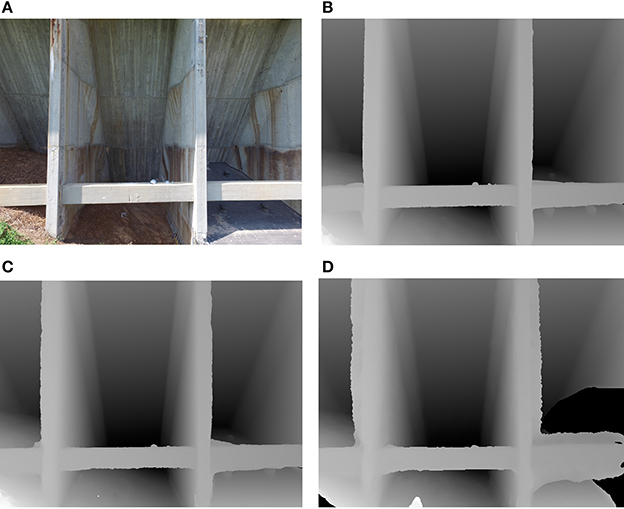
Figure 10. (A) Original input image; (B) depth map reconstructed for the 16 MP image; (C) depth map reconstructed for the 8 MP image; (D) depth map reconstructed for the 2 MP image. Each depth value encodes the distance from the camera center to the geometry.
Figure 11 illustrates the changes in curvature values (σ) for models generated using different images resolutions. By using lower resolution images, the surface variation became more evenly distributed in the generated 3D models, which indicates higher local noise level. For instance, the curvature values for the model based on the full resolution (16 MP) images were more skewed toward lower values; in contrast, the model based on the downsampled (2 MP) images had a relatively even distribution across curvature values, consequently resulting in a higher mean value (Table 4).
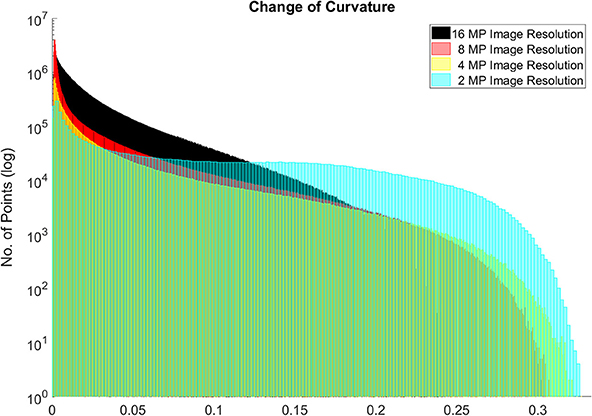
Figure 11. Comparison of curvature values in models generated using different image resolutions.
To further compare the quality of the generated 3D models, the dimensionality features were again utilized (Table 5). A decrease in image resolution corresponded to a reduction in planarity values, which suggests reduced geometric accuracy. The increase in the total variation also illustrated the excessive noise levels in the models generated using lower resolution images. It is notable that there was a correlation between the local noise level indicators (such as total variation and roughness) and the scattering (Sλ) dimensionality feature. Scattering can be used to label the points located on higher order surface such as edges, where an increase in local noise levels are most likely to occur (see Figures 7, 8). The previous analysis reported in Table 3 also indicated the same relation between these metrics.
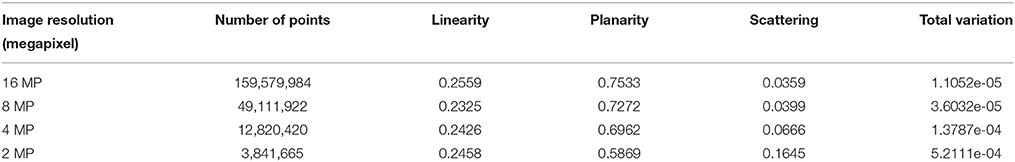
Table 5. Bay #5 model analysis using mean values of dimensionality features.
Figure 12 shows the planarity (Pλ) feature for the generated models based on different image resolutions. Using lower resolution images resulted in a lack of accuracy in generating the relatively planer surfaces in Bay#5.
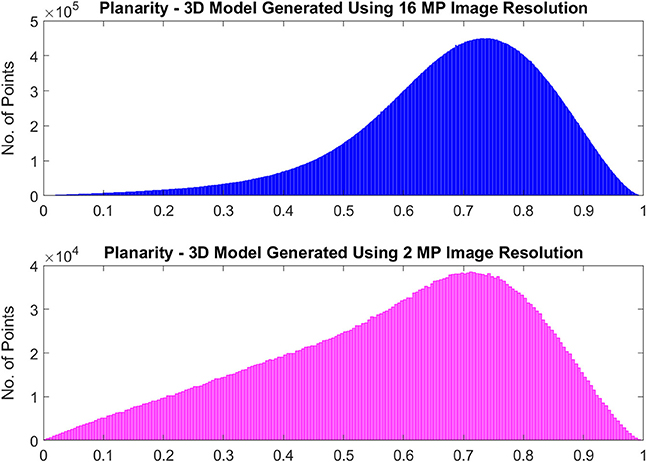
Figure 12. Comparison of planarity values in models generated using different image resolutions.
4.3. Evaluation of Flaw Resolving Capabilities
Tables 6, 7 summarize the comparisons between the ground-truth dimensions of the Type 1 defects and the dimensions measured in the point cloud. For the 1 and 3 mm defect widths, the point clouds generated using 16 MP images were able to resolve all of the flaws to a degree that highly accurate measurements were possible. However, as image resolution decreased, measurement accuracy decreased. For models using 4 MP or less in resolution, most flaws were not resolved at all in the models and so measurements were not possible. None of the models were able to reconstruct the 0.7 mm flaws.
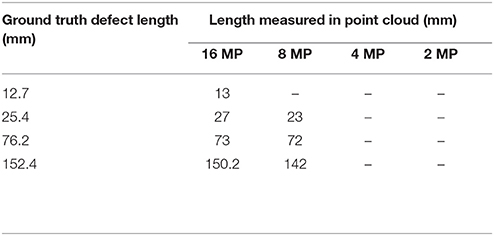
Table 6. Measurement accuracy of 1 mm width type 1 defects at various image resolutions.
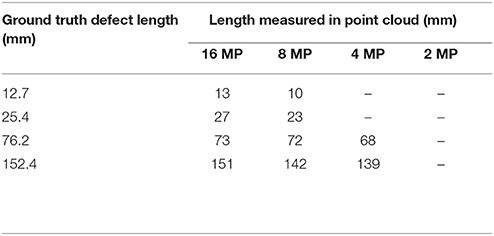
Table 7. Measurement accuracy of 3 mm width type 1 defects at various image resolutions.
These results suggest that a point density somewhere between 18 points/m3 and 69 points/m3 was necessary to guarantee the reconstruction of Type 1 flaws in the model. During these tests, the standoff distance from the UAV to the defects was held at approximated 2.5 m. Given the 16 MP image resolution and the sensor dimensions of the DJI Phantom 4 camera, each pixel in the images corresponded to approximately 1 mm in the plane of the defects.
The measurements for Type 2 defects are shown in Table 8. For these defects, the models derived from either the 16 MP (69 points/m3) or the 8 MP (18 points/m3) images were able to accurately resolve the flaws. However the 4 MP and 2 MP image models were not able to consistently resolve defects. This corresponds to a minimum pixel size of 1.5 mm in the plane of the defect.
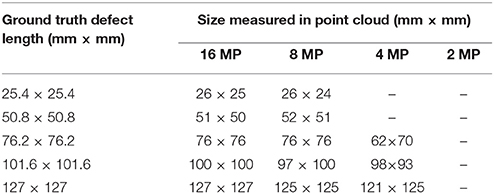
Table 8. Measurement accuracy of type 2 defects at various image resolutions.
The measurement results for the Type 3 volumetric defects are shown in Figure 13 and Table 9. For this test, all levels of image resolution were able to generate models that captured all three volumetric changes. However, the reduction in image resolution resulted in systematic under prediction of volume measurements.
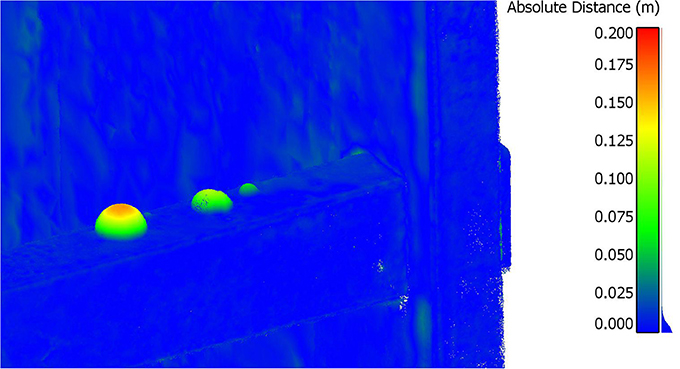
Figure 13. Volumetric 3D change analysis.
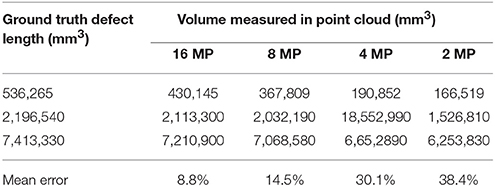
Table 9. Measurement accuracy of Type 3 volumetric defects at various image resolutions.
4.4. Limitations and Sources of Error
The process used to generate the point clouds has two key potential sources of error. The first is the possibility of misalignment of cameras at the image matching stage. The second is possible misalignment of individual networks models during ICP registration. The quality and comprehensiveness of the point clouds was also impacted by the inability of the UAV to access certain regions of the structure. Specifically, certain interior regions and underwater sections of the dam were not imaged, and thus not included in the point cloud. It is recognized that both of these areas would be critical for any inspection and assessment, and other methods of 3D imaging, such as handheld photogrammetry or laser scanning could be used in these circumstances. Furthermore, photogrammetric reconstruction techniques are sensitive to severe changes in lighting and occlusions. In this case study, UAV flight operations were restricted to minimize this effect, and further study on the impact of radiometric changes on model quality are warranted. Lastly, it is worth noting that the large number of points generated through this process (numbered in the billions) inhibited rendering and visualization. Out-of-core memory processes that decouple rendering efforts from the scale of the data in order to overcome memory limitations, are recommended to allow higher rendering frame rates and higher rendering quality during user interactions.
5. Conclusions
This study highlights the potential of using a combination of UAV and photogrammetry for the inspection and assessment of dam infrastructure. Ultimately, the goal was to generate models with sufficient density and quality to resolve a variety of critical inspection details at the millimeter scale. The mission protocols specified to achieve this were flight path planning that guaranteed sufficient image overlap at multiple standoff distances, as well as a minimum standoff distance that corresponded to a pixel size of 1 mm, to guarantee reconstruction of defects at that scale. The assessment of the resulting models indicates that these specifications resulted in point clouds capable of rendering millimeter scale details, while lower density models generated with larger pixel sizes were often unable to resolve the artificial defects.
Future work seeks to study how to merge other sources of 3D point clouds, such as laser scanning and hand-held photogrammetry, with the model generated via UAV. Furthermore, using AUV as a platform to collect imagery dataset from underwater sections of the dam can certainly improve the overall completeness of the generated 3D model and has the potential for future investigation. Additionally, the process should be validated for a variety of infrastructure material types, and under varying radiometric conditions, to assess the reliability and consistency of the presented UAV inspection approach.
Author Contributions
AK, DL, AJ, and CD conceived and designed the experiments. AK developed the algorithms, performed the experiments, and analyzed the data. All authors reviewed and accepted the final version.
Funding
This material is based upon the work supported by the National Science Foundation (NSF) under Grant No. CMMI-1433765. Any opinions, findings, and conclusions, or recommendations expressed in this publication are those of the authors and do not necessarily reflect the views of the NSF.
Conflict of Interest Statement
The authors declare that the research was conducted in the absence of any commercial or financial relationships that could be construed as a potential conflict of interest.
References
ASCE (2017). 2017 Infrastructure Report Card. Technical report, American Society of Civil Engineers, Reston, VA.
Berberan, A., Ferreira, I., Portela, E., Oliveira, S., Oliveira, A., and Baptista, B. (2011). “Overview on terrestrial laser scanning as a tool for dam surveillance,” in 6th International Dam Engineering Conference, (Lisboa: LNEC).
Besl, P. J., and McKay, N. D. (1992). “Method for registration of 3-d shapes,” in Robotics-DL Tentative, ed P. S. Schenkar (Boston MA: International Society for Optics and Photonics), 586–606.
Buffi, G., Manciola, P., Grassi, S., Barberini, M., and Gambi, A. (2017). Survey of the ridracoli dam: Uav–based photogrammetry and traditional topographic techniques in the inspection of vertical structures. Geomat. Nat. Hazards Risk 8, 1562–1579. doi: 10.1080/19475705.2017.1362039
Christensen, C. (1997). The Innovator's Dilemma: When New Technologies Cause Great Firms to Fail. Boston, MA: Harvard Business Review Press.
Colombo, M., and Comi, C. (2016). “Damage analyses of concrete dams subject to alkali-silica reaction,” in Conference on Italian Concrete Days, (Rome: Springer), 481–495.
Crosilla, F., Visintini, D., and Sepic, F. (2009). Reliable automatic classification and segmentation of laser point clouds by statistical analysis of surface curvature values. Appl. Geomat. 1, 17–30. doi: 10.1007/s12518-009-0002-4
D'Altri, A. M., Milani, G., de Miranda, S., Castellazzi, G., and Sarhosis, V. (2018). Stability analysis of leaning historic masonry structures. Automat. Construct. 92, 199–213. doi: 10.1016/j.autcon.2018.04.003
Fathi, H., Dai, F., and Lourakis, M. (2015). Automated as-built 3d reconstruction of civil infrastructure using computer vision: achievements, opportunities, and challenges. Adv. Eng. Inform. 29, 149–161. doi: 10.1016/j.aei.2015.01.012
Fischler, M. A., and Bolles, R. C. (1981). Random sample consensus: a paradigm for model fitting with applications to image analysis and automated cartography. Commun. ACM 24, 381–395. doi: 10.1145/358669.358692
Friedman, J. H., Bentley, J. L., and Finkel, R. A. (1977). An algorithm for finding best matches in logarithmic expected time. ACM Trans. Math. Softw. 3, 209–226. doi: 10.1145/355744.355745
Fuhrmann, S., and Goesele, M. (2011). Fusion of depth maps with multiple scales. ACM Trans. Graph. 30, 148. doi: 10.1145/2070781.2024182
Gaiani, M., Remondino, F., Apollonio, F. I., and Ballabeni, A. (2016). An advanced pre-processing pipeline to improve automated photogrammetric reconstructions of architectural scenes. Remote Sens. 8:178. doi: 10.3390/rs8030178
Ghahremani, K., Khaloo, A., and Lattanzi, D. (2016). “Automated 3d image-based section loss detection for finite element model updating,” in 33rd International Symposium on Automation and Robotics in Construction, (Auburn, AL).
Girardeau-Montaut, D., Roux, M., Marc, R., and Thibault, G. (2005). “Change detection on points cloud data acquired with a ground laser scanner,” in ISPRS WG III/3, III/4, V/3 Workshop Laser Scanning 2005 (Enschede), 1–6.
González-Aguilera, D., Gómez-Lahoz, J., and Sánchez, J. (2008). A new approach for structural monitoring of large dams with a three-dimensional laser scanner. Sensors 8, 5866–5883. doi: 10.3390/s8095866
González-Jorge, H., Puente, I., Roca, D., Martínez-Sánchez, J., Conde, B., and Arias, P. (2014). Uav photogrammetry application to the monitoring of rubble mound breakwaters. J. Perform. Construct. Facilit. 30, 04014194. doi: 10.1061/(ASCE)CF.1943-5509.0000702
Hallermann, N., Morgenthal, G., and Rodehorst, V. (2015). “Unmanned aerial systems (uas)–case studies of vision based monitoring of ageing structures,” in Proceedings of the International Symposium Non-Destructive Testing In Civil Engineering, (Berlin), 15–17.
Hartley, R., and Zisserman, A. (2003). Multiple View Geometry in Computer Vision. Cambridge, UK: Cambridge University Press.
Hartley, R. I. (1997). In defense of the eight-point algorithm. IEEE Trans. Pattern Anal. Mach. Intell. 19, 580–593. doi: 10.1109/34.601246
Hartley, R. I., and Sturm, P. (1997). Triangulation. Comput. Vis. Image Understand. 68, 146–157. doi: 10.1006/cviu.1997.0547
Henriques, M. J., and Roque, D. (2015). “Unmanned aerial vehicles (uav) as a support to visual inspections of concrete dams” in Second International Dam World Conference (Lisbon: Laboratorio Nacional De Engenharia Civil).
Hirschmüller, H. (2008). Stereo processing by semiglobal matching and mutual information. IEEE Trans. Pattern Anal. Mach. Intel. 30, 328–341. doi: 10.1109/TPAMI.2007.1166
Hoppe, H., DeRose, T., Duchamp, T., McDonald, J., and Stuetzle, W. (1992). Surface Reconstruction from Unorganized Points, New York, NY: ACM.
Huttenlocher, D. P., Klanderman, G. A., and Rucklidge, W. J. (1993). Comparing images using the hausdorff distance. IEEE Trans. Pattern Anal. Mach. Intel. 15, 850–863. doi: 10.1109/34.232073
Jafari, B., Khaloo, A., and Lattanzi, D. (2017). Deformation tracking in 3d point clouds via statistical sampling of direct cloud-to-cloud distances. J. Nondestruct. Eval. 36, 65. doi: 10.1007/s10921-017-0444-2
Khaloo, A., and Lattanzi, D. (2016). Hierarchical dense structure-from-motion reconstructions for infrastructure condition assessment. J. Comput. Civil Eng. 31:04016047. doi: 10.1061/(ASCE)CP.1943-5487.0000616
Khaloo, A., and Lattanzi, D. (2017). Robust normal estimation and region growing segmentation of infrastructure 3d point cloud models. Adv. Eng. Inform. 34, 1–16. doi: 10.1016/j.aei.2017.07.002
Khaloo, A., Lattanzi, D., Cunningham, K., Dell'Andrea, R., and Riley, M. (2018). Unmanned aerial vehicle inspection of the placer river trail bridge through image-based 3d modelling. Struct. Infrastruct. Eng. 14, 124–136. doi: 10.1080/15732479.2017.1330891
Lepetit, V., Moreno-Noguer, F., and Fua, P. (2009). Epnp: An accurate o (n) solution to the pnp problem. Int. J. Comput. Vis. 81, 155–166.
Lowe, D. G. (2004). Distinctive image features from scale-invariant keypoints. Int. J. Comput. Vis. 60, 91–110. doi: 10.1023/B:VISI.0000029664.99615.94
Malhotra, V. M., and Carino, N. J. (2003). Handbook on Nondestructive Testing of Concrete Second Edition. Boca Raton, FL: CRC Press.
Maryland Department of Environment (1996). Maryland Dam Safety Manual. Maryland Department of Environment, Baltimore, MD.
Ming-Der, Y., Huang, K.-S., and Hui-Ping, T. (2016). Monitoring and measurement of an artificial landslide dam using uav images and image-based modeling (mcsse). DEStech Trans. Comput. Sci. Eng. 357–362. doi: 10.12783/dtcse/mcsse2016/10996
Muja, M., and Lowe, D. G. (2014). Scalable nearest neighbor algorithms for high dimensional data. IEEE Trans. Pattern Anal. Mach. Intel. 36, 2227–2240. doi: 10.1109/TPAMI.2014.2321376
Nistér, D. (2004). An efficient solution to the five-point relative pose problem. IEEE Trans. Pattern Anal. Mach. Intel. 26, 756–770. doi: 10.1109/TPAMI.2004.17
Oliveira, A., Oliveira, J. F., Pereira, J. M., De Araújo, B. R., and Boavida, J. (2014). 3d modelling of laser scanned and photogrammetric data for digital documentation: the mosteiro da batalha case study. J. Real-time Image Process. 9, 673–688. doi: 10.1007/s11554-012-0242-0
Olson, L. D., and Sack, D. A. (1995). “Nondestructive evaluation of concrete dams and other structures,” in Nondestructive Evaluation of Aging Structures and Dams, eds S. Nazarian and L. D. Olson (Oakland, CA: International Society for Optics and Photonics), 113–125.
Pauly, M., Gross, M., and Kobbelt, L. P. (2002). “Efficient simplification of point-sampled surfaces,” in Proceedings of the Conference on Visualization'02, (IEEE Computer Society), 163–170.
Remondino, F., Spera, M. G., Nocerino, E., Menna, F., and Nex, F. (2014). State of the art in high density image matching. Photogram. Record 29, 144–166. doi: 10.1111/phor.12063
Ridao, P., Carreras, M., Ribas, D., and Garcia, R. (2010). Visual inspection of hydroelectric dams using an autonomous underwater vehicle. J. Field Robot. 27, 759–778. doi: 10.1002/rob.20351
Ridolfi, E., Buffi, G., Venturi, S., and Manciola, P. (2017). Accuracy analysis of a dam model from drone surveys. Sensors 17:1777. doi: 10.3390/s17081777
Rivard, P., Ballivy, G., Gravel, C., and Saint-Pierre, F. (2010). Monitoring of an hydraulic structure affected by asr: a case study. Cement Concrete Res. 40, 676–680. doi: 10.1016/j.cemconres.2009.09.010
Rothermel, M., Wenzel, K., Fritsch, D., and Haala, N. (2012). “Sure: Photogrammetric surface reconstruction from imagery,” in Proceedings LC3D Workshop (Berlin).
Sack, D. A., and Olson, L. D. (1995). Advanced ndt methods for evaluating concrete bridges and other structures. NDT e Int. 28, 349–357. doi: 10.1016/0963-8695(95)00045-3
Samet, H. (2006). Foundations of Multidimensional and Metric Data Structures. San Francisco, CA: Morgan Kaufmann.
Seitz, S. M., Curless, B., Diebel, J., Scharstein, D., and Szeliski, R. (2006). “A comparison and evaluation of multi-view stereo reconstruction algorithms,” in Computer Vision and Pattern Recognition, 2006 IEEE Computer Society Conference on, (New York, NY: IEEE).
Turner, D., Lucieer, A., and Watson, C. (2012). An automated technique for generating georectified mosaics from ultra-high resolution unmanned aerial vehicle (uav) imagery, based on structure from motion (sfm) point clouds. Remote Sens. 4, 1392–1410. doi: 10.3390/rs4051392
U.S. Dept. Of Homeland Security, Federal Emergency Management Agency. (2004). Federal Guidelines for Dam Safety. Federal Emergency Management Agency, Washington, DC.
Weinmann, M., Jutzi, B., and Mallet, C. (2014). Semantic 3d scene interpretation: a framework combining optimal neighborhood size selection with relevant features. ISPRS Ann. Photogram. Remote Sens. Spatial Inf. Sci. 2, 181. doi: 10.5194/isprsannals-II-3-181-2014
Wu, C., Agarwal, S., Curless, B., and Seitz, S. M. (2011). “Multicore bundle adjustment,” in Computer Vision and Pattern Recognition (CVPR), 2011 IEEE Conference on, (Providence, RI: IEEE).
Keywords: infrastructure inspection, computer vision, structure from motion, dam inspection, 3D scene reconstruction, aerial robots, structural health monitoring, unmanned aerial vehicles
Citation: Khaloo A, Lattanzi D, Jachimowicz A and Devaney C (2018) Utilizing UAV and 3D Computer Vision for Visual Inspection of a Large Gravity Dam. Front. Built Environ. 4:31. doi: 10.3389/fbuil.2018.00031
Received: 18 April 2018; Accepted: 12 June 2018;
Published: 02 July 2018.
Edited by:
Dryver R. Huston, University of Vermont, United StatesReviewed by:
Vasilis Sarhosis, Newcastle University, United KingdomMartina Colombo, Politecnico di Milano, Italy
Copyright © 2018 Khaloo, Lattanzi, Jachimowicz and Devaney. This is an open-access article distributed under the terms of the Creative Commons Attribution License (CC BY). The use, distribution or reproduction in other forums is permitted, provided the original author(s) and the copyright owner(s) are credited and that the original publication in this journal is cited, in accordance with accepted academic practice. No use, distribution or reproduction is permitted which does not comply with these terms.
*Correspondence: David Lattanzi, dlattanz@gmu.edu