Risk-Oriented, Bottom-Up Modeling of Building Portfolios With Faceted Taxonomies
 Massimiliano Pittore
 Michael Haas
 Konstantinos G. Megalooikonomou
- German Research Centre for Geosciences, Potsdam, Germany
Earthquake exposure describes the assets that are exposed to seismic activity and are susceptible to be damaged. In seismic risk applications, it mostly refers to the residential and commercial building portfolios, although in general may also include transport infrastructure and lifelines. Providing an efficient description of a complex urban environment in terms of the structural characteristics of buildings related to their seismic vulnerability is challenging, considering the variety of building practices, materials and configurations. A common approach entails the use of pre-defined building typologies, but this may introduce a bias in the resulting models. Faceted taxonomies have been recently introduced to provide a standardized description of buildings using a rich set of basic attributes, but cannot be used directly for risk-related applications. We argue that a bottom-up approach to exposure modeling might prove instrumental in increasing the quality and reliability of risk assessment, and propose hereby a novel score-based methodology to define and assign building classes to unclassified buildings in a sound and transparent way. The approach can be adopted for standard building classifications as well as for original typologies that may be more efficient in capturing the specific features of the building stock. The proposed methodology efficiently decouples the collection of buildings observations, typical of surveying activities, from the assignment of risk-aimed building classes, and provides a useful tool to practitioners and engineers involved in large-scale earthquake risk assessment. The proposed methodology has been exemplified with a building portfolio collected in France near the geothermal plant of Soultz-sous-Fôrets, and is used to rapidly characterize the seismic exposure of a built environment for induced seismicity applications.
1. Introduction
In seismic risk applications the exposure component provides information on the assets that are exposed to seismic activity and are susceptible to be damaged (Algermissen, 1989; Coburn et al., 1994; Pittore et al., 2017). It often mainly refers to the residential and commercial building stock, although it may also include industrial facilities, transport infrastructure and lifelines. Unfortunately, providing a reliable description of a complex urban environment in terms of the structural characteristics of buildings related to their seismic vulnerability is challenging, due to the variety of building practices, materials and configurations (Pittore et al., 2017).
For large-scale assessments, in order to unequivocally assigning a fragility and/or vulnerability model to individual buildings, specific risk-oriented taxonomies are usually employed. As an example, the global exposure model proposed within the 2013 Global Assessment Report (GAR) employed the PAGER-STR taxonomy (Jaiswal et al., 2010) to encode building types (De Bono and Mora, 2014). Also the HAZUS taxonomy (Kircher et al., 2006), originally developed to describe the building stock in USA, has been extensively employed to model building inventories in America (see e.g., Aguirre et al., 2018). In Europe, the European Macroseismic Scale (Grünthal, 1998) has been used in several countries for risk assessment purposes (see e.g., Tyagunov et al., 2004; Lagomarsino and Giovinazzi, 2006; Schwarz et al., 2006; Bernardini et al., 2010). The same taxonomy has been also used outside its original scope in areas where macroseismic data have been widely available, as for instance in Turkey (Abrahamczyk et al., 2013) and in several Central Asian Countries (Bindi et al., 2011; Pilz et al., 2013; Pittore and Wieland, 2013; Pittore et al., 2014).
The application of risk-oriented taxonomies has been exemplified in the development of exposure models based either on the combination of authoritative data (e.g., census) and expert judgment (Tyagunov et al., 2004), or on the collection of data in the field (Abrahamczyk et al., 2013). In the latter case, each inspected building is assigned one out of a pre-defined set of building classes according to the subjective judgment of the surveyor. This is a straightforward process, but also implies that the labeled buildings will mostly comply with the underlying assumptions of the classes the taxonomy labels refer to. Furthermore, these taxonomies may have a limited geographical scope and thus may not be easily applied to other regions (Jaiswal et al., 2010). This induces therefore an epistemic uncertainties into the subsequent vulnerability modeling, which both is difficult to quantify and to communicate to end-users and stakeholders.
More recently faceted taxonomies have been proposed (Brzev et al., 2013), as a solution to obtain flexible descriptions of diverse building typologies at wide geographical scales. The GEM taxonomy for instance has been successfully applied to describe typical building typologies in exposure models based on authoritative data (e.g., Yepes-Estrada et al., 2017). Although these taxonomies possess the necessary attributes to clearly describe individual buildings' features related to seismic vulnerability, in large-scale applications they cannot be used in the same way as the risk-oriented ones, thus creating a clear gap between the data collection and the risk assessment phases. In other words the data collected using faceted taxonomies cannot be directly employed to generate risk-oriented exposure models.
To address this issue, we propose a novel methodology which applies to observations collected with a faceted taxonomy and employs an attribute-based scoring approach to define and assign risk-oriented building typologies in a sound and transparent way, explicitly accounting for uncertainties in the underlying data. The approach can be adopted both for standard (or de facto standard) building classifications as well as for customized typologies. Following this approach the collection of buildings observations during survey activities is clearly decoupled from the assignment of risk-oriented building classes, thus providing a useful tool to practitioners and engineers involved in large-scale earthquake risk assessment.
In the first section we will briefly review the two different types of taxonomies used in risk assessment applications. In the second section, an exposure modeling approach based on the bottom-up processing of survey datasets is presented, followed by a more detailed description of the proposed score-based classification methodology. The third section describes an exemplification of the proposed methodology for a buildings dataset collected in the region surrounding the town of Soultz-sous-Forêts in Alsace, France, where a geothermal power plant is located. This region has been selected as test site within the EC-funded research project DESTRESS, where the possible risk arising from induced seismicity is investigated. A conclusions and outlook sections conclude the paper.
2. Risk-Oriented and Faceted Taxonomies
Most structural engineers would agree on the fact that each built structure, intended as a compound of geometric and structural characteristics and the resulting static and dynamic behavior, is unique, and as such should be addressed individually. This is certainly advisable for lifeline facilities such as hospitals, complex high rise buildings or critical infrastructures such as industrial buildings. However, this entails a significant effort in terms of data collection and analysis, which makes it not feasible in wide-scale risk-assessment applications dealing with hundreds of thousands of buildings. In most risk analysis applications small sets of typological classes clustering similar structural features are used. We refer to these as risk-oriented taxonomies, since the buildings belonging to each class are expected to exhibit similar seismic performance, often derived from analysis of empirical damage data.
Different types of taxonomies have been proposed in the last decades. The 1998 European Macroseismic Scale (Grünthal, 1998) is the latest evolution of the one-century-long dynasty of scales that was born with the Mercalli-Cancani-Sieberg scale (Musson et al., 2010), and is aimed at describing the observable effects of ground motion on the environment, the people and the built environment. The EMS-98 scale acknowledges the variability of the seismic performance in modern built environment, and introduces 15 different classes of buildings, predominantly accounting for wall materials but also considering different levels of earthquake-resistant design. Each class is associated to an expected range of physical vulnerability, defined on a six level-scale (named from “A” to “F” with “A” being the most vulnerable). The classes are representative of the building stock in Europe, although the scale is widely used also in other geographical areas,
The HAZUS taxonomy (Barthel et al., 1998; Graber et al., 1999) has been introduced as part of an integrated and comprehensive methodology originally proposed in USA by the Federal Emergency Management Agency (FEMA) in order to quantitatively estimate the impact of natural phenomenons such as earthquakes, floods and hurricanes (Kircher et al., 2006). This taxonomy was built upon the building classes proposed within the framework of rapid visual screening with the aim of evaluating life safety performance level and immediate occupancy. The latest version includes 36 building typologies, mainly defined by different lateral-load-resisting systems, with 4 levels of seismic code compliance, that has been optimized to describe the building stock in the USA. Other structural features are individually accounted for in form of a supplemental checking-list during the multi-tier seismic evaluation procedure (Graber et al., 1999). For each of these representative building typologies and some of their derivative configurations fragility and vulnerability models have been provided (Council et al., 1999).
The PAGER-STR taxonomy is the most comprehensive risk-oriented classification of (mostly residential) building classes at global scale, and has been compiled by partly joining in several already existing taxonomies and complementing it with further building typologies collected via specific surveys in several countries (Jaiswal et al., 2010). The taxonomy features a total of 103 classes, differentiated based on lateral-load resisting system, wall material, height category and seismic code compliance. The PAGER-STR taxonomy (Jaiswal et al., 2010) has been last updated in 2014, and covers a great number of building typologies (and, indirectly, of building practices) and it is mostly used to represent large-scale exposure and is not designed to be used for small-scale and single-structure description.
2.1. Faceted Taxonomies
Risk-oriented taxonomies are usually employed to model seismic exposure following a top-down approach, i.e., where the composition of the building stock is estimated based on expert judgment or inferred from aggregated data (e.g., housing census). Although these taxonomies have been largely used in field surveys (e.g., Graber et al., 1999), the direct assignment of a building class from a risk-oriented taxonomy to buildings observed during a survey has several disadvantages, including:
• the assignment is subjective, and as such may be partly biased depending on the skills and experience of the surveyor,
• once the class is assigned, most information on structural and non-structural features of the observed building is lost,
• the assignment of the class cannot be further modified or reversed after the completion of the survey.
Furthermore, the assignment of a class from a risk-oriented taxonomy often implies that the building will comply with the assumptions defined by the class itself. This is reasonable when the reference taxonomy has been developed with the same geographical scope of the field survey (e.g., assigning HAZUS classes in California, USA), but may introduce a further uncertainty in the subsequent vulnerability estimation in other cases (e.g., assigning PAGER classes in Italy).
In order to overcome this issue, a more flexible approach has been proposed using so called faceted taxonomies. A faceted taxonomy is a set of taxonomies, each describing a given domain from a different aspect, or facet (Tzitzikas, 2009). A faceted taxonomy has several advantages over a single hierarchy of attributes, including conceptual clarity, compactness and scalability. Several conceptual designs for detailed description and classification of buildings have been proposed within the engineering community (e.g., Rivard and Fenves, 2000), mostly with the purpose of describing in detail single structures from the structural and functional point of view. More recently, within the framework of the SYNER-G project, a faceted taxonomy has been proposed for the description of European buildings (Pitilakis et al., 2016), based on 15 facets, or list of categories (see Brzev et al., 2013, for a more in-depth review of existing taxonomies). Within the Global Earthquake Model (GEM), based upon these past applications, a comprehensive faceted taxonomy has been introduced to provide a standardized description of buildings with a global scope (Brzev et al., 2013). The taxonomy is organized as a series of expandable tables, which contain information pertaining to various building attributes. Each attribute describes a specific characteristic of an individual building or a class of buildings that could potentially affect their seismic performance. The following 12 attributes have been included in the GEM Building Taxonomy v2.0 (hereby referred to as GEM taxonomy):
1. direction
2. material of the lateral load-resisting system
3. height
4. date of construction or retrofit
5. occupancy
6. building position within a block
7. shape of the building plan
8. structural irregularity
9. exterior walls
10. roof
11. floor
12. foundation system
some further complemented by second- and third-level attributes. For each attribute a value may be specified, chosen amongst a set of predefined values. The set of values describing the building can be arranged as a synthetic textual string. Through this string (or, alternatively, by providing the couple attribute-value for each defined attribute) an individual building may be described in its main fragility and vulnerability-related characteristics.
The GEM taxonomy is very efficient in describing a variety of buildings, and can be used to translate the reference descriptions associated to risk-oriented taxonomies such as PAGER-STR or HAZUS (Brzev et al., 2013). This taxonomy can also be efficiently used to collect observed features in the field (Bevington et al., 2012; Wieland et al., 2015; Pittore et al., 2017). Unfortunately, in most cases, only a fraction of the attributes collected are then used to actually classify the buildings, using a simplified set of categories.
3. Bottom-Up Exposure Modeling
Faceted taxonomies are very flexible in providing customized descriptions of buildings which are largely independent on the geographical region, as well as on a specific hazard. Being highly detailed, and not directly related to building classes expectedly homogenous in terms of vulnerability, these types of taxonomy have not been fully exploited in risk-related applications. In most cases, they have been used to provide a more standard, transboundary description of dominant building types. Often this type of taxonomy is employed in field screening activities (e.g., Verrucci et al., 2014), but then the observed buildings are mapped into simpler taxonomies. Although suitable mappings can be defined in order to translate aggregated information from, e.g., housing census, to a set of building types composing a large-scale exposure model (e.g., Yepes-Estrada et al., 2017), there is actually no methodology to consistently assess the compatibility of the set of structural attributes observed for an individual building with respect to one or more risk-oriented class definitions. This creates thus a gap between the data collection phase, where a large number of attributes may be observed and recorded, and the application phase, where most of this information is in fact discarded by using simplified taxonomies that may not fully capture the properties of the building stock.
We suggest therefore to aim at a bottom-up approach to exposure modeling, able to exploit the potential of faceted taxonomies into a transparent and sound framework. This is implemented by encoding risk-oriented building classes in terms of the attribute types and values most likely (or less likely) associated to the classes themselves, and by defining a score for each surveyed building according to its compatibility with respect to one or more risk-oriented building classes. This allows to efficiently decouple the data collection from the exposure modeling, while ensuring full reproducibility of the results and a flexible re-use of the raw, field-collected data.
In the following we assume that for each considered building b, a taxonomic description B(b) is available. As a reference we will use the GEM taxonomy. The taxonomic description is composed by a set of attribute values vi describing observed attributes ai of the building. Most of the attribute types are categorical, and we assume that the corresponding attribute values are finite and mutually exclusive for each considered attribute type. In general (and in real cases), not all features covered by the taxonomy will be observed, and the observations may be affected by errors, so we can expect both missing data and wrong assignments. No imputation of the missing features will be considered at this stage. The taxonomic description also includes non-categorical entries, that can be either numerical (e.g., the number of stories) or ordinal (e.g., the construction date).
4. Score-Based Classification
The approach is based on a score and constraints system, which allows the estimation of the level of compatibility of a generic building b, defined by its taxonomic description B(b), with one or more building classes defined in advance. These classes define in turn a schema, that is a homogeneous classification with consistent hypothesis for the expected vulnerability. For instance, the 15 classes defined by the EMS-98 would be considered as a single schema, as well as the 103 classes described by PAGER-STR. A user-generated schema may be defined as well, in order to define a set of risk-oriented building classes which refer to a given vulnerability estimation framework and often to a specific geographical scope. The comparison of the compatibility levels across the schema classes would then allow the assignment of a specific class to the building, if required, based upon clearly defined criteria. For the sake of simplicity in the next subsections the scoring system will be described in terms of a basic formulation. In the subsequent section a more advanced formulation in terms of fuzzy numbers will be provided and exemplified.
4.1. Attribute Selection and Weighting
The definition of one or more building classes entails, as a first step, the selection of the attributes {ai, i = 1, …, n} to be considered for the class definition (and subsequent scoring) process, and the relative weighting of these attributes. The considered attributes are the ones describing the structural (and non structural) features of the buildings most directly related to the defined classes. For instance, most of the building classes related to seismic vulnerability could include the type of lateral load-resisting system and its main material, along with the type and material of the floors. Theoretically, all available attributes may be used to define the classes, although this would require later the specification of a significant number of scores. The use of weights allows to both acknowledge the role of the different attributes in describing the vulnerability of the buildings, and to consider the availability and the epistemic uncertainty related to the observation of the attributes themselves (for instance if the uncertainty in attributing the lateral load resisting system is deemed to be high, the corresponding attribute could have a lower weight in order to avoid biasing the estimates, although this attribute type is relevant for estimating the seismic vulnerability). The weighting scheme could therefore be customized for different building classes, also considering the specific data collection methodology employed to populate the taxonomic descriptions. The set of attributes and weights should be the same for all classes belonging to a given schema.
4.2. Compatibility Scores of Attribute Values
For each of the selected attribute types ai (and for which a weight has to be defined), a set of compatibility scores is associated to the corresponding categorical values {vik, k = 1, …, mi} the attribute can take. Therefore, for each building b, for which a taxonomic description B(b) is given (e.g., as result of a rapid visual screening or other inspection methodology), a compatibility score Sc(b) with respect to a given class c can be computed according to:
where
vik is an attribute value belonging to the taxonomic description B(b) of the considered building, and is the score (measuring the level of compatibility) of the attribute value vik with respect to the building class c.
For example, if the class c refers to a “reinforced masonry” building, than the following scores may be assigned to the values related to the attribute type mat_type:
The attribute value MR is assigned a maximum score (+1), while the values related to concrete and earthen materials are assigned the minimum score (−1). The value describing confined masonry MCF has been assigned a mildly positive score indicating a slight compatibility, and the values indicating either a generic masonry M99 or the total ignorance of material type MAT99 have been assigned a neutral score (0) since in both cases the reinforced masonry cannot be ruled out. If, hypothetically, the attribute value W would be observed in a screened building, it would contribute with a −1 to the overall score with respect to the class “reinforced masonry.”
The score Sc(b) is further subjected to a set of constraints Zc(b), such as
where
If at least one constraint is not satisfied, than Zc(b) = 0, and the overall score can be set to a default low score (e.g., −1). Specific constraints can be defined for numerical attributes such as the number of stories, or for non-categorical attributes (e.g., the construction date).
When a set of building classes has to be defined, a corresponding set of compatibility scores must be provided for each individual class. In order to simplify the score definition, a default compatibility score (e.g., 0, indicating neutrality) can be assumed a priori for all possible attribute values, and only the attributes contributing either positively or negatively to the final score would be explicitly defined.
5. Fuzzy Scoring Formulation
The scoring method described above needs the specification of a numerical compatibility score with respect to a building class for a set of attribute values. There may be different approaches to specify these scores following algorithmic or heuristic strategies, but the simplest way is to have an expert specify them manually. However, this procedure always entails a degree of subjectivity, i.e., implies the subjective interpretation of the notions of “compatibility,” and “belonging to a class” by the expert. This in turn will result in an additional uncertainty component. A way to minimize this uncertainty would be to use of a pool of experts, whose judgmental bias can be compensated by a suitable calibration phase (Aspinall, 2010), but still, the manual assignment of numerical scores would be difficult to constrain. We propose therefore to substitute the numerical score with a semantic, more qualitative formulation, which employs triangular fuzzy numbers to define the compatibility scores of the specific attribute value.
A Triangular Fuzzy Number (TFN, see Kaufmann and Gupta, 1985; Zhu et al., 1999) is hereby defined as an array of three real numbers [n1, n2, n3]; the first describes the value with the highest membership, i.e., the mode of the distribution. The second and third numbers represent the support of the fuzzy number, i.e., the interval outside which its membership is zero (n1∈[n2, n3]). The membership function will be then linearly increasing from 0 at n2 to 1 at n1, and then will linearly decrease from 1 at n1 to 0 at n3 (see also Figure 1). Seven different levels of compatibility are introduced, listed in Table 1 along with their representation as TFNs.
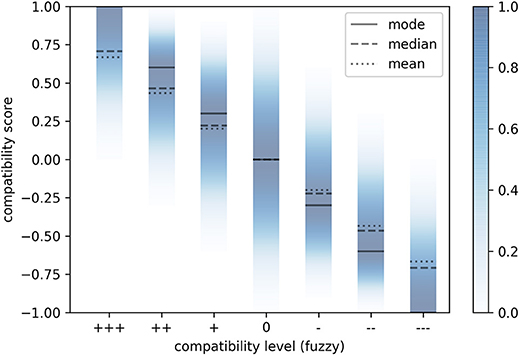
Figure 1. Triangular fuzzy numbers describing the degree of membership of the compatibility score for each qualitative compatibility level. The three descriptors of the distribution that can be used for defuzzifying are also shown.
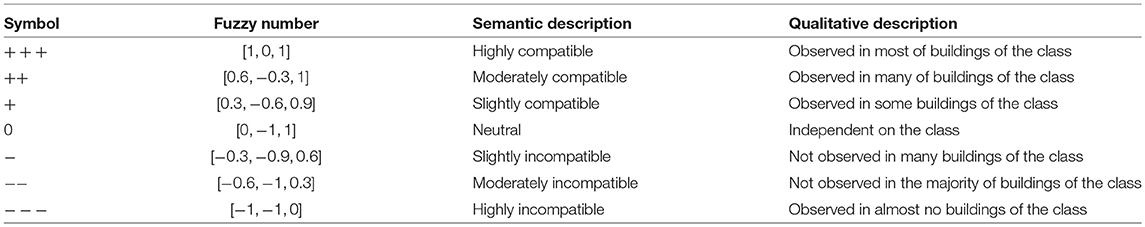
Table 1. Qualitative compatibility levels to be used to assign a fuzzy score.
These seven compatibility levels are symmetric with respect to the neutral compatibility (which translates into a zero score for the analyzed attribute value). The use of triangular fuzzy numbers describes, through a simple mathematic formulation, the intrinsic uncertainty and subjectivity of the compatibility assignment. The “highly compatible” level for instance is translated into a TFN score interval with support is in the range [0.5, 1] and monotonically increasing values. Different types of fuzzy formulations may describe subjective evaluations with different degree of confidence, just by reducing or enlarging the support and/or the shape of the corresponding fuzzy interval (see Figure 1).
5.1. Class Definition Scheme
For a considered attribute type, the level of compatibility of each attribute value with respect to the building class to be represented should be specified. This would allow a very precise control of the resulting overall compatibility, although it may result in a significant number of compatibility assignments to be defined. A simpler alternative is to initialize all attribute values to a default compatibility level (e.g., neutral), and explicitly consider only the attribute values which are contributing to the overall compatibility score. The set of the compatibility levels for the significant attribute values for a specific building class in a schema is referred to as a class description.
Table 2 shows, for example, two class descriptions for the building typologies “adobe (earth brick)” building (ADO) and “rubble stone, field stone” (URM1), as defined by the EMS-98 macroseismic scale (Grünthal, 1998). Six structural attributes of the GEM taxonomy have been used. We can note that for some of the considered attributes, there is a partial overlap of the compatibility values, as is expected considering the similarities between these two building types. We can also note that, in this case, for the material type (mattype) both compatible and incompatible values have been specified, whereas for the other attributes mostly only the compatible values have been provided. Furthermore, the floor material (floormat) for the ADO building class has not been specified at all.
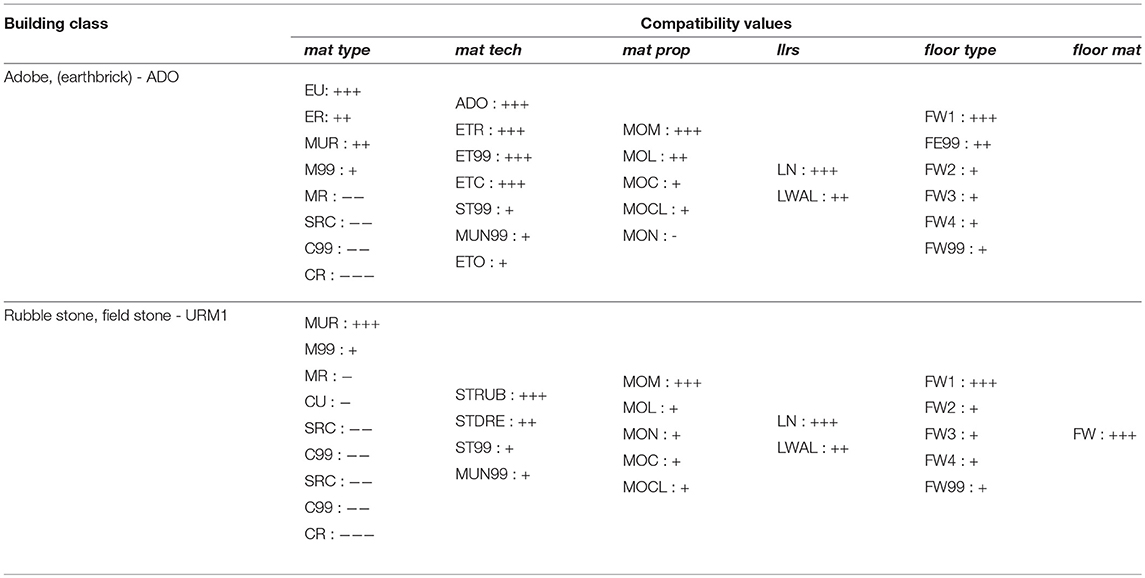
Table 2. Class descriptions for two example building typologies from EMS-98, in terms of fuzzy compatibility levels.
In order to assign an inspected building to a specific building class, the overall compatibility score is first computed with respect to all available buildings classes using the corresponding class descriptions. The score is thus computed as a weighted combination of the individual compatibility levels, as shown in Equation (1). Since the compatibility levels are defined by triangular fuzzy numbers, the operation is carried out according to the simple arithmetic of fuzzy numbers following (Kaufmann and Gupta, 1985). The result will be in turn a triangular fuzzy number.
5.2. Non-categorical Attributes
The application of the methodology described above is straightforward with categoric attributes, i.e., attributes whose values are discrete and finite. In order to consider non-categorical attributes, such as numerical values (e.g., number of stories) or dates, two approaches may be followed:
1. a categorization of the attributes, e.g., mapping the number of stories into a category such as “low rise” if number of stories is less than 4,
2. the definition of a constraint, which defines a specific condition to be satisfied (e.g., the number of stories should be less than four). If the constraint is not satisfied, then the overall compatibility score of the considered building can be set, e.g., to the minimum compatibility.
5.3. Class Assignment
Once the compatibility score with respect to all building classes has been computed, the unmapped building should be assigned a single building class. This may be obtained by comparing the respective compatibility scores, and selecting the building class that scores the highest. Since the scores are defined by fuzzy intervals, a fuzzy comparison and ranking approach (Bortolan and Degani, 1985) is therefore applied, after Dorohonceanu and Marin (2002). A further threshold on the compatibility score is also used, in order to filter out the assignments where even the highest-ranking score would be considered unreliable. The threshold can be applied either on the fuzzy interval or on the related defuzzified (crisp) value. In case no building class exceeds the threshold, the considered building can be assigned to the special class OTH (Other) for later analysis. In case more than one class appears to be highly compatible, a suitable heuristic should be defined in order to assign a single class, or alternatively all the compatible classes should be kept in order to account for the underlying uncertainty. In real-world cases, for instance, also considering missing or contrasting assignment of the attribute values during the data collection, a partial overlap among different classes should be expected (e.g., between adobe and unreinforced masonry, as shown in Table 2). If the seismic behavior of the considered classes is expected to be different, the uncertainty in the class assignment would propagate into the subsequent risk assessment. The proposed method allows to approach this uncertainty in a sound and traceable way, but caution should be observed in all steps to ensure full consistency of the results.
6. Application
In order to exemplify the proposed methodology, we consider a case where the residential building stock in France, close to Soultz-sous-Fôrets, was surveyed using a remote rapid visual screening (RRVS, see e.g., Wieland et al., 2015), for vulnerability and risk assessment in case of induced seismicity. A web-based platform (Haas et al., 2016) has been employed to survey residential areas in the considered test sites. The survey have been carried out by a structural engineer which analyzed a set of buildings by means of omnidirectional images and web GIS maps (Megalooikonomou et al., 2018). The buildings to inspect have been selected, with a random spatial sampling, from the OpenStreetMap database, which appeared to be rather complete in the considered region. The description of the buildings is based on the faceted taxonomy proposed by GEM (Brzev et al., 2013). The attribute covers both structural and non-structural features, as well as occupancy. For each attribute type, all attribute values defined by the GEM taxonomy can be selected via dropdown menus in the RRVS interface. A few of the attributes are non-categorical, such as the height and the number of stories. The surveyor has been asked to fill up only the attribute types that were clearly observable, or could be safely estimated based on other observable characteristics. In this case the RRVS platform queries for each selected building the omnidirectional images provided by the Google StreetView™ service, but the platform can employ also omnidirectional images captured with a mobile mapping system, where no suitable data is already available (Pittore and Wieland, 2013).
A total of 500 buildings have been inspected in an area of approx 130 km2 characterized by small, mostly rural settlements (see Figure 2). The considered area has a very low natural seismic hazard, but in the past induced seismicity has been observed in relation to the activities of the geothermal plant located in Soultz-sous-Fôrets (Baria et al., 2005; Majer et al., 2007). The dataset (Pittore et al., 2018) is available as electronic supplement to this paper. Table 3 shows the distinct combinations of the seven main structural attributes: material type (mattype), material technology (mattech), material properties (matprop), lateral load resisting system (llrs) and its estimated ductility (llrsduct), floor type (floormat) material (floormat), with more than 5 occurrences. The surveyor inspected the buildings trying to always fill entries based on features clearly observable from the omnidirectional and the satellite images (provided respectively by Google StreetView™ and Bing™).
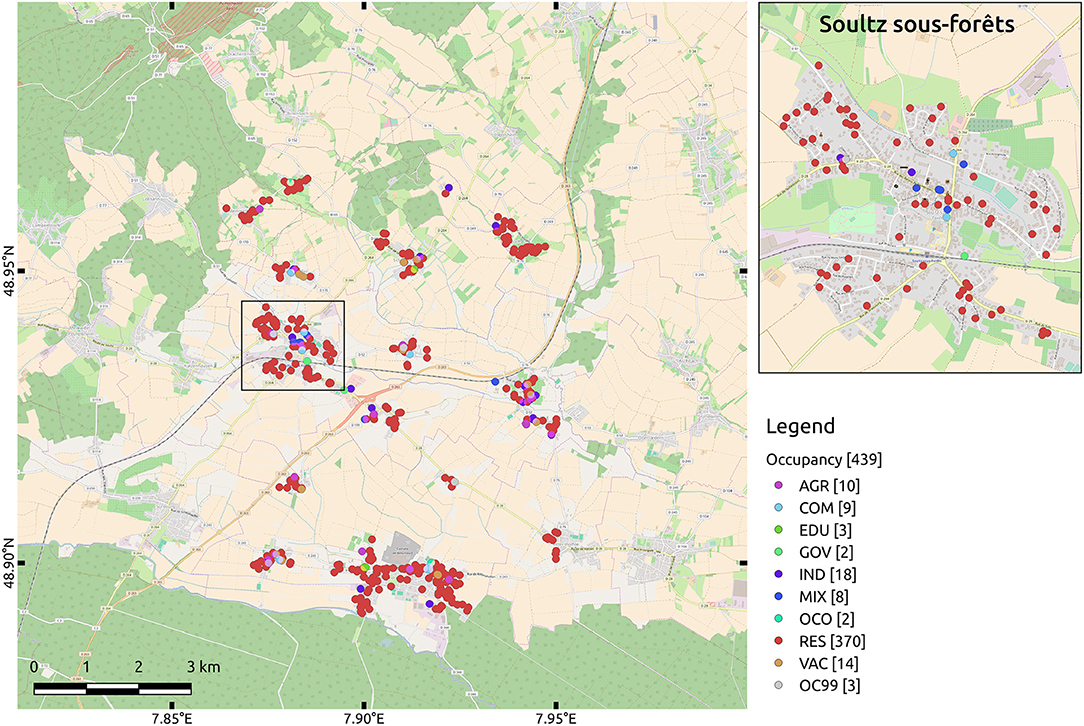
Figure 2. Geographical distribution of the surveyed buildings. As can be noted by the observed occupancy (color-coded), most are residential structures.
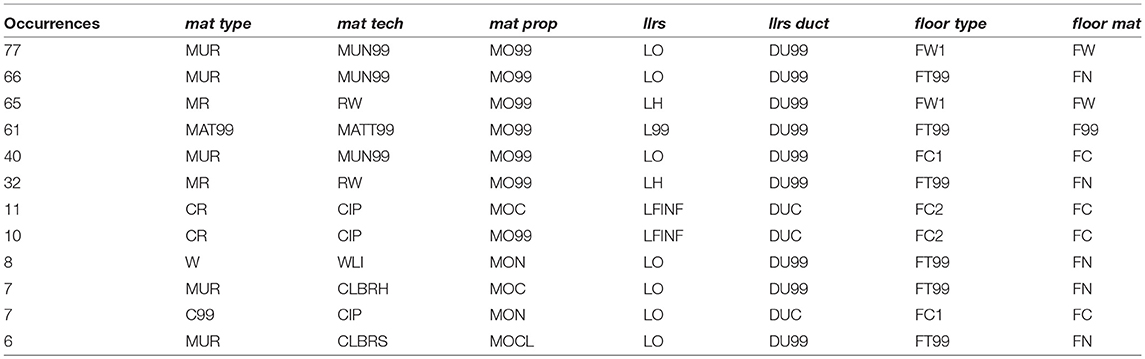
Table 3. Distinct combinations of observed attributes with more than 5 occurrences, in descending order.
By analysing the distribution of collected attributes, a few preliminary observations can be made:
• By considering only seven attributes 86 distinct combinations of values are observed, 53 of which represent singletons, i.e., unique observations.
• by considering progressively less parameters, the number of their unique combinations decreases. Still, considering the relative homogeneity of the building stock, a significant number of combinations can be observed (down to 10 using only the material type). Note that also attribute values declaring the ignorance of a specific feature type have to be considered in the description.
• around 10% of the observations (61 occurrences) refer to buildings for which no reliable survey could be done.
6.1. The DESTRESS Class Schema
Based on the analysis of the observed distinct combinations a custom class scheme can be developed. An optimal risk-oriented class scheme would map the building observations to the smallest set of classes capturing both the distribution of building typologies, and their expected seismic performance. In the framework of the DESTRESS project the goal is a rapid assessment of risk arising from induced seismicity. Therefore, based on a preliminary analysis of the data (see e.g., Table 3), a set of 8 representative typologies has been defined, as listed in Table 4. Each representative typology is also associated to a taxonomic representation in terms of the GEM taxonomy. The taxonomic description is then expanded into a class definition scheme based on the fuzzy scoring approach described in section 5.1 and preceding. The complete DESTRESS class scheme, shown in Figure 3, is listed in Supplementary Material and provided as electronic supplement.
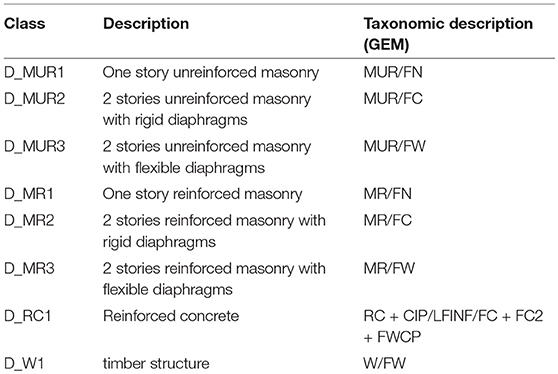
Table 4. Building classes defining the DESTRESS scheme.
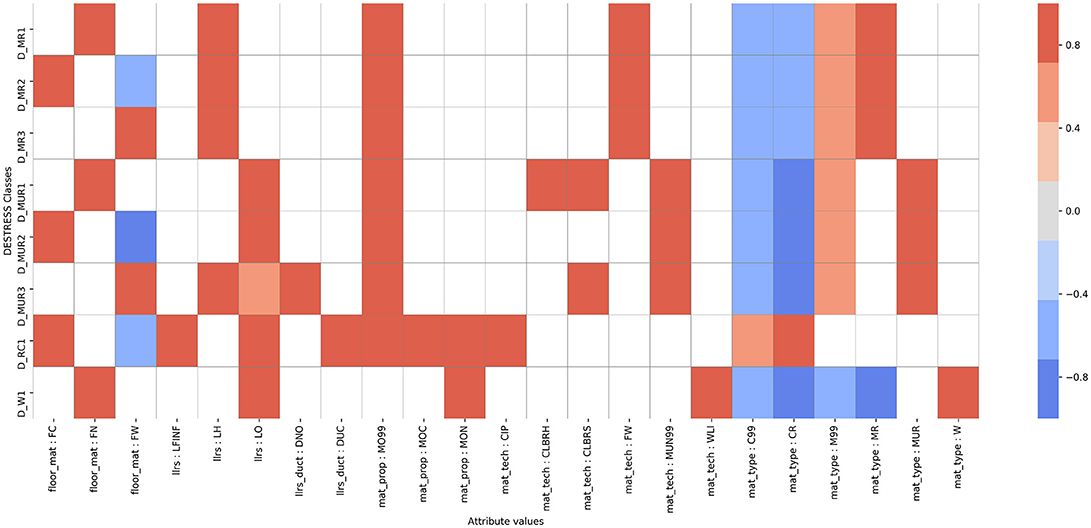
Figure 3. Graphical representation of the class definitions for the DESTRESS scheme. Along the x-axis the considered attribute values; along the y-axis the building typologies defined within the schema. The color encodes the compatibility value, with red indicating high compatibility, blue indicating high incompatibility and gray neutral compatibility. White indicates that no explicit compatibility value has ben assigned (it will be considered as neutral by default).
6.2. EMS-98 Class Schema
In order to test the methodology proposed with an already existing, risk-oriented building taxonomy, a fuzzy class definition scheme has been created to describe those building typologies defined within the EMS-98 macroseismic scale, as listed in Table 5, along with the corresponding taxonomic descriptions according to the GEM taxonomy. The class definitions for the 15 building typologies, pictured in Figure 4, are listed in Supplementary Material and provided as electronic supplement. As an additional note, we remark that several classes within the EMS-98 scale are defined according to their level of Earthquake-Resistent Design (ERD). Being such attribute not present in the current version of the GEM taxonomy, nor being it easy to ascertain from an external observation, a combination of lateral load-resisting system (llrs) and its ductility (llrsduct) have been used to encode the expected ERD level.
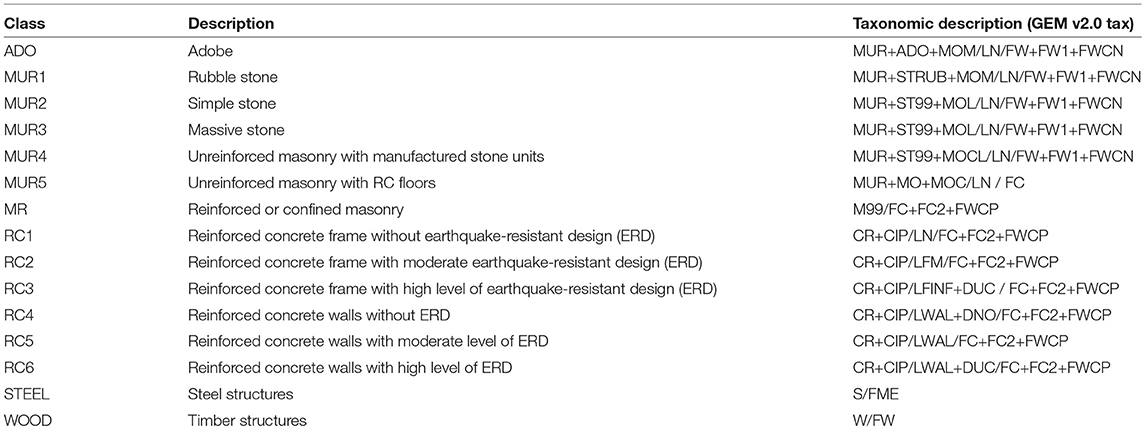
Table 5. Building classes defining the EMS-98 scheme.
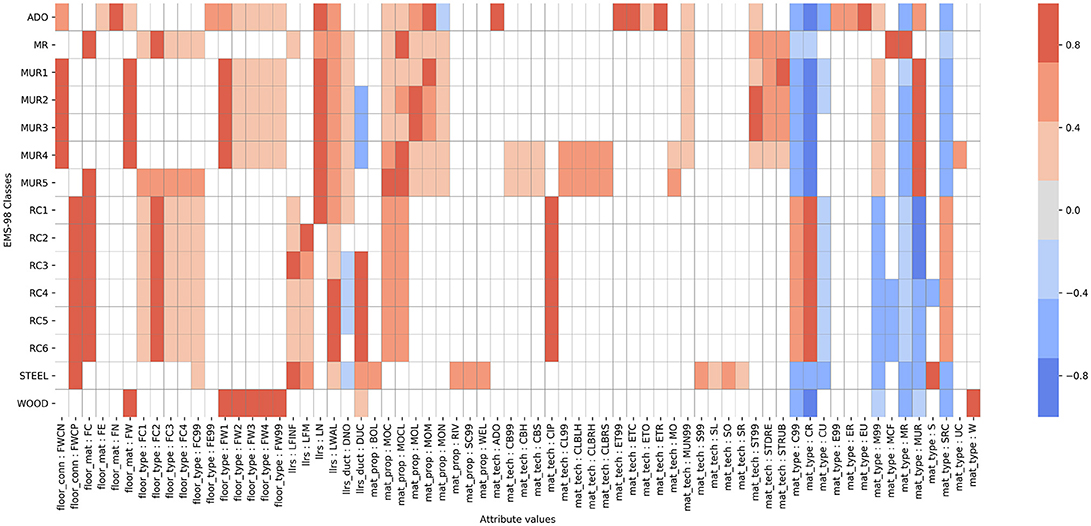
Figure 4. As for Figure 3, a graphical representation of the class definitions for the EMS-98 scheme.
6.3. Exposure Modeling
The class definition schema described in the preceding sections can be applied to the observed building stock in order to obtain a exposure model suitable for risk-related applications.
6.3.1. Attribute Weighting
The scoring approach is based on a class definition scheme, a set of fuzzy compatibility levels and a weighting scheme. Since the DESTRESS and the EMS-98 schemes are based on different attributes, two set of weights are defined, as listed in Table 6. We note that both weight sets sum to one, and that they are largely similar. The proposed weights are based on the simple consideration that material type (mattype) and technology (mattech) are relatively straightforward to observe and are also relevant for seismic vulnerability assessment. The type of lateral load-resisting system (llrs) and its ductility (llrsduct) are important as well, but also more prone to uncertainty in the survey process and thus more frequently missing.
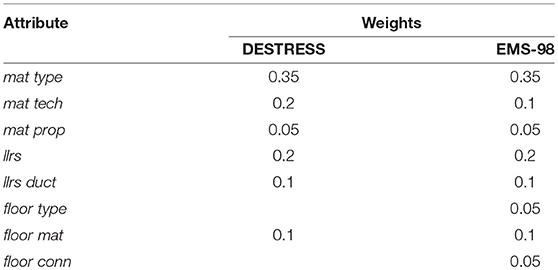
Table 6. Weighting for the DESTRESS and EMS-98 building class schemes.
6.3.2. Scoring
Given the weight defined above and the class definition schemes, the fuzzy compatibility score can be estimated for every building in the dataset with respect to all defined classes. In order to exemplify the procedure we consider one of the surveyed building (with id = 21123), depicted in Figure 5 within the web-based RRVS platform interface. The observed features are listed in Table 7 (only the attributes relevant for the classification are reported. The complete set of observations is provided as additional material to this paper).
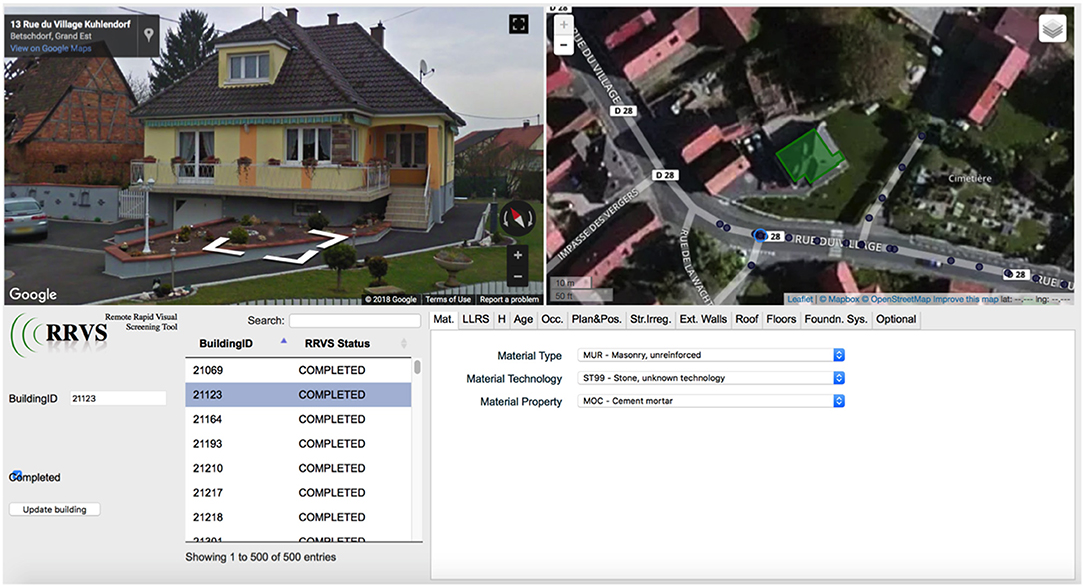
Figure 5. Example of a building remotely inspected using the web-based RRVS platform. The tab panel in the lower right side of the graphical interface includes the principal attributes of the GEM taxonomy. In foreground the material tab. The attributes collected for this building are summarized in Table 7.
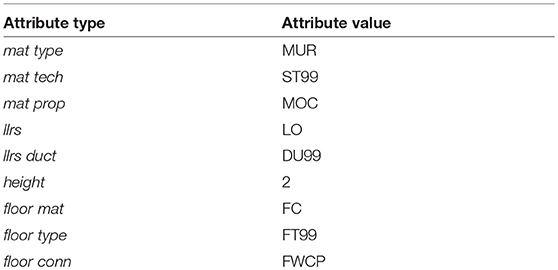
Table 7. Observed attributes of the surveyed building with id = 21123.
Although the material type clearly indicates that the building can be broadly classified as unreinforced masonry, its taxonomic description is not complete and does not completely match the reference classes indicated in Tables 4, 5. The (compatibility) scores of this building estimated with respect to the class schemes EMS-98 and DESTRESS are shown respectively in Figures 6, 7. The class scoring highest in the DESTRESS schema is MUR2, due to the matching combination of material type (of lateral load resisting system) and floor material. Considering the EMS-98 scheme, several unreinforced masonry classes appear compatible with the considered building, with a preference for the MUR5 class (unreinforced masonry with RC floors), which is reasonable considering the characteristics of the building.
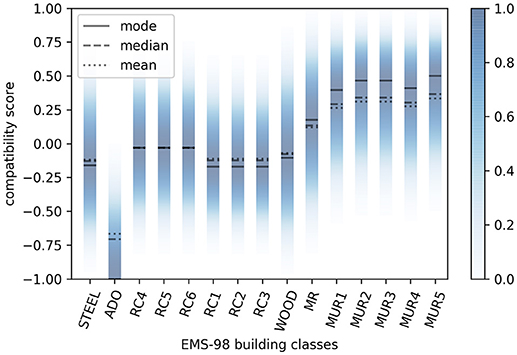
Figure 6. Fuzzy compatibility scores of the observed building (see Table 7) with respect to the EMS-98 scheme.
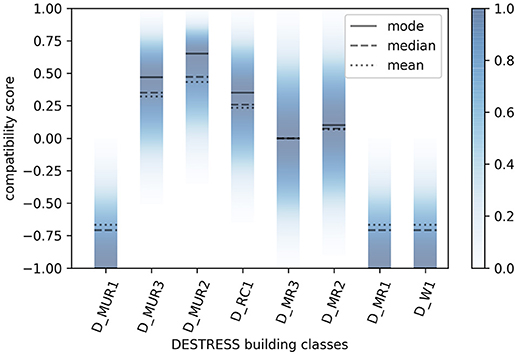
Figure 7. Fuzzy compatibility scores of the observed building (see Table 7) with respect to the DESTRESS scheme.
By applying the same procedure to all buildings in the dataset, and assigning the class based on the ranking of the scores, we obtain two different exposure models, shown in Figure 8. The buildings whose defuzzified score (using the median) was equal or less than zero have been assigned the OTH (Other) class. An IPython notebook implementing the proposed methodology is provided as electronic supplement to this paper (Pittore and Haas, 2018) and the last updated version is available online.
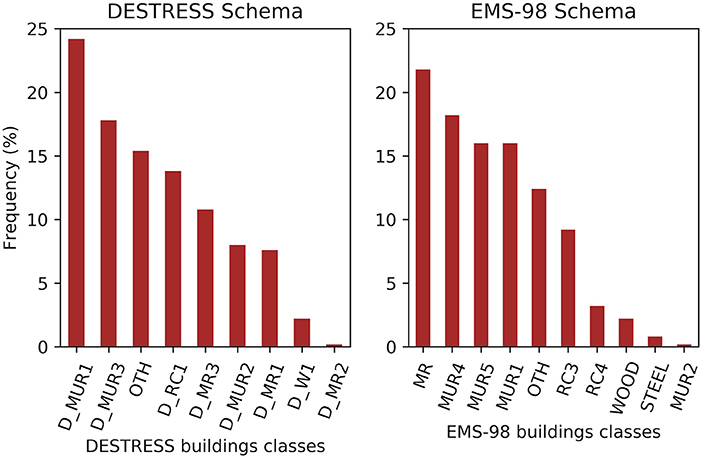
Figure 8. Resulting exposure models using respectively the DESTRESS (left) and EMS-98 (right) class definition schema.
7. Discussion
We can note that the two resulting exposure models are relatively balanced, that is they capture the variability of the buildings features in the dataset without a perceivable bias in the assignment. According to the EMS-98 class definition scheme the exposure is dominated by reinforced masonry, which is explained by the fact that in this class schema there is only one typology of reinforced masonry, whereas in the DESTRESS class definition scheme two unreinforced masonry classes are defined. Furthermore, the EMS-98 class definition scheme defines five different unreinforced masonry classes, as compared with the three types defined by the DESTRESS class definition scheme. The same considerations apply with reinforced concrete. In this case we can note that, within the EMS-98 scheme, most of the observed RC buildings with infilled frame structure have been associated to the RC3 typology, and the rest to the RC4 one. We also note that using the EMS-98 class definition scheme, a total of 62 buildings have been assigned to a OTH (Other) class. This class refer to structures for which almost no structural feature could be reliably observed. With the DESTRESS class definition scheme the number of OTH classes raises to 77, in this case also including buildings with structural features that partially conflicted with the class definitions, thus failing to generate a positive score. This is a consequence of the higher customization of the class scheme, whereas the classes in the EMS-98 schema are more broadly defined.
8. Outlook
The preliminary results indicate that using a fuzzy formulation for the compatibility score allows for a better consideration of the epistemic uncertainty related to the expert judgment. Nevertheless, a more detailed analysis should be carried out to explore the sensitivity of the model to different uncertainty settings (e.g., by changing the support and shape of the fuzzy intervals). Moreover, for the weighting scheme used to integrate the different attribute types, a crisp (non-fuzzy) approach has been employed. Since also the selection of the weights entails a degree of subjective judgment, the use of fuzzy formulation could be further applied. A threshold value on the compatibility score of each building has been introduced, as a way to filter out cases where unreliable assignment may occur. Although we suggest to use a relatively weak threshold, in order not to have critical values in the process, this may vary according to the specific application and should be further investigated. Nevertheless, the presence of buildings that do not fit the provided categories (assigned to class OTH) represents a relevant difference with other exposure modeling approaches, and should be adequately addressed. Further work will be carried out in the next research phase, including the implementation of other commonly-used, risk-oriented taxonomies (e.g., PAGER-STR, HAZUS) with the same scoring approach, and a more comprehensive analysis of the resulting uncertainties and their propagation into the risk assessment stage. Furthermore, the collaborative assignment of fuzzy scores based on expert elicitation approaches will be explored.
9. Conclusions
A novel methodology for the description and the assignment of risk-oriented classes to individual buildings observations, based on the concept of fuzzy compatibility score, has been presented and exemplified. The methodology allows the computation of the level of compatibility of a surveyed building, defined by its (faceted) taxonomic description, with respect to a set of pre-defined building typologies composing a class definition scheme. These building typologies are described by specifying the taxonomic attributes values most likely (or unlikely) associated to each class. The use of a simple fuzzy formulation reduces the amount of subjective judgment in the class assignment, while ensuring a better consideration of the underlying uncertainties. The proposed approach provides a sound framework in order to directly assimilate field observations, recorded with a faceted taxonomy, into a consistent exposure model. Two cases have been explored:
1. the generation of an application-specific class definition scheme (DESTRESS), based on an exploratory analysis of the collected data, and
2. the use of a class definition scheme implementing a widely used risk-oriented taxonomy (EMS-98).
The resulting class definition schemes can be described by simple logical structures, and saved into textual, machine-friendly formats along with the raw building observations dataset in order to make the whole process transparent and fully reproducible. As an example, the two schemes are provided in YAML and JSON format as electronic supplements, along with a python code exemplifying the whole methodology. Two different exposure models have been computed, according to the considered schemes, for a dataset of 500 residential buildings collected within the framework of the European project DESTRESS. The two models are comparable, effectively implementing a clustering of the buildings into a similar number of classes with homogeneous expected seismic performance.
The results are promising, suggesting that faceted taxonomies with regional or global scope, such as the GEM taxonomy, could be instrumental in stimulating the collection of high-quality, building-by-building data and their transparent integration into the current and future risk-assessment computational frameworks. This effectively removes the burden of class-assignment from the surveyors, turning it into an off-line process which might be carried out collaboratively.
We advocate for employing a bottom-up approach in developing exposure models for urban risk applications. This entails the systematic collection of information on structural and non-structural attributes for a set of individual building structures using a faceted taxonomy, moving to a later processing stage the assignment of a specific (vulnerability-related) class to each surveyed building. This approach has several advantages:
• the individual attributes to be collected in the field are, at a large extent, independent from a particular building class, and in turn common to a wide range of building classes at a regional and global scale,
• most of the individual attributes are relatively independent from building practices and seismic codes, therefore ensuring a long term sustainability to the taxonomy description,
• the assignment of building classes is explicitly vulnerability-driven, and it does not interfere with the lower-level description of the building structure. Different classes may be assigned to the same building according to the specific applications, thus paving the road to more efficient multi-hazard exposure modeling approaches.
• building classes may be changed or updated in time, for instance in response to improved fragility or vulnerability models, without affecting the low-level attributes collected during the surveys. Re-assignment of the building classes is a straightforward and completely traceable post-processing step.
In conclusion the proposed methodology lays the groundwork for a range of innovative applications, including the efficient modeling of multi-hazard exposure and vulnerability assessment, and the development of hybrid models where atomic instances (i.e., building-by-building observations) fully embed into geo-statistical models.
Author Contributions
MP developed the methodology and carried out the exposure modeling. MH contributed to designing and developing the RRVS platform, and supported the development of the methodology. KM carried out the RRVS building survey and participated in outlining and reviewing the class definition schemes.
Funding
The activities described in this paper have been funded by the projects DESTRESS - Demonstration of soft stimulation treatments of geothermal reservoirs (European Union's Horizon 2020 research and innovation programme, grant agreement 691728), RIESGOS - Multi-risk analysis and information system components for the Andes region (German Federal Ministry of Education and Research, funding measure BMBF CLIENT II - International partnerships for sustainable innovations) and EMCA - Earthquake Model Central Asia (regional component of the GEM - Global Earthquake Model project).
Conflict of Interest Statement
The authors declare that the research was conducted in the absence of any commercial or financial relationships that could be construed as a potential conflict of interest.
Acknowledgments
We would like to thank Michele Palermo (Universitá degli Studi di Bologna, Italy) and Benedetto Nastasi (Delft University of Technology, Netherlands) for the constructive comments and suggestions.
Supplementary Material
The Supplementary Material for this article can be found online at: https://www.frontiersin.org/articles/10.3389/fbuil.2018.00041/full#supplementary-material
References
Abrahamczyk, L., Schwarz, J., Langhammer, T., Genes, M. C., BikÝe, M., KaÝin, S., et al. (2013). Seismic risk assessment and mitigation in the Antakya-Maras region (SERAMAR): empirical studies on the basis of EMS-98. Earthq. Spect. 29, 683–704. doi: 10.1193/1.4000163
Aguirre, P., Våsquez, J., de la Llera, J. C., Gonzålez, J., and Gonzålez, G. (2018). Earthquake damage assessment for deterministic scenarios in Iquique, Chile. Nat. Hazards 92, 1433–1461. doi: 10.1007/s11069-018-3258-3
Algermissen, S. T. (1989). Techniques and parameters for earthquake risk assessment. Bull. N. Z. Natl. Soc. Earthq. Eng. 22, 202–218.
Aspinall, W. (2010). A route to more tractable expert advice. Nature 463, 294–295. doi: 10.1038/463294a
Baria, R., Michelet, S., Baumgrtner, J., Dyer, B., Nicholls, J., Hettkamp, T., et al. (2005). “Creation and mapping of 5000 m deep HDR/ HFR reservoir to produce electricity,” in Proceedings World Geothermal Congress (Antalya), 24–29.
Barthel, R., Agency, U. S. F. E. M., and Reclamation, U. S. B. o. (1998). FEMA 178, Seismic Evaluation of Existing Building: Supplemental Class Notes. U.S. Department of the Interior, Bureau of Reclamation.
Bernardini, A., Lagomarsino, S., Mannella, A., Martinelli, A., Milano, L., and Parodi, S. (2010). Forecasting seismic damage scenarios of residential buildings from rough inventories: a case-study in the Abruzzo Region (Italy). Proc. Inst. Mech.Eng. O 224, 279–296.
Bevington, J., Eguchi, R. T., Huyck, C. K., Crowley, H., DellAcqua, F., Iannelli, G., et al. (2012). “Exposure data development for the Global Earthquake Model,” in Proceedings of the 15th World Conference on Earthquake Engineering (Lisbon).
Bindi, D., Mayfield, M., Parolai, S., Tyagunov, S., Begaliev, U., Abdrakhmatov, K., et al. (2011). Towards an improved seismic risk scenario for Bishkek, Kyrgyz Republic. Soil Dyn. Earthq. Eng. 31, 521–525. doi: 10.1016/j.soildyn.2010.08.009
Bortolan, G., and Degani, R. (1985). A review of some methods for ranking fuzzy subsets. Fuzzy Sets Syst. 15, 1–19. doi: 10.1016/0165-0114(85)90012-0
Brzev, S., Scawthorn, C., Charleson, A. W., Allen, L., Greene, M., Jaiswal, K. S., et al. (2013). GEM Building Taxonomy Version 2.0. GEM Technical Report 2013-02 v1.0.0, GEM.
Coburn, A. W., Spence, R., and Pomonis, A. (1994). Vulnerability and Risk Assessment, 2nd Edn. Cambridge: UNDP Disaster Management Training Programme. Cambridge Architectural Research Limited.
Council, A. T., Response, P. f., Recovery, and Agency, U. S. F. E. M. (1999). Evaluation of Earthquake Damaged Concrete and Masonry Wall Buildings: Basic Procedures Manual. The Agency.
De Bono, A., and Mora, M. G. (2014). A global exposure model for disaster risk assessment. Int. J. Disaster Risk Reduct. 10, 442–451. doi: 10.1016/j.ijdrr.2014.05.008
Dorohonceanu, B., and Marin, B. (2002). A simple method for comparing fuzzy numbers. CiteSeerX Scientific Literature Digital Library and Search Engine.
Graber, T., Management, U. S. B. o. L., and Reclamation, U. S. B. o. (1999). FEMA 310, Seismic Evaluation of Buildings, Boise District Office Building, Boise, Ada County, Idaho. U.S. Department of the Interior, Bureau of Reclamation.
Grünthal, G. (1998). European Macroseismic Scale 1998, Vol. 15. Centre Européen de Géodynamique et de Séismologie, Luxembourg.
Haas, M., Wieland, M., and Pittore, M. (2016). DEMO: Remote Rapid Visual Screening (RRVS). Available online at: https://vimeo.com/158600573
Jaiswal, K., Wald, D., and Porter, K. (2010). A global building inventory for earthquake loss estimation and risk management. Earthq. Spect. 26, 731–748. doi: 10.1193/1.3450316
Kaufmann, A., and Gupta, M. (1985). Introduction to Fuzzy Arithmetic: Theory and Applications. Van Nostrand Reinhold Electrical/Computer Science and Engineering Series. Van Nostrand Reinhold Company.
Kircher, C. A., Whitman, R. V., and Holmes, W. T. (2006). HAZUS earthquake loss estimation methods. Nat. Hazards Rev. 7, 45–59. doi: 10.1061/(ASCE)1527-6988(2006)7:2(45)
Lagomarsino, S., and Giovinazzi, S. (2006). Macroseismic and mechanical models for the vulnerability and damage assessment of current buildings. Bull. Earthq. Eng. 4, 415–443. doi: 10.1007/s10518-006-9024-z
Majer, E. L., Baria, R., Stark, M., Oates, S., Bommer, J., Smith, B., et al. (2007). Induced seismicity associated with Enhanced Geothermal Systems. Geothermics 36, 185–222. doi: 10.1016/j.geothermics.2007.03.003
Megalooikonomou, K. G., Parolai, S., and Pittore, M. (2018). Toward performance-driven seismic risk monitoring for geothermal platforms: development of ad hoc fragility curves. Geothermal Energy 6:8. doi: 10.1186/s40517-018-0094-3
Musson, R. M., Grünthal, G., and Stucchi, M. (2010). The comparison of macroseismic intensity scales. J. Seismol. 14, 413–428. doi: 10.1007/s10950-009-9172-0
Pilz, M., Bindi, D., Boxberger, T., Hakimov, F., Moldobekov, B., Murodkulov, S., et al. (2013). First steps toward a reassessment of the seismic risk of the city of dushanbe (tajikistan). Seismol. Res. Lett. 84, 1026–1038. doi: 10.1785/0220130040
Pitilakis, K., Franchin, P., Khazai, B., and Wenzel, H (eds.) (2016). SYNER-G: Systemic Seismic Vulnerability and Risk Assessment of Complex Urban, Utility, Lifeline Systems and Critical Facilities: Methodology and Applications, Volume 31 of Geotechnical, Geological and Earthquake Engineering. Springer.
Pittore, M., Bindi, D., Stankiewicz, J., Oth, A., Wieland, M., Boxberger, T., et al. (2014). Toward a loss-driven earthquake early warning and rapid response system for Kyrgyzstan (Central Asia). Seismol. Res. Lett. 85, 1328–1340. doi: 10.1785/0220140106
Pittore, M., and Haas, M. (2018). GFZ-Centre-for-Early- Warning/bottom_up_exposure_modelling: first public release.
Pittore, M., Haas, M., and Megalooikonomou, G. K. (2018). Remote Rapid Visual Screening (RRVS) Buildings Survey Data - DESTRESS - France.
Pittore, M., and Wieland, M. (2013). Toward a rapid probabilistic seismic vulnerability assessment using satellite and ground-based remote sensing. Nat. Hazards 68, 115–145. doi: 10.1007/s11069-012-0475-z
Pittore, M., Wieland, M., and Fleming, K. (2017). Perspectives on global dynamic exposure modelling for geo-risk assessment. Nat. Hazards 86, 7–30. doi: 10.1007/s11069-016-2437-3
Rivard, H., and Fenves, S. J. (2000). A representation for conceptual design of buildings. J. Comput. Civil Eng. 14, 151–159. doi: 10.1061/(ASCE)0887-3801(2000)14:3(151)
Schwarz, J., Raschke, M., and Maiwald, H. (2006). Comparative seismic risk studies for German earthquake regions on the basis of the European Macroseismic scale EMS-98. Nat. Hazards 38, 259–282. doi: 10.1007/s11069-005-8638-9
Tyagunov, S., Stempniewski, L., Grünthal, G., Wahlström, R., and Zschau, J. (2004). “Vulnerability and risk assessment for earthquake-prone cities,” in Proceedings of the 13th World Conference on Earthquake Engineering (13 WCEE) (Vancouver, BC), 1–6.
Verrucci, E., Bevington, J., and Vicini, A. (2014). “Application of the GEM inventory data capture tools for dynamic vulnerability assessment and recovery modelling,” in EGU General Assembly Conference Abstracts, Volume 16 of EGU General Assembly Conference Abstracts, 15707.
Wieland, M., Pittore, M., Parolai, S., Begaliev, U., Yasunov, P., Niyazov, J., et al. (2015). Towards a cross-border exposure model for the Earthquake Model Central Asia. Ann. Geophys. 58, 1–8. doi: 10.4401/ag-6663
Yepes-Estrada, C., Silva, V., Valcrcel, J., Acevedo, A. B., Tarque, N., Hube, M. A., et al. (2017). Modeling the residential building inventory in South America for seismic risk assessment. Earthq. Spect. 33, 299–322. doi: 10.1193/101915EQS155DP
Keywords: seismic risk, exposure, building stock, vulnerability, multi-hazard, taxonomy
Citation: Pittore M, Haas M and Megalooikonomou KG (2018) Risk-Oriented, Bottom-Up Modeling of Building Portfolios With Faceted Taxonomies. Front. Built Environ. 4:41. doi: 10.3389/fbuil.2018.00041
Received: 31 March 2018; Accepted: 09 July 2018;
Published: 08 October 2018.
Edited by:
Hussam Mahmoud, Colorado State University, United StatesReviewed by:
Michele Palermo, Università degli Studi di Bologna, ItalyBenedetto Nastasi, Delft University of Technology, Netherlands
Copyright © 2018 Pittore, Haas and Megalooikonomou. This is an open-access article distributed under the terms of the Creative Commons Attribution License (CC BY). The use, distribution or reproduction in other forums is permitted, provided the original author(s) and the copyright owner(s) are credited and that the original publication in this journal is cited, in accordance with accepted academic practice. No use, distribution or reproduction is permitted which does not comply with these terms.
*Correspondence: Massimiliano Pittore, pittore@gfz-potsdam.de