Physical Modeling and Numerical Analysis of Tsunami Inundation in a Coastal City
 Adi Prasetyo
 Tomohiro Yasuda
 Takuya Miyashita
 Nobuhito Mori
- 1Research Center for Water Resources, Ministry of Public Works and Housing, Bandung, Indonesia
- 2Faculty of Environmental and Urban Engineering, Kansai University, Osaka, Japan
- 3Disaster Prevention Research Institute, Kyoto University, Kyoto, Japan
This study conducted a physical model experiment to investigate inundation processes in a complex coastal city model using the Hybrid Tsunami Open Flume in Ujigawa Open Laboratory (HyTOFU). The physical model was constructed at a 1:250 scale as an idealization of the coastal town of Onagawa. Two tsunami waveforms were used, hydraulic bore and solitary wave, which were produced by a pump-type wave generator and a mechanical piston-type wave generator, respectively, at HyTOFU. Tsunami wave generation similar to the 2011 Tohoku earthquake tsunami in Onagawa was successfully reproduced, and the spatial distribution of the tsunami wave propagation and inundation processes on land was clearly observed. A comparison of experimental and numerical models was performed using two-dimensional (2D) and quasi-three-dimensional (Q3D) models. The 2D and Q3D results agreed well with the experimental results in terms of maximum water surface elevations and arrival times for hydraulic bore conditions. For solitary wave trials, the maximum water surface elevations of the 2D results were underestimated, and the arrival times in the numerical models were slower than those in the experimental results. In this study, as a benchmark for the 2011 Tohoku earthquake tsunami, the dataset of tsunami inundation is provided, which will be useful to validate other numerical tsunami models.
Introduction
Coastal urban cities are some of the most vulnerable regions threatened by natural disasters. The consequence of catastrophic disasters in coastal regions affects human life on a large scale, and the number of fatalities and amount of financial loss are becoming worse. According to the 2011 Tohoku Earthquake Tsunami Joint Survey Group report, tsunami inundation heights were observed along a 2,000-km stretch of the Japanese coast from Hokkaido to Kyushu, where the maximum run-up heights of >20 m were distributed along 290 km of coast, and over 400 km2 of land was inundated (Mori et al., 2011). Kron (2013) stated that the 2011 Tohoku earthquake tsunami became the costliest natural disaster in the world with a total loss of US $210 billion. Additionally, 15,844 victims made the 2011 event the second deadliest tsunami in the last two decades after the more than 220,000 fatalities in the 2004 Indian Ocean tsunami event.
In the 2011 Tohoku earthquake tsunami, the tsunami inundation was reported to be larger than expected, and the infrastructure destruction occurred over a wide range (Mori et al., 2011; Mase et al., 2013). To minimize the effects of a tsunami and to reduce the infrastructure destruction along the coastal regions in future events, understanding the tsunami inundation over the coastal urban cities is very important. The dynamic features of tsunami inundation, such as tsunami flow depth, inundation depth distribution, flow velocity, and hydrodynamic force, play essential roles in analyzing structural building damage. Yeh et al. (2013) found that the inundation depth and flow velocity had significant effects on the failure of coastal infrastructure and buildings. However, prediction of tsunami inundation based on the inundation depth and velocity still lacks accuracy because tsunami behavior is also affected by beach slope conditions and the shape of structures (Han et al., 2015). The interaction between tsunami inundation, bathymetry conditions, and structures on land is very complex but should be considered to determine the tsunami damage. Moreover, the onshore tsunami behavior and tsunami inundation processes associated with the force acting on structures are not yet well-understood and should be further investigated, particularly for large tsunami events.
One lesson learned from the 2011 tsunami is that adequate understanding of tsunami processes in nearshore regions and inundation characteristics in the urban area is very important. When the tsunami enters the shallow nearshore area, the wavelength and velocity decrease, while the wave height increases significantly, leading to a devastating force. According to Hayashi et al. (2011) and Kawai et al. (2013), the 2011 tsunami water surface elevation profile recorded on GPS buoys was complex in terms of characteristic and shape. The tsunami was transformed from the initial impulsive wave with a steep and high crest in a short period followed by a wave train with high constant height for a long period. Koshimura and Hayashi (2012) presented a thorough observation of overland flow conditions at the nearshore of Onagawa (38°26′30.24″N, 141°26′50.32″E) based on the interpretation of video footage on March 11, 2011, as seen in Figure 1. In the first 3 min, the water level rose about 2 m. Then, the water level rose dramatically and quickly reached its maximum height of about 15 m above sea level. Its height would be considered the target maximum surface elevation of the 2011 Tohoku tsunami. The duration of the tsunami run-up was about 14 min, and the flow velocity was about 6–8 m/s. To improve the technique of generating a numerical and physical model of the tsunami, a reproduction of the 2011 tsunami-like wave with a combination of high-resolution bathymetric and topographic data has proven more challenging, especially in the case of urban coastal cities.
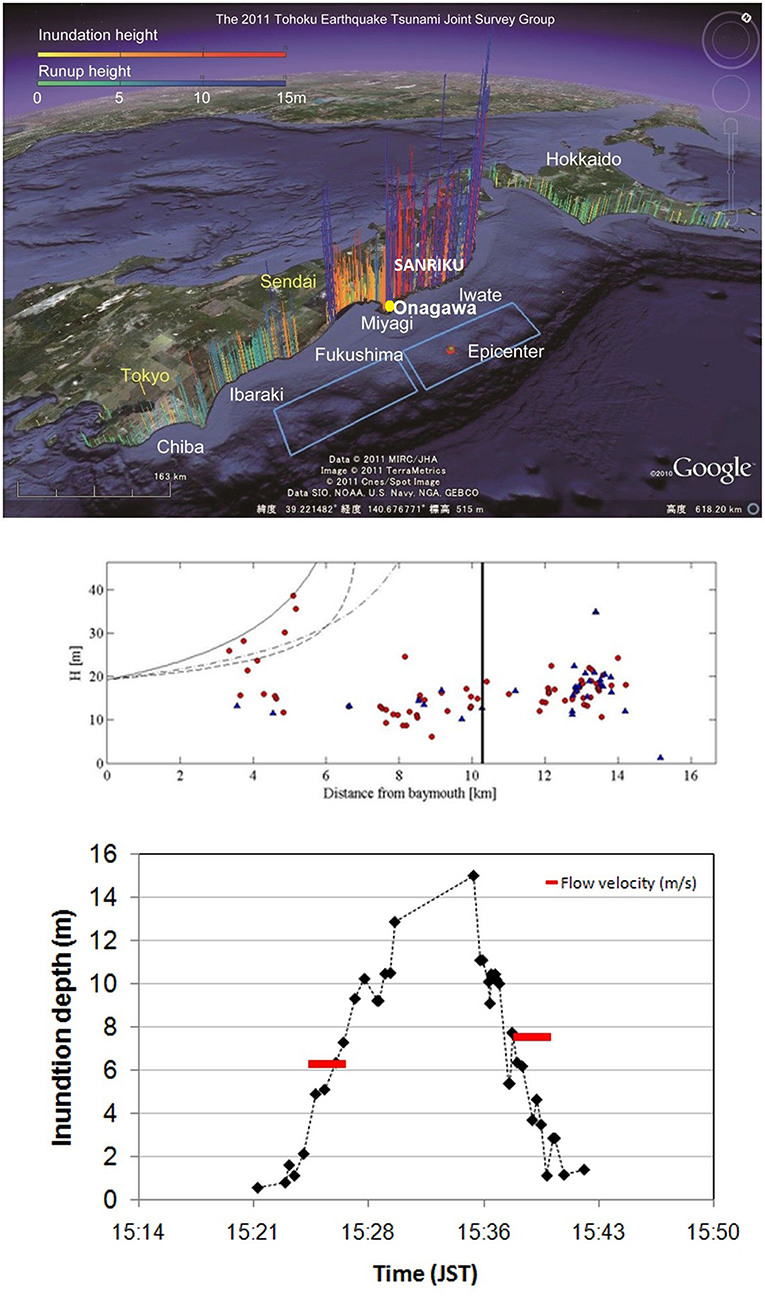
Figure 1. Observed inundation heights (TTJS Survey Group; Mori et al., 2011) and time histories of inundation depth and flow velocity at Onagawa town (Koshimura and Hayashi, 2012).
In the last few decades, the use of numerical models has improved rapidly due to the development of the numerical scheme and computational resources. Using the numerical model, offshore tsunami propagation and generation can be accurately estimated and predicted. However, current numerical scheme is not strong enough to model the tsunami hydrodynamic processes including the tsunami inundation and run-up associated with the complex bathymetry condition, topography, and macro-roughness elements in the coastal area (e.g., Park et al., 2013; Pringle and Yoneyama, 2013; Miyashita et al., 2015; Adriano et al., 2016). The validation of the numerical model is still unclear due to the simplification of the numerical schemes and the limitations of the observation data, particularly for an extreme tsunami occurrence. Briggs et al. (2008) noted that the physical model is one of the best instruments to simulate the complex physics of tsunami transformation, such as the inundation and overland flow, wave-breaking process, and wave forces on structures with the ease of controlling input parameters and conditions. Therefore, the physical model test is believed to be an essential solution to understand the complex tsunami processes in nearshore and coastal areas.
Many research studies have performed the physical model test to investigate the tsunami inundation in coastal areas (Bridges et al., 2013; Palermo et al., 2013; Thomas et al., 2014; Kihara et al., 2015; Prasetyo et al., 2016; Yasuda et al., 2016). However, only a few studies have been conducted in complex urban cities. For example, Tomiczek et al. (2016a) investigated the tsunami flow patterns in complex arrays of box structures representing macro-roughness elements. The presence of an idealized macro-roughness obstacle significantly affected the onshore wave propagation by changing the water surface profile compared to the bare-earth configuration. More detailed investigations about the effects of macro-roughness elements on inundation processes were conducted by Cox et al. (2008) and Park et al. (2013). They performed a physical model of a tsunami run-up in the city of Seaside, Oregon. They also used rectangular blocks as a representation of buildings and residential houses on a flat topography. A numerical analysis using COULWAVE was also conducted to verify the model sensitivity with the experimental results. However, to improve the validation and verification process of the numerical model results, an experimental model with high-resolution bathymetric and topographic data of the tsunami inundation over a coastal city is needed (Park et al., 2013).
Another key issue is the reproduction of an appropriate tsunami-like wave for the laboratory model test. Many researchers have modeled various waves, such as a solitary, N-shape, or long-sinusoidal waveforms, as an idealization of a tsunami wave profile. The solitary wave generation in a tsunami experimental model has been used widely on both small and large scales. For example, the piston-type wave generator has commonly been used to generate solitary waves (e.g., Fujima et al., 2009; Oshnack, 2010; Park et al., 2013). Synolakis (1986, 1987) conducted the experiments using a piston-type wave generator to investigate the run-up of long waves and solitary waves. Allsop et al. (2008) and Rossetto et al. (2011) developed a pneumatic wave generator to generate the solitary and N-wave with a full wavelength. Goseberg et al. (2013) used the pump-driven wave generations to produce single sinusoidal, prolonged solitary, and N-wave waveforms with enhanced accuracy and applicability in experimental tests. However, those laboratory experiments are not yet appropriate or applicable to the real-scale tsunami. Madsen et al. (2008) argued that the use of the solitary wave as a representation of a tsunami is inappropriate due to the discrepancies and lack of geophysical justification between the realistic scenario conditions and the model-scale experiment, particularly regarding the wavelength or wave periods. Moreover, this may cause a misinterpretation of the experimental results, considering the physical quantities, such as the pressure or velocities whose significant temporal distributions are of great interest (Goseberg et al., 2013).
The objectives of this study are the following:
1) Reproduce the 2011 Tohoku earthquake-like tsunami with higher detail and accuracy;
2) Investigate local tsunami behavior, tsunami inundation, and other hydrodynamic processes on complex land structures in coastal areas with high-resolution topographic and bathymetric data;
3) Validate the numerical model of the two-dimensional (2D) non-linear shallow water equation model (NSWE) and the quasi-three-dimensional (Q3D) model on the Euler equation of the regional ocean model system (ROMS) using a dataset of physical experimental results based on the 2011 Tohoku earthquake tsunami event; and
4) Provide the tsunami inundation dataset as a benchmark for the 2011 Tohoku earthquake tsunami that will be useful to validate other tsunami numerical models.
This study has created a physical model of a tsunami inundation in a coastal city using the innovative tsunami wave generator in the Hybrid Tsunami Open Flume in Ujigawa Laboratory (HyTOFU). The tsunami waveform was generated by two different mechanisms: a pump-type wave generator that produces a hydraulic bore or hydraulic bore waveform, and a mechanical piston-type wave generator that produces a solitary waveform (Hiraishi et al., 2015, 2016; Prasetyo et al., 2015). A comparison between the physical and numerical model results was examined using two different numerical models, a 2D model based on NSWE and a quasi-3D model based on the Euler equation (Q3D-ROMS).
Physical Modeling
The town of Onagawa in Miyagi Prefecture is selected for physical modeling due to the size of the experimental facility and town. Onagawa is located in the northern part of Tohoku, part of the Sanriku ria coastline, and is one of the coastal urban regions that was devastated by the 2011 Tohoku earthquake tsunami. According to Suppasri et al. (2013), there were 816 fatalities with an additional 125 missing (about 12% of the total population) and 3,888 houses were damaged (about 85% of the total housing) in Onagawa. The geomorphology in this area is characterized as a ria coast with steep terrain and a narrow bay, resulting in the large tsunami run-up in the 2011 Tohoku earthquake tsunami event. The recorded inundation height in the Sanriku coastal area was two times higher than that measured on the Sendai plain, but the area inundated by the tsunami was smaller than that on the Sendai plain (Mori et al., 2011). Considerable post-survey data are available. For example, the inundation depths that occurred at the coastal area (B1) and the Onagawa hospital (B2) were observed at about 15 m and 1.95 m from the ground level based on the interpretation of the video footage on March 11, 2011, and on the surveyed data, respectively. Figure 2A shows the location of Onagawa town in the Sanriku region and the boundaries of the 1:250 of physical model. The details of the experimental and numerical model setup will be discussed in the following sections.
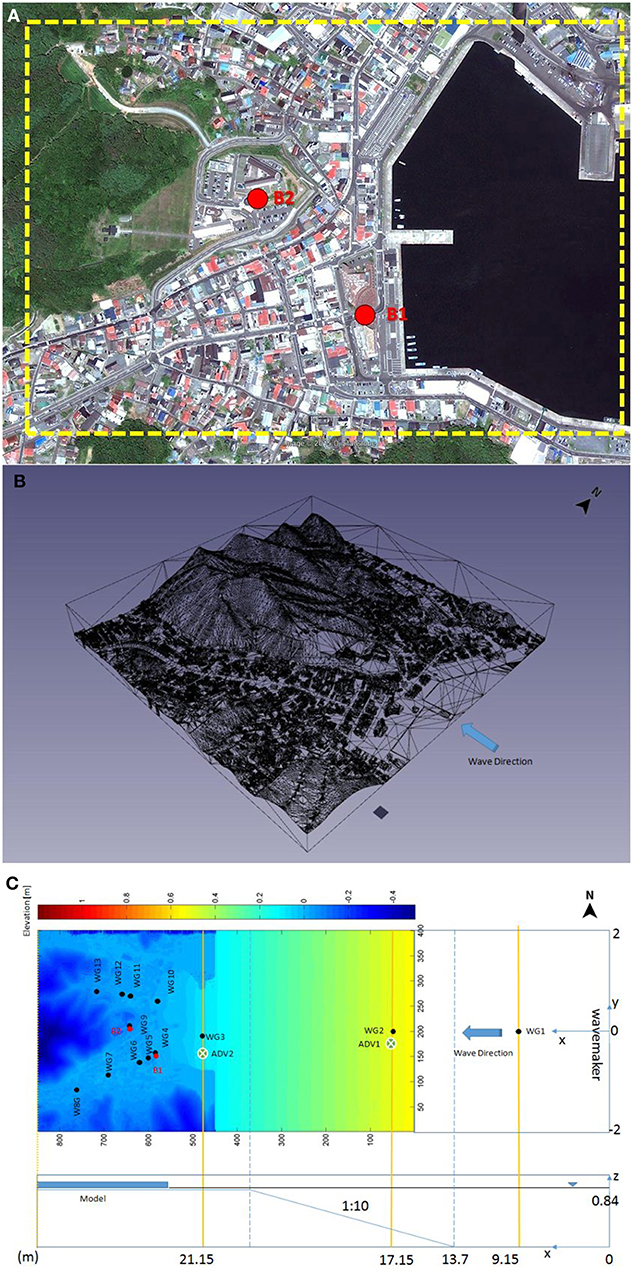
Figure 2. Area of study in the physical and numerical modeling. (A) Target area of study indicated dashed-yellow line [benchmark points, (B1) at the coast, (B2) on the Onagawa Hospital]. (B) The aerial laser scanned of 1:250 Onagawa physical model, and (C) The schematic view of the Onagawa model in the flume (black dot: wave gauge indicated WG1-WG13; cross dot: ADV indicated ADV1-ADV2).
Experimental Setup
This experiment was conducted at the Ujigawa Open Laboratory, Disaster Prevention Research Institute (DPRI), Kyoto University, using the HyTOFU. The HyTOFU is composed of a main flume, sub tank, flow pump with rectifier, and wave generator. Flume dimensions are 45 m long, 4 m wide, and 2 m deep. The 1:250 physical model (4 × 6 m) was based on an aerial laser scanned digital elevation model before 2011 and was constructed in the main flume as shown in Figures 2B,C. The physical model represents the bathymetry condition of the Onagawa shore with a 13.7 m long flat sea floor section from the wave generator, followed by 1:10 planar slope section, and ending with a beach section where the Onagawa model was installed. The sea floor section was constructed from concrete and plastered with smooth cement mortar, while the slope section was made of a coated iron plate. The constant water depth was set as the mean water level at 0.84 m. The Onagawa town profile was downscaled and fixed in place with detailed accuracy, consisting of real topography and urban coastal infrastructure (e.g., buildings, houses, and streets as well as hills and mountains) comprising macro-roughness elements. Vegetation and debris were not included. The buildings and other structures were made with painted plywood, and the irregular shapes, such as the hills, were made from painted polystyrene foam. The schematic view of the physical model in the flume is depicted in Figure 2C. The x-axis and y-axis in the figure are the defined wave directions from offshore and the middle of the wave flume, respectively. The shoreline is located at 17.15 m from the wave maker.
In this study, two tsunami waveforms were used: the hydraulic bore wave and solitary wave, which were produced by a pump-type wave generator and mechanical piston-type wave generator, respectively. The maximum discharge of the pump generator is 0.833 m3/s, or equivalent to a 0.1 m increase in the water surface elevation. The piston paddle was able to generate a solitary wave up to 1.0 m using a 2.5 m maximum stroke. Several tests were performed to achieve the target maximum inundation depths at benchmark locations (B1 and B2) for both solitary waves and the hydraulic bore. The test was repeated two times for each experiment. The coordinate system of the model is aligned as follows: x is positive in the direction of the wave propagation shoreward with x = 0 at the zero position of the piston-type wave generator, y is positive to the north with y = 0 on the middle of the flume, and z is positive upward with z = 0 on the bottom of the flume.
Instrumentation and Conditions
To measure the water surface elevation of the target tsunami wave, 13 capacitance-type wave gauges were installed in the flume. One wave gauge was set up at the sea floor section. Two wave gauges were installed on the slope, and the remaining wave gauges were placed in the model on the urban section. The wave gauges were mounted on a beam in the flume axis and could be adjusted by an automatic up and down apparatus (EPT5-50 KENEK). The wave gauge model number is CH-604E KENEK with a sampling rate of 20 Hz. The linearity error is ±0.3% of the full scale, and the responsivity is 10 Hz. Moreover, the first wave gauge (WG1) was located at x = 9.15 m from the wave generator, and WG2 was installed at the onset of the beach slope, at x = 17.15 m, while WG3 was located near the coastline at x = 21.15 m. In addition, WG4, which was set as benchmark B1, was set at the front of the beach at x = 22.2 m, and WG9 (benchmark B2) was set at the hospital at x = 22.84 m. Other wave gauges were installed on the land side with a specified location, as listed in Table 1. Five wave gauges were placed parallel along the street at the southern side of the physical model (WG4–WG8), and four wave gauges were placed at the northern side of the physical model (WG10–WG13). All wave gauges were calibrated before each experiment.
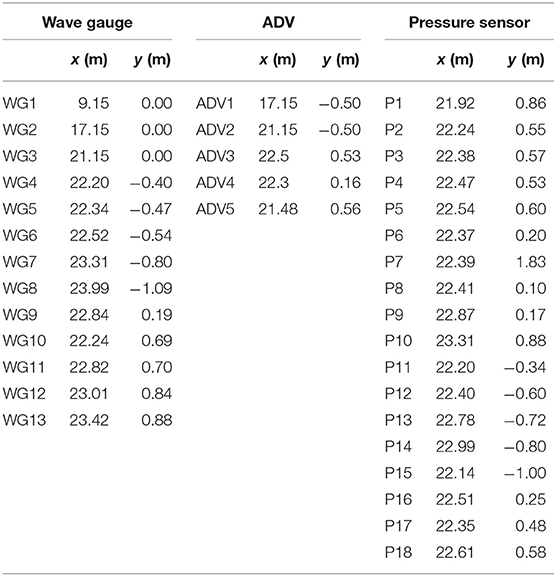
Table 1. Coordinates of wave gauges, ADV, and pressure sensors in the physical model.
Water velocities were measured using an acoustic Doppler velocimeter (ADV). Two ADV Vectrino II profilers were used to measure the flow velocity seaward of the model, and three ADV Vectrino single-point were used to measure the inundation velocity landward of the coastal areas. The ADV1 and ADV2 were mounted on a beam at same location of WG2 and WG3, respectively, while the other ADVs were installed around building structures on the land side. To minimize the noise when measuring wave velocity in small inundation depth conditions, kaolin (clay mineral) was added into the flume during the experiment. The ADVs are manufactured by Nortek Vectrino with a sampling rate of 100 Hz for velocity measurements with an accuracy of ±0.5% of the measured value ±1 mm/s. The velocity range incremented by 0.1 m/s to a maximum of 3.0 m/s. The range of sampling volume was up to 30 mm with a distance of 45–75 mm from a probe.
To investigate the wave forces acting on the model structures on land, 19 pressure sensors were placed on the building models. The sensors were installed at the lowest elevation of the structures on either the front or lateral sides of specific buildings. The sensors PS-05KC are manufactured by Kyowa and have a maximum rate capacity of 50 kPa with a sampling rate of 200 Hz and natural frequencies of ~10 kHz with the rated output of ~0.250–0.317 m V/V ± 1% and a resistance of 350 Ω ± 10%. The pressure sensors were calibrated before each experiment.
Tsunami wave propagation on land was observed in order to investigate the temporal and spatial distribution of the tsunami inundation. The inundation propagation was captured using a 4K video camera, SONYFDR-AX30. The resolution of the image device is ~18.9 megapixels for photographs and 8.29 megapixels for video. The frame rate is 30 fps. The camera was mounted over the physical model with a fixed position. Before running an experiment, fluorescent dye was added into the water near the shore, and several ultraviolet (UV) lights were installed over the model. In dark conditions, the fluorescent dye will glow when exposed to UV light. Therefore, the leading edge of the tsunami inundation was automatically detected and tracked by the code.
Tests were conducted 15–20 min apart to allow the water surface to calm. The building and coastal areas were dried before each experiment using air blowers. The generation of solitary and hydraulic bore waves was performed to achieve 7.50 cm of water surface elevation at WG4, the lowest onshore measurement location (corresponding to 15 m high on the real scale) and 0.98 cm at WG9, the highest of measurement location (corresponding to 1.95 m high on the real scale). The wave period of 60 s corresponded to 14 min on the real scale. In this study, two different inundation experiments of hydraulic bore and solitary waves were conducted using the pump-type wave generator with 0.133 m3/s discharge (denoted as Case 1) and the mechanical piston-type wave generator with a 3 cm initial wave height (denoted as Case 2), respectively.
Numerical Modeling
The numerical modeling based on NSWE and the Euler equation have been widely used to model the tsunami inundation (e.g., Imamura, 1996; Goto et al., 1997; Titov et al., 2005; Wang and Liu, 2006). The 2D-NSWE is used in TUNAMI-N2 (Goto et al., 1997), which has been used to simulate tsunami propagation from offshore to inland areas in Japan and other countries. The Q3D numerical model based on the Euler equation is used in the ROMS (Shchepetkin and McWilliams, 2005). Several studies have been conducted to investigate tsunami inundation behavior acting on coastal buildings using both 2D and Q3D models. Miyashita et al. (2015) examined a series of numerical simulations using Q3D and 2D models to estimate the characteristics of surface elevation and velocity of a tsunami in real city conditions. The effectiveness of an offshore breakwater of Kamaishi Bay in Iwate Prefecture off the Pacific Coast for the 2011 Tohoku earthquake tsunami was examined using 2D and Q3D models (Pringle and Yoneyama, 2013; Mori et al., 2014).
Governing Equation
A series of numerical simulations was performed to estimate the characteristic water surface elevation and spatial distribution of a tsunami inundation in the Onagawa physical model test. The numerical modeling was conducted for inundation using two different methods. The first numerical model used a conventional 2D-NSWE, which was derived assuming it was irrotational and viscid with hydrostatic pressure distribution. The 2D-NSWE method was developed in house, but it follows the standard methodology of tsunami wave modeling. The second numerical model is the Q3D-ROMS based on the Euler equation with curvilinear-sigma coordinates. This model also assumes hydrostatic pressure distribution but allows arbitrary distribution of vertical velocity without irrotational and viscid assumptions. The Q3D model can resolve both the tsunami wave motion and bathymetry effects independently from discretization.
In the 2D-NSWE, the governing equations consist of continuity and momentum equations. Based on the shallow water theory, the continuity equation can be described as follows:
where η is the sea-surface elevation, and M and N are depth-averaged volume fluxes in the x-axis and y-axis directions, respectively. The equations of momentum are written as follows:
where u and v are the x and y components of water velocity, D = (h + η) is total water depth, h is the still water depth, g is the gravitational acceleration, and τbx and τby are the bottom friction in the x- and y-directions, which are functions of the friction coefficient f and the total water depth D.
The Q3D-ROMS model employs a set of free-surface, sigma (terrain-following) coordinate, and hydrostatic primitive equations derived by Shchepetkin and McWilliams (2005). The continuity equation for an incompressible fluid is written as follows:
where u, v, and w are the (x, y, z) components of the vector velocity. The momentum equations in the standard coordinate in the x- and y-directions are written as follows:
where f is the Coriolis parameter, φ (x, y, z, t) is the dynamic pressure, Fuand Fv are forcing terms, and Duand Dv are diffusive terms. Under the hydrostatic approximation, the vertical pressure gradient balances the buoyancy force and pressure can be written as follows:
where φ (x, y, z, t) = (P/ρo) is the dynamic pressure, P is the total hydrostatic pressure, and ρo is the density of water. The Q3D model differs in the vertical velocity profile in comparison with the 2D-NSWE, although both models assume hydrostatic pressure.
Numerical Setup
The numerical models directly used bathymetry and topography laser scanned data with 1 mm resolution from the Onagawa physical model in the flume. The computational area was determined to be 9.2 m length in the x-direction and 4.0 m in the y-direction. The astronomical tide was not included in the computations, and the water depth was set to the mean water level.
In the 2D-NSWE, the grid size was set as 1 cm. The wet-dry and radiation boundary conditions were applied to both the onshore and offshore boundaries. The bottom roughness conditions were used based on the Manning model with roughness coefficients of 0.025 for the seaward side and 0.013 for the landward side (Kotani et al., 1998). The total computational time is 3,000 time steps with a time step of 0.05 s. The computational output interval is 1 s. The given offshore boundary condition is the surface elevation at the open boundary (WG2).
In the Q3D-ROMS, a rectangular coordinate system and Arakawa-C grid was adapted in the horizontal direction, and sigma coordinates were used in the vertical direction with 10 layers. The horizontal grid size was set as 4 cm. The wet-dry and radiation boundary conditions were also applied to both onshore and offshore boundaries. The total computational time is 12,000 time steps with a time step of 0.0125 s. The computational output interval is 1 s. The offshore boundary condition is the surface elevation at the open boundary (WG2) offshore. The north and south ends are closed boundaries.
For both models, a series of water surface elevations of the physical model at WG2 was used as the initial tsunami water level input. The characteristics of the inundation over the urban area in Onagawa are analyzed using two models with experimental results in the next section.
Results and Discussion
Experimental Results
In this section, the spatial distribution of tsunami inundation, time histories of water surface elevation, wave pressure and flow velocities are presented for both Case 1 (hydraulic bore) and Case 2 (solitary wave). Both in-situ instruments and video images are used for analysis.
The spatial distribution of the tsunami inundation area and depth in the physical model were analyzed. The leading edge of tsunami inundation on the model was extracted by analyzing experimental videos with a frame frequency of 30 fps. The image intensity was adjusted to enhance the fluorescent dye and edge detection using the Sobel method, which was applied to detect the leading edge of the water. We divided the area of interest into two regions: the northern and southern sides of the model (see orientation in Figure 2). On the southern side, the tsunami wave can directly enter the street freely from WG4 to the most inland location of WG8 without any disturbance from other obstacles or buildings. On the other hand, the array of wave gauges along the street on the northern side from WG10 to WG13 was shielded by several buildings. The topographic elevation of the southern region ranged from coastal areas to landward from +0.009 to +0.024 m in model scale. In the northern region, topographic elevation was steeper than the southern region and ranged from +0.012 to +0.050 m.
Time Histories of the Water Surface Elevation
Time histories of the water surface elevation for Case 1 at WG4 (benchmark location B1) and WG9 (benchmark location B2) are shown in Figure 3A. The x-axis indicates the time duration, and the y-axis indicates the variation of the water level. After the wave propagated from offshore, the leading edge of the tsunami wave reached WG4 at t = 12 s for Case 1. An initial impulsive wave was observed at the beginning of the waveform and was followed by a quasi-steady flow with a nearly constant water level (about 2 cm). This constant flow occurred due to a reflected wave propagating shoreward after the leading edge of the tsunami wave hit the structures onshore. After that, the water level increased gradually until it reached the maximum inundation depth. The measured maximum water level of about η = 7.62 cm at t = 69.6 s agreed fairly well with the target maximum surface elevation, which was observed during the post-event survey in the 2011 Tohoku earthquake tsunami. The leading edge of the inundation arrived at WG9 at t = 64.0 s. The measured maximum water surface elevation at WG9 was about η = 0.58 cm or 40% less than the target maximum surface elevation. Figure 3B shows time histories of water surface elevation for Case 2. The sharp flow profile was observed at t = 11.0 s for Case 2. The flow increased instantaneously and reached the maximum water level. The maximum water level at WG4 agreed fairly well with the target tsunami inundation depth, about η = 7.77 cm at t = 14.65 s. On the other hand, the measured maximum water level at WG9 was about η = 0.82 cm or 16.3% less than the target maximum surface elevation.
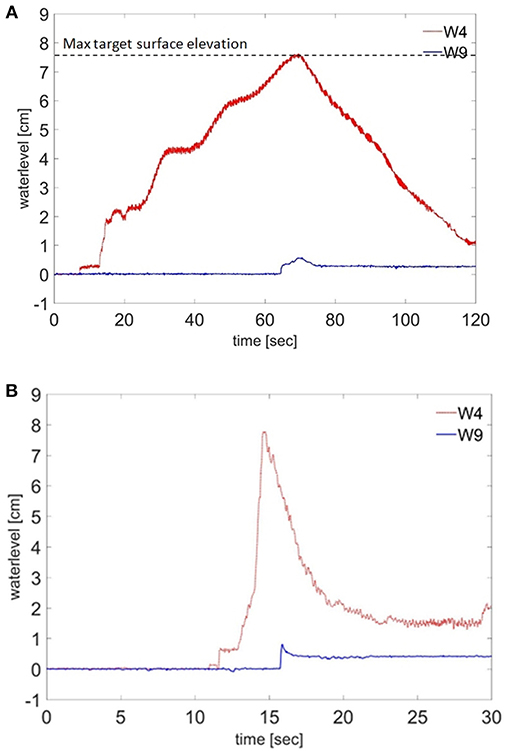
Figure 3. Time histories of the water surface elevation at location of benchmark: (A) Case 1 by pump-type wave generator, and (B) Case 2 by piston-type wave generator (red line: water level at WG4, blue line: water level at WG9).
This observation demonstrates that both hydraulic bore and solitary waves resulting from the HyTOFU wave generator are able to reach the water surface elevation target within the following conditions:
1) The benchmark location should be conducted nearshore.
2) The on-land topography elevation should close to the mean sea level.
3) The incoming tsunami waves propagate on land with no obstacle.
This finding is proven by Tomiczek et al. (2016b), who showed the HyTOFU could produce both bore and solitary waves within the targeted water surface elevation when conducted on a flat topography with distance varied from the coastline to x = 24.3 m. In this study, this observation provides a complementary result that the water surface elevation from bore and solitary waves could not reach the targeted elevation on the WG9 benchmark location since it was located higher than the sea level elevation. Within this condition, the water propagation from offshore to onshore experienced an interaction process with the topography elevation and the urban coastal infrastructure to reach the targeted elevation. This experiment also indicates that the high-resolution digital elevation model and real-scale structures could influence measurement accuracy, which is not identified in previous studies. Therefore, this observation concludes that an accurate consideration of the following conditions is required to set the tsunami inundation depth: (1) the tsunami run-up is located far from the coastline, (2) there are structures near the shore, and (3) there are different levels of topography conditions.
In general, the target maximum surface elevation at locations near the coastline (WG4) was successfully reproduced in comparison with the 2011 Tohoku earthquake tsunami for Cases 1 and 2. However, the maximum surface elevation at WG9 was underestimated compared with the survey data. The results of this experiment showed that physical models can represent tsunamis well for locations close to the coastline but must take care regarding the locations farther from the coastline. The topography elevation difference and the presence of macro-roughness elements contribute significantly to the accuracy of the results. The roughness coefficient also seems to have a significant role. The condition of the wet model (even though we have tried our best to dry the model before the experiment started) seems to have an effect, where the real condition is dry. Therefore, the existence of macro-roughness elements (e.g., buildings and houses) and the topographic variation significantly contributed to the reduction of the water level at locations far from the coastline. It also clearly shows that wave energy dissipation due to interaction between the tsunami wave and the structures on land results in the reduction of the water surface elevation.
The Spatial Distribution of the Tsunami Inundation
Figure 4 shows snapshots of the tsunami inundation on the physical model for Case 1. In Figure 4a, the reference time was set at t = 0 when the leading edge of the tsunami wave first reached the coastline (x = 21.9 m). In Figure 4b, the flow propagated onto the flat-beach and had reached the benchmark (WG4) located at x = 22.20 m in t = 0.87 s. Then, the initial impulsive flow hit the buildings on the northern and southern sides. After the initial impact, some water was reflected shoreward and developed an inundation waveform as a quasi-steady flow with nearly constant speed as shown in Figure 4c. Figure 4 shows that the inundation behavior generally had a similar pattern, and the inundation distance was similar for both the northern and southern regions. In Figure 4d, the leading edge of the flow entered the street in both regions at t = 5 s. The extent to which the leading edge of the flow propagated inland in the southern region (x = 23.31 m) was farther than that in the northern region. The flow speed in the southern region was faster than in the northern region. Based on the arrival time of the flow edge at each gauge, the average inundation speed in the southern and the northern regions was calculated at about 0.27 and 0.15 m/s, respectively. The existence of macro-roughness elements (e.g., buildings and houses) and steeper topography conditions were recognized as the reason for the inundation speed reduction along the street in the northern region. Spatial distribution of the tsunami inundation, which reached the farthest wave gauge location at x = 23.99 m for the southern region (WG8) and x = 23.42 m (WG13) for the northern region, is depicted in Figures 4e,f, respectively. Figure 4f clearly shows that most of the buildings were immersed in water at t = 19.67 s. Figure 4g shows the spatial distribution of inundation where the leading edge of the flow had arrived at the highest elevation of the measurement location (WG9). The physical model condition 61 s after the tsunami flow propagated inland is depicted in Figure 4h, where almost the entire area was inundated by water. In this time, the maximum surface elevation was recorded at each wave gauge before receding shoreward. The inundation profile and maximum water surface elevation in the regions of interest will be discussed in the next section.
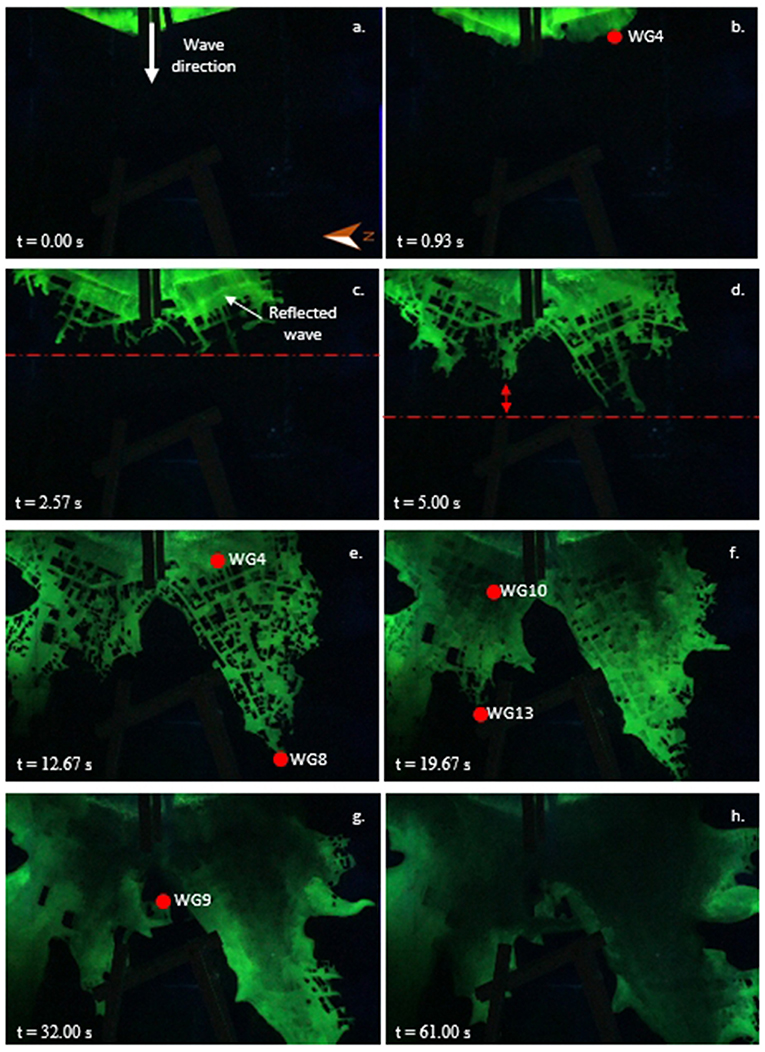
Figure 4. Snapshots of the tsunami inundation on the physical model for Case 1 (green color: fluorescent dye water, red circle: location of wave gauges). (a) t = 0, (b) t = 0.93, (c) t = 2.57, (d) t = 5, (e) t = 12.67, (f) t = 19.67 s, (g) t = 32 s, and (h) t = 61.
Figure 5 shows the spatial distribution of the tsunami inundation on the physical model for Case 2. Figure 5a was set as the initial flow arrival time. In general, the flow pattern propagation inland for Case 2 is quite similar to Case 1 at 0 s < t < 7.33 s, as seen in Figures 5b–f. However, the propagation speed on land for Case 2 is faster than that of Case 1. For example, the time required for the flow edge in Case 2 to reach WG9 was about 3.70 s, as shown in Figure 5g. It was about 28.30 s, almost nine times faster than Case 1. Based on the arrival time of the flow edge at each gauge, the average inundation speed in the southern and northern regions was calculated to be about 0.33 and 0.25 m/s, respectively. The regions when the maximum inundation phase had reached t = 9.67 s before receding to shoreward are shown in Figure 5h. This result is not surprising because of the difference of speeds between the flow (Case 1) and wave (Case 2). Details of the analysis for the arrival time will be discussed in section Comparison Between Experimental and Numerical Results.
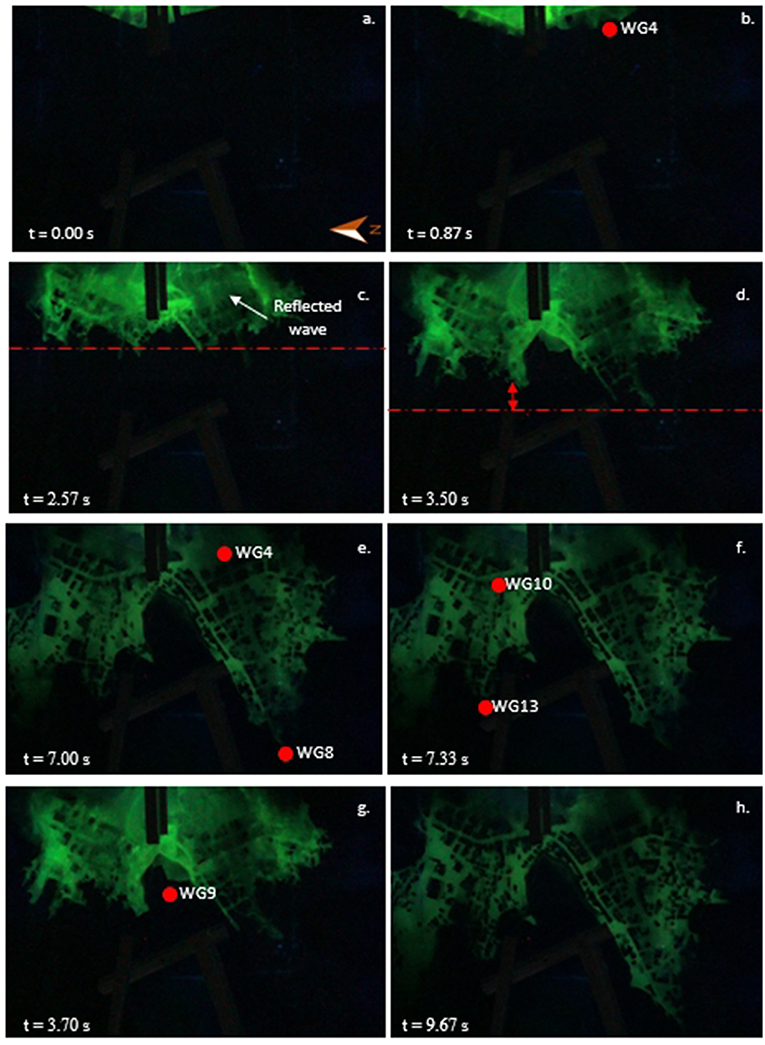
Figure 5. Snapshots of the tsunami inundation on the physical model for Case 2 (green color: fluorescent dye water, red circle: location of wave gauges). (a) t = 0, (b) t = 0.87, (c) t = 2.57, (d) t = 3.5, (e) t = 7, (f) t = 7.33 s, (g) t = 3.7 s, and (h) t = 9.67.
Another interesting finding was observed when the flow propagated inland before reaching the maximum inundation phase. Most of buildings were immersed in water at 0 s < t < 3.50 s for Case 2. In contrast, few buildings were submerged by water for Case 1 at 0 s < t < 5.00 s. Moreover, the inundation flow speed at each wave gauge in the southern region for Case 2 is ~1.0–1.81 times faster than that measured during Case 1, while in the northern region, the flow speeds are ~1.04–2.68 times faster. At the peak of the maximum inundation, the total area of inundation for Case 1 is larger than that of Case 2. The duration of the tsunami inundation for the solitary wave condition was too short, as expected. It is clear that modeling the tsunami inundation on land using solitary wave generation does not accurately represent the time scale of the 2011 Tohoku earthquake tsunami.
On the other hand, the spatial distribution of the tsunami inundation results agreed well between the physical modeling and observation data for the hydraulic bore conditions. In terms of the tsunami magnitude and the time period, the hydraulic bore wave could represent a tsunami-like wave close to the 2011 Tohoku earthquake tsunami.
Comparison Between Experimental and Numerical Results
The physical modeling and numerical analysis of the tsunami inundation of the 2011 Tohoku earthquake tsunami were performed to investigate the inundation processes in a complex coastal city. The experimental result is used to validate the numerical results of the 2D and Q3D models for two cases: the bore wave (Case 1) and solitary wave (Case 2). The characteristic water surface elevation and spatial distribution of the tsunami inundation of the numerical results were analyzed to assess the sensitivity of the model.
Comparison of the Water Surface Elevation
Figure 6 shows the comparison of the water surface elevation between the experimental and numerical model results for Case 1. In this study, the time series of the experimental surface elevation at WG2 was used as the input boundary condition of the numerical model. The time histories of the water surface elevation at WG2 from both the 2D-NSWE and Q3D-ROMS showed good agreement with the experimental measurements, as seen in Figure 6A. The array of WG4–WG8 was located along the street parallel to the inundation flow direction in the southern region of Onagawa. Figures 6B,C show the comparison of the water surface elevation at WG4 and WG8, respectively. The maximum water level of the 2D-NSWE results agreed well with the experimental results at WG4. However, the Q3D-ROMS underestimated the inundation depth by <3 mm or 4.2% at WG4. The maximum water level of both numerical models was slightly overestimated by about 2 mm or 4% at WG8, as shown in Figure 6C. In general, the numerical results of 2D-NSWE and Q3D-ROMS for Case 1 agree with the experimental results in terms of the time series of the water surface profile and the maximum water surface elevation. Thus, it can be expected that both models can accurately reproduce the hydraulic bore in terms of the maximum water level and tsunami-like waveform.
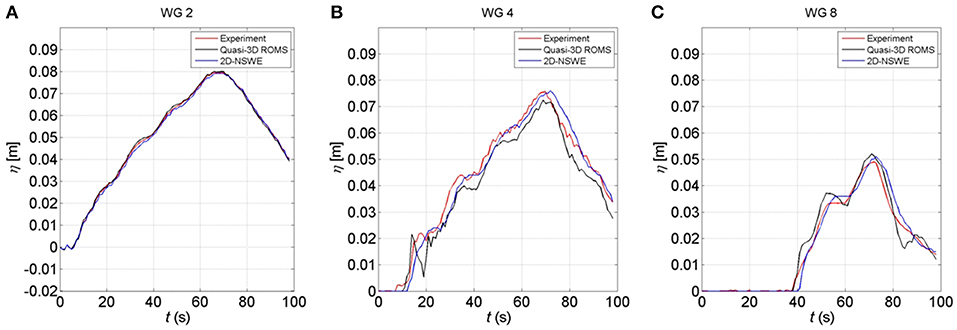
Figure 6. Comparison of the water surface elevation between the experimental and numerical model results for Case 1 (red line: experimental results, black line: Q3D-ROMS model, blue line: 2D-NSWE model). (A) at WG 2, (B) at WG 4 (the benchmark), and (C) at WG 8.
Figure 7A shows the comparison of the water surface elevation between the experimental and numerical results at WG2 for Case 2. Initially, the solitary wave was fairly symmetric and reached the maximum water level at t = 12 s. After t = 14 s, the reflected waveform from the coastline was observed. Similar to Case 1, the time histories of the water surface elevation at WG2 for Case 2 show good agreement between the numerical and experimental results. Figure 7B shows the comparison of the water surface elevation at WG4. The maximum water level of the Q3D-ROMS and 2D-NSWE model results compared to the experimental results were underestimated by about 21.6 and 46.4%, respectively. A large difference occurred due to the bottom roughness, and the drag coefficient plays a key role in both models for the solitary wave condition. The effect of the bottom roughness is more significant for the solitary wave run-up condition than the bore condition, particularly in the momentum conservation equations directly. The NSWE model also cannot consider the effect of the energy dissipation due to the presence of urban structures in different configurations. Therefore, both model results are due to the lack of model performance when computing the governing equations and modeling the bottom roughness and topographical conditions in the shallow water region and inland. The NSWE model computation failed to reproduce the flow inundation at WG8. In the 2D-NSWE results, a calculation of the solitary wave energy was converted to the run-up height rather than the inundation distances; therefore, the solitary wave could not reach the higher position as shown in Figure 7C. In general, the numerical simulation results of 2D-NSWE and Q3D-ROMS for the solitary wave conditions were underestimated compared with the experimental results in terms of the maximum water surface elevation. A model based on the NSWEs might not be suitable for representing a solitary waveform in terms of the wave magnitude and spatial duration due to nearshore effects and the wave interaction with structures.
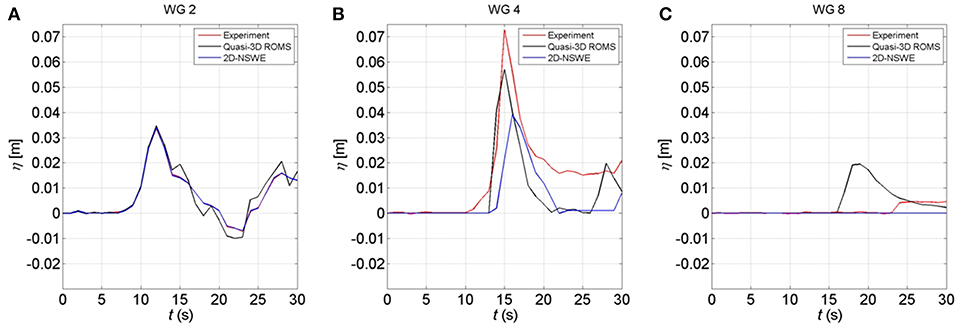
Figure 7. Comparison of the water surface elevation between the experimental and numerical model results for Case 2 (red line: experimental results, black line: Q3D-ROMS model, blue line: 2D-NSWE model). (A) at WG 2, (B) at WG 4 (the benchmark), and (C) at WG 8.
Comparison of the Maximum Inundation Depth and Arrival Time
Result comparisons of the maximum inundation depth and the arrival time between experimental and numerical models at all wave gauges (WG2–WG13) for Case 1 are shown in Figure 8. The red line indicates the experimental results, while the black and blue lines are Q3D-ROMS and 2D-NSWE, respectively. The maximum inundation depth offshore is recorded at WG2 and WG3, while in the onshore inundation depths are represented by WG4 to WG13. The maximum inundation depth near the coastline at the slope section (WG3) was slightly underestimated by about 4.82% for 2D-NSWE and 4.32% for Q3D-ROMS compared with the experimental results. The maximum inundation depth of the 2D-NSWE and the Q3D-ROMS numerical results shows good agreement with the experimental results except for at the wave gauge located far inland from the coastline. The far inland location is strongly influenced by onshore structures, topographical conditions, and propagation processes that are not well-captured in both models. In the southern region, the maximum water level of the Q3D-ROMS results agreed well with the experimental results at WG5. On the other hand, the maximum water level of the model results was slightly overestimated at WG6 and WG7 and was underestimated at WG8. The arrival time of the Q3D-ROMS results for all wave gauges was slower than the experimental result by about 1–11 s, except at WG5, which was faster by about 2 s than the experimental results. The maximum inundation depth from the numerical results was overestimated by about 1.6 mm or 29.6% for the 2D-NSWE and by about 1.8 mm or 34.1% for the Q3D-ROMS compared with the experimental result at second benchmark location (WG9). The arrival time of the Q3D-ROMS results agrees well with the experimental result at t = 64 s. However, the 2D-NSWE results were 2 s faster than the experimental results. In general, the difference in the maximum surface elevation between the numerical model and physical model is <5%, except at WG9 and WG13. The difference in arrival time for both numerical models compared with the physical model was <11 s. The effect of the bottom roughness and drag coefficient was less significant for the hydraulic bore condition compared to the solitary wave case. Therefore, the numerical simulation results of the 2D-NSWE and Q3D-ROMS for hydraulic bore conditions agree fairly well with the experimental results in terms of the maximum surface elevation and the arrival time.
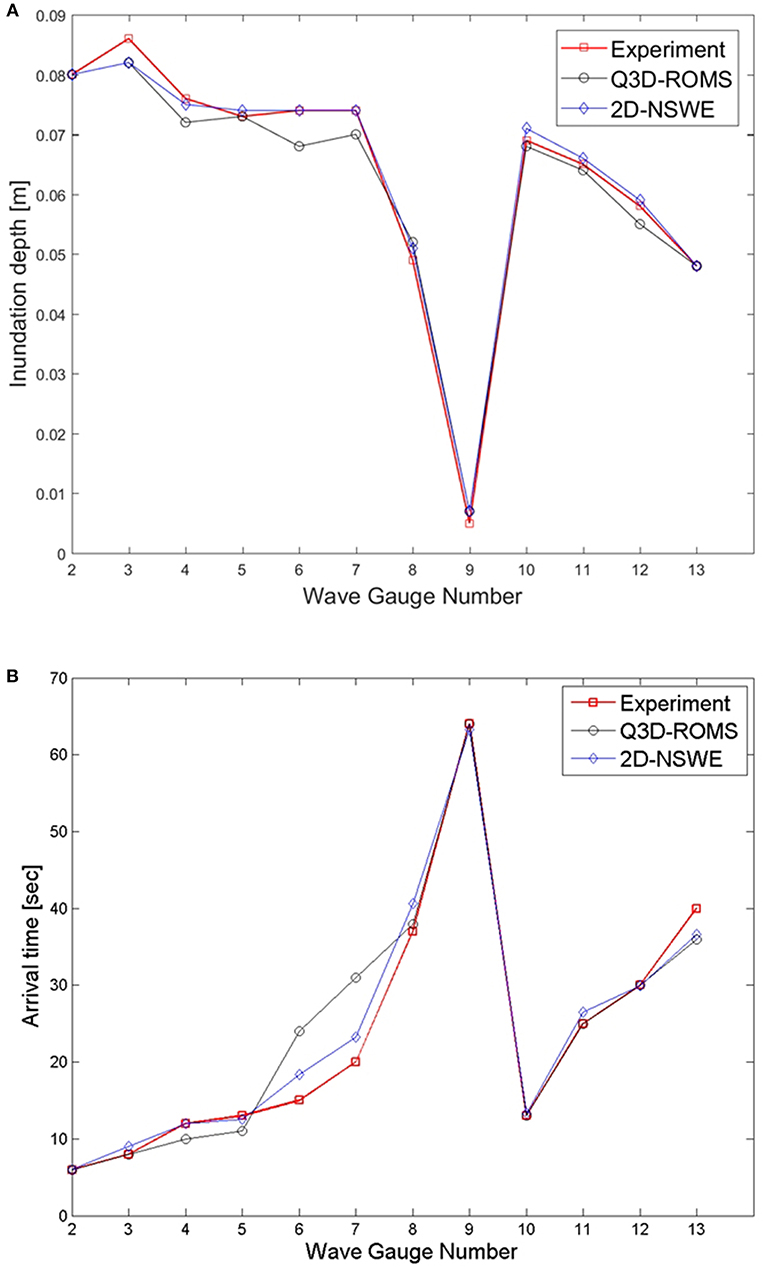
Figure 8. Comparison of the maximum inundation depth and the arrival time between experimental and numerical models at all wave gauges (WG2-WG13) from onshore to inland for Case 1 (red line: experimental results, black line: Q3D-ROMS model, blue line: 2D-NSWE model). (A) Maximum inundation depth, and (B) Arrival time.
Result comparisons of the maximum inundation depth and the arrival time between the experimental and numerical models at all wave gauges (WG2–WG13) show significant differences for Case 2, as shown in Figure 9. The maximum inundation depth from the numerical result was slightly underestimated by about 4 mm or 7.23% for the Q3D-ROMS and by about 28 mm or 45.3% for the 2D-NSWE compared with the experimental results near the coastline at the slope section (WG3). The arrival time of the Q3D-ROMS agreed well with the experimental result. However, the 2D-NSWE was faster by about 1 s than the experimental results. Onshore, the maximum inundation depth and arrival time of the numerical model had larger biases compared with the physical model. As explained in the previous section, the significant difference of amplitude in the results of the non-linear equation model is due to the lack of model performance when computing the governing equations and modeling the bottom roughness and topographical conditions in shallow water regions. For the Q3D-ROMS results, the arrival time agrees fairly well with the experimental result compared with 2D-NSWE. In the Q3D-ROMS, the stretched terrain sigma-coordinated system was applied and discretized over variable topography in the vertical direction, which was not used in the NSWE model. The wide range of delayed time in the Q3D-ROMS could be due to the lack of model performance for modeling the bottom friction and horizontal viscosity. It is also due to limitation of the wet and dry coefficient that was not significantly considered when the tsunami wave propagated landward. Higher friction coefficients and energy dissipation might be determined during the computation of the numerical model.
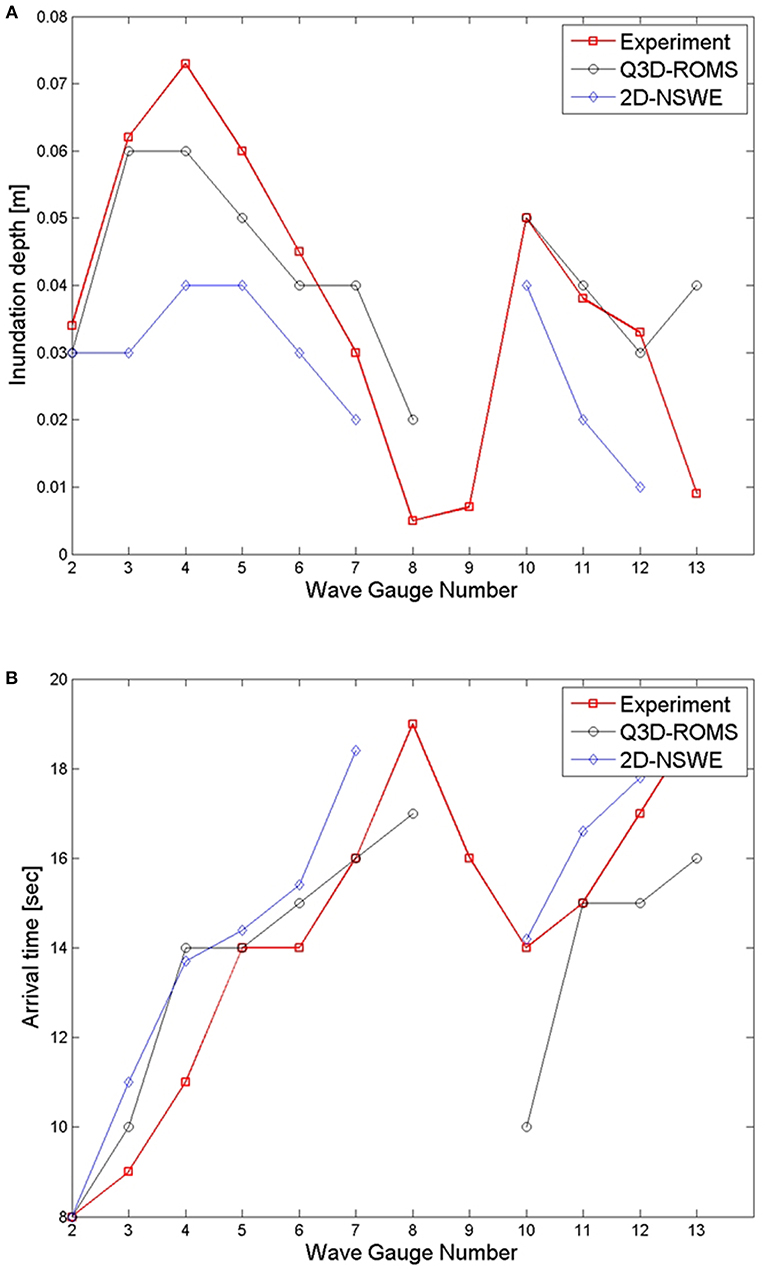
Figure 9. Comparison of the maximum inundation depth and the arrival time between experimental and numerical models at all wave gauges (WG2-WG13) from onshore to inland for Case 2 (red line: experimental results, black line: Q3D-ROMS model, blue line: 2D-NSWE model. (A) Maximum inundation depth, and (B) Arrival time.
The maximum inundation depths and arrival times were compared at fixed locations along the street from onshore to inland. Comparisons of the spatial distribution of the inundation extent between the experimental results and numerical results (Q3D-ROMS and 2D-NSWE) for the hydraulic bore condition are shown in Figure 10. In this figure, the hydraulic bore with a duration of 60.0 s and a discharge of 0.133 m3/s was generated by the pump-type wave generator. Figure 10 shows the conditions of the maximum inundation when the maximum water level was reached. The green contour indicates the experimental result, the red line indicates the Q3D-ROMS result, and the black line indicates the 2D-NSWE result. The spatial distribution of the inundation and the delayed arrival times are clearly shown between the numerical model results and physical models. In this observation, the inundated area in the 2D-NSWE model was similar to the experimental results, and the Q3D-ROMS model slightly underestimated the spatial inundation compared with the experimental results.
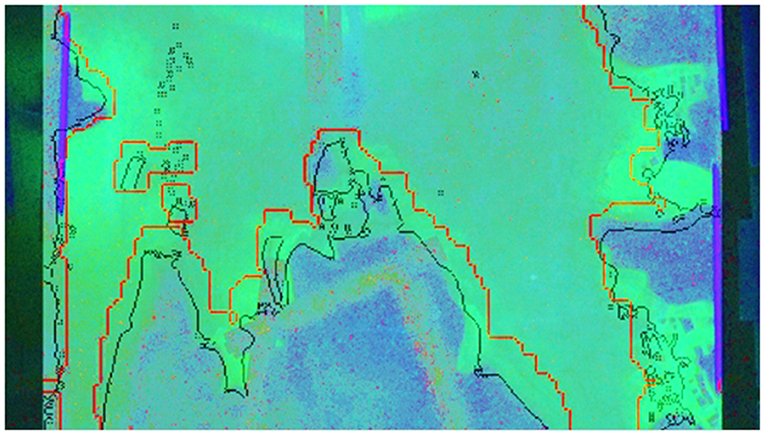
Figure 10. Comparison of the spatial distribution of the inundation extent between the experimental results and numerical results (Q3D-ROMS and 2D-NSWE) for Case 1 at t = 60 s (green contour: Experimental result, red line: Q3D-ROMS model, black line: 2D-NSWE model).
Pressure Acting on Structures
It is important to know the model characteristics and prediction accuracy of wave-induced pressure acting on the structures. In this section, the comparison of the maximum tsunami wave pressure between the experimental and empirical relation is discussed. The Japan Cabinet Office (JCO) provides simple equations to estimate the maximum pressures and load caused by a tsunami based on the Asakura formula. According to Tomiczek et al. (2016b), the design equation proposed by the JCO/Task Committee under the Japanese Cabinet Office (2005) is based on a series of laboratory experiments performed by Asakura et al. (2002) on 2D scale models. From these experiments, Asakura et al. empirically assumed the maximum tsunami loading to be a triangular distribution with base pressure, Pmax, equal to three times the hydrostatic pressure as follows:
where ρ is the density of water, and hmax is the maximum water surface elevation.
Figure 11 shows the maximum pressure of the tsunami wave acting on the structures at all locations in the physical model for Cases 1 and 2 (the orientation of Figure 11 is similar to that of Figure 2C). The value of a in the figure indicates the maximum pressure for Case 1, and b indicates the maximum pressure for Case 2. All the sensors were installed on the wall of the structures facing the wavemaker direction (offshore). The largest maximum pressure was observed at P15 for Case 1 (3.49 kPa) and Case 2 (2.46 kPa). The sensor at P15 was mounted on buildings near the coastline at x = 22.14 m. On the other hand, the smallest maximum pressure was observed at P9 for Case 1 (1.48 kPa) and at P14 for Case 2 (0.79 kPa) located at x = 22.87 m and x = 22.99 m, respectively. This clearly shows that buildings located near the coastline receive a larger impact than buildings located farther from the coastline. This result is consistent with the measurement of the surface elevation discussed in the previous section. Additionally, Figure 12 shows the selected maximum pressures acting on structures in the northern region from the nearest to farthest location from the coastline. The horizontal and vertical axes in the figure are defined as the run-up distance of structures from the coastline and the maximum pressure, respectively. The circles in the figure indicate the measured pressure, and the lines show the predicted maximum pressure trends using Equation (10). For Cases 1 and 2, the buildings located close to the coastline consistently sustained higher impact pressures than the buildings located farther from the coastline. Water turbulence, wave reflection, and dissipation of wave energy occur as the wave propagates inland due to interaction between the tsunami wave and the structures, resulting in the reduction of wave pressure.
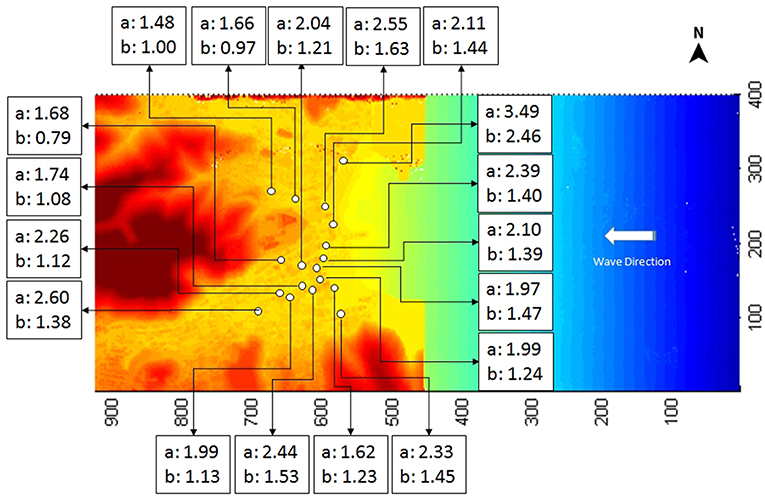
Figure 11. The maximum pressure of the tsunami wave acting on the structures at all locations in the physical model for Cases 1 and 2 (a indicated the maximum pressure for Case 1, and b indicated the maximum pressure for Case 2) (unit in kPa).
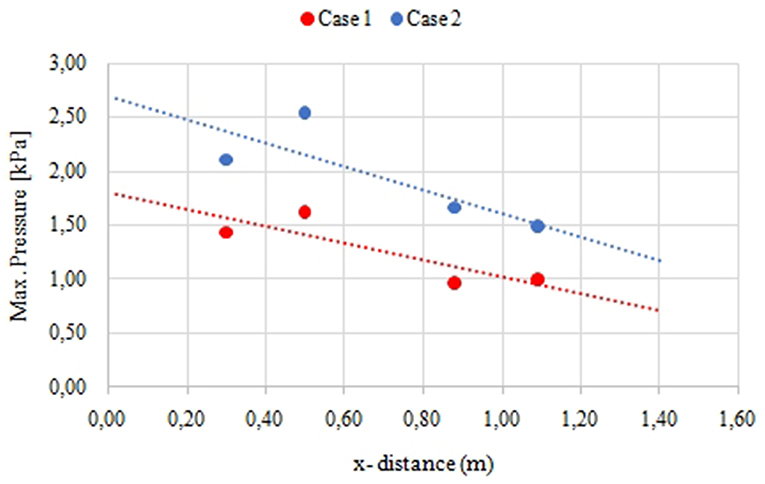
Figure 12. The selected maximum pressures acting on structures in the northern region from the nearest to farthest location from the coastline (The circles indicate the measured pressure and the lines indicate the predicted maximum pressure trends using Equation 10).
Table 2 shows the comparison of the maximum pressure on the structures between the physical model results and Equation (10). Based on the Asakura formula, all buildings in the northern and southern regions located close to the coastline received higher impact pressures than the buildings located farther from the coastline for Cases 1 and 2. These calculated results agree well with the experimental measurements. Generally, the maximum pressure calculated by the Asakura formula on the buildings in the southern and northern regions was higher than the physical model results for both hydraulic bore and solitary wave conditions. However, the calculations of maximum pressure by the Asakura formula for the buildings located farther from the coastline were smaller than the physical model results. This is due to the influence of the maximum water surface elevation on the calculation of the Asakura formula. The buildings located farther from the coastline had a lower water surface elevation than the buildings near the coastline.
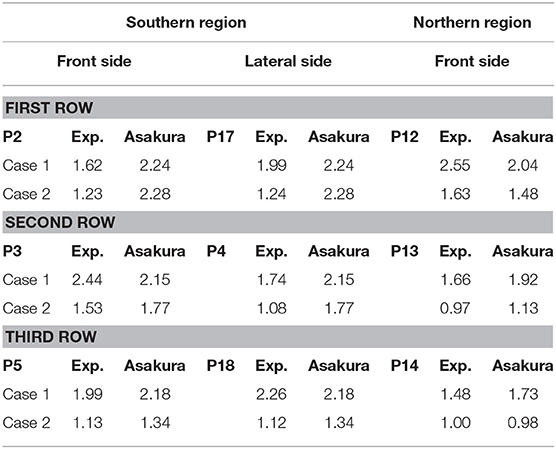
Table 2. Comparison of the maximum pressure on the structures between the physical model results and Asakura formula (in kPa).
Conclusions
This study conducted physical and numerical modeling of Onagawa, a town in Miyagi Prefecture, for the 2011 Tohoku earthquake-like tsunami. Physical experiments and numerical modeling of tsunami inundation in a coastal city have been performed to understand the local tsunami behavior and other hydrodynamic processes when a tsunami impacts the urban infrastructure. A series of numerical simulations was performed for the Onagawa physical model. A comparison of the results between the physical and two numerical models were examined for two different incident waves with the same height: hydraulic bore and solitary waves. Conclusions from the above discussion are as follows:
• In terms of the tsunami magnitude and time period, the hydraulic bore wave could represent a tsunami-like wave closer to the 2011 Tohoku earthquake tsunami than the solitary wave.
• Existence of macro-roughness elements (e.g., buildings and houses) and topography conditions significantly contributed to the reduction of the inundation speed and inundation depth.
• Overall, the 2D-NSWE and Q3D-ROMS results agreed well with the experimental results in terms of the maximum water level and arrival time for the hydraulic bore conditions. On the other hand, the numerical simulation results for the solitary wave conditions were underestimated compared with the experimental results in terms of the maximum water surface elevation, and the arrival time in the numerical models was slower than that in the experimental results.
• In the NSWE model, the delay time and large biases of the maximum water level are due to the lack of model performance when computing the governing equations and modeling the bottom roughness and topographical conditions in shallow water regions. A NSWE model might not be suitable for representing a tsunami waveform in terms of the wave magnitude and spatial duration due to the nearshore effects and wave diffraction from the structures.
In this study, the dataset of tsunami inundation as a benchmark for the 2011 Tohoku earthquake tsunami is provided, which will be useful to validate other numerical tsunami models.
There is much important remaining work for future research. First, the verification and validation of the bottom friction in the numerical model processes are important to evaluate the sensitivity of a numerical model when simulating the tsunami inundation processes on the land, such as the inundation height and arrival time. Therefore, it is necessary to conduct numerical modeling using different roughness modeling and scenarios, for example, numerical simulation without buildings (bare-earth scenario) and different roughness coefficients to check the numerical model sensitivity. Furthermore, other features, such as debris, may play important roles in changing the local tsunami behavior and should be considered in numerical modeling. Finally, the tsunami fragility functions that consider interactions between tsunami hydrodynamic processes and the structure on a city scale are important to develop. These efforts may lead to developing an effective and reliable assessment tool for tsunami mitigation in coastal urban cities using a model that can simulate arbitrary tsunami waves.
Author Contributions
All authors listed have made a substantial, direct and intellectual contribution to the work, and approved it for publication.
Conflict of Interest Statement
The authors declare that the research was conducted in the absence of any commercial or financial relationships that could be construed as a potential conflict of interest.
Acknowledgments
This work was financially supported by the Ministry of Education, Culture, Sports, Science and Technology (MEXT), Grants-in-Aid for Scientific Research Kakenhi by JSPS, Science and Technology Research Partnership for Sustainable Development (SATREPS) by Japan Science and Technology (JST/JICA), and DPRI Kyoto University Funds.
References
Adriano, B., Hayashi, S., Gokon, H., Mas, E, and Koshimura, S. (2016). Understanding the extreme Tsunami inundation in Onagawa town by the 2011 Tohoku earthquake, its effects in urban structures and coastal facilities. Coast. Eng. J. 58:1640013. doi: 10.1142/S0578563416400131
Allsop, W., Robinson, D., Charvet, I., Rossetto, T., and Abernathy, R. (2008). “A unique tsunami generator for physical modelling of violent flows and their impact,” in Proceedings of the 14th World Conference on Earthquake Engineering (Beijing).
Asakura, R., Iwase, K., Ikeya, T., Takao, M., Kaneto, T., Fujii, N., et al. (2002). “The tsunami wave force acting on land structures,” in Proceedings of the 28th International Conference of Coastal Engineering Vol. 1 (Cardiff, UK), 1191–1202.
Bridges, K., Cox, D. T., Thomas, S., Shin, S., and Rueben, M. (2013). Large-scale wave basin experiments on the influence of large obstacles on tsunami inundation forces. Coast. Struct. 201, 1237–1248. doi: 10.1142/9789814412216_0107
Briggs, M. J., Yeh, H., and Cox, D. T. (2008). “Physical modeling of tsunami waves,” in Handbook of Coastal and Ocean Engineering, 1st Edn. Chapter 39, ed Y. C. Kim (Singapore: World Scientific Publishing), 1073–1105. doi: 10.1142/9789812819307_0039
Cox, D. T., Tomita, T., Lynett, P., and Holman, R. (2008). “Tsunami inundation with macro-roughness in the constructed environment,” in Proceedings of the 31st International Conference on Coastal Engineering (Hamburg), 1421–1432.
Fujima, K., Achmad, F., Shigihara, Y., and Mizutani, N. (2009). Estimation of tsunami force acting on rectangular structures. J. Disast. Res. 4, 404–409. doi: 10.20965/jdr.2009.p0404
Goseberg, N., Wurpts, A., and Schlurmann, T. (2013). Laboratory-scale generation of tsunami and long waves. Coast. Eng. 79, 57–74. doi: 10.1016/j.coastaleng.2013.04.006
Goto, C., Ogawa, Y., Shuto, N., and Imamura, F. (1997). Numerical Method of Tsunami Simulation 644 With the Leap-Frog Scheme (IUGG/IOC Time Project). IOC Manual, UNESCO, Report No. 35.
Han, S., Ha, T., and Cho, Y. S. (2015). Laboratory experiments on run-up and force of solitary waves. J. Hydro Environ. Res. 9, 582–591. doi: 10.1016/j.jher.2015.05.002
Hayashi, Y., Tsushima, H., Hirata, K., Kimura, K., and Maeda, K. (2011). Tsunami source area of the 2011 off the Pacific Coast of Tohoku earthquake determined from tsunami arrival times at offshore observation station. Earth Planets Space 63, 809–813. doi: 10.5047/eps.2011.06.042
Hiraishi, T., Azuma, R., Mori, N., Yasuda, T., and Mase, H. (2016). A new generator for tsunami wave generation. J. Energy Power Eng. 10, 166–172. doi: 10.17265/1934-8975/2016.03.004
Hiraishi, T., Yasuda, T., Mori, N., Azuma, R., Mase, H, Prasetyo, A., et al. (2015). Characteristics of tsunami generator newly implemented with three generation modes. J. Jpn. Soc. Civil Eng. 71, 349–354. doi: 10.2208/kaigan.71.I_349
Imamura, F. (1996). “Review of tsunami simulation with a finite difference method,” in Proceedings of the Second International Workshop on Long-Wave Runup Models (Washington, BC: World Scientific Publishing), 25–42. doi: 10.1142/3327
JCO/Task Committee under the Japanese Cabinet Office (2005). Design Guidelines for Tsunami Shelters (in Japanese). Available online at: http://www.bousai.go.jp/oshirase/h17/tsunami_siryo2.pdf
Kawai, H., Satoh, M., Kawaguchi, K., and Seki, K. (2013). Characteristics of the 2011 Tohoku tsunami waveform acquired around Japan by NOWPHAS equipment. Coast. Eng. J. 55:13500083. doi: 10.1142/S0578563413500083
Kihara, N., Niida, Y., Takabatake, D., Kaida, H., Shibayama, A., and Miyagawa, Y. (2015). Large-scale experiments on tsunami-induced pressure on a vertical tide wall. Coast. Eng. 99, 46–63. doi: 10.1016/j.coastaleng.2015.02.009
Koshimura, S., and Hayashi, S. (2012). “Tsunami flow measurement using the video recorded during the 2011 Tohoku tsunami attack,” in Geoscience and Remote Sensing Symposium (IGARSS), 2012 IEEE International (Munich), 6693–6696. doi: 10.1109/IGARSS.2012.6352063
Kotani, M., Imamura, F., and Shuto, N. (1998). Tsunami runup simulation and damage estimation by using geographical information system. J. Jpn. Soc. Civil Eng. 45, 356–360.
Kron, W. (2013). Coasts: the high-risk areas of the world. Nat. Hazards. 66, 1363–1382. doi: 10.1007/s11069-012-0215-4
Madsen, P. A., Fuhrman, D. R., and Schäffer, H. A. (2008). On the solitary wave paradigm for tsunamis. J. Geophys. Res C 113, 1–22. doi: 10.1029/2008JC004932
Mase, H., Kimura, Y., Yamakawa, Y., Yasuda, T., Mori, N., and Cox, D. (2013). Were coastal defensive structures completely broken by an unexpectedly large tsunami? A field survey. Earthq. Spectra. 29, S145–S160. doi: 10.1193/1.4000122
Miyashita, T., Mori, N., Cox, D., Yasuda, T., and Mase, H. (2015). Quasi-3D simulation of tsunami inundation in city scale model. J. Jpn. Soc. Civil Eng. 71, 169–174. doi: 10.2208/kaigan.71.I_169
Mori, N., Takahashi, T, Yasuda, T., and Yanagisawa, H. (2011). Survey of 2011 Tohoku earthquake tsunami inundation and run-up. Geophys. Res. Lett. 38:L00G14. doi: 10.1029/2011GL049210
Mori, N., Yoneyama, N., and Pringle, W. (2014). “Effects of the offshore barrier against the 2011 off the Pacific Coast of Tohoku Earthquake Tsunami and lessons learned,” in Post Tsunami Hazards Restoration and Reconstruction, ed V. Santiago-Fandino (Springer), p. 121–132.
Oshnack, M. E. (2010). Analysis of Wave Forces on Prototype Walls Under Tsunami Loading. Master Thesis. Oregon State University.
Palermo, D., Nistor, I., Al-Faesly, T., and Cornett, A. (2013). Impact of tsunami forces on structures: the University of Ottawa Experience. Sci. Tsunami Hazards J. 32, 58–76.
Park, H., Cox, D., Lynett, P. J., Wiebe, D. M., and Shin, S. (2013). Tsunami inundation modeling in constructed environments: a physical and numerical comparison of free-surface elevation, velocity, and momentum flux. Coast. Eng. 79, 9–21. doi: 10.1016/j.coastaleng.2013.04.002
Prasetyo, A., Tomiczek, T., Yasuda, T., Mori, N., and Mase, H. (2015). “Characteristic of tsunami wave using a hybrid tsunami generator,” in Coastal Structures and Solutions to Coastal Disasters Joint Conference 2015 (Boston, MA). doi: 10.1061/9780784480311.017
Prasetyo, A., Tomiczek, T., Yasuda, T., Mori, N., Mase, H., and Kennedy, A. (2016). “Physical experiments of tsunami runup and force on building clusters using a hybrid tsunami generator,” in Proceedings of the 6th International Conference on the Application of Physical Modelling in Coastal and Port Engineering and Science (Coastlab16) (Ottawa, ON). Available online at: http://rdio.rdc.uottawa.ca/publications/coastlab16/coastlab73.pdf (accessed April 29, 2018).
Pringle, W., and Yoneyama, N. (2013). The application of a hybrid 2D/3D numerical tsunami inundation-propagation flow model to the 2011 off the Pacific Coast of Tohoku earthquake tsunami. J. Jpn. Soc. Civil Eng. 69, 306–310. doi: 10.2208/kaigan.69.I_306
Rossetto, T., Allsop, W., Charvet, I., and Robinson, D. (2011). Physical modelling of tsunami using a new pneumatic water wave generator. Coast. Eng. 58, 517–527. doi: 10.1016/j.coastaleng.2011.01.012
Shchepetkin, A. F., and McWilliams, J. C. (2005). The regional ocean modeling system: a split-explicit, free-surface, topography following coordinates ocean model. Ocean Model. 9, 347–404. doi: 10.1016/j.ocemod.2004.08.002
Suppasri, A., Shuto, N., Imamura, F., Koshimura, S., Mas, E., and Yalciner, A. C. (2013). Lessons learned from the 2011 Great East Japan Tsunami: Performance of tsunami countermeasures, coastal buildings, and tsunami evacuation in Japan. Pure Appl. Geophys. 170, 993–1018. doi: 10.1007/s00024-012-0511-7
Synolakis, C. E. (1987). The runup of solitary waves. J. Fluid Mech. 185, 523–545. doi: 10.1017/S002211208700329X
Thomas, S., Killian, J., and Bridges, K. (2014). Influence of macroroughness on tsunami loading of coastal structures. J. Waterway Port Coast. Ocean Eng. 144:04014028. doi: 10.1061/(ASCE)WW.1943-5460.0000268
Titov, V. V., González, F. I., Bernard, E. N., Eble, M. C., Mofjeld, H. O., Newman, J. C., et al. (2005). Real time tsunami forecasting: challenges and solutions. Nat. Hazards. 35, 35–41. doi: 10.1007/s11069-004-2403-3
Tomiczek, T., Prasetyo, A., Mori, N., Yasuda, T., and Kennedy, A. B. (2016a). Physical modelling of tsunami onshore propagation, peak pressures, and shielding effects in an urban building array. Coast. Eng. 117, 97–112. doi: 10.1016/j.coastaleng.2016.07.003
Tomiczek, T., Prasetyo, A., Mori, N., Yasuda, T., and Kennedy, A. B. (2016b). Effects of a macro-roughness element on tsunami wave amplification, pressures, and loads: physical model and comparison to Japanese and US design equations. Coast. Eng. J. 59:1750004. doi: 10.1142/S0578563417500048
Wang, X., and Liu, P. L. F. (2006). An analysis of 2004 Sumatra earthquake fault plane mechanisms and Indian Ocean tsunami. J. Hydr. Res. 44, 147–154. doi: 10.1080/00221686.2006.9521671
Yasuda, T., Miyaue, T., Prasetyo, A., Kamo, M., Mori, N., Hiraishi, T., et al. (2016). Tsunami inundation experiment using coastal city model. J. Jpn. Soc. Civil Eng. 72, 385–390. doi: 10.2208/kaigan.72.I_385
Keywords: tsunami, inundation, physical modeling, pressure, Onagawa
Citation: Prasetyo A, Yasuda T, Miyashita T and Mori N (2019) Physical Modeling and Numerical Analysis of Tsunami Inundation in a Coastal City. Front. Built Environ. 5:46. doi: 10.3389/fbuil.2019.00046
Received: 27 July 2018; Accepted: 15 March 2019;
Published: 10 April 2019.
Edited by:
Andrew Foster, University of Manchester, United KingdomReviewed by:
Liborio Cavaleri, University of Palermo, ItalyHae Young Noh, Carnegie Mellon University, United States
Mostafa Mirshekari, Carnegie Mellon University, United States, in collaboration with reviewer HN
Copyright © 2019 Prasetyo, Yasuda, Miyashita and Mori. This is an open-access article distributed under the terms of the Creative Commons Attribution License (CC BY). The use, distribution or reproduction in other forums is permitted, provided the original author(s) and the copyright owner(s) are credited and that the original publication in this journal is cited, in accordance with accepted academic practice. No use, distribution or reproduction is permitted which does not comply with these terms.
*Correspondence: Adi Prasetyo, adi.prasetyo246@yahoo.com