Cross Laminated Timber (CLT) Beams Loaded in Plane: Testing Stiffness and Shear Strength
 Francesco Boggian
 Mauro Andreolli
 Roberto Tomasi
- 1Department of Civil, Environmental and Mechanical Engineering, University of Trento, Trento, Italy
- 2Timber Tech srl, Trento, Italy
- 3Faculty of Science and Technology, Norwegian University of Life Science, Ås, Norway
Cross Laminated Timber (CLT) is a relatively new timber product used in construction that has gained popularity over the last decade. The product itself is constituted by multiple glued layers of juxtaposed boards, usually arranged in an orthogonal direction between one layer and the adjacent ones. This particular structure brings several benefits, such as the possibility to use the same product both for walls and slabs, since it can bear in-plane and out-of-plane loads. However, the mechanical behavior differs from usual timber products, and research is still ongoing to achieve common agreement on standard procedures for testing products and theories for evaluating stresses for safety verifications. This paper focuses on the in-plane shear behavior of CLT and analyzes the existing methods to evaluate shear stresses. An experimental part then presents a four-point bending test of CLT beams with a specific geometry to induce shear failure. Results are reported both for the elastic range test, measuring the Modulus of Elasticity, and for the failure test to investigate shear behavior with regard to different mechanisms. Previously exposed methods are used for the calculation of shear stresses and to analyze the correspondence between them, and the results are then compared with other existing tests and values in literature. A new test setup for future research is eventually proposed.
1. Introduction
Cross Laminated Timber is one of the many systems of building with timber, and it can be seen as a development of glued laminated timber by applying a similar concept on 2D elements instead of linear elements and with a new layup; its employment in construction is recent and it has become widely used mostly in Europe over the past 15 years. This product is usually produced in a plate-like shape and its alternated orthogonal board layer structure makes it apt to bear loads in and out of plane; hence the great benefit given by the possibility to use the same element both as a wall and as a floor slab. Another big advantage of this building system is the high degree of prefabrication it offers; this means more control during the production process, which translates to small tolerances. CLT is produced and, if necessary, cut in personalized shapes directly at the production site using CNC machines. Regarding the building site, this also means faster times and cleaner area, since the elements only need to be assembled and connected to each other to constitute the load-bearing structure of the building; it further permits faster application of additional insulation layers and finishes (see Brandner et al., 2016). The use of this construction system is relatively new, so the process of producing standards is still ongoing. The problem regards two different but closely related areas: which test procedures to use for the evaluation of the strength properties of CLT and also which methods to adopt for the calculation of stresses. The work of this paper is placed within this scope, particularly regarding the in-plane shear properties; a four-point bending test has been performed on CLT beams according to the EN 408 (2012) procedure to investigate the values of the modulus of elasticity and shear stresses at failure. On the matter of evaluating shear stresses, a review is provided presenting the available methods in literature, and then a test is also used for comparison.
2. Materials
The experimental campaign investigated a total number of 10 CLT beams, coming from different producers. The beams were cut from bigger panels and geometry was modified from the prescriptions of EN 408 (2012) to induce a shear failure. All beams had a span l = 3m and a height hCL = 600mm, the thickness varied depending on the number of layers and the producer, as seen in Table 1. Four different types of specimen have been tested, with differences in the number and thickness of layers, presence of narrow edge glued interface, board width and presence of cracks or cuts to improve shrinkage behavior, see Figure 1. For all panels the technical certificate of the producer indicated a minimum of 90% C24 strength class boards for each layer, with a maximum 10% of C16 boards (for strength classes of structural timber in Europe see EN 338, 2016).
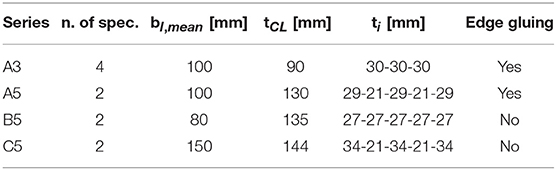
Table 1. Characteristics of tested CLT beams.
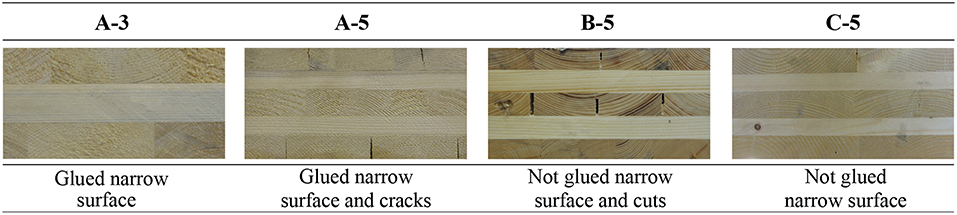
Figure 1. Tested specimen: for each series of specimen an image is provided showing the layup in the thickness direction and underlining differences.
3. Test Setup
The beams were tested using a four point bending test in accordance to the procedures of EN 408 (2012) and EN 16351 (2015), see Figure 2. The test was conducted in a displacement control method with a loading ratio of 0, 03mm/s until reaching a maximum force F ≤ 0, 4Fmax,est to obtain the load/displacement curve in order to calculate the modulus of elasticity. The load was applied by a hydraulic actuator, and the integrated load cell was used to measure the force. A rigid steel beam was used to distribute equally the load in two centered points at a distance c = 1100mm (a = 700mm; c = 800mm and a = 850mm only for the first two specimens of series A3); in order to avoid local concentration of stresses, the load was transferred with two steel plates screwed on the beam. The beam itself was simply supported by two concrete foundations, with one end functioning as a slider allowing movement in the longitudinal axis direction. Given the particular slenderness of the beam, two additional restraints were placed to avoid instability out of plane, with internal surfaces of frictionless plastic material in order to allow free movement of the beam in its bending plane. Displacement measures were taken with 4 LVDT on each side of the beam; three of them measured absolute displacements at neutral axis height (one in the center and two additional centered with l1 = 800mm, l1 = 600mm only for the first two specimen of series A3) while the fourth measured relative displacement.
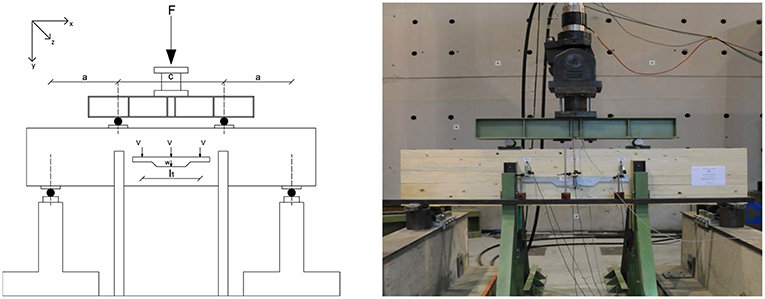
Figure 2. Test setup presented in EN 408.
4. Modulus of Elasticity Calculation
The modulus of elasticity was calculated in accordance with EN 408 (2012). Experimental load-displacement curves were analyzed through a linear regression analysis, and for each specimen the modulus was calculated considering the longest line between 0,1 Fmax and 0,4 Fmax with a minimum correlation coefficient of 0,99 (the line must at least include the interval between 0,2 Fmax and 0,3 Fmax). The equation used is the following:
• (F2 − F1): load increase [N]
• (w2 − w1): displacement increase in the corresponding interval [mm]
• a: distance between the loading point and the support [mm]
• l1: reference length for MoE determination [mm]
• Inet: moment of inertia referred to net section of the beam (layers parallel to x axis) [mm4].
5. Shear Stresses Calculation
In this section various methods for calculating in-plane shear stresses will be presented and compared: a method based on the equilibrium, developed by Andreolli et al. (2012) (Equilibrium method), a method based on the Representative Sub Element Volume method, developed by Bogensperger et al. (2010) (RVSE method), the method for beams developed by Flaig and Blass (2013) and adopted also in the COST document (Brandner et al., 2018, Beam method), and the method of Austrian annex K to ÖNORM B 1995-1-1 (2015) (AT-annex method). In order to obtain a simple and significant exposition, a common notation will be used—the one present in the COST document (Brandner et al., 2018; Dietsch et al., 2018), see Figure 3—which will also be the base for the future Eurocode section regarding CLT products. The first index indicates the plane normal to the action, the second index indicates the axis the action is parallel to; for the following section then the direction y would be the vertical one (parallel to the height hCL of the beam), x is horizontal (parallel to the longitudinal axis of the beam), z is horizontal through the thickness tCL of the beam. The shear force is expressed as force per unit length and for rotational equilibrium:
The layers oriented as the x axis (so the major number of layers for a usual panel with an odd total number of layers) will have thickness t1t3t5, while the layers oriented as the y axis (so the minor number of layers) will have thickness t2t4. The width of the laminations bl is assumed to be equal for boards oriented in both directions, if cracks are present or it is not constant for each board then bl,mean is to be used (unless otherwise specified).
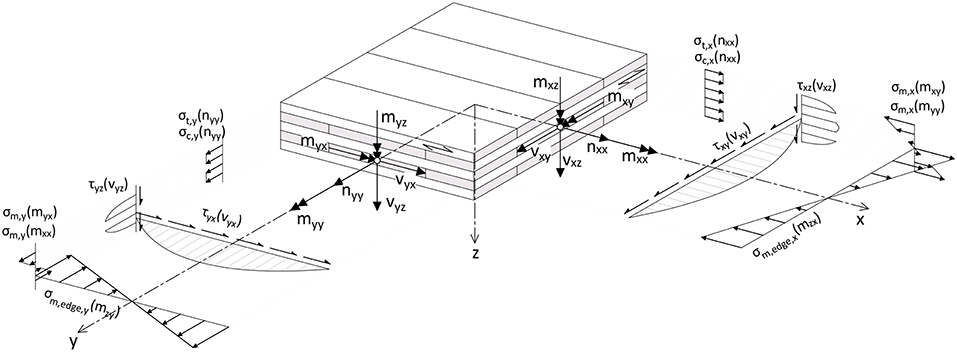
Figure 3. Shear stresses, modified from COST document (Brandner et al., 2018).
5.1. Equilibrium Method
This method is based on equilibrium equations for each layer and glued interfaces and was presented in Andreolli et al. (2012). As seen from Figure 4 the base assumption is that shear stresses are only present in the cross section of the boards oriented perpendicular in respect to the shear action.
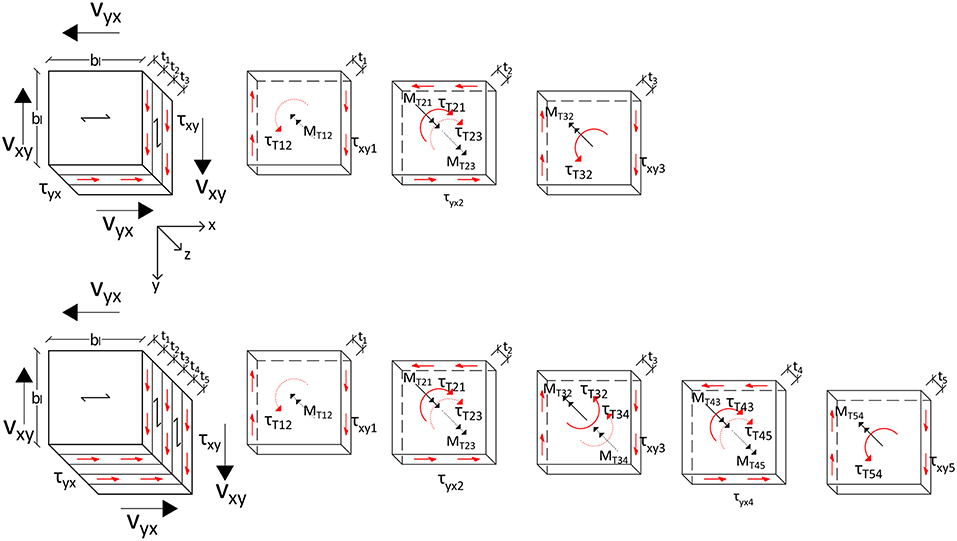
Figure 4. Shear stresses for the equilibrium method.
5.1.1. 3 Layer Panel
Shear stresses τxy and τyx are calculated using the thicknesses of the layers oriented as the respective direction:
For panels with symmetric layup t1 = t3 the stress τyx can be expressed as a function of τxy:
The global equilibrium to rotation poses:
At each glued interface, for action reaction:
Rotational equilibrium is calculated for each layer:
So, considering that τxy1 = τxy3 = τxy and τyx2 = τyx, and using the relations previously found, the following can be obtained:
It is then possible to evaluate torsional shear stresses as a function of τxy considering that :
5.1.2. 5 Layer Panel
Shear stresses τxy and τyx are calculated using the thicknesses of the layers oriented as the respective direction:
For panels with symmetric layup t1 = t3 = t5 and t2 = t4 the stress τyx can be expressed as a function of τxy:
Similarly to the previous 3 layer case the same calculations are done, arriving at:
It is then possible to evaluate torsional shear stresses as a function of τxy considering that :
So, differently from the case of a 3 layer panel torsional shear stresses are not equal for all glued interfaces but are major on external ones.
5.2. RVSE Method
This model is developed by referring to an ideal CLT panel with an infinite number of layers and considering a crossing interface with width equal to the width of the laminations, see Bogensperger et al. (2010). This element is then simplified to obtain a Representative Volume Sub Element (RVSE) of CLT, which has a thickness t and a nominal shear stress τ0 distributed on its entire thickness t (see Figure 5):
This stress can be considered as the composition of two parts: an effective shear stress on the cross section with orientation perpendicular to grain
and a torsional shear stress
Since the real CLT panel has a finite number of layers it is necessary to refer to fictitious thicknesses of RVSE (nCA = nlay − 1 is the number of glued interfaces):
So for a real CLT panel we get:
It can be seen that corresponds to the major of the shear stresses calculated before with the equilibrium method, which is τyx for “usual” cases of symmetrical CLT panels with an odd number of layers and where the total thickness tx of layers oriented as x axis is larger or equal to the total thickness ty of the other layers oriented as y axis. Under the same assumptions, it is also true that the torsional shear stress calculated with this method coincides precisely with the one calculated for a 3 layer panel with the equilibrium method, while for a 5 layer panel the result of the RVSE method is the average of the two values obtained with the equilibrium method. A detailed demonstration of these observations is provided in the Annex.
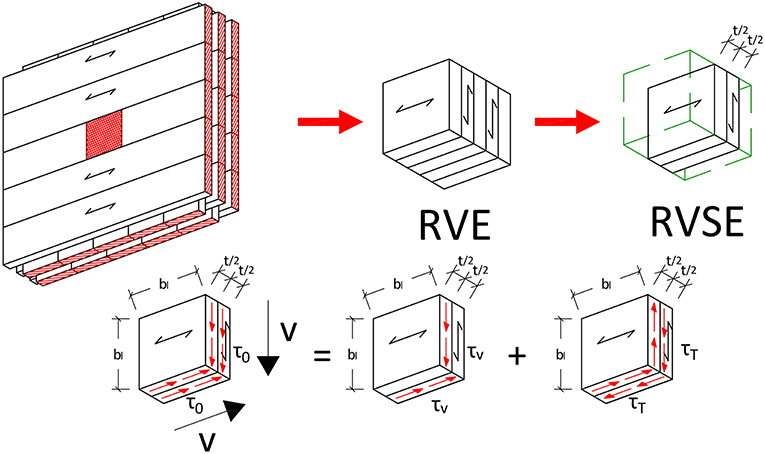
Figure 5. Shear stresses for RVSE model.
5.3. Beam Method
This method was developed in Flaig and Blass (2013) by referring to the equilibrium of a beam and is also present in the COST document (Brandner et al., 2018; Dietsch et al., 2018) which will be the base for a new part in the EN 1995 regarding CLT products. For shear stresses the calculus is carried out separately considering net areas for both directions; the only difference between Flaig theory and COST document is that the latter advises reducing by 0,20 the area comprising outer layers. For a 3 layer panel:
And for a 5 layer panel:
With this method then the shear stresses are exactly the same as the Equilibrium method (except for the 0,20 reduction factor in the COST document). Torsional shear stresses are calculated as:
where Vxy is the applied shear force, nCA = nlay − 1 is the number of glued interfaces, is the number of laminations in the height of the beam. This formula gives torsional shear stress values very close to the ones of the RVSE method, and for high nl values they coincide, for the limit case of indeed :
Remembering Equations (19) and (21) and with the consideration that , it is possible to obtain the same formula of the RVSE method (Equation 23):
Two additional shear stresses on the glued interface are presented in this method, as seen in Figure 6, which are not regarded in the other methods (so they will not be considered for the comparison with the other methods in the next section): τzx which lies in the intersection plane (z) and is parallel to the axis of the beam (x), and τzy, which lies in the same plane and is parallel to the axis of the beam height (y):
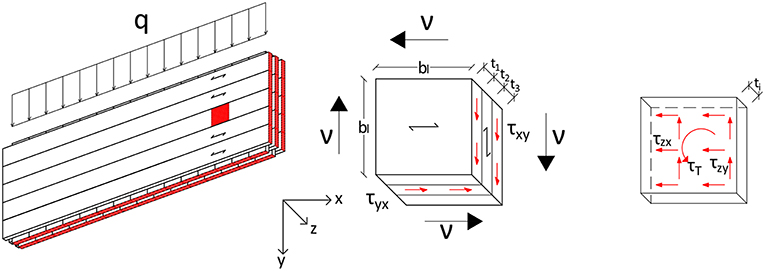
Figure 6. Shear stresses for the beam method, on the right part a representative glue interface is shown.
5.4. AT-Annex
The Austrian Annex K to ÖNORM B 1995-1-1 (2015) proposes, regarding shear stresses, a verification with reference to the net area in the two directions:
which then yields, with the previous conventions:
In this case then, these values are exactly the same as the previous methods. For what regards torsional shear stresses the proposed formulation is (adopting the previous conventions, where for usual panels the major shear stress is τyx):
The formula can be developed for a comparison:
Equilibrium method
The two formulations are similar, but the results obtained are quite different: one considers the maximum lamination thickness and the other the mean, and even when the these two values coincide (i.e., when all layers have equal thickness) the Austrian formulation gives values which are exactly double those of the equilibrium method.
6. Bending Stress Calculation
Regarding bending stresses there is common agreement on the method of calculation, so with the usual convention of Figure 3 the formula used for the maximum bending stress is:
• Inet: moment of inertia referret to net section of the beam (layers parallel to x axis) [mm4]
• hCL: height of the CLT beam [mm].
7. Experimental Results
In Table 2 the results of the elastic part of the test are presented in term of Modulus of Elasticity, calculated as explained in section 4. For the Series A3 the first specimen was only tested to failure and the second one was discarded since it did not respect all prescriptions of EN 408 (2012).
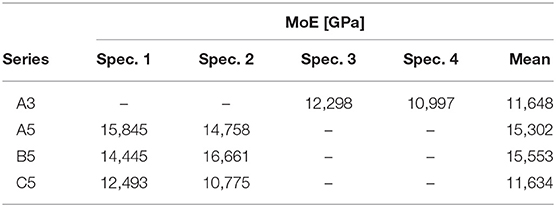
Table 2. Modulus of Elasticity values [GPa].
The results regarding failure are instead presented in Table 3 in term of the maximum force applied by the press, so then Vmax = Vxy and Mmax = Mxz.
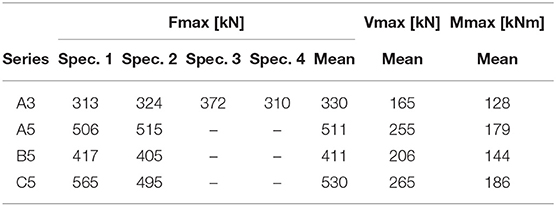
Table 3. Values of applied force and relative shear and bending moment at failure.
The result in terms of bending and shear stresses are presented in Table 4, using the mean values of moment and shear force at failure. For the calculation of shear stresses the equilibrium method was used, and to obtain the maximum value a Jourawski distribution was assumed.
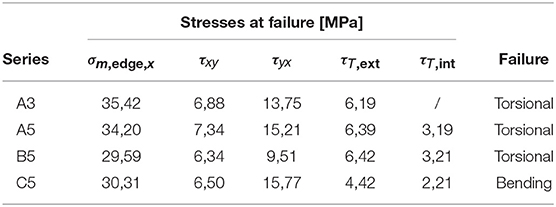
Table 4. Stresses at failure, shear stresses calculated with the equilibrium method.
It is also interesting to see from Figure 7 a comparison between the values of shear stresses evaluated using all the different methods previously explained. Shear stress τxy is the same value for all methods, except for the COST method, which results in a slightly higher value due to a 0,20 reduction factor for the thickness of outer layers. Shear stress τyx is the same value for all methods, while torsional shear stresses present some differences. The equilibrium method presents two different values, one for external and one for internal interfaces while the other methods present a single value which for the RVSE, COST and Beam methods is more or less the average of the previous values, while for the Austrian Annex the value is much higher.
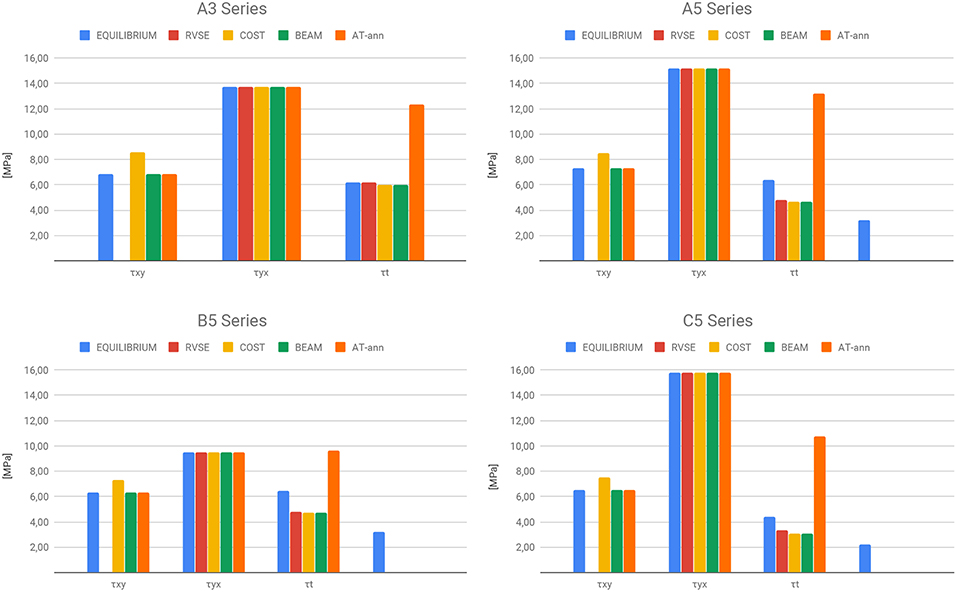
Figure 7. Comparison of shear stresses at failure. Note that for the RVSE method there is no value for τxy since this method only provides the value of major stress τyx. Note also that for 5 layer panels the equilibrium method provides two values of τT, one for the external and one for the internal glued interface.
8. Discussion and Comparison
The different failures for the four types of specimen can be seen in Figure 8. No specimen failed due to shear stresses in the laminations, but two other types of failures were observed: specimens A3, A5, and B5 all failed due to torsional shear stresses in the glued interfaces, while specimen C5 failed in bending. From the figures, another interesting detail appears: torsional shear failure in 5 layer panels (A5 and B5) started from the outer glued interfaces, which is in accordance with the equilibrium method that hypothesizes different values of torsional shear stresses, major in external glued interfaces and minor in internal ones. Specimen series C5 failed in bending, and this is probably due to a stress concentration near a defect present in both beams which brought to an early bending failure. The C5 series was also the one with the largest width of laminations, thus it had the highest polar moment of inertia which also contributed to prevent torsional shear failure like in the other three cases. The presence or absence of glue on the narrow surface of laminations does not seem to have an influence on the values of torsional shear stresses of failure, as seen from the values in Table 4.
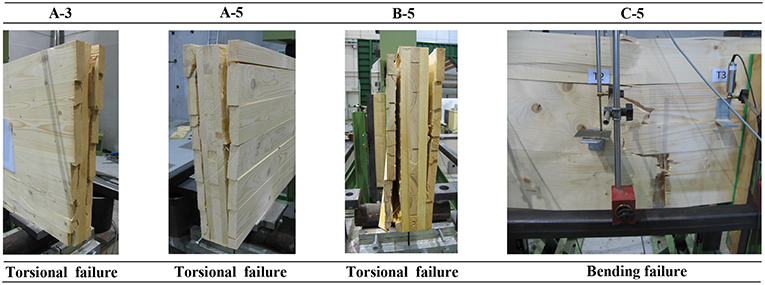
Figure 8. Failure modes.
A comparison can be done with stress values from other authors present in the literature. Regarding bending stresses at failure a value fm,mean = 38, 5MPa was obtained in Jöbstl et al. (2008) using the same four-point bending test procedure used in this article; the authors obtained bending failure for all specimens so the value obtained seems reliable and is indeed higher than all bending stresses in Table 4. In the same paper a different setup is also tested (from Wallner, 2004), presenting two possible failure sections which proved to be effective in obtaining shear failure in the lamellas. The value obtained for shear stresses at failure was fv,mean = 12, 8MPa, which is lower (except for B5 series) than the values obtained here. Two considerations can be done: the first is that, in the present testing campaign, shear failure in the lamellas was not obtained. The second is that the test devised in Wallner (2004) presents a very specific geometry whose capacity to represent real cases of CLT beams and walls is difficult to prove. Another different test setup, based on a particular configuration with orientation of 14° in respect to the compression force, is presented in Brandner et al. (2013) (from Hirschmann, 2011) which achieves shear failure in lamellas with a value fv,mean = 9MPa. Another test which succeeded in obtaining shear failure in lamellas is the one presented in Brandner et al. (2017) (taken also from Kreuzinger and Sieder, 2013; Dröscher, 2014; Brandner et al., 2015). It contemplates a compression test on a column specimen which has grain orientation at an angle in respect to the applied force; results are provided for a series tested at TU Graz and another at TU Munich, which are, respectively, fv,mean = 7, 3MPa and fv,mean = 7, 6MPa. Regarding torsional stresses, the majority of tests found in the literature are on a single crossing interface, such as the ones present in Blaß and Görlacher (2001) and Jöbstl et al. (2004) (from Jeitler, 2004). Torsional stress values at failure obtained from these two works are, respectively, ft,mean = 3, 6MPa and ft,mean = 3, 5MPa, which are well below the values obtained in the present article. This suggests probably that torsional shear strength is much higher in real scale CLT panels, which implies that torsional tests on single nodes may not be representative of the complexity of a complete CLT panel. It is also worth noting that in this paper a Jourawski shear stress distribution was assumed, thus the 1, 5 factor may imply an overestimation of real stress distribution, both for shear stresses in the lamellas and for torsional shear stresses at the glue interface.
9. Conclusion and Future Works
In-plane shear stresses for CLT remain an open topic regarding which method to use for their evaluation and the test setup to measure strength values. This is due to the particular structure of this timber product which, differently from other simpler products like solid wood and GLT, presents different types of failure depending on loading, geometry and layup. In this paper a review and comparison between the available methods to calculate in-plane shear stresses for CLT panels was presented, with particular effort directed at trying to make uniform the notation for all methods to match the one of Figure 3, which will be probably used for the new Eurocode. From the comparison it is evident that for shear stresses in the laminations all methods provide the same values for usual CLT layups, while regarding torsional shear stresses there are still some differences. The RVSE, COST and Beam methods all provide the same single value for torsional shear stress, while the Equilibrium method provides two different values referred to external and internal glued interfaces (for 5 layers panels); for usual CLT layups the average of these two values corresponds to the values of the previous three methods. The method proposed in the Austrian Annex to Eurocode instead provides much higher values than all other methods. An important topic for future developments could be to adopt a single method both for CLT walls and beams in the upcoming Eurocode, since for now two different methods are present in the draft, referring to the wall case or beam case (see Dietsch et al., 2018).
A four-point bending test was then applied to four different types of CLT beams to investigate in-plane shear behavior; in spite of the specifically chosen geometry no shear failure in the laminations was obtained—only torsional shear failure and bending failure in one case, which highlighted the inapplicability of such a testing setup to obtain information about shear strength. It is then necessary to devise a specific test capable of singling out the shear failure in laminations, and promising first results are coming from a test setup based on the diagonal compression of a CLT panel which will be presented in a future paper. Nevertheless, the high values of torsional shear stresses obtained at failure in this paper indicate much higher strength than the values present nowadays in the literature, underlying the importance of testing full-scale CLT panels and not simply conducting torsional tests on single nodes or crossing interfaces, even though this is presently still suggested in EN 16351 (2015).
Data Availability
The datasets generated for this study are available on request to the corresponding author.
Author Contributions
MA, RT, and FB contributed conception and design of the study. MA performed the testing campaign. FB wrote the first draft of the manuscript. RT, MA, and FB wrote sections of the manuscript. All authors contributed to manuscript revision, read and approved the submitted version.
Conflict of Interest Statement
The authors declare that the research was conducted in the absence of any commercial or financial relationships that could be construed as a potential conflict of interest.
References
Andreolli, M., Tomasi, R., and Polastri, A. (2012). “Experimental investigation on in-plane behaviour of cross-laminated timber elements,” in Proceedings of CIB-W18. Växjö.
Blaß, H., and Görlacher, R. (2001). Zum Trag- und Verformungsverhalten von Lignotrend Elementen bei Beanspruchung in Plattenebene. Technical report, Universitt Karlsruhe.
Bogensperger, T., Moosbrugger, T., and Silly, G. (2010). “Verification of CLT-plates under loads in plane,” in Proceedings of WCTE-World Conference on Timber Engineering. Riva del Garda.
Brandner, R., Bogensperger, T., and Schickhofer, G. (2013). “In plane shear strength of cross laminated timber (clt): test configuration, quantification and influencing parameters,” in Proceedings of 46th CIB-W18 Meeting (Vancouver, BC).
Brandner, R., Dietsch, P., Dröscher, J., Schulte-Wrede, M., Kreuzinger, H., Sieder, M., et al. (2015). “Shear properties of cross laminated timber (clt) under in-plane load: test configuration and experimental study,” in INTER Proceedings Meeting 48 2015 (Sibenik), 181–201.
Brandner, R., Dietsch, P., Dröscher, J., Schulte-Wrede, M., Kreuzinger, H., and Sieder, M. (2017). Cross laminated timber (clt) diaphragms under shear: test configuration, properties and design. Construct. Build. Mater. 147, 312–327. doi: 10.1016/j.conbuildmat.2017.04.153
Brandner, R., Flatscher, G., Ringhofer, A., Schickhofer, G., and Thiel, A. (2016). Cross laminated timber (clt): overview and development. Holz als Roh- und Werkstoff 74, 331–351. doi: 10.1007/s00107-015-0999-5
Brandner, R., Tomasi, R., Moosbrugger, T., Serrano, E., and Dietsch, P. (2018). Properties, Testing and Design of Cross Laminated Timber, a state-of-the-art Report by COST Action FP1402 / WG 2. Available online at: https://www.shaker.de/de/content/catalogue/index.asp?lang=de&ID=8&ISBN=978-3-8440-6143-7
Dietsch, P., Schickhofer, G., Brunauer, A., Tomasi, R., Hübner, U., Krenn, H., et al. (2018). “Eurocode 5:2022 Einführung in die neuen Abschnitte Brettsperrholz und Verstärkungen,” in Karlsruher Tage 2018 - Holzbau, eds R. Görlacher and C. Sandhaas (Karlsruhe), 65–84. Available online at: https://graz.pure.elsevier.com/en/publications/eurocode-52022-einf%C3%BChrung-in-die-neuen-abschnitte-brettsperrholz-
Dröscher, J. (2014). Prüftechnische Ermittlung der Schubkenngrößen von BSP-Scheibenelementen und Studie Ausgewählter Parameter. Ph.D. thesis, TU Graz.
EN 16351 (2015). Timber Structures–Cross Laminated Timber–Requirements. Comit Europen de Normalisation CEN.
EN 408 (2012). Timber Structures–Structural Timber and Glue-Laminated Timber–Determination of Some Physical and Mechanical Properties. Comit Europen de Normalisation CEN.
Flaig, M., and Blass, H. J. (2013). “Shear strength and shear stiffness of CLT-beams loaded in plane,” in Proceedings of CIB-W18.
Hirschmann, B. (2011). Ein Beitrag zur Bestimmung der Scheibenschubfestigkeit von Brettsperrholz [A contribution to the determination of in-plane shear strength of cross laminated timber]. PhD thesis, TU Graz.
Jeitler, G. (2004). Versuchstechnische Ermittlung der Verdrehungskenngrößen von orthogonal verklebten Brettlamellen. PhD thesis, TU Graz.
Jöbstl, R., Bogensperger, T., and Schickhofer, G. (2008). “In-plane shear strength of cross laminated timber,” in Proceedings of 41th CIB-W18 Meeting (St. Andrews).
Jöbstl, R. A., Bogensperger, T., Schickhofer, G., and Jeitler, G. (2004). “Mechanical behaviour of two orthogonally glued boards,” in Proceedings of 8th World Conference on Timber Engineering (WCTE2004) (Portland, OR).
Kreuzinger, H., and Sieder, M. (2013). Einfaches prüfverfahren zur bewertung der schubfestigkeit von kreuzlagenholz/brettsperrholz. Bautechnik 90, 314–316. doi: 10.1002/bate.201300024
ÖNORM B 1995-1-1 (2015). Ausgabe: 2015-06-15, Eurocode 5: Bemessung und Konstruktion von Holzbauten Teil 1-1: Allgemeines Allgemeine Regeln und Regeln fr den Hochbau. Austrian Standards. Vienna.
Wallner, G. (2004). Versuchstechnische Ermittlung der Verdrehungskenngrssen von Orthogonal Verklebten Brettlamellen. Master's thesis, TU Graz.
Annex
Comparison Between Equilibrium and RVSE Method
For a 3 layer panel nlay denotes the total number of layers, nlay, x is the number of layers with grain oriented in the x direction, tl,x is the thickness of a single lamination oriented in the x direction):
Equilibrium method
RVSE method
For a 5 layer panels:
Equilibrium method
RVSE method
So for CLT panels (with an odd number of layers) where the layers oriented in the x direction have all the same thickness and this value is greater or equal than the thickness of the layers in the other direction there is coincidence between the two methods; these geometrical characteristics cover the majority of commercial CLT panels.
Keeping the same hypothesis made regarding shear stresses it is possible to compare torsional shear stresses. It can be seen that for a 3 layer panels it is the same value for both methods, while for a 5 layer panel a constant value is obtained from the RVSE method which is the average of the previous internal and external values of equilibrium method.
Equilibrium method
RVSE method
For 5 layer panel Equilibrium method
RVSE method
The raw data supporting the conclusions of this manuscript will be made available by the authors, without undue reservation, to any qualified researcher.
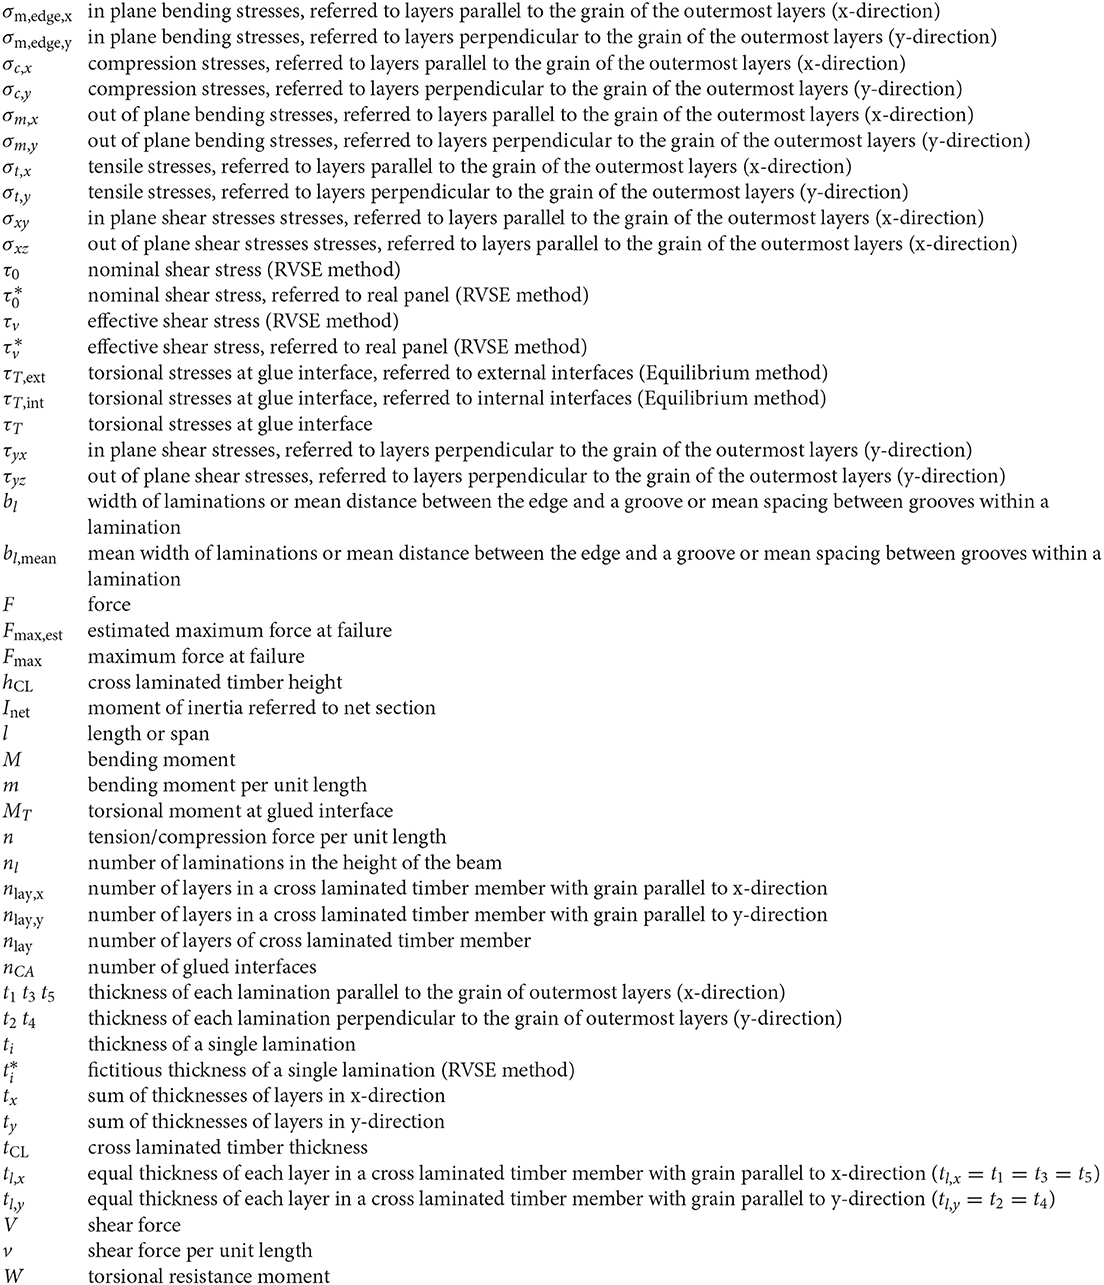
Nomenclature
Keywords: CLT, cross laminated timber, shear, in plane, shear stress, testing, shear strength
Citation: Boggian F, Andreolli M and Tomasi R (2019) Cross Laminated Timber (CLT) Beams Loaded in Plane: Testing Stiffness and Shear Strength. Front. Built Environ. 5:58. doi: 10.3389/fbuil.2019.00058
Received: 03 March 2019; Accepted: 18 April 2019;
Published: 28 May 2019.
Edited by:
Dimitrios Kraniotis, OsloMet - Oslo Metropolitan University, NorwayReviewed by:
Ying Hei Chui, University of Alberta, CanadaGeorge Wardeh, Universit de Cergy-Pontoise, France
Copyright © 2019 Boggian, Andreolli and Tomasi. This is an open-access article distributed under the terms of the Creative Commons Attribution License (CC BY). The use, distribution or reproduction in other forums is permitted, provided the original author(s) and the copyright owner(s) are credited and that the original publication in this journal is cited, in accordance with accepted academic practice. No use, distribution or reproduction is permitted which does not comply with these terms.
*Correspondence: Francesco Boggian, francesco.boggian@unitn.it