Estimating Passenger Car Equivalent of Heavy Vehicles at Roundabout Entry Using Micro-Traffic Simulation
 Robert Pajecki
 Faisal Ahmed1
  Said Easa
- 1Department of Civil Engineering, Ryerson University, Toronto, ON, Canada
- 2Department of Architecture and Civil Engineering, Chalmers University of Technology, Gothenburg, Sweden
- 3School of Humanities and Social Science, Fuzhou University, Fuzhou, China
- 4School of Civil Engineering, Fuzhou University, Fuzhou, China
Passenger Car Equivalent (PCE) is a unit used to represent the impact of a large vehicle on a road by expressing it as the number of equivalent passenger vehicles. This paper focuses on estimating the PCE of various sized heavy vehicles in roundabouts with respect to different entry flow rates. A single-lane roundabout was tested under predefined mixed traffic and demand scenarios in VISSIM micro-simulation environments. The individual and group behavior of four separate heavy-vehicle types were tested: single-unit trucks, buses, small semitrailers, and large semitrailers. The obtained PCE values were found to be on average lower than those suggested in the United States guidelines for roundabouts. The estimated PCE values for heavy vehicles in mixed traffic conditions are 1.30 for single unit trucks, 1.40 for small semitrailers, 1.60 for buses, and 1.70 for large semitrailers. Additional factors such as varying inflow (balanced, unbalanced, and congested traffic) show direct influences on the PCE values. The PCE value under these conditions ranged from 1.25 to 1.75 for smaller vehicles (single-unit trucks, buses, and small semitrailers) and 1.45–2.10 for larger heavy vehicles (large semitrailers). A general equation was developed based on the data to relate vehicle proportions and heavy-vehicle reduction factors that would be useful for professionals to analyze the operational performance of roundabouts with better accuracy.
Introduction
Roundabouts are often used in road design as an alternative to conventional intersections because of their abilities to accommodate high volumes of traffic and minimize delay (Bie et al., 2016; Ren et al., 2016). While numerous merits with regards to handling passenger vehicles, roundabouts become more debatable when considering heavy vehicles. Vehicles rely on yielding and gap entry as opposed to dedicated cycle times which can result in complications when a large vehicle is traversing the roundabout for a longer period. Extended vehicle lengths and slower acceleration times of heavy vehicles are known to directly impede the performance of roundabouts (Chevuri, 2018). This influence can be evaluated by studying the relation between trucks and passenger cars.
Passenger Car Equivalent (PCE) or Passenger Car Units (PCU) are factors used to express the number of cars needed to theoretically replace a non-passenger vehicle to simulate the same effect on a road or intersection. As an example, heavy vehicles, such as trucks or buses, typically have a PCE value of 1.5 or more, meaning that their influence on the road is one and a half passenger cars or more. Using this unit, all traffic on the road can be converted and expressed as several single values of passenger cars, rather than several values of different vehicle types. A single number expressing the volume of cars allows for a better understanding of traffic demand on roads and aids in the roadway design process. More common factors used to derive this value included studying the effects of traffic volume, delay, and gap acceptance. Other vehicle factors known to have an influence on PCE include its length, width, area, acceleration, deceleration, and average speed (Sheela and Kuncheria, 2015). The combinations of these factors lead to the assumption that every vehicle class has a different PCE value associated with it. In addition to vehicle characteristics, other elements on the road have been shown to directly affect the PCE value of the vehicle including road and intersection geometry, volume of vehicles on the road, and the proportion of vehicle types on the road (Sheela and Kuncheria, 2015; Kang and Nakamura, 2016). These contributing factors lead to the development of a range of methods for estimating PCE of vehicles. Shalini and Kumar (2014) summarized common methods for estimating PCE as flow rates, headways, queues, speeds, delays, and travel times. Mohan and Chandra (2015) focused on methods for estimating PCE at unsignalized intersections and proposed additional methods involving occupancy time, potential capacities, and queue clearance rates. These methods have been formulated with a focus on freeways, signalized intersection, and unsignalized intersections. Applying the developed PCE formulas to roundabouts would require the existing methods to be modified to fit roundabout conditions.
The U.S. guidelines used for roundabout design have grouped all heavy vehicles into one category for which a single PCE value is presented. The Second Edition of Roundabouts: An Information Guide and the Highway Capacity Manual provides a general PCE value of 2.0 for all heavy vehicles traveling through a roundabout (National Research Council U. S., 2010; Rodegerdts et al., 2010). This value is used as a conservative estimate and does not accurately reflect the impact of different sized heavy vehicles on roundabouts. The geometric design guide by the American Association of State Highway Transportation Officials (2001) and the Transportation Association of Canada (2017) present several common heavy-vehicle types, ranging from about 10 m (single unit truck) to about 22 m (large semitrailer). Given that the length of a vehicle is a factor that affects PCE and the performance of roundabouts, two trucks of significantly different lengths cannot have an equal impact on a road or an intersection. The generalized PCE values found in the guidelines cannot be considered accurate measures of the impact of varying heavy vehicles in roundabouts. Some guidelines on roundabouts have attempted to improve on this and considered the impact of different heavy vehicles on roundabouts. For example, the estimated models from the United States, UK, Australia, Germany, France, and Switzerland and found that buses and light trucks have recommended PCE values between 1.5 and 2.0 and larger trucks have a recommended PCE values from 2.0 to 3.0 (Rodegerdts et al., 2007). The PCE values that are recommended for roundabouts in these guides are usually directly taken from freeway traffic PCE values with the assumption that PCE values are the same. A few studies have been done to investigate if heavy vehicles in roadways and roundabouts behave similarly.
A summary of the PCE values from the United States guidelines and other research papers is presented in Table 1. A few papers focus on estimating PCE of heavy vehicles in roundabouts. Existing studies have used formulas, assumptions, and data collection methods adopted from freeways and intersections performance checks. All papers examining heavy vehicles in roundabouts have studied no more than two heavy-vehicle types. Researchers often separate heavy vehicles into small and large categories, as PCE values between vehicle types were found be significant. The wide range of estimated PCE values for heavy vehicles in the design guidelines and technical reports have opened a debate on which values are acceptable. Lee (2015) studied three real-world roundabouts in the USA and Canada (Brattleboro, Vermont; De Pere, Wisconsin; Waterloo, Ontario) using an entry flow approach to estimation. The study found that the PCE values for light trucks were 1.0–1.5 and those for heavy trucks were 1.5–2.5.
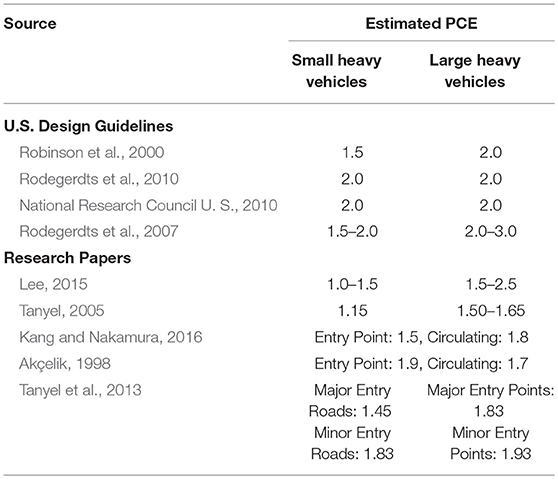
Table 1. Summary of passenger car equivalents for roundabouts.
Kang and Nakamura (2016) researched roundabouts in Hitachitaga City, Japan and found that PCE values of vehicles vary depending on which section of the roundabout was examined. The study showed that the PCE values were ~1.6 for entry traffic and 1.8 for circulating traffic. Akcelik found a similar phenomenon for roundabouts in the UK, 1.9 for entry traffic, and 1.7 for circulating traffic (Kang and Nakamura, 2016). Tanyel (2005) focused on different lengthen buses traversing roundabouts. The study found that mini-buses and standard buses had a PCU of 1.5 and 1.50–1.65, respectively, for the traffic in the circulating lanes. Tanyel et al. (2013) later studied buses through roundabouts in Izmir, Turkey and found that PCE varies depending on the flow rate. The results showed that heavy vehicles from major roads tend to have smaller PCE values than those from minor entry roads. The average values for standard buses were 1.45 for major roads and 1.83 for minor roads. Articulated buses showed a similar pattern, averaging 1.83 for major roads and 1.93 for minor roads. The studies have shown that there are multiple factors that influence PCE including vehicles, position on the road, and traffic volume characteristics. Note that the PCE values are location-based and are not always applicable to other regions in the world.
The studies on PCE values at regular intersections propose that the value should be expressed as a dynamic instead of a static number, contributed by several factors. Sheela and Kuncheria (2015) studied dynamic PCE values at a signalized intersection with mixed traffic conditions. It was found that width, speed, traffic composition, and volume yield had a direct influence on the PCE value, allowing one vehicle to have a varying factor depending on the circumstance. Increasing the proportion of buses from 0 to 50% increased the estimated PCE value from 2.20 to 3.90, while an increase in flow rate from 0.1 to 1 veh/s showed a dramatic increase from 0.61 to 3.59. These large changes in PCE values show the sensitivity of certain factors and the importance of proper scenario setup for more accurate estimates. Prema and Venkatchalam (2013) evaluated the influence of mixed traffic on PCE values on road segments. Similarly, the results confirmed that PCE values vary significantly with the change in traffic volume as well as composition. For the best estimation, PCE should be treated as a dynamic value.
The lack of in-depth analysis of PCE values on individual heavy vehicles types in roundabouts was identified by researchers. Previous guidelines and studies had grouped heavy vehicles into two general categories (small and large) although each heavy-vehicle type varies in characteristics and performance. Most studies have examined PCE values using real-world data. The values found in the studies are generalized as vehicles cannot be examined individually. Not much research has been done to evaluate the effects of increasing heavy-vehicle traffic volume. This paper focuses on determining the PCE values of four heavy-vehicle types under different heavy vehicle and traffic conditions. These heavy vehicles are common in Canada and the USA as defined in the guidelines of American Association of State Highway Transportation Officials (2001) and Transportation Association of Canada (2017). The study is carried out using microsimulation analysis in VISSIM under various mixed traffic and volume scenarios. In the simulation, roundabout conditions can be easily modified and vehicle types can be closely examined. The paper presents an analysis of factors that influence PCE of individual heavy vehicles. A comparative analysis of the interactions of multiple heavy vehicles is studied by modifying existing equations. The equations were established to include multiple heavy vehicles. The PCE values are presented both as estimated static factors for each truck type and as dynamic ranges of values.
The next section presents the proposed methodology, including estimating roundabout PCE using entry flow, vehicle types analyzed, and setup of roundabout model and scenarios in VISSIM. The following section presents the analysis of the simulation results, including independent PCE of heavy vehicles, PCE of heavy vehicles in mixed traffic, and additional factors and effect on PCE, followed by a discussion of the results and conclusions.
Methodology
Most road design guidelines and studies have divided PCE for heavy vehicles into two categories: small heavy vehicles and large heavy vehicles. TAC and AASHTO geometric design guides present a range of common heavy-vehicle types. The main separating characteristics are their dimensions and articulation. This paper focuses on estimating PCE values at roundabouts for four predefined common heavy-vehicle types, including single-unit trucks, buses, small semitrailers, and large semitrailers. The PCE of the vehicle is studied on an individual basis and in mixed traffic scenarios. Using micro-simulation software VISSIM, a simple roundabout was modeled and programmed with various traffic and demand scenarios. The model uses the volume of vehicles entering the roundabouts. Based on the entry volume, comparisons were made and the PCE values were estimated using regression models. The objective was to find more detailed PCE values for a range of truck types to develop more accurate estimates of the impact of heavy vehicles on roundabouts. Using a combination of truck types and scenarios, the impact of heavy vehicles in relation to their proportions was analyzed and a dynamic equation was developed.
Estimating Roundabout PCE Using Entry Flow
Shalini and Kumar (2014) summarized the known methods for estimating PCE. As previously mentioned, since there was no exclusive method to estimating PCE of heavy vehicles at roundabouts, studies have adopted equations from freeways and intersections, assuming the traffic theory can be applied. Focusing on an entry volume approach to estimating values, a few equations were identified that can be applied to roundabouts based on the inputs required in the equations.
Huber (1982) suggested a model for calculating a general PCE value using the ratio between a base model (100% car) stream volume and a truck-present scenario stream volume. Using this ratio and the proportion of trucks in the scenario under analysis, a PCE value was calculated as follows:
where E, Passenger Car Equivalent; PT, proportion of trucks, qm, mixed traffic volume, and qb, base car only traffic volume. Note that Equation 1 determines the number of cars needed to replace one truck in each mixed car-truck volume scenario.
Equation 1, however, does not encompass the effect of multiple truck types into the PCE value as shown in the single variable of the proportion of trucks. Demarchi and Setti (2003) noted this limitation and proposed an equation for directly finding PCE using entry volume and truck proportions as follows:
where = sum of the proportions of heavy vehicles. Equation 2 modifies Equation 1 to include more than one truck type and eliminate any error of multiple vehicle types, including the interaction between multiple truck types.
The methods of determining PCE by Huber (1982) and Demarchi and Setti (2003) are effective and simple to finding single values in mixed traffic scenarios, as noted by E in Equations 1 and 2. These equations can be applied to determine the effect of an individual heavy-vehicle type or as a general estimate of PCE for multiple vehicle types. To derive PCE values of multiple vehicles, Equation 1 would have to be rewritten to include E as a part of the equation. The modified equation has been defined in the Highway Capacity Manual (HCM), as follows:
where fHV, heavy-vehicle adjustment factor, EHV, passenger car equivalent for heavy vehicles, and PT, proportion of demand volume that consists of heavy vehicles. As more heavy vehicles are introduced into a roundabout in place of passenger cars, the circulating flow begins to hinder the total number of vehicles which can enter and pass through the roundabout. This decrease between the number of vehicles in an all-passenger car model to the vehicles in a multiple vehicle type scenario is expressed as the heavy vehicle factor, fHV. The HCM represents the heavy vehicle factor in two equations, one as a relationship between the proportion of trucks as a general truck PCE expressed in Equation 3, and another as a ratio between mixed volume and base volume expressed as follows:
where qm = mixed traffic volume and qb = base car only traffic volume. Although the Equation 4 was developed for 4-way intersections, the methodology to deriving the values may be applied to roundabouts.
A benefit of using an indirect approach to calculate PCE as presented in Equations 3 and 4 is that it is possible to study the interactions between multiple vehicle types. Multiple vehicles may be included in the equation and each vehicle type may have its own PCE value. To include the effect of multiple heavy-vehicle types, the equations can be expanded. A similar procedure was done by Lee (2015), who estimated the PCE of light and heavy trucks in roundabouts concurrently. Equation 3 was rewritten to include the effect any number of non-car vehicle types with a respective PCE variable, as follows:
where Ei = passenger car equivalent for heavy vehicle i and Pi = proportion of demand volume that consists of heavy vehicle i.
An additional approach to estimating PCE uses a modified HCM equation as referenced in Tanyel et al. (2013). The research found that heavy-vehicle volumes below 5.0% had no significant effect on intersection performance. This assumption indicates that such level of heavy vehicles can be treated as irrelevant. PCE values calculated using this approach would be greater than those calculated using the original HCM equation. The modified formula for the proportion of vehicles >5.0% was given by:
where fHVe, heavy-vehicle adjustment factor for entry; PHVe, proportion of demand volume that consists of heavy vehicles at entry, and ET, passenger car equivalent for heavy vehicles at entry.
Similarly, Equation 6 can be rewritten to measure the individual effect on PCE of any number of heavy-vehicle types. The proposed equation subtracts 5.0% proportion from a single heavy-vehicle group. To incorporate this assumption for multiple truck types, the 5.0% subtraction is divided evenly across multiple truck type. The equation adds an extra variable, n, representing the number of heavy-vehicle types being assessed. Incorporating these assumptions, Equation 6 is rewritten as:
where n, number of heavy vehicles assessed.
Vehicle Types Analyzed
Four different heavy-vehicle types were selected for this study to best represent a range of vehicles in terms of length and function. The four vehicles included a single-unit truck, a standard bus, short semitrailer, and long semitrailer. The chosen vehicle models from AASHTO and TAC guidelines were compared to VISSIM to find equivalent or conservative representations of the vehicles. The four heavy vehicles selected, with their lengths and design guideline comparisons, are presented in Table 2. The table includes the vehicle length and name provided in VISSIM software. Two values including the single unit truck and bus are presented in European standards as the VISSIM-developer company is based in Germany (Verkehr, 2011). ASSHTO and TAC guidelines present very similar vehicle lengths that can be used in the model.
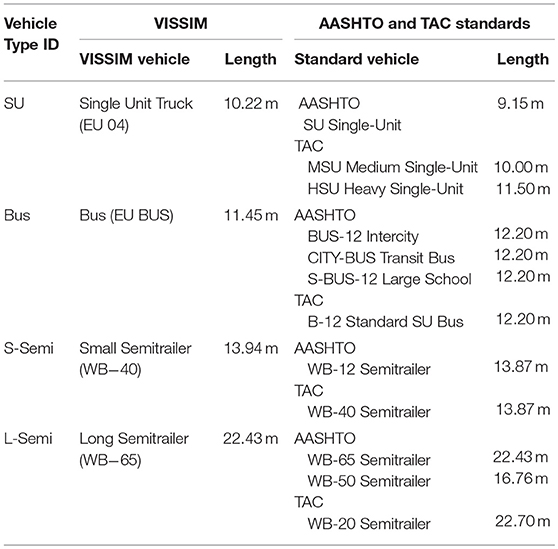
Table 2. Heavy vehicles selected for testing and AASHTO and TAC standard vehicles.
Setup of Roundabout Model and Scenarios in VISSIM
VISSIM is a time-step micro-simulation analysis software for modeling roadway and traffic operations. VISSIM was selected as the software to model a roundabout for its versatility in geometric and operational inputs. To study the vehicles selected, a simple unsignalized roundabout was coded in VISSIM, composed of a 3.5-m entry lane width, 50-m outer circle diameter, 6-m circulating lane width, and 4-m truck apron. The dimensions were selected based on the U.S. guidelines to accommodate the large vehicles being studied (Rodegerdts et al., 2010). A top view of the roundabout prepared in VISSIM is shown in Figure 1A with an example of the roundabout accommodating a large semitrailer shown in Figure 1B. Recommendations from the paper by Trueblood and Dale (2003) and procedures from studies that modeled roundabouts with VISSIM (Bared and Edara, 2005; Dahl, 2011; Li et al., 2013) were considered when constructing the roundabout including proper link setup and speed reduction zones.
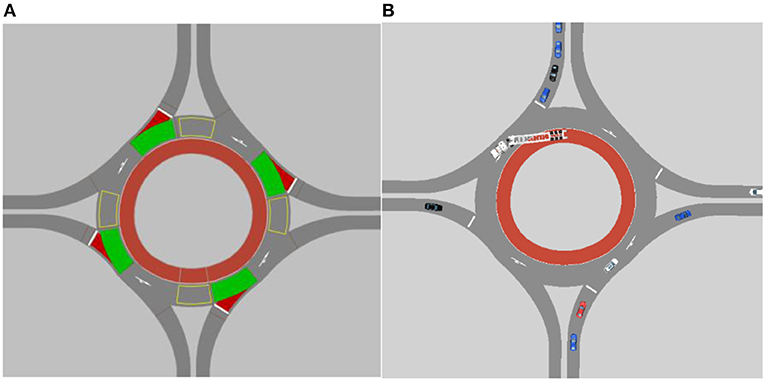
Figure 1. Roundabout modeled in VISSIM: (A) roundabout parameter setup and (B) traffic traveling through the roundabout.
The roundabout was assumed to be set in a non-urban environment and will not look at the impact of pedestrians or cyclists. Vehicles approached the roundabout at a distributed speed averaging 40 km/h and decelerate to 30 km/h when circulating. Vehicle accelerations were set to default values provided by VISSIM, 2.5 and 1.24 m/s2 for trucks and buses, respectively. The yielding points on the roundabout were programmed as conflict areas and set to default values as recommended by the VISSIM manual (Verkehr, 2011). In a study by Wei et al. (2012) that compared conflict areas with priority rules, it was mentioned that with proper link setup, conflict areas realistically simulated yielding at roundabouts with less setup (Dahl, 2011; Li et al., 2013).
To study additional factors that may influence PCE values of heavy vehicles at roundabouts, traffic demand scenarios from Kinzel and Trueblood (2004) were adopted as a part of the experimental setup (Figure 2). The coded VISSIM roundabout was subject to three predefined demand scenarios: a balanced scenario, an unbalanced scenario, and congested scenario with a total entry volume of 2,200, 2,150, and 2,800 vehicles per hour, respectively. In the balanced flow scenario, the entry flows are close to each other, ranging from 500 to 600 (Figure 2A). In the unbalanced flow scenario, there is a large difference between the entry flows that range from 250 to 850 (Figure 2B). In the congested scenario, the flows are very high and range from 600 to 800 (Figure 2C). The selected higher-end volumes were believed to be a good range of inputs to study the effects of PCE in different entry volume scenarios. The authors suggested that when roundabouts reach capacity, more accurate measures of performance could be made. Given the varying distribution of volume across roundabout entry legs, the performance of individual legs can also be examined as an additional factor impacting PCE values.
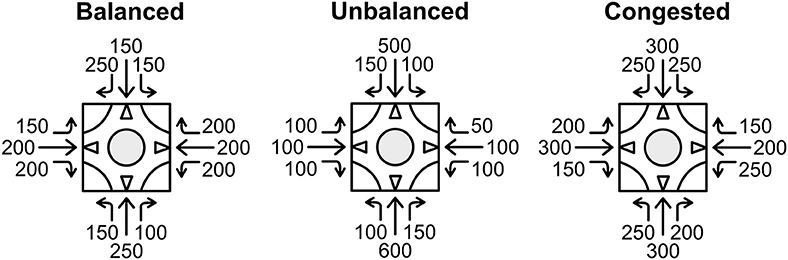
Figure 2. Three volume scenarios: balanced, unbalanced, congested (Kinzel and Trueblood, 2004).
The focus of the study is to analyze the performance of the four heavy vehicles, based on mixed traffic combinations. For each of the three traffic demand scenarios, a base model was established where 100% of the entry vehicles are passenger cars. The proportions of the four heavy vehicles are then introduced in all approaches in Px = [0.00, 0.02, 0.04, 0.06] (i.e., 0, 2, 4, and 6%) increments to create a total of 256 mixed traffic combinations for each scenario. With the introduction of heavy vehicles, the total vehicle demand does not change. A total of 768 mixed traffic scenarios were prepared and tested on VISSIM. Four data collection points, one at each entry point of the roundabout was set up to count the number of vehicles entering the roundabout at each leg. The simulation for each scenario was set to run a 5-min warm-up period, followed by a 1-h data collection period. Each traffic combination scenario was run 10 times using different random seeds and averaged to ensure more accurate results and avoid large discrepancies in the trends.
Analysis of Results
Upon completion of the VISSIM simulations, a total of 768 entry volumes were recorded, composed of three demand scenarios each containing 256 traffic combinations. Three base conditions (all car models) were included for each demand scenario. A base condition was modeled as a point of reference for the change in volume in relation to heavy-vehicle proportions. Base condition volumes for balanced, unbalanced, and congested scenarios peaked at 2,187, 2,132, and 2,267 vehicles per hour, respectively.
Independent PCE of Heavy Vehicles
To better understand the performance of heavy vehicles in the network and the factors that influence PCE values, the vehicles were first analyzed on an individual basis. The PCE values of individual truck type scenarios were calculated from the simulation data using Huber (1982) approach defined by Equation 1. The values are found to represent the average PCE value obtained from the three traffic scenarios. Figure 3 shows the change in average PCE in relation to vehicle proportion for each of the four-heavy-vehicle types. The results show that PCE tends to increase as the proportions increase. All values converged to a set value at different rates. Flowing the trend lines, it is estimated that PCE values for heavy vehicles are 1.15 for single unit trucks, 1.30 for small semitrailers, 1.45 for buses, and 1.50 for large semitrailers. Smaller vehicles, such as the single unit truck, reached a set of PCE values much sooner compared to the other vehicle types. The PCE values of buses, small semitrailers, and large semitrailers grow when the proportions increase. With each increase, however, the rate of growth decreases.
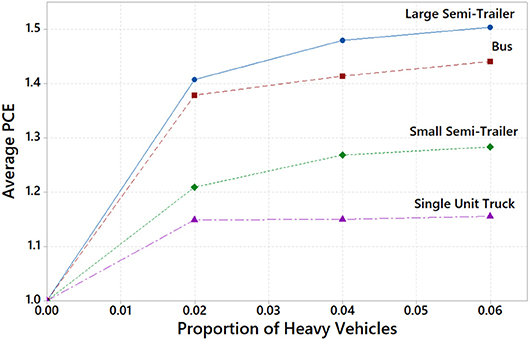
Figure 3. Independent PCE values of four heavy-vehicle types.
Vehicle length is one of the main characteristics in predicting the PCE value. The shortest and longest heavy vehicles being studied have the smallest and largest estimated PCE values. However, buses are the third largest vehicle studied, but they have the second largest PCE value. This value is much higher than anticipated which is most likely due to the acceleration and decelerations parameters defaulted in the initial microsimulation setup. Factors other than length can contribute to largely fluctuating vehicle performance and estimated PCE values. Overall, the values estimated are in the lower ranges, most likely due to their isolated conditions.
PCE of Heavy Vehicles in Mixed Traffic
The PCE for each heavy vehicle in a mixed traffic scenario was calculated using the proposed Equations 5 and 7. Such a PCE value would incorporate the impact of multiple heavy vehicles on the roundabout. Using regression models, the PCE values for the four heavy-vehicle types were calculated.
The first approach used in calculating individual heavy-vehicle PCE follows the equation proposed by the Highway Capacity Manual. Using the entry volumes, the heavy-vehicle factor was found by dividing the total mixed traffic entry by the corresponding base case model as represented in Equation 4. Equation 5 was expanded to include the four vehicles being studied as shown in Equation 8. The results were summarized and imported onto Minitab where a regression analysis was setup by equating the calculated reduction factor in Equation 4 to the theoretical factor, as follows:
where fHV, heavy-vehicle adjustment factor, PA, B, C, D, proportion of demand volume that consists of four heavy vehicles A, B, C, and D, respectively, and EA, B, C, D, passenger car equivalent for four heavy vehicles A, B, C, and D, respectively. Given that all the vehicles being studied are larger than passenger cars, the model was subject to the constraints that all PCE values are > 1.0. Table 3 presents the estimated PCE values from regression analysis using balanced, unbalanced, congested, and all-scenario.
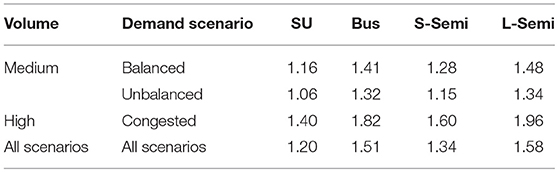
Table 3. Estimated PCE values for three demand scenarios and all scenarios for HCM method.
The second approach of calculating PCE values of each heavy vehicle involves a slight modification of the first approach. Using the modified equation based on Tanyel et al. (2013) model, Equation 7 was expanded to include the four vehicle types being studied, as follows:
Equation 9 equally divides the 5.0% truck reduction across all truck types. The values of the reduction factors found in Equation 4 were equated to Equation 9 to develop an equation. A regression analysis was performed on Minitab with the constraints that all PCE values are > 1.0. Table 4 summarizes the estimated PCE values from the regression analysis for each vehicle type under balanced, unbalanced, congested, and all-scenarios.
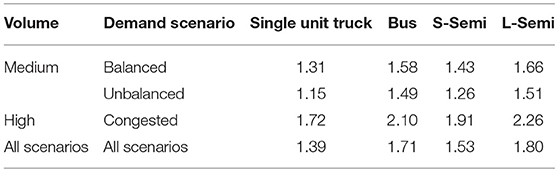
Table 4. Estimated PCE values for three demand scenarios and all scenarios for Tanyel et al. method.
Additional Factors and Effect on PCE
The influence of traffic conditions on multiple vehicle types was analyzed. Figure 4 shows the change in PCE values when increasing heavy-vehicle proportions in three traffic demand scenarios. The results show that the PCE values stay either consistent or increase slightly when the proportion of heavy vehicle increases. Consistent values can be seen for single unit trucks and buses, where increasing the proportions would retain its value or close to it. Major increases can be noticed in small and large semitrailers, especially in unbalanced and balanced scenarios. Increasing vehicle proportion from 2 to 6% increases the average PCE value by as much as by 0.2 units. A more significant increase in PCE values is shown when focusing on the traffic demand scenarios. Unbalanced traffic produced the lowest PCE values. Balanced flow produces slightly higher values but remain relatively on the lower end. Values in the congested scenario are significantly larger than the other two. The results show that larger vehicle demand, especially when approaching saturation, significantly increases PCE values of heavy vehicles. Vehicles in the congested conditions add increases the PCE value by 0.4 to 0.8.
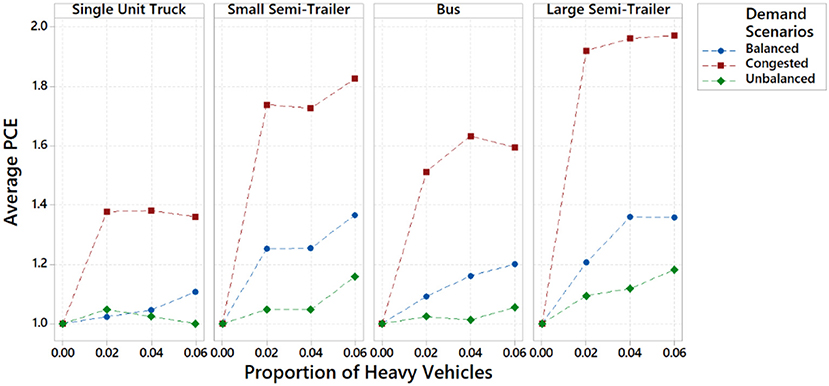
Figure 4. Effect of demand scenarios on PCE for individual vehicle types.
The impact of heavy vehicles on the roundabout was also studied qualitatively by observing heavy-vehicle factors and volumes at each roundabout entry point in the three traffic demand scenarios. Heavy-vehicle factors were calculated for each traffic combination using Equation 4. In general, as the proportion of heavy vehicles increases, heavy-vehicle factor decreases. In the balanced scenario, the North, East, and West entry showed a decrease in entry volumes, most significant in the East. The South entry showed almost no change. Unbalanced scenario showed North and South entry points had a large decrease in vehicle volume when adding more heavy vehicles. East and West entry flows showed almost no change. The uneven drop in performance across the entry points appears to be related to the initial demand setups as in Figure 2. Entry points with lower volumes, or minor roads, show little decrease in performance when introducing heavy vehicles. Entry points with the highest initial volume were the most sensitive, when the proportions of trucks increase and traffic flow decreases. The PCE values of heavy vehicles approaching from the major roundabout entry points were more likely to increase compared to minor entry points when heavy-vehicle proportions are increased. This analysis confirms that volume distribution across roundabout entry points impacts performance and produces varying PCE values. To simplify the analysis of individual heavy-vehicle PCE values in this study, the changes in roundabout performance for the scenarios was examined as the sum for all legs.
Discussion
Using regression analysis, we found a reasonable range of values. The results show that the various heavy-vehicle types studied have individual impacts on the roundabout as indicated by their corresponding PCE values. It is shown that traffic demand would also have an influence on PCE. Almost all the values estimated for the studied vehicle types were lower than those recommended in the U.S. design guide. However, the values are all within a reasonable range. The estimated values show better matches to those of previous studies on PCE at roundabouts. Part of the reason for the lower PCE values can be attributed to the design of the roundabout model. The roundabout was designed to accommodate long vehicles comfortably, and it is usually well-enough to help improve the flow and reduce PCE. Another reason can be due to the use of an entry volume approach for calculating the heavy-vehicle factor. The entry volume analysis may be less receptive than other methods to estimating performance reductions in roundabouts, which could result in lower estimated PCE values.
The individual analysis of PCE values for heavy vehicles (Figure 3) was much lower than anticipated. The lower values were most likely a result of isolated conditions where only one vehicle type was present on the roadway. The results showed that a single heavy-vehicle type alongside passenger cars would have a much smaller PCE value than that usually recommended in roadway design guides. Such values, however, may not be completely accurate as real-world traffic would have a mix of different types of vehicles. Further analysis showed that different types of heavy vehicles have an influence on each other when sharing the roundabout.
The two approaches for estimating PCE values in mixed traffic (Equations 8 and 9) produced a range of values higher than those of the individual analysis. The HCM approach showed smaller values than those in Tanyel et al. (2013) approach (see Tables 3, 4). Compared to their approach, the PCE values of heavy vehicles from the HCM approach are approximately 0.2 units lower. Generally, the estimated PCE values fell below the common guideline recommendation of 2.0. In only certain conditions did the PCE value approach or surpass 2.0. This exception includes buses and large semitrailers in conjected high-volume traffic. Both approaches showed a good fit to the data. The estimated values of the different types of vehicles were distinct, where the values ranged from 0.1 to 0.5-unit difference. It is evident that each truck type has a unique PCE value, due to a combination of several factors including length, acceleration, truck composition, demand volume, and approach scenario.
With a focus on traffic demand, the PCE values from the lowest to the highest corresponded to unbalanced, balanced, and congested traffic scenarios. The congested traffic scenario showed much higher values overall, supporting the claim that as roundabouts reach capacity the values can change dramatically. Values in congested scenarios showed to peak by around 0.4 units compared to the other scenarios. Another observation is that the values of unbalanced conditions were around 0.1 lower than that of balanced scenarios. In the initial micro-simulation setup, the balanced and unbalanced scenarios had nearly the same total traffic flow volume. This observation was also noticed by Tanyel et al. (2013) who studied unbalanced roundabout entry flows.
The values derived from mixed traffic analysis in Tables 3, 4 can be used to estimate more accurate PCE values for individual vehicles. The average individual PCE values of heavy vehicles in all demand scenarios rounded to the nearest 0.05 unit were 1.30 for single unit trucks, 1.40 for small semitrailers, 1.60 for buses and 1.70 for large semitrailers. This trend is similar to that of individual vehicle analysis in Figure 3, although the numerical values are estimated to be about 0.1 to 0.2 units greater.
In general, the estimated PCE values for individual heavy vehicles increase as their lengths increase. The shortest vehicle (single unit truck) is estimated to have the lowest PCE, on average ranging from 1.20 to 1.39. The average PCE of buses ranged from 1.51 to 1.71, while semitrailers fell lower, ranging from 1.34 to 1.53. The longest vehicle (large semitrailer) is estimated to have the largest PCE, on average ranging from 1.58 to 1.80. The bus and small semitrailer do not follow the length-to-PCE trend but do show a positive trend (see Figure 5). As noted, the lower and upper ranges of the PCE were calculated as a function of vehicle length. These ranges show that PCE increases as vehicle length increases. The shift in data results from external factors, and bus acceleration and deceleration parameters were halved by default on VISSIM. Although buses are smaller than semitrailers, their lower acceleration rates used for passenger safety resulted in greater estimated PCE values, confirming that vehicle acceleration is an additional factor to consider in estimating PCE values.
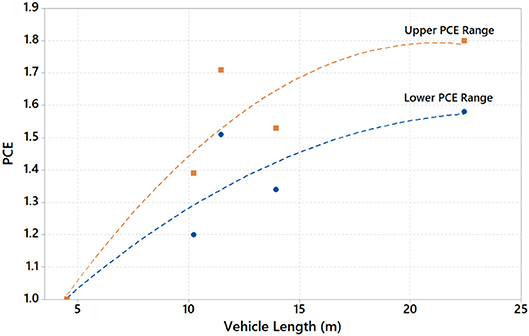
Figure 5. Relation of vehicle length to PCE values.
For a more practical approach to estimating the impact of heavy vehicles on a roundabout, the estimated PCE values for individual trucks can be categorized into two groups: smaller heavy vehicles and large heavy vehicles. The group for small heavy vehicles consists of single unit trucks, buses, and small semitrailers (S-Semi). This grouping was selected as the vehicles are closely related in terms of length which ranges from about 10–14 m. The second group for large heavy vehicles consists of a single truck type and large semitrailer (L-Semi), whose length is >22 m. The estimated PCE values can also be classified in relation to the demand scenario since certain combinations show a significant difference in data. The PCE values categorized by scenario and length were averaged and rounded to the nearest 0.05 unit. The PCE values based on heavy-vehicle size and demand are presented in Table 5.
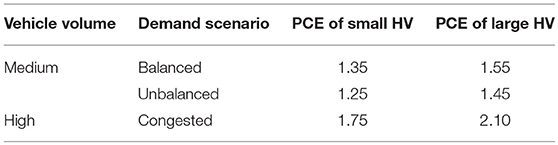
Table 5. Recommended PCE values based on heavy-vehicle size and traffic demand.
A general equation was developed to represent the relationship between small and large heavy vehicles and their effect on roundabout performance. The equation was represented non-linearly with independent and co-dependent variables. Using Minitab, a regression model was estimated. The predictor selected for the model was the heavy-vehicle reduction factor (fHV). The continuous predictors consisted of two variables, the portion of small heavy vehicles (sum of Single Unit, Bus, and Small-Semi proportions) and the proportion of large heavy vehicles (total Large-Semi Proportions). These variables were used to form a second-degree polynomial consisting of six terms, as follows:
where Ps, proportion of small vehicles, PL, proportion of large vehicles, a to e = coefficients to be determined in the regression analysis applied to all scenarios, and f = constant for each scenario. The constant of Equation 10 is predicted to be around 1 as the heavy-vehicle factor for a no-truck combination should theoretically be 1.0. In the Minitab analysis, the categorical predictor for the regression model was the demand scenario.
The regression model for finding heavy-vehicle factors using small and large heavy-vehicle proportion is given by:
Equation 11 relates the heavy-vehicle adjustment factor fHV to the proportions of the small and large vehicles Ps and PL, respectively. All coefficients were statistically significant, and they have the correct sign. The goodness of fit of Equation 11 was excellent, where R2 was 94.0%. For each demand scenario, a unique constant (f) was estimated. Values for balanced, unbalanced, and congested scenarios are 1.010, 0.971, and 1.024, respectively. These values are considered to be closer to each other and their average is around 1.0, matching the earlier prediction. A comparison between the heavy-vehicle factors calculated using Equation 11 and those obtained from the micro-simulation model show a 99.9% individual confidence level. The proposed equation can be applied as a substitution to the heavy-vehicle factors calculated from entry volume and base condition volumes. The interaction between small and large heavy vehicles on the heavy-vehicle factor is shown in Figure 6, based on Equation 11. While the equation itself is non-linear, the graph appears to be a linear interaction for the range of the analyzed values. It is evident that large heavy vehicles have a greater influence on the heavy-vehicle factor.
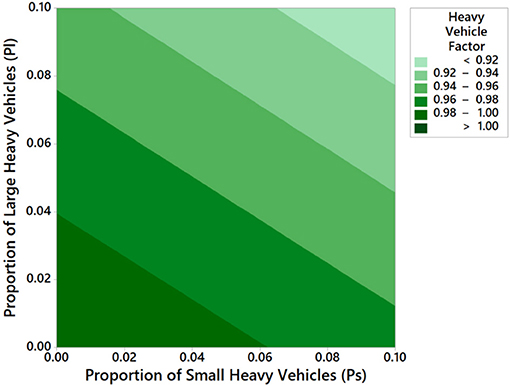
Figure 6. Contour plot of HV factor in relation to small and large HV proportions.
Conclusions
The PCE values found for the four heavy-vehicle types show reasonable values with a good fit of the estimated models. The estimated PCE values for different vehicle types were distinct, indicating that each truck has a different impact on the roundabout. The entry volume proved to be a good predictor of roundabout performance, showing that common heavy vehicles have unique corresponding PCE value. The average estimated PCE values for different heavy-vehicle type in mixed traffic are 1.30 for single unit trucks, 1.40 for small semitrailers, 1.60 for buses, and 1.70 for large semitrailers.
By grouping the four vehicles, more dynamic values can be recommended in relation to traffic demand scenarios. The smaller heavy vehicles were classified as single unit trucks, buses, and small semitrailers, while large semitrailers were classified as large heavy vehicles. For small and large heavy vehicles, respectively, the PCE values were 1.35 and 1.55 for a balanced approach, 1.25 and 1.45 for unbalanced approach, and 1.75 and 2.10 for congested conditions. We found that the PCE values obtained in this study were lower than those suggested in the United States road design guides. The intent of the paper has been realized by confirming that the PCE values for roundabouts presented in the design guides were often overestimated, generalized, and should consider the impact of multiple vehicle types. Further research can focus on confirming the PCE values of individual vehicle types using real-word data. Additionally, other factors that affect roundabout performance for specific heavy-vehicle types can be evaluated in more depth.
Data Availability
The raw data supporting the conclusions of this manuscript will be made available by the authors, to any qualified researcher, pending permission from the research sponsor.
Author Contributions
SE, FA, and XQ study conception and design. RP, FA, XQ, XZ, and YY literature review. RP, FA, and SE data collection. RP, FA, SE, XQ, and YY analysis and interpretation of results. RP, FA, XQ, XZ, YY, and SE draft manuscript preparation. All authors reviewed the results and approved the final version of the manuscript.
Funding
Natural Sciences and Engineering Research Council of Canada.
Conflict of Interest Statement
The authors declare that the research was conducted in the absence of any commercial or financial relationships that could be construed as a potential conflict of interest.
Acknowledgments
The authors are grateful to three reviewers for their thorough and most helpful comments. This research is financially supported by a discovery grant from the Natural Sciences and Engineering Research Council of Canada (NSERC).
References
Akçelik, R. (1998). Roundabouts: Capacity and Performance Analysis. Research Report ARR No 321. ARRB Transport Research Ltd, 149.
American Association of State Highway and Transportation Officials (2001). Policy on Geometric Design of Highways and Streets. Washington, DC: American Association of State Highway and Transportation Officials.
Bared, J.G., and Edara, P. K. (2005). “Simulated Capacity of Roundabouts and Impact of Roundabout Within a Progressed Signalized Road,” in National Roundabout Conference (Vail, CO), 23.
Bie, Y., Cheng, S., Easa, S. M., and Qu, X. (2016). Stop Line set back at a signalized roundabout: a new concept for traffic operations. J. Transport. Eng. ASCE 142:05016001. doi: 10.1061/(ASCE)TE.1943-5436.0000829
Chevuri, P. (2018). Trucks at roundabouts: a synthesis study. J. Transport. Tech. 8:81637. doi: 10.4236/jtts.2018.81004
Dahl, J. (2011). Capacity Estimation for Roundabouts with High Truck Volume Using Gap Acceptance Theory [Master Thesis], Windsor: University of Windsor.
Demarchi, S. H., and Setti, J. R. (2003). Limitations of PCE derivation for traffic streams with more than one truck type. Transp. Res. Rec. 1852, 96–104. doi: 10.3141/1852-13
Huber, M. (1982). Estimation of passenger car equivalents of trucks in traffic stream. Transp. Res. Rec. 869, 60–70.
Kang, N., and Nakamura, H. (2016). An analysis of heavy vehicle impact on roundabout entry capacity in Japan. Transport. Res. Proc. 15, 308–18. doi: 10.1016/j.trpro.2016.06.026
Kinzel, C. S., and Trueblood, M. T. (2004). “The effects of operational parameters in the simulation of roundabout,” ITE 2004 Annual Meeting and Exhibit. Washington, DC: Institute of Transportation Engineers, 15.
Lee, C. (2015). Developing passenger-car equivalents for heavy vehicles. J. Transport. Eng. 141:04015013. doi: 10.1061/(ASCE)TE.1943-5436.0000775
Li, Z., DeAmico, M., Chitturi, M. V., Bill, A. R., and Noyce, D. A. (2013). “Calibration of VISSIM roundabout model: a critical gap and follow-up headway,” in TRB 92nd Annual Meeting in Washington. Washington, DC: Transportation Research Board.
Mohan, M., and Chandra, S. (2015). New Methods of PCU Estimation at Unsignalized Intersections. Surat: Recent Advances in Traffic Engineering.
National Research Council U. S. (2010). HCM 2010: Highway Capacity Manual. Washington, DC: Transportation Research Board.
Prema, P. S., and Venkatchalam, T. A. (2013). Influence of traffic mix on PCU values of vehicles under heterogeneous traffic conditions. Int. J. Traffic Transp. Eng. 3, 302–330. doi: 10.7708/ijtte.2013.3(3).07
Ren, L., Qu, X., Guan, H., Easa, S.M., and Oh, E. (2016). Evaluation of roundabout capacity models: an empirical case study. J. Transport. Eng. ASCE 142:04016066. doi: 10.1061/(ASCE)TE.1943-5436.0000878
Robinson, B. W., Rodegerdts, L. A., Scarborough, W, Kittelson, W., Troutbeck, R., Brilon, W., et al. (2000). Roundabouts: An Informational Guide. FHWA-RD-00-067, Washington, DC: Federal Highway Administration, U.S. Department of Transportation.
Rodegerdts, L. A., Bansen, J., Tiesler, C., Knudsen, J., Myers, E., Johnson, M., et al. (2010). Roundabouts - An Informational Guide, 2nd Edn. (NCHRP Report 672). Washington, DC: Transportation Research Board.
Rodegerdts, L. M., Blogg, E., Wemple, E., Myers, M., Kyte, M., Dixon, G., et al. (2007). Roundabouts in the United States: NCHRP Report 572. Washington, DC: Transportation Research Board of the National Academics.
Shalini, K., and Kumar, B. (2014). Estimation of the passenger car equivalent: a review. Int. J. Emerg. Technol. Adv. Eng. 4, 97–102.
Sheela, A., and Kuncheria, I. P. (2015). Dynamic PCU values at signalized intersections in India for mixed traffic. Int. J. Traffic Transp. Eng. 5, 197–209. doi: 10.7708/ijtte.2015.5(2).09
Tanyel, S. (2005). “Yuvarlakada kavşaklarda anaakimdaki agir araç yüzdesinin yanyol kapasitesi üzerindeki etkisi,” in Dokuz.Eylül Üniversitesi Mühendislik Fak. Fen ve Mühendislik Dergisi (İzmir), 719–30.
Tanyel, S., Çalişkanelli, S. P., Aydin, M. M., and Utku, S. B. (2013). An investigation of heavy vehicle effect on traffic circles. Digest 24, 1675–1700.
Transportation Association of Canada (2017). Geometric Design Guide for Canadian Roads. Ottawa, ON: Transportation Association of Canada.
Trueblood, M., and Dale, J. (2003). Simulating Roundabouts With VISSIM. Urban Street Symposium. Anaheim: Transportation Research Board. 11p.
Keywords: roundabout, passenger car equivalent, heavy vehicles, trucks, buses
Citation: Pajecki R, Ahmed F, Qu X, Zheng X, Yang Y and Easa S (2019) Estimating Passenger Car Equivalent of Heavy Vehicles at Roundabout Entry Using Micro-Traffic Simulation. Front. Built Environ. 5:77. doi: 10.3389/fbuil.2019.00077
Received: 05 March 2019; Accepted: 21 May 2019;
Published: 12 June 2019.
Edited by:
Tullio Giuffre, Kore University of Enna, ItalyReviewed by:
Trung Ngoc Ngo, University of Wollongong, AustraliaPanrawee Rungskunroch, University of California, Berkeley, United States
Copyright © 2019 Pajecki, Ahmed, Qu, Zheng, Yang and Easa. This is an open-access article distributed under the terms of the Creative Commons Attribution License (CC BY). The use, distribution or reproduction in other forums is permitted, provided the original author(s) and the copyright owner(s) are credited and that the original publication in this journal is cited, in accordance with accepted academic practice. No use, distribution or reproduction is permitted which does not comply with these terms.
*Correspondence: Said Easa, seasa@ryerson.ca