 Rajan Dhakal1*
 Rajesh Rupakhety
- 1Faculty of Civil and Environmental Engineering, Earthquake Engineering Research Center, University of Iceland, Selfoss, Iceland
- 2Department of Architecture and Civil Engineering, City University of Hong Kong, Kowloon Tong, Hong Kong
To identify dynamic characteristics of representative reinforced concrete frame buildings with brick infills, ambient vibration measurements were taken in two four-storied buildings—one situated in soft soil and the another in stiff soil. Non-parametric as well as parametric system identification (SID) algorithms were used to estimate vibration frequencies and damping of the two buildings. The numerical models of the buildings were created using the finite element method. The modal frequencies and damping ratios obtained from ambient measurements were used to calibrate and tune the finite element models. The comparison between measured vibration frequencies and those obtained from finite element model highlights the need for accuracy in modeling assumptions, in particular, consideration of the stiffness of infill walls and the flexibility of foundation soil. The finite element models calibrated with SID results were used to estimate the response of the two buildings when subjected to strong ground motion recorded at different places in the Kathmandu Valley during the 2015 Gorkha earthquake. The results show that not considering flexibility of foundation and stiffness of infill walls, as is commonly done in engineering practice, can lead to inaccurate estimates of seismic demand.
Introduction
Accurate modeling of dynamic properties of buildings and other structures is essential to estimate their capacity to resist dynamic loads imposed by ground shaking during earthquakes. Response spectral analysis, which is the most commonly used method in seismic design of ordinary buildings, requires an estimate of the fundamental period of vibration of the structure being designed. Such periods are often estimated from empirical equations based on the height of the building. Such empirical estimates are associated with large uncertainties owing to their simplicity. Alternatively, such periods can be estimated from numerical models of the building, [for e.g., through eigen analysis of their finite element model (FEM)]. Although generally more accurate than empirical models, the reliability of an FEM is conditioned on the accuracy of modeling methods and parameters. For an FEM to be accurate for estimation of vibration periods, the mass, and stiffness of different components of the building being analyzed need to be properly modeled. While there is not much uncertainty associated with building mass, modeling its stiffness can be challenging due to reasons such as need to create simple models and lack of knowledge. For example, stiffness contribution by infill walls in a reinforced concrete (RC) frame building is often ignored. Flexibility of the underlying soil is also often ignored, and a rigid foundation model is adopted. Lack of information about the underlying soil is often the reason for not accounting for its flexibility in FEMs.
Dynamic system identification (SID), also known as operational modal analysis, provides an alternative means of estimating vibration properties of structures. Such identification methods make use of measurements of excitation and response of a structure to estimate its dynamic properties. Such measurements can come from earthquake-induced shaking, wind vibration, traffic induced vibration, or ambient vibration. In case of ambient vibration, the excitation need not be measured and is often assumed as a white noise process. Ambient vibration measurements can be a quick and effective method for dynamic identification of structures. Further details regarding different algorithms and their application can be found elsewhere (see, for e.g., Jenkins and Watts, 1968; Söderström and Stoica, 1989; Ljung, 1999; Sawaki et al., 2019; among others). Alvin et al. (2003) provide a very detailed overview of structural SID methods and applications. SID using ambient vibration measurement is becoming popular in recent research (see, for e.g., Goel and Chopra, 1997, 1998; Hong and Hwang, 2000; Gallipoli et al., 2009, 2010; Astroza et al., 2013; Vidal et al., 2014; De Angelis and Pecce, 2019; O'Reilly et al., 2019; Sawaki et al., 2019; among others). Boutin and Hans (2009) and Sawaki et al. (2019) made use of earthquake-induced and ambient vibration measurement for estimating vibration periods and damping ratios of buildings. Vidal et al. (2014) performed ambient vibration measurement in several buildings in Spain before and after the Lorca Earthquake. They concluded that such measurements can be used to identify changes in vibration periods of the buildings due to damaged caused by ground shaking. Sawaki et al. (2019) and Vidal et al. (2014) concluded that empirical equations given in design standards fail to accurately estimate fundamental period of typical buildings.
Dynamic properties of urban buildings in Nepal have not been studied thoroughly. There are several uncertainties associated with numerical modeling of reinforced cement concrete buildings in Nepal, for e.g., (i) uncertainties about the material properties due to lack of strict quality control in construction, (ii) uncertainties about the stiffness provided by brick infill walls, and (iii) uncertainties about the foundation and underlying soil. Numerical models created with such uncertainties may not be suitable for reliable design and vulnerability assessment of these buildings and therefore need to be calibrated/updated with independent information. Dynamic properties inferred from SID can be an effective means for such calibration/updating. Only a few studies have conducted SID of structures in Nepal. Jaishi et al. (2003) conducted such studies on Pagoda style heritage buildings. Varum et al. (2017) and Yu et al. (2017) performed dynamic identification of high-rise condominiums. Sawaki et al. (2019), Sawaki et al. (2018), Dhakal (2020), and Gautam (2018) studied residential RC buildings. As RC buildings in Nepal vary widely in terms of materials, design, layout, and workmanship, rigorous efforts are needed to characterize variability in their dynamic properties. Such characterization can be based on a campaign of SID of many buildings covering different heights, infill walls, and other characteristics. Such a campaign is underway and expected to last a few years. This study presents some results of this campaign. The main objective of this work is to present how ambient vibration measurements can be used to estimate dynamic properties of typical buildings in Nepal and subsequently validate/update their FEMs. Consequences of improper modeling and lack of validation in estimating seismic demands are also highlighted by performing numerical simulation of the response of buildings subjected to strong ground motion recorded during the 2015 Gorkha earthquake.
Methodology
Details of SID methods and numerical modeling used in the study are described in the following.
System Identification
Ambient Vibration Measurement
Ambient vibration measurements were performed in two four-storied buildings in Kathmandu. The vibrations were recorded by three triaxial accelerometers. The accelerometers were placed tentatively at the geometrical center of the buildings in three different floors. The accelerometers used in this study are ETNA2 manufactured by Kinemetrics Inc., California, and CUSP accelerometers made by Canterbury Seismic, New Zealand. Each accelerometer is a stand-alone unit with built-in transducer and data acquisition system. Each unit was equipped with GPS timing signal to synchronize the measured vibrations.
Non-parametric System Identification
Non-parametric SID was performed by spectral analysis using Welch averaged periodogram. Representing the complex frequency response function by H(Ω), an estimate of its squared amplitude can be obtained as follows:
where Ŝuu (Ω) and Ŝyy (Ω) are estimates of power spectral density (PSD) functions (psdf) of excitation and response, respectively, and Ω is the circular frequency. Periodograms provide an estimate of psdf of ergodic processes [see, for e.g., Jenkins and Watts (1968)]. The periodograms suffer from estimation bias and variability [see Rupakhety and Sigbjörnsson (2012) for more details], and some sort of smoothing operation is required. Welch's algorithm provides an estimate of psdf by dividing the signal into several segments and averaging the periodogram of the different segments. For an ergodic and stationary random process, the Welch algorithm provides a good estimate of the true spectra of the process. When the excitation is ambient noise, the excitation can be assumed to Gaussian white noise with an unknown variance. In this case, based on Equation 1, a scaled (by the excitation variance) estimate of the transfer function (squared amplitude of complex frequency response function) is obtained directly from Ŝyy (Ω). The natural vibration frequencies can then be picked from the peaks of Ŝyy (Ω). For vibration modes that have damping up to 10% of critical, the peak is expected to occur close to the undamped vibration frequency of the mode. Damping ratios of the corresponding models can be estimated from the half-bandwidth method (Papagiannopoulos and Hatzigeorgiou, 2011) as follows:
where Δf is the half-power bandwidth defined in the frequency band where the power density of the response reduces to half its value at the peak; f 1 and f 2 are frequencies at the corners of half power and f n is the frequency of the peak.
Parametric Method
There are several parametric models of SID based on time series models [see, for e.g., Ljung (1999)]. In this study, the numerical algorithm for subspace state space system identification (N4SID) was used. Further details of the N4SID approach can be found in Van Overschee and De Moor (1994). The N4SID method relies on a state-space formulation of the system, which is a set of input, output, and state variables linked together by first-order differential equations. An important consideration in the N4SID algorithm is the selection of a suitable model order. For example, identification of a structure with a single mode of vibration requires at least a model order of 2. As buildings vibrate in different modes, it is not always straightforward to know which modes of vibration are excited by ambient noise and therefore detectable. The analyst needs to select a proper model order and examine the stability of identified vibration frequencies and damping ratios. Selection of suitable model number helps to remove spurious modes and bias of the modes. Spurious modes are either noise modes, which arise due to physical reasons, e.g., excitation and noise, or mathematical modes that arise due to overestimation of the model order. Similarly, bias of the modes can be defined as the combination of different modes (true mode and noise mode) on identified mode, which is due to underestimation of model order. Stabilization plots are useful tools for selection of suitable model order, but expert judgment is often necessary.
Finite Element Modeling
FEMs of the case study buildings were created in ETABS 2017 Ultimate, version 17.0.1 (Computers Structures Inc, 2018). The FEM comprises three-dimensional beam column elements to represent the moment resisting RC frame and shell elements to model the brick masonry walls of building. FEMs with and without soil flexibility were created to compare their vibration frequencies to those obtained from SID. To achieve this, three types of FEMs were created. Model 1 was created as a three-dimensional bare frame with floor slabs modeled by shell elements, and the bases of the columns are fixed to the ground. The weight of the infill walls is modeled as a line load at the top of beams and slabs. In Model 2, infill walls are modeled by shell elements, and the base of the columns are fixed to the ground. In Model 3, infill walls are modeled using shell elements, and soil flexibility is modeled using spring elements placed at the base of the columns.
Ground Motion and Structural Analysis
Elastic time history analyses were performed using horizontal ground motion recorded during the 2015 Gorkha earthquake. Inelastic behavior is not modeled in this study as the main focus is on the comparison of SID results with FEMs. The buildings did not suffer any visible damage after the damage, which indicates that they were most likely not loaded beyond their yield limit. The ground motions were recorded at THM, PTN, and KATNP stations in the Kathmandu Valley. Further details of the recording stations and the ground motions can be found in Takai et al. (2016) and Rupakhety et al. (2017). Response spectral analysis was also performed. Response spectral models from Eurocode 8 (EC8) (European Committee for Standardization, 2004) and the Indian standards (Bureau of Indian Standards, 2002) were scaled to the mean peak ground acceleration (PGA) of the three ground motions recorded at THM, PTN, and KATNP stations. The EC8 spectral shape used here corresponds to site class D, and the IS spectral shape corresponds to soft soil site. The EC8 and IS response spectra along with those of the recorded ground motion are shown in Figure 1 for comparison. The code-based spectra capture the overall shape of the mean spectra of recorded motion at vibration periods shorter than 1 s but fail to model the long period components of the recorded ground motions.
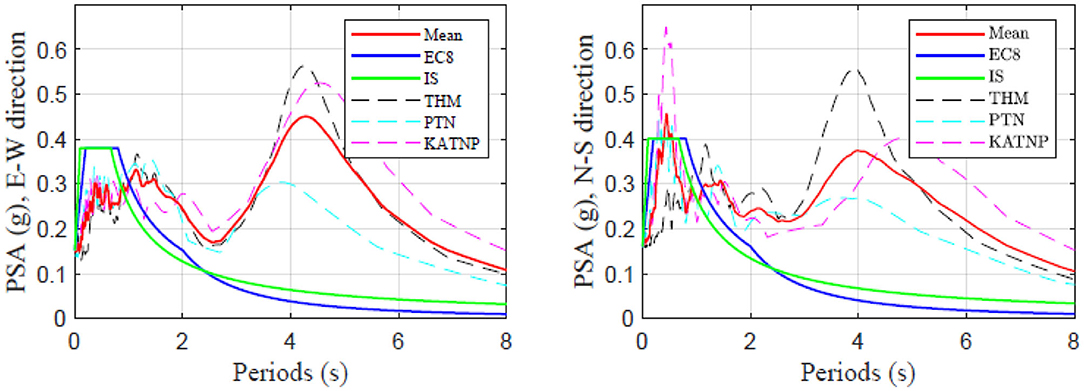
Figure 1. Elastic response spectra (5% damped) of horizontal ground motion recorded at three soft soil stations in the Kathmandu Valley during the 2015 Gorkha earthquake. The average spectra along with those based on IS and EC8 are also shown for comparison.
Case Study
Two residential buildings, called Tyangla house and Nakhu house, situated in the Kathmandu Valley were selected for this study. Both buildings are RC cast in situ moment resisting frames with brick masonry infill walls. The structural layout and mechanical properties of the materials used in the buildings are given in Table 1. Nakhu house is asymmetrical in plan with off-grid location of columns and beams. Infill masonry walls are made of locally made solid clay bricks with cement–sand mortar. The FEMs of the buildings are shown in Figure 2.

Table 1. Structural layout and mechanical properties of the materials used in the buildings being studied.
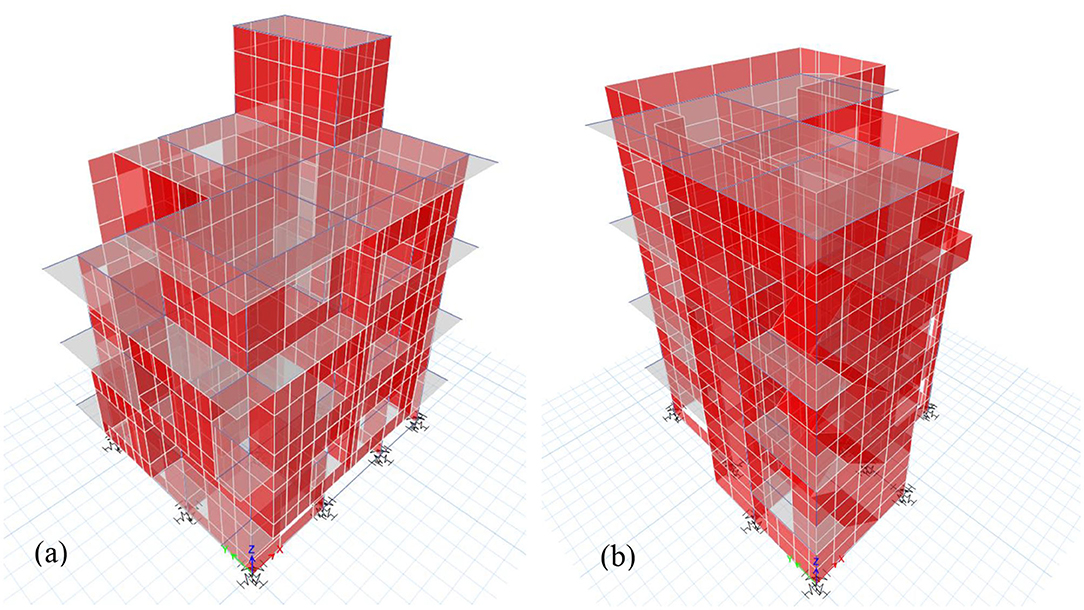
Figure 2. FEMs with infill walls and foundation springs, i.e., Model 3 of (a) Tyangla house and (b) Nakhu house.
The Nakhu house is constructed on alluvial deposits consisting of soft materials such as sand and organic clay. Geotechnical investigation of building sites in Kathmandu Valley is usually performed for commercial and government buildings (Gautam 2016) only. Such investigations rely on standard penetration tests, and SPT-N values are reported. Gautam (2016) presents empirical equations for correlating shear wave velocity of soils in Kathmandu Valley to the N-values obtained from SPT tests. These correlations are represented by the following equations.
SPT-N values from three borehole logs near the Nakhu house are used to estimate soil properties. Three such borehole logs are available [see Dhakal (2020) for further details]. Each log consists of 20-m-deep profile with N-value every 1.5 m. The N-values were converted to Vs using Equation 3, and average shear wave velocity at each borehole was estimated. The estimates from the three boreholes were averaged to obtain representative shear wave velocity of 230 m/s for the soil layers at the Nakhu building site. Tyangla house is built on rock site overlain by ~10 m of soft soil. The estimated shear wave velocity of the top 20 m at Tyangla house is 400 m/s. Mass density and Poisson ratio of the soil is taken as 1,800 kg/m3 and 0.35, respectively. The stiffnesses of soil springs are calculated from equations given in Dutta (2010). The mechanical properties of soils and corresponding stiffnesses of the soil springs are given in Table 2.
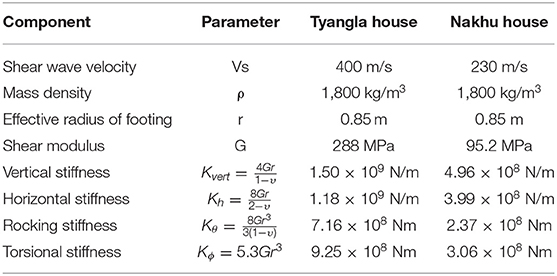
Table 2. Mechanical properties of soil and the corresponding spring stiffnesses.
Results and Discussion
System Identification
Non-parametric Method
Ambient vibration records were divided into 20 equal segments. For each segment, the mean acceleration was subtracted, and the resulting signal was tapered with Tukey windows. The signals were bandpass-filtered using fourth-order Butterworth filter in the range of 0.5–20 Hz. PSD of the filtered signals was estimated using Welch's algorithm. More details about the PSD of ambient vibrations recorded at the first, the second, and the third floor of the Nakhu house are reported in Dhakal (2020). The PSD of the ambient vibration measurements from the Tyangla house is reported in Sawaki et al. (2019).
Table 3 presents the fundamental vibration period and damping ratio of the Nakhu house obtained from the PSD functions of ambient vibrations at the three floors. In each floor, the vibration periods are averaged over the 20 segments of measured time series, and standard deviation is computed. Then the average of these parameters in the three floors is computed.
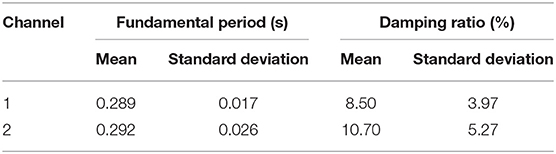
Table 3. Average values of fundamental period and damping ratio of Nakhu house computed from ambient vibration using the non-parametric method.
The fundamental periods estimated at the different floors did not vary significantly, for example, from 0.29 to 0.296 in channel 2. The variation in fundamental periods estimated from different segments of the measurements was also small, as can be seen from the standard deviations reported in Table 3. Variation in damping ratio was higher, both between different floors and, more significantly, between different segments of the measurements. Damping ratios estimated from the PSD function by using the half-power bandwidth is known to be associated with large uncertainties because smoothing, which is a consequence of averaging periodograms of different segments of the signal, can flatten the peaks of the estimated PSD [see, for e.g., Peeters and De Roeck (2001)]. The fundamental period of vibration of the Tyangla house was estimated by Sawaki et al. (2019) using aftershocks of the 2015 Gorkha earthquake and ambient vibration measurements. Using Welch's average periodogram of 362 ambient vibration signals, the average fundamental period of the house in the direction of channel 2 was reported as 0.295 s with a standard deviation of 0.02 s. The corresponding mean and standard deviation in damping ratio were reported as 0.05 and 0.007, respectively.
Parametric Method
The N4SID method was used by Dhakal et al. (2020) to estimate the fundamental period and damping ratio of the Nakhu house. The results obtained from this method are presented in Table 4. The fundamental vibration period and damping ratio of the Tyangla house reported by Sawaki et al. (2018) using the autoregressive method with exogeneous input (ARX) are also presented. The results reported in Sawaki et al. (2018) are based on vibrations caused by three aftershocks of the 2015 Gorkha earthquake.
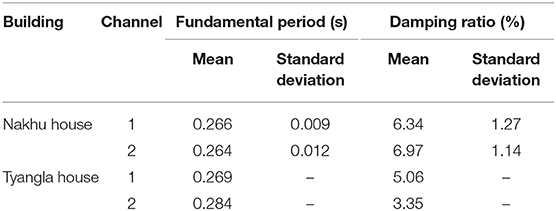
Table 4. Fundamental period of vibration and damping ratio of Nakhu and Tynagla house obtained from parametric methods of system identification.
The results obtained from the parametric method are similar to that obtained from the non-parametric method but associated with less variability between different segments of the measured signal. Damping ratios of the Nakhu house estimated from SID are higher than what is commonly adopted for such structures, i.e., in the range of 2 to 5%. However, the uncertainty in the estimation of damping ratio is much higher than that in the fundamental period of vibration. Damping ratios of the Nakhu house obtained from the non-parametric method are higher than those obtained from parametric method. Similar observations are presented for the Tyangla house in Sawaki et al. (2018).
Eigen Analysis
A summary of modal parameters for Tyangla house and Nakhu house is presented in Tables 5, 6, respectively. The corresponding mass participation ratios are shown in the parenthesis. The participation ratios show that the first mode of vibration of both the buildings is along the Y direction (see structural layout in Table 1). The results show that Model 1, which does not account for the stiffness provided by the infill wall, results in vibration periods much longer than that estimated from SID. The results obtained from Model 3, which considers both the stiffness of infill walls and the flexibility of foundation, are close to those obtained from SID. Guler et al. (2008) presented an empirical equation between fundamental vibration period and height of RC moment resisting frames with brick infill walls as follows:
where t is the fundamental period of the building, and H is the height of the building in meters. The results obtained from SID and the empirical model of Guler et al. (2008) are compared with the results obtained from FEMs in Table 7. Table 7 shows that the vibration periods obtained from SID are very close to the empirical observations by Guler et al. (2008). In terms of finite element modeling, the importance of modeling soil flexibility is higher for the Nakhu house than for Tyangla house. This is because Tyangla house is built on stiffer soil than Nakhu house. Ignoring the stiffness of infill walls results in large error vibration periods of the FEM. The fundamental period of vibration of the Nakhu house obtained from the model with flexible soil foundation is ~18% larger than that obtained from the model assuming rigid foundation.
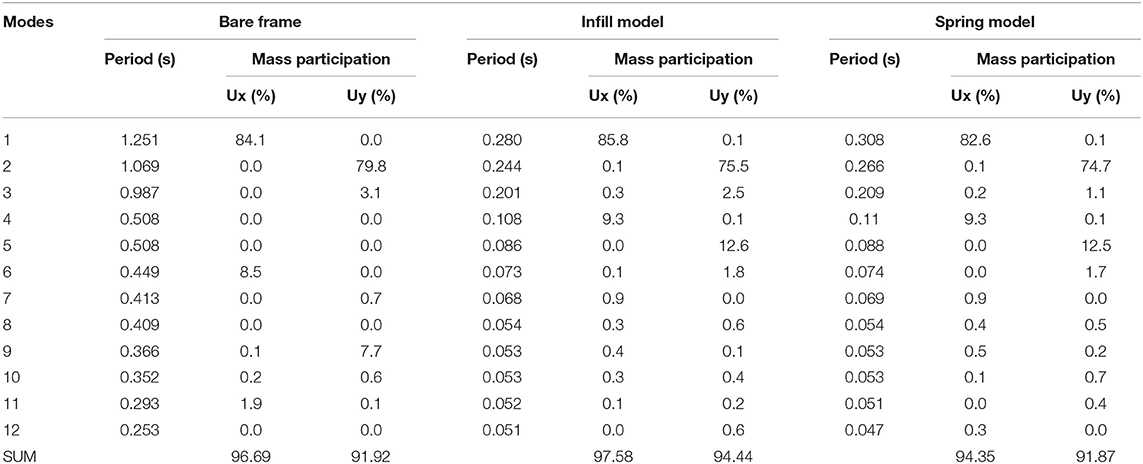
Table 5. Summary of modal period and mass participation (Tyangla house).
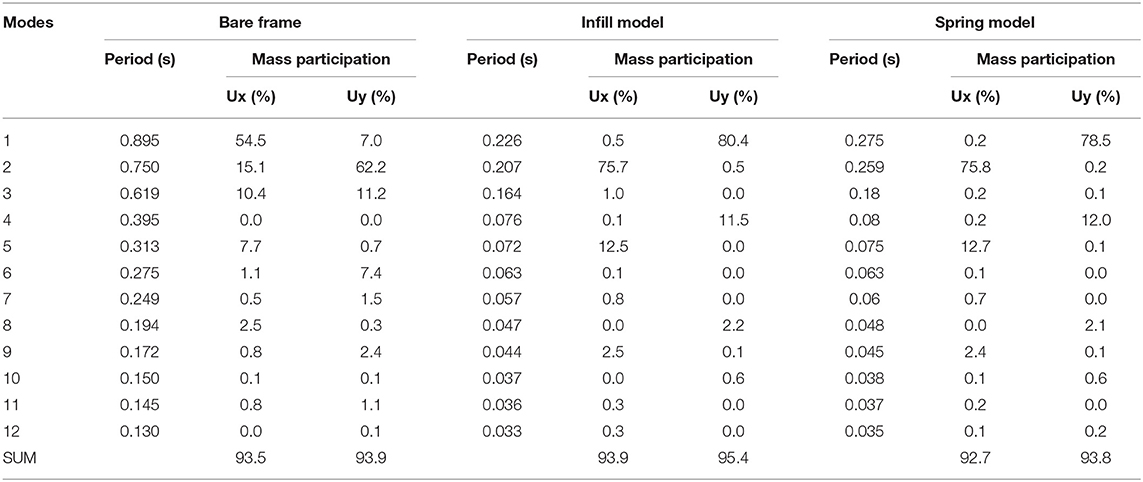
Table 6. Summary of modal period and mass participation (Nakhu house).

Table 7. Comparison of the fundamental vibration period of the case study buildings estimated by different methods.
Time History and Response Spectral Analysis
The base shear coefficients (peak base shear normalized by the weight of the building) obtained from time history analysis are presented in Figure 3. Three ground motions are used for time history analysis. Ground motions recorded in the east–west and north–south directions are applied in X (channel 1) and Y (channel 2) directions of the buildings. Results from response spectral analysis using the mean spectra of the three ground motions, as well as the EC8 and IS spectra scaled to the mean PGA of the recorded ground motions, are also shown. The number of modes used in response spectral analysis was selected so that that the modal mass participation is more than 95% of the mass of the buildings. The square root of sum of squares is used for modal combination. In most cases, the base shear coefficients computed from Models 1 and 3 differ significantly. In some cases, the difference is as high as 50%, for example, in the north–south direction of the Nakhu house subjected to ground motion recorded at PTN station. The difference in base shear coefficients obtained from different FEMs varies greatly with ground motion. For example, under the PTN ground motion, Model 1 predicts lower base shear than Model 3 in the east–west direction, but the opposite in the north–south direction. This depends on the frequency content of ground motion and the difference in the vibration period of the models depending on how detailed and accurate they are. Even when a response spectrum from a design code such as the IS code is used, the difference in the response predicted by the different models can be vastly different. It is also not possible to know in advance which of the models is more conservative as it depends to a great extent on where in the period axis of the response spectra the fundamental period of vibration of the structure lies. For Models 2 and 3, the estimated base shears from response spectra of EC8 and IS are the greatest in both horizontal directions. This is because the fundamental period of the structure lies at the plateau of the spectra, and the plateau is higher than the mean spectra. Similarly, lower estimation of response by response spectrum analysis in case of Model 1 is because the fundamental period of the buildings lies well to the left of the plateau where the code spectral ordinates are lower than the mean spectra of recorded ground motion. These results show that the estimated base shear can vary a lot, depending on the accuracy of the FEM, and therefore proper calibration of the model using SID is very valuable. Response spectrum analysis using the bare frame model and IS spectra is the usual approach to seismic design in Nepal. For common buildings such as the ones studied here, bare frame models without due consideration for soil flexibility may result in underestimation of base shear by up to 50% in the hazard scenario considered here.
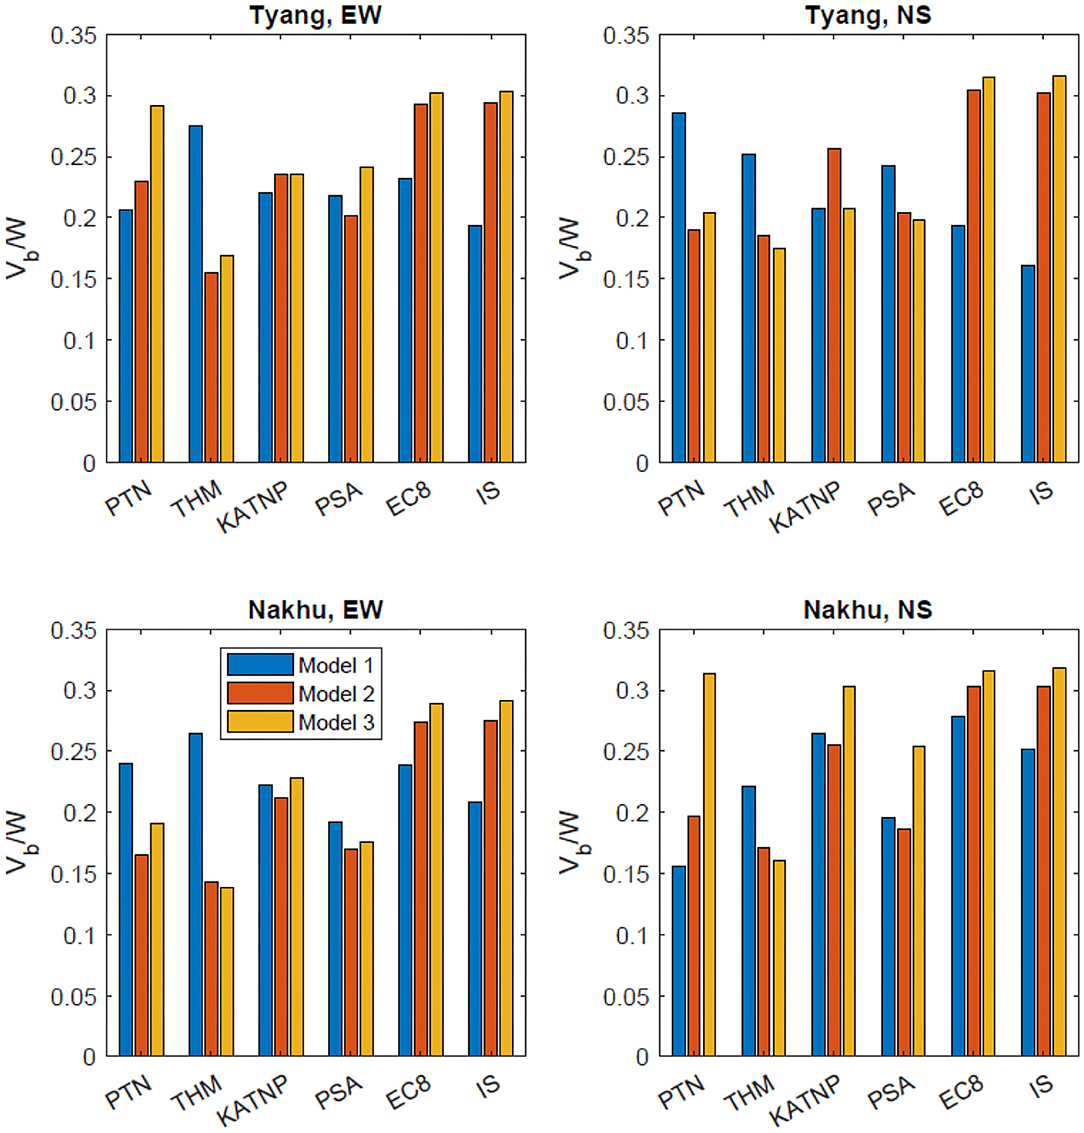
Figure 3. Base shear coefficients in the two orthogonal directions of Tyangla and Nakhu house. The bars represented by PSA correspond to mean response spectra of the three ground motions recorded at PTN, THM, and KATNP.
Displacements along the height of the Tyangla house when subjected to the IS response spectral loading are presented in Figure 4. Model 2, which represents the stiffest structure, shows the smallest displacement. Model 1, which overestimates the fundamental vibration period of the building by a factor of ~3, also overestimates the displacement demand. The difference between the models with and without infill walls is more pronounced in displacement demand than in base shear demand. This is because, while the pseudoacceleration spectrum has a rising and a falling section with a plateau in between, the displacement demand generally tends to increase with increasing period of vibration. Similar results were observed with the recorded ground motions and the EC8 spectrum.
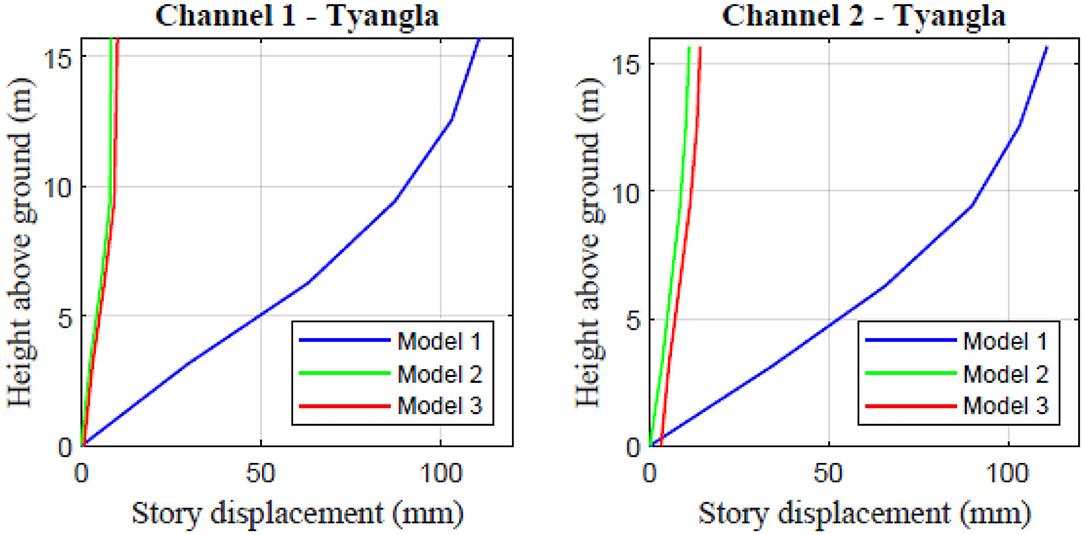
Figure 4. Displacement along the height of the Tyangla house when subjected to the IS response spectrum.
To predict potential infill wall damage, maximum interstory drift (ISD) was studied. Different codes and authors have specified damage limitation requirements based on ISD. For example, FEMA-306 (Applied Technology Council, 1998a) and FEMA-307 (Applied Technology Council, 1998b) propose drift limit for brick masonry as 1.5%, and the drift limit for the initiation of diagonal cracking as 0.5%. Similarly, initiation of light reparable damage is expected to occur at drift ratio of 0.25%.
Maximum ISD ratios of the two buildings when subjected to the IS response spectra are shown in Figure 5. Drift ratios of 0.25 and 1.5% are also shown for reference. The model without infill walls shows a large variation of drift ratios over the height, with higher values near the base of the building. Drift ratios predicted by the models with infill walls are fairly constant over the height of the buildings. The drift ratio predicted by Model 1 is much larger than that predicted by the other two models. Model 1 of both the buildings predicts drift ratios as high as 1%, which should have initiated diagonal cracks if the shaking at the building sites is adequately represented by the response spectra being used. Drift ratios obtained from the recorded ground motions and the EC8 spectra showed similar trends as shown in Figure 5. Only minor cracks in the surface plaster of some infill walls were observed in these buildings. This observation is consistent with the low drift ratios predicted by the models with infill walls. The difference between the ISD ratio predicted by Models 2 and 3 are similar.
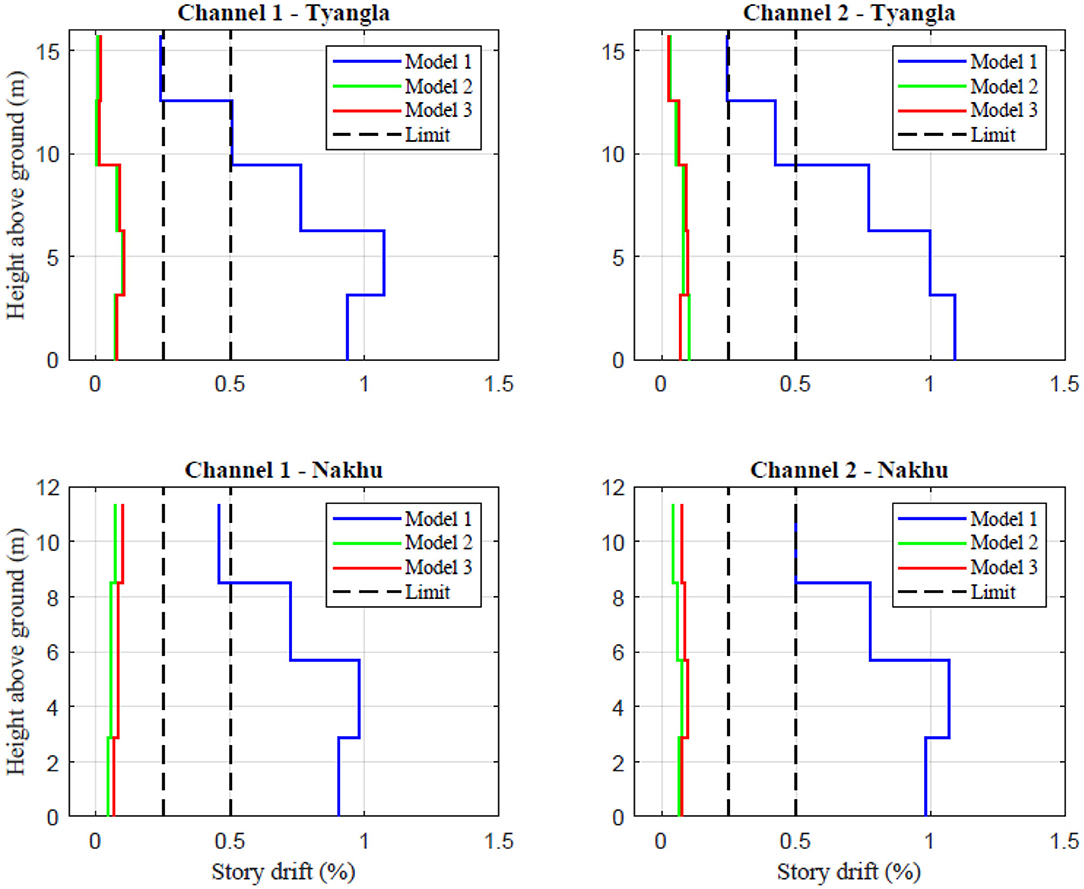
Figure 5. Maximum interstory drift ratio of Tyangla house and Nakhu house using IS response spectrum.
Performance of critical columns is checked in both buildings using axial force and bending moment interaction diagram (P–M diagram). The P–M interaction diagrams of the columns were estimated using the IS 456:2000 standard (Bureau of Indian Standard, 2000). Design load combination is 1.5 times the dead load and 1.5 times the seismic load represented by the IS spectrum. The results corresponding to the three FEMs of the two buildings are shown in Figure 6. Model 3 predicts much larger bending moment than the other two models. The PM values predicted by Model 3 are well-outside of the design envelope, which implies significant damage. This is not consistent with the performance of the buildings as their columns did not suffer any visible damage. According to Models 2 and 3, one of the columns of the Tyangla house falls slightly outside of the safety envelope, although none of the columns suffered any damage. This can be attributed to the fact that the actual ground motion experienced by the building is not exactly represented by the IS spectrum.
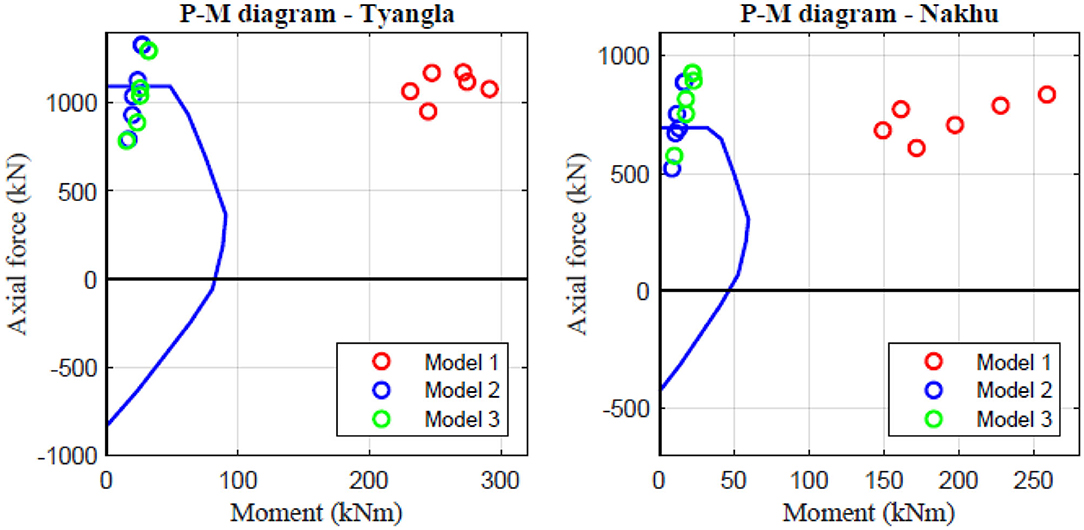
Figure 6. P–M interaction diagrams of critical columns. Markers on the plots represent moment and axial force demand predicted by the three FEMs.
Conclusions
The results of this study show that SID using ambient vibration noise is a reliable method to estimate fundamental period of vibration of typical residential buildings in Kathmandu. Two RC moment resisting frame buildings with brick infill walls were used for case study. The results show that fundamental period of vibration estimated from ambient vibrations is associated with lower variation than damping ratio. Furthermore, parametric time series methods such as the autoregressive models and state-space–based formulations result in lower variability in estimated vibration period and damping ratio compared to simple non-parametric methods that rely on spectral estimates of measured signals. The fundamental vibration period estimated from SID is comparable to empirical models available in the literature, which is an indirect but independent check on the validity of the results. It was also observed that the eigen periods of more detailed FEMs that incorporate the stiffness of infill walls and flexibility of foundation soil are much closer, compared to bare frame models, to the periods identified from ambient vibration. This highlights the importance of modeling the stiffness of infill walls in seismic analysis and design. The mechanical properties of soils at the sites of the buildings used in this study were known. In such situations, the results from SID can be used as an independent verification of FEMs. The value of SID is more apparent when the properties of the underlying soil are not known. In such situations, results of SID can be used to calibrate the soil properties by matching identified periods of vibration with those obtained from the FEMs. This applies not only to soil properties, but also to other uncertainties associated with mechanical modeling of structures.
Seismic design of buildings in Nepal relies on Bureau of Indian Standards (2002) standards. Seismic actions are estimated from designated response spectrum, and the fundamental period of the building is often calculated from empirical equations based on the height of the building (or number of floors). As a tentative estimate, 0.1 s times the number of floors is often used. In some cases, FEMs and eigen analysis are used to estimate modal properties and the corresponding seismic action. It is a common practice to ignore the stiffness of infill walls in such models. Our results show that FEMs, which ignore the stiffness of infill walls, provide a gross overestimation of the fundamental period of vibration, which results in, for the most common buildings (3- to 5-story), underestimation of base shear demand and gross overestimation of displacement demand. In this context, reliable estimates of fundamental period of buildings with different number of floors and types of infill walls (wall thickness, opening ratio, etc.) are necessary for estimation of seismic action. Ambient vibration measurements, by virtue of their cost-effectiveness and ease of operation, offer an excellent opportunity for sampling many buildings. Such measurements can then be used to correlate fundamental vibration period to building properties such as height and types of infill walls.
Seismic analyses of the case study buildings were carried out using recorded ground motion from the 2015 Gorkha earthquake and the EC8 and IS spectra scaled to the mean PGA of the recorded ground motions. The results highlight that the presence of infill walls increased the story shear and base shear. In contemporary design, brick infills are designed only to support gravity loads. The seismic analysis and design are based on bare frame models, which do not consider the stiffness of infill walls. The results from the case study buildings show that such models are not reliable in estimating base shear and displacement demand on the structure. The results show that models with infill walls are much stiffer than the bare frame models, and the difference in the fundamental period estimated from the two models can be large (for e.g., 0.3 s against 1.2 s). In the case studies analyzed here, the demand on the infill walls was not large enough to crack them. During stronger shaking, infill walls may crack and lose their stiffness, which can have a large impact on the seismic response of the structure. As the walls crack, shear force carried by them needs to be safely transferred to the columns, which can result in overloading. In this context, more research on dynamic mechanical properties of masonry infill walls used in residential buildings in Nepal and practical engineering models of such properties is a very important research field.
Data Availability Statement
The raw data supporting the conclusions of this article will be made available by the authors, without undue reservation.
Author Contributions
RD conducted formal analysis and prepared first draft. RR formulated the problem and developed the methodology and edited the manuscript. DG conducted ambient vibration measurement and edited the manuscript. All authors contributed to the article and approved the submitted version.
Funding
RR acknowledges support from the University of Iceland research fund.
Conflict of Interest
The authors declare that the research was conducted in the absence of any commercial or financial relationships that could be construed as a potential conflict of interest.
Acknowledgments
We express sincere thanks to the owners of the case study buildings for allowing us to conduct ambient vibration tests. We thank Rabindra Adhikari, Chuda Raj Dhakal, Lalit Bhatt, and Raghabendra Yadav for their support during the measurements.
References
Alvin, K. F., Robertson, A. N., Reich, G. W., and Park, K. C. (2003). Structural system identification: from reality to models. Comput. Struct. 81, 1149–1176. doi: 10.1016/S0045-7949(03)00034-8
Applied Technology Council. (1998a). FEMA306: Evaluation of Earthquake Damaged Concrete and Masonry Wall Buildings: Basic Procedures Manual. Washington, DC: Applied Technology Council.
Applied Technology Council. (1998b). FEMA307: Evaluation of Earthquake Damaged Concrete and Masonry Wall Buildings - Technical Resources. Washington, DC: Applied Technology Council.
Astroza, R., Ebrahimian, H., Conte, J. P., Hutchinson, T. C., and Restrepo, J. I. (2013). “Evolution of dynamic properties of a 5-story RC building during construction,” in Topics in Dynamics of Civil Structures, Volume 4. Conference Proceedings of the Society for Experimental Mechanics Series, eds F. Catbas, S. Pakzad, V. Racic, A. Pavic, and P. Reynolds (New York, NY: Springer). doi: 10.1007/978-1-4614-6555-3_19
Boutin, C., and Hans, S. (2009). “How far ambient noise measurement may help to assess building vulnerability?” in Increasing Seismic Safety by Combining Engineering Technologies and Seismological Data (Dordrecht: Springer), 151–180.
Bureau of Indian Standard (2000). Indian Standard IS. IS 456: 2000: Plain and Reinforced Concrete. Code of Practice (4th Revision). New Delhi: Bureau of Indian Standard.
Bureau of Indian Standards (2002). Indian Standard IS. IS 1893 (Part 1): 2002: Criteria for Earthquake Resistant Design of Structures (5th Revision). New Delhi: Bureau of Indian Standard.
De Angelis, A., and Pecce, M. R. (2019). The structural identification of the infill walls contribution in the dynamic response of framed buildings. Struct. Control Health Monitor. 26:e2405. doi: 10.1002/stc.2405
Dhakal, R. (2020). System identification and seismic analysis of residential RC building in Kathmandu, Nepal. (M.sc. Thesis), Reykjavik: University of Iceland.
Dhakal, R., Rupakhety, R., Gautam, D., and Elias, S. (2020). “System identification of code conforming low-rise RC building in Kathmandu, Nepal,” in Proceedings of the XI International Conference on Structural Dynamics (Athens).
European Committee for Standardization. (2004). Eurocode 8: Design of Structures for Earthquake Resistance -Part 1 : General Rules, Seismic Actions and Rules for Buildings. Belgium: European Committee for Standardization.
Gallipoli, M. R., Mucciarelli, M., Šket-Motnikar, B., Zupanći,ć, P, Gosar, A., Prevolnik, S., et al. (2010). Empirical estimates of dynamic parameters on a large set of European buildings. Bull. Earthq. Eng. 8, 593–607. doi: 10.1007/s10518-009-9133-6
Gallipoli, M. R., Mucciarelli, M., and Vona, M. (2009). Empirical estimate of fundamental frequencies and damping for Italian buildings. Earthq. Eng. Struct. Dyn. 38, 973–988. doi: 10.1002/eqe.878
Gautam, D. (2016). Empirical correlation between uncorrected standard penetration resistance (N) and shear wave velocity (Vs) for Kathmandu Valley, Nepal. Geomat. Nat. Hazards Risk 8, 496–508. doi: 10.1080/19475705.2016.1243588
Gautam, D. (2018). Ambient vibration measurements in representative buildings in kathmandu valley following the gorkha earthquake. J. Perform. Construct. Facil. 32:04018028. doi: 10.1061/(ASCE)CF.1943-5509.0001175
Goel, R. K., and Chopra, A. K. (1997). Period formulas for moment-resisting frame buildings. J. Struct. Eng. 123, 1454–1461. doi: 10.1061/(ASCE)0733-9445(1997)123:11(1454)
Goel, R. K., and Chopra, A. K. (1998). Period formulas for concrete shear wall buildings. J. Struct. Eng. 124, 426–433. doi: 10.1061/(ASCE)0733-9445(1998)124:4(426)
Guler, K., Yuksel, E., and Kocak, A. (2008). Estimation of the fundamental vibration period of existing RC buildings in Turkey utilizing ambient vibration records. J. Earthq. Eng. 12, 140–150. doi: 10.1080/13632460802013909
Hong, L. L., and Hwang, W. L. (2000). Empirical formula for fundamental vibration periods of reinforced concrete buildings in Taiwan. Earthq. Eng. Struct. Dyn. 29, 327–337. doi: 10.1002/(SICI)1096-9845(200003)29:3<327::AID-EQE907>3.0.CO;2-0
Jaishi, B., Ren, W. X., Zong, Z. H., and Maskey, P. N. (2003). Dynamic and seismic performance of old multi-tiered temples in Nepal. Eng. Struct. 25, 1827–1839. doi: 10.1016/j.engstruct.2003.08.006
Jenkins, G. M., and Watts, D. G. (1968). Spectral Analysis and Its Application. San Francisco: Holden-Day.
Ljung, L. (1999). System Identification: Theory for the User. Upper Saddle River, NJ: PTR Prentice Hall, 1–14.
O'Reilly, G. J., Perrone, D., Fox, M., Monteiro, R., Filiatrault, A., Lanese, I., et al. (2019). System identification and seismic assessment modeling implications for Italian school buildings. J. Perform. Construct. Facil. 33:04018089. doi: 10.1061/(ASCE)CF.1943-5509.0001237
Papagiannopoulos, G. A., and Hatzigeorgiou, G. D. (2011). On the use of the half-power bandwidth method to estimate damping in building structures. Soil Dyn. Earthq. Eng. 31, 1075–1079. doi: 10.1016/j.soildyn.2011.02.007
Peeters, B., and De Roeck, G. (2001). Stochastic system identification for operational modal analysis: a review. J. Dyn. Syst. Measure. Control Trans. ASME 123, 659–667. doi: 10.1115/1.1410370
Rupakhety, R., Olafsson, S., and Halldorsson, B. (2017). The 2015 Mw 7.8 gorkha earthquake in nepal and its aftershocks: analysis of strong ground motion. Bull. Earthq. Eng. 15, 2587–2616. doi: 10.1007/s10518-017-0084-z
Rupakhety, R., and Sigbjörnsson, R. (2012). Spatial variability of strong ground motion: novel system-based technique applying parametric time series modelling. Bull. Earthq. Eng. 10, 1193–1204. doi: 10.1007/s10518-012-9352-0
Sawaki, Y., Rupakhety, R., Olafsson, S., and Gautam, D. (2019). “System identification of a residential building in Kathmandu using aftershocks of 2015 Gorkha earthquake and triggered noise data,” in Proceedings of the International Conference on Earthquake Engineering and Structural Dynamics, Geotechnical, Geological and Earthquake Engineering, eds R. Rupakhety, S. Olafsson, and B. Bessason (Cham: Springer), 47. doi: 10.1007/978-3-319-78187-7_18
Sawaki, Y., Rupakhety, R., and Ólafsson, S. (2018) “Vibration characteristics of a typical residential building in Kathmandu: operational modal analaysis finite element modelling,” in Proceedings of the 16th European Conference on Earthquake Engineering (Thessaloniki).
Söderström, T., and Stoica, P. (1989). System Identification. Cambridge: Prentice Hall International.
Takai, N., Shigefuji, M., Rajaure, S., Bijukchhen, S., Ichiyanagi, M., Dhital, M. R., et al. (2016). Strong ground motion in the Kathmandu valley during the 2015 Gorkha, Nepal, earthquake. Earth Planets Space 68, 1–8. doi: 10.1186/s40623-016-0383-7
Van Overschee, P., and De Moor, B. (1994). N4SID: subspace algorithms for the identification of combined deterministic-stochastic systems. Automatica 30, 75–93. doi: 10.1016/0005-1098(94)90230-5
Varum, H., Furtado, A., Rodrigues, H., Dias-Oliveira, J., Vila-Pouca, N., and Arêde, A. (2017). Seismic performance of the infill masonry walls and ambient vibration tests after the ghorka 2015, Nepal earthquake. Bull. Earthq. Eng. 15, 1185–1212. doi: 10.1007/s10518-016-9999-z
Vidal, F., Navarro, M., Aranda, C., and Enomoto, T. (2014). Changes in dynamic characteristics of lorca RC buildings from pre- and post-earthquake ambient vibration data. Bull. Earthq. Eng. 12, 2095–2110. doi: 10.1007/s10518-013-9489-5
Keywords: system identification, drift ratio, reinforced concerte, brick infill, ambient vibration measurement
Citation: Dhakal R, Rupakhety R and Gautam D (2020) System Identification and Seismic Performance Assessment of Representative RC Buildings in Kathmandu Valley. Front. Built Environ. 6:601116. doi: 10.3389/fbuil.2020.601116
Received: 31 August 2020; Accepted: 11 November 2020;
Published: 16 December 2020.
Edited by:
Maria Teresa De Risi, University of Naples Federico II, ItalyReviewed by:
Constantinos Repapis, University of West Attica, GreeceDaniele Perrone, University Institute of Higher Studies in Pavia, Italy
Copyright © 2020 Dhakal, Rupakhety and Gautam. This is an open-access article distributed under the terms of the Creative Commons Attribution License (CC BY). The use, distribution or reproduction in other forums is permitted, provided the original author(s) and the copyright owner(s) are credited and that the original publication in this journal is cited, in accordance with accepted academic practice. No use, distribution or reproduction is permitted which does not comply with these terms.
*Correspondence: Rajan Dhakal, cmFkNEBoaS5pcw==; Rajesh Rupakhety, cmFqZXNoQGhpLmlz; Dipendra Gautam, ZGlwLmdhdXRhbUBteS5jaXR5dS5lZHUuaGs=