 Martiwi Diah Setiawati
 Marcin Pawel Jarzebski
 Martin Gomez-Garcia
 Kensuke Fukushi1,5
- 1Institute for Future Initiatives, The University of Tokyo, Bunkyo-ku, Japan
- 2Research Center for Oceanography, Indonesian Institute of Sciences (LIPI), Ancol Timur, Indonesia
- 3Tokyo College, The University of Tokyo, Bunkyo-ku, Japan
- 4Nippon Koei R&D Center, Climate Change and Sustainable Development Team, Tsukuba, Japan
- 5United Nations University Institute for the Advanced Study of Sustainability, Shibuya-ku, Japan
Climate change causing an increase of frequency and magnitude of heat waves has a huge impact on the urban population worldwide. In Indonesia, the Southeast Asian country in the tropical climate zone, the increasing heat wave duration due to climate change will be also magnified by projected rapid urbanization. Therefore, not only climate change mitigation measures but also adaptation solutions to more frequent extreme weather events are necessary. Adaptation is essential at local levels. The projected increase of the heat wave duration will trigger greater health-related risks. It will also drive higher energy demands, particularly in urban areas, for cooling. New smart solutions for growing urbanization for reducing urban heat island phenomenon are critical, but in order to identify them, analyzing the changing magnitude and spatial distribution of urban heat is essential. We projected the current and future spatial variability of heat stress index in three cities in Indonesia, namely, Medan, Surabaya, and Denpasar, under climate change and land-cover change scenarios, and quantified it with the Universal Thermal Climate Index (UTCI) for two periods, baseline (1981–2005) and future (2018–2042). Our results demonstrated that currently the higher level of the UTCI was identified in the urban centers of all three cities, indicating the contribution of urban heat island phenomenon to the higher UTCI. Under climate change scenarios, all three cities will experience increase of the heat, whereas applying the land-cover scenario demonstrated that in only Medan and Denpasar, the UTCI is likely to experience a higher increase by 3.1°C; however, in Surabaya, the UTCI will experience 0.84°C decrease in the period 2018–2042 due to urban greening. This study advanced the UTCI methodology by demonstrating its applicability for urban heat warning systems and for monitoring of the urban green cooling effect, as well as it provides a base for adaptation measures’ planning.
Introduction
Global mean temperature has increased by 0.87°C from the preindustrial period to the present day (Jia et al., 2019), and it is expected to continue to increase, in total 2.0–4.9°C by 2,100 (Raftery et al., 2017). The temperature increase leads to more frequent and intense extreme heat events which cause adverse heat-related impacts that will also result in human fatalities and economic damages. Heat stress has been identified as one of the direct and negative impacts of climate change which can increase morbidity and mortality, and reduce work productivity worldwide (Kjellstrom et al., 2009; García-Herrera et al., 2010; Singh et al., 2015). A previous study has reported that a 0.5-°C increase of the global mean temperature results in a global 38% increase of heat-related exposure (Sun et al., 2019). Furthermore, under a 1.5-°C global warming scenario and the consequent additional heat stress, the world is expected to experience a US$2,400 billion loss and 2.2% reduction of total working hours by 2030, with agriculture and construction as the most affected sectors (Kjellstrom et al., 2019).
In terms of human health, urban areas are considered to be at higher risk due to the so-called urban heat island (UHI) effect, which means that urbanized areas tend to have a higher temperature than their rural surroundings (Loughnan et al., 2012). A recent study estimated that urbanization contributes to about 30–50% of the heat stress index increase during the summer season (Luo and Lau, 2018; Wang et al., 2019). Moreover, considering higher density of population groups that are more likely to suffer from heatstroke (i.e., elderly, impoverished people, and outdoor workers), the UHI effect makes urban areas more vulnerable during heat waves. High temperature may also have adverse effects on sleep quality and appetite (Zheng et al., 2019). At the same time, these adverse effects contribute to depression, heart disease, type II diabetes, stunting, and dementia (Rifkin et al., 2018). Thus, in order to prevent population’s health deterioration, identifying adaptation strategies that allow quality sleep is essential (Rifkin et al., 2018). Since the global urban population is projected to increase by 68% by 2050 (UN DESA, 2019), the urgency of tackling the heat-related risks in urban areas will become even a higher priority than at present.
Anticipating the effects of climate and urban demographic changes, many cities have been developing adaptation strategies toward a higher resilience (Boeckmann and Rohn, 2014). The adaptation to climate change usually includes hazard assessment, as well as infrastructure and population vulnerability components, in order to develop plans to alleviate the adverse effects of changing climate (IPCC, 2014). Common adaptation options against prolonged heat waves include electric fan utilization, active monitoring programs, and warning systems (e.g., heat stroke–related educational campaigns and information distribution campaigns through mass media). However, there are less explored measures that involve infrastructural changes such as urban greening or air conditioner installations (Boeckmann and Rohn, 2014). Some adaptation strategies against heat stress may become a part of the climate feedback loop. For example, cooling down residences or working spaces can cause an increase in household consumption of fossil fuel–generated energy, which results in higher CO2 emission into the atmosphere and consequently increasing the greenhouse effect. (Arifwidodo et al., 2019). On the other hand, urban greening and heat wave warnings are examples of the so-called low-regret strategies which are characterized by a relatively low cost and provide relatively large benefits under the predicted future climates (Boeckmann and Rohn, 2014).
The Republic of Indonesia is an example of a rapidly developing country that is at risk of seeing large numbers of heatstroke cases caused by the UHI effect since 67% of its population is expected to be living in cities by 2035 (Jones, 2010). In addition, observations show that the number of hot days and warm nights has an increasing trend between the years 1960 and 2003 (Alexander et al., 2006). In a survey conducted among Bandung residents, almost 50% of the respondents indicated that they have experienced difficulties during their commuting or at work due to hot weather (Arifwidodo et al., 2019). Those difficulties and other similar situations are likely to become more intensive according to the climate change projections for this region. The output of climate models that corresponds to the representative concentration pathway (RCP) that projects the largest increase of global mean temperature by the end of the 21st century (i.e., the RCP 8.5 scenario) shows projections in Indonesia with three heat waves in the period from 2020 to 2052, which can get as frequent as every two years during the period 2068–2,100 (Russo et al., 2014). As the result of the climate change, the number of heat-related mortality for elderly people in the Jakarta metropolitan area will increase by 12∼15-fold in the 2050s under the RCP 8.5 scenarios (Varquez et al., 2020). Climate change may also force the urban population to resettle in the country (Zander et al., 2019).
As presented above, the climatic and demographic changes are practically unavoidable, and their combined effect is likely going to pose a major stress to urban populations and growing economies. Thus, the decision-making process involved in heat-related adaptation planning requires a detailed impact assessment with consideration of the future climatic scenarios (i.e., RCPs), demographic changes, and urban spatial distribution.
In this study, we aimed to evaluate the magnitude and distribution of heat in relation to human health in three cities in Indonesia, namely, Surabaya, Medan, and Denpasar, at present and for the period 2018–2042 under climate change scenarios, and to determine the role of urban greening in the urban heat reduction.
To assess the impact of heat strain on human health, we utilized the Universal Thermal Climate Index (UTCI), which is regarded as one of the most comprehensive indices to determine the changes in human thermal perception in outdoor spaces as stated by European COST (Cooperation in Science and Technical Development) Action 730 (Blazejczyk et al., 2012). The UTCI index is exceptionally useful in evaluating the physiological response to extreme heat events due to the fact that the input data required to compute the index include not only meteorological variables but also non-meteorological variables (e.g., metabolic rate). The index is expressed in units of temperature, and its classification is divided into several stress levels, allowing its application in different climate types, seasons, and scales (Blazejczyk et al., 2012; Mcgregor, 2012; Pantavou et al., 2018). Even though the UTCI has been used in studies conducted in China (Ge et al., 2016), Poland (Milewski, 2013), Iran (Nassiri et al., 2017; Zare et al., 2018), Canada, and Republic Korea (Park et al., 2014) to evaluate temperature stresses, there is no relevant report of its application in tropical regions.
Materials and Methods
Study Area
The urban areas we selected for this study are included in the National Action Plan on Climate Change Adaptation (RAN-API) of the Republic of Indonesia, which is a national effort aimed at designing adaptation strategies to climate change. The Indonesia government selected 15 pilot project sites in the RAN-API, based on climate change projections. From these sites, we selected three cities, namely, Surabaya, Medan, and Denpasar (Figure 1). Surabaya was selected due to its increase in the percentage of green spaces during the last 2 decades, additionally to the criteria of being covered by RAN-API, to demonstrate the urban greening effectiveness as an adaptation measure. The change in green area cover in the past 2 decades is very distinctive in past images on Google Earth (Figure 2). Medan and Denpasar on the other hand followed the urban sprawl trend with increase of buildup areas at the cost of green spaces, currently observed in various parts of Southeast Asia.
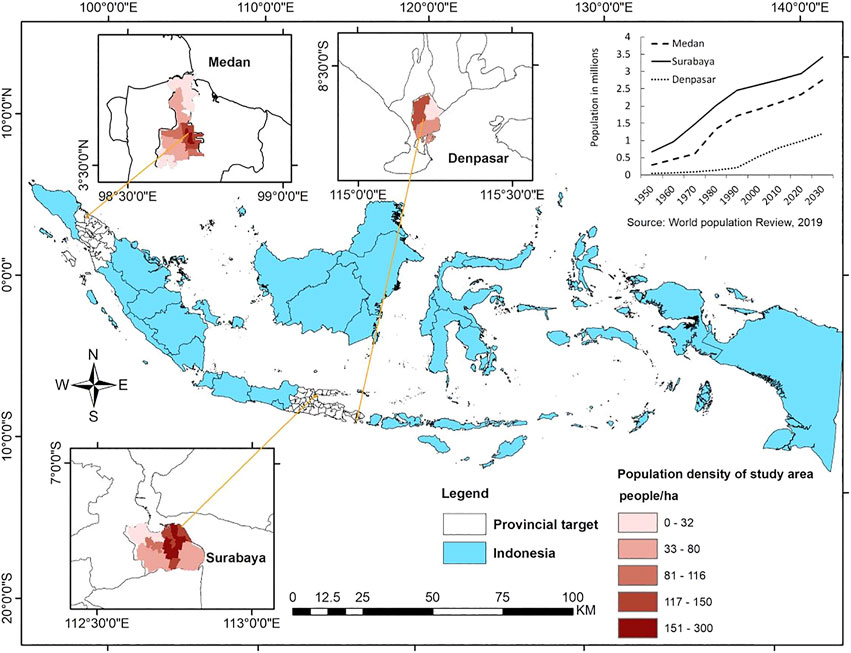
FIGURE 1. Locations of the selected study areas in the Republic of Indonesia.
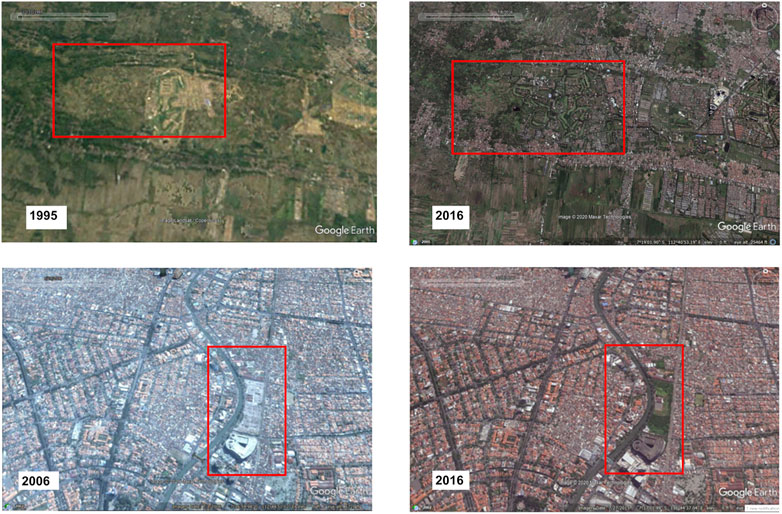
FIGURE 2. Land-cover changes in Surabaya city that can be observed in the historical imagery of Google Earth
Data Sources
Meteorological Observed and Projected Data
The daily observed meteorological records of maximum surface temperature, relative humidity, and sunlight duration of four stations in Medan, two stations in Surabaya, and two stations in Denpasar were utilized to calculate the UTCI during the 1980–2015 period for Medan and Surabaya and during the 1995–2015 period for Denpasar. These meteorological data are publicly available at the online database center of the Indonesia Meteorological Agency (BMKG) (Data online BMKG, 2015). Additionally, we have used daily wind speed data derived from ERA Interim European Centre for Medium-Range Weather Forecasts (ECMWF) dataset for UTCI calculation (ECMWF, 2016).
The current main sources of quantitative information on future climate are the so-called Earth System Models (ESMs) (Flato, 2011) which are able to model the response of the Earth system to future changes in the atmospheric concentration of greenhouse gases and thus simulating climate change. In this study, we used the ESM data of those models that participated in the Coupled Model Intercomparison Project Phase 5 (CMIP5). The CMIP5 models have a horizontal resolution ranging approximately between 100 and 400 km (Taylor et al., 2012).
The meteorological data that we used as reference for bias correction of future data are a reanalysis dataset with daily data at a spatial resolution of 0.5° and covering the entire Republic of Indonesia (Weedon et al., 2014). The data for the West Indonesia region where the city of Medan is located were extracted within (−7.5°) and (7.5°) latitudes and the (90°) and (110°) longitudes. The data for the Central Indonesia regions with Denpasar and Surabaya located within were extracted from the area delineated by (−12.5°) and (2.5°) latitudes and the (105°) and (125°) longitudes. For both regions, the list of the selected ESMs that had daily data with good yielded metrics is given (Supplementary Table S1).
Satellite Images
Landsat images covering the studied areas during hot months of the dry season (April to September) with a condition of cloud-covered surface of less than 1% were collected from the U.S. Geological Survey online database (Earth Explorer USGS, 2000). The spatial resolution of used Landsat images is 30 m (Earth Explorer USGS, 2000), and the Landsat images were utilized to calculate the land surface temperature (LST) and land cover. Since we considered using long-term satellite data, Landsat images with various sensor types such as Landsat four to five Thematic Mapper (TM), Landsat seven Enhanced Thematic Mapper (ETM), Landsat eight Operational Land Imager (OLI), and Thermal Infrared Sensor (TIRS) were collected. The characteristic of Landsat data used in this study is presented in Table 1.
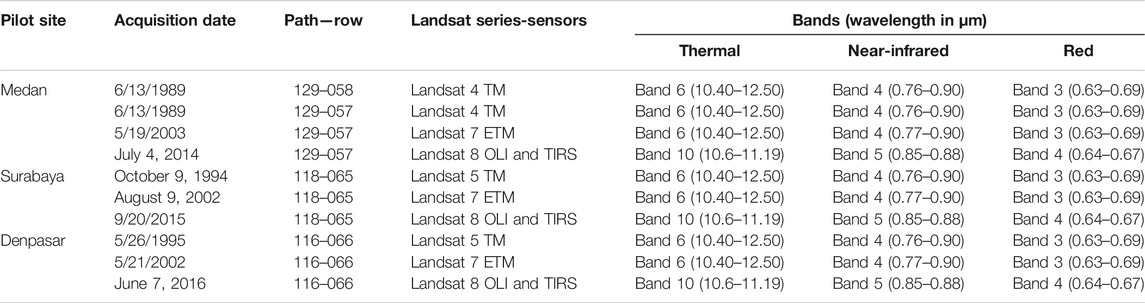
TABLE 1. List of Landsat data over the study period.
Method
UTCI Calculation
The UTCI is a function of the time-dependent variables t (in °C), RH (in percentage), Tmrt (in °C), and v (in m/s), as shown in Eq. 1 (Bröde et al., 2012; Bröde et al., 2013; COST Action 730, 2012). The calculation of UTCI also assumes that walking speed, average body weight, and metabolic rate are constant, equal to 4 km/h, 74 kg, and 135 W/m2, respectively.
We used BioKlima package 2.6 to calculate the UTCI with the input daily meteorological data as follows: t (in °C), RH (in percentage), global solar radiation (Kglob) (W/m2), vapor pressure 5) (hPa), Sun altitude (hSI) (in degree), and v (in m/s) (Błażejczyk, 2011). Due to lack of solar radiation and vapor pressure availability in the BMKG database, we approximated them with an empirical expression that depends on other meteorological variables (Garg and Garg, 1983; Wagner and Prub, 2002). The Excel sheet calculator for solar radiation and vapor pressure can be found in supplementary materials (Supplementary Table S2). The units of UTCI are expressed in °C. It is divided into five ranges: no thermal stress (9°C–26°C), moderate heat stress (26°C–32°C), strong heat stress (32°C–38°C), very strong heat stress (38°C–46°C), and extreme heat stress (higher than 46°C) (Bröde et al., 2012; Bröde et al., 2013; COST Action 730, 2012).
Using the computed daily values of UTCI and the meteorological variable observations of the three cities, we approximated an empirical relationship (Eq. 1) as follows:
The approximated function was determined by multiple linear regressions of 42, 368 paired values, and the resulting correlation coefficient and root mean square error were equal to 0.99 and 0.7°C, respectively. However, since we did not have enough meteorological stations to conduct interpolation for the UTCI spatial distribution, we used the LST approach derived from data of satellite-borne sensors. This approach is frequently used to show the UHI effect (Tomlinson et al., 2011). For this study, we collected all available cloud-free Landsat imagery over the target areas, as shown in Table 1. The LST for the baseline 1981–2005 period for hot months of dry season was derived by utilizing the thermal, the near-infrared (NIR), and the red bands with three different sensor types (i.e., TM, ETM, and OLI TIRS) according to the methodology given by Artis and Carnahan (1982). This LST calculation procedure has been performed in the previous research by Setiawati et al. (2021). There are two main inputs necessary for the calculation of the LST, namely, brightness temperature and land surface emissivity (LSE). We used the equation prescribed by USGS (Sobrino et al., 2008; USGS, 2019) to calculate the brightness temperature and LSE. Moreover, we employed Sobrino and Bonafoni’s model as the best performing in estimating LST for Landsat 5, 7, and 8 (Sekertekin and Bonafoni, 2020).
The aforementioned equation was also simplified into Eq. 3 where the correlation coefficient and root mean square error were equal to 0.94 and 1.2°C, respectively (Figure 3), due to only one spatial parameter (i.e., LST) being available for UTCI spatial distribution. This step was undertaken in order to increase the reliability of UTCI and t in the heterogeneous city.
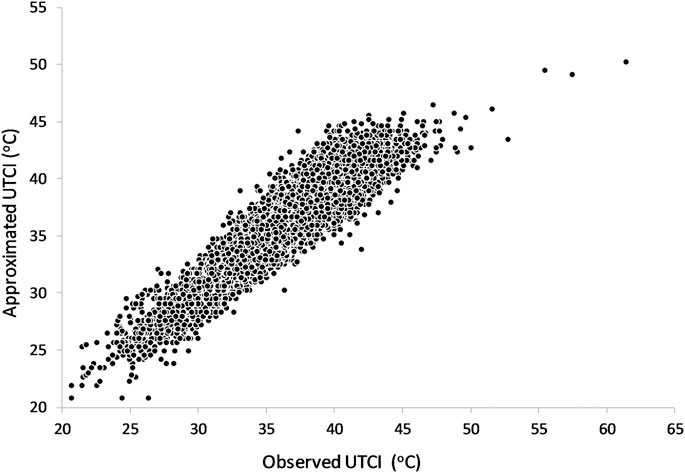
FIGURE 3. Scatterplot of observed UTCI and approximated UTCI.
In Figure 4, we present the overall flowchart of UTCI computation used in this study. We compared the projected changes of UTCI under land-cover change (LC) and climate change (CC) scenarios. The spatial distribution of the UTCI was conducted in two steps. The first one was conversion of current LST for period 1981–2005 (LSTBaseline) into t for the same period (tBaseline) by employing the empirical relationship between air temperature and LST, based on (Gallo et al., 2011). The second step was calculation of the spatially distributed UTCI according to Eq. 3, where t was replaced by tBaseline.
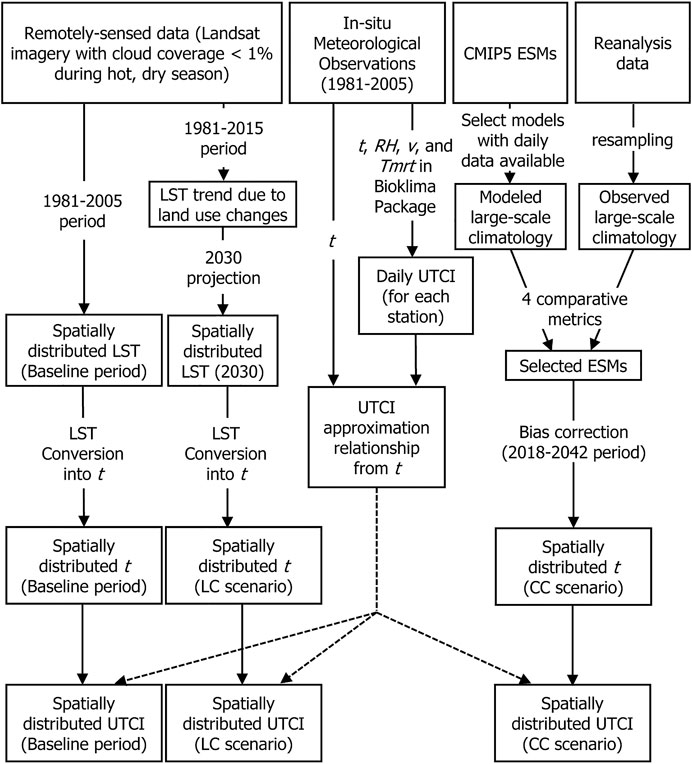
FIGURE 4. Computation of the UTCI for the baseline period, the LC scenario, and the CC scenario.
UTCI Under the LC Scenario
To classify the LC changes, we have used the threshold method of Normalized Difference Vegetation Index (NDVI) of Landsat image given in the study by Ramachandra et al. (2013). We performed two types of LC classes (i.e., built-up bare land area and others). Additionally, in Surabaya city, we classified the LC into vegetation and non-vegetation to identify the cooling effect of urban greening. For the LC future projection, multi-criteria evaluation was used as follows:
where Slopeurban, Elevationurban, and Distance from roadurban are defined as suitable components for developing the urban area with defined categories (Şatir, 2016). All the data input is binary, where urban and bare land area LC was classified as 1, and other LC was classified as 0. Furthermore, the suitable slope, elevation, and distance from road area were categorized as 1, while non-suitable areas were categorized as 0. The output map was reclassified into binary classes: class 1—built-up and bare land area (values ≥1) and class 0—values < 1.
Future LST trends for LC scenarios were determined based on the changes in LC during the period 1981–2015 and assumption that these LC changes would remain the same till 2030 (to the 2018–2042 period). The spatially distributed UTCI for LC scenario was determined by converting the corresponding projections of LST into t and applying it to Eq. 3. The consideration of LC scenarios was necessary as the UHI effect is one of the major drivers of heat stress in urban areas.
UTCI Under the CC Scenario
The use of ESM-generated information requires bias correction due to the large number of models causing a wide range of projections, but also the model output may be biased. Thus, model performance evaluation and bias correction are essential in climate change impact studies. To conduct the model performance evaluation and bias correction, we compared the ESM outputs with reference data (i.e., observations) during the baseline period (1981–2005) (Weedon et al., 2014). To this end, we employed four comparative metrics. We evaluated the climatological annual cycles by using a temporal root mean square error and a temporal correlation and evaluated the large-scale patterns by using a spatial root mean square error and a spatial correlation. The bias correction was performed for projected daily values of t of the selected models (for the four RCP scenarios) during the hot months of dry seasons for the 2018–2042 period. In order to preserve the ESM-projected climate trends, the trend-preserving parametric bias-correction method that corrects separately the climatological mean and the daily anomalies of the atmospheric variables was applied (Hempel et al., 2013).
The mean and the 90th percentile of t for the 2018–2042 period from the bias-corrected model was used to determine the UTCI change under CC scenario and the extreme climate scenario. After adding the CC projected change of t to tBaseline, the UTCI was calculated according to Eq. 3, by using the project t.
Result
Spatially Distributed UTCI During the Baseline Period and the LC Scenario
During the baseline period, areas mainly located in the downtown of Medan and Surabaya demonstrated a very strong thermal stress (Figures 5A,E), while the most critical areas of Denpasar barely reached a strong thermal stress level (Figure 5C).
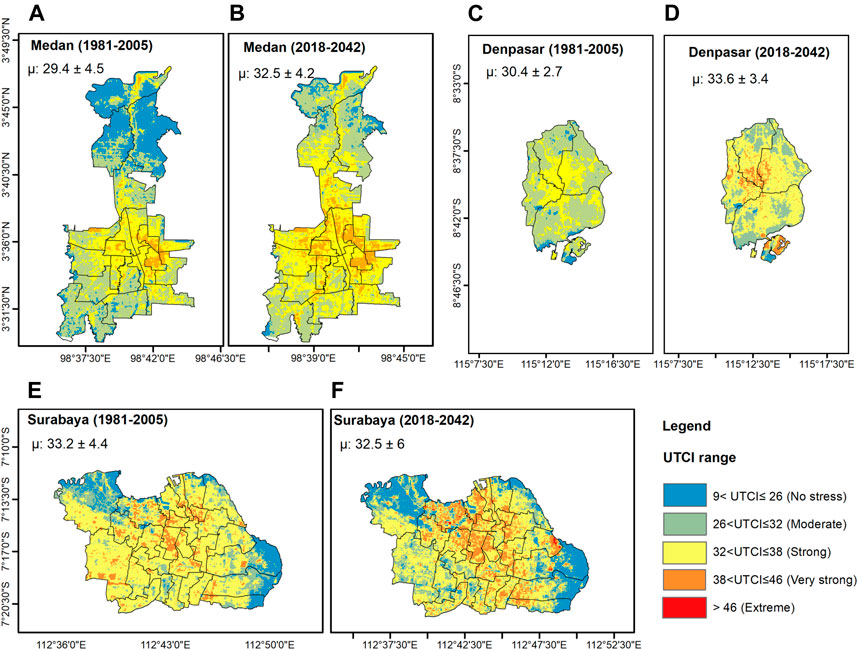
FIGURE 5. UTCI spatial distribution in Medan, Denpasar, and Surabaya, LC scenario. The (A, C, E) refer to the baseline period of Medan, Denpasar, and Surabaya, while (B, D, F) are the future period of Medan, Denpasar, and Surabaya under the LC scenario.
In this analysis, we also estimate the future projection of UTCI under the LC scenario to quantify the extensivity of the contribution of UHI to the heat hazard change. As shown in Figure 5B,D,F, three cities emerged as having very strong thermal stress, with a far wider area in the target year 2030. In general, the heat stress index will increase one level higher in the future. Medan and Denpasar show increasing trends, where UTCI will increase in average for about 3.1°C (Figures 5B,D). However, Surabaya shows a decreasing average heat stress index for about 0.84°C (Figures 5F, Supplementary Figure S2). Particularly, in the southwestern of Surabaya, the heat stress index will be reduced from very strong thermal stress to moderate or no thermal stress range. On the other hand, the very strong thermal stress area of the urban center of Surabaya will keep expanding in the future. For more details, UTCI spatial change in Surabaya is shown in the supplementary materials (Supplementary Figure S2).
Figures 6A–C present recent changes in land cover in the three selected cities in terms of build-up area that includes buildings and pavements. As seen in Figures 6A–C, Medan and Denpasar have the same pattern of land cover change where build-up areas were consistently growing annually, with the fastest urban development occurring from the year of 2002/2003 to 2014, whereas Surabaya has urban planning enforced; if no green policy is applied in Medan and Denpasar, the build-up area will cover about 80.21 and 89%, respectively, by 2030. Detailed spatial land cover changes for the three cities are presented in the supplementary materials (Supplementary Figure S1).
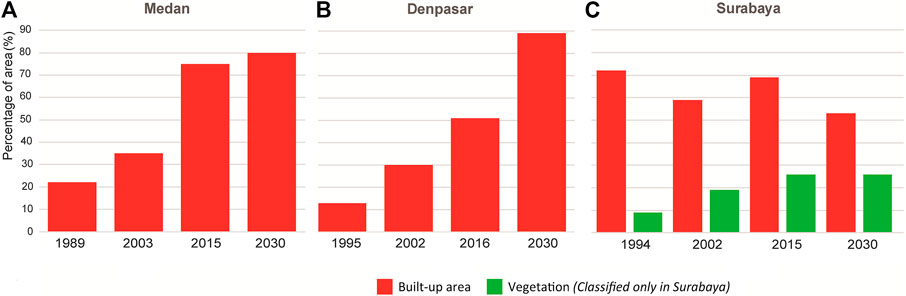
FIGURE 6. Land cover change in (A) Medan, (B) Denpasar, and (C) Surabaya.
In Figure 7, we presented results of vegetation cover change in Surabaya. The figure shows that there was an increasing trend of vegetation cover, especially in its southwestern area. These changes were mainly attributed to the conversion from open land into various vegetation types such as park or agricultural field (Figure 2).
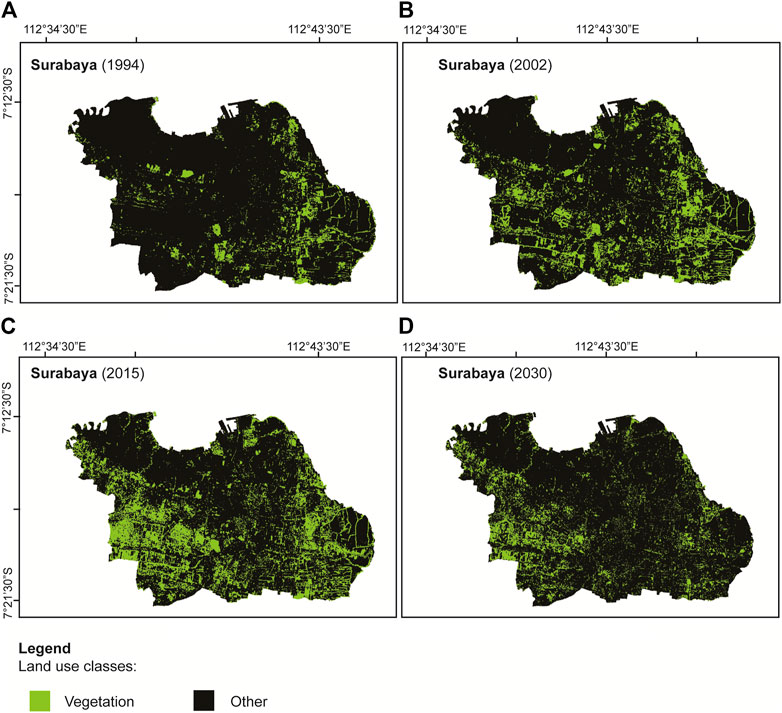
FIGURE 7. Vegetation coverage change in Surabaya, (A) (1994), (B) (2002), (C) (2015), and (D) (2030).
Future Projection of UTCI With CC Scenario
Under the CC scenario, the projection of UTCI for the three cities is presented in Figure 8. Among three cities, the highest average increase of UTCI will occur in Medan (+1.9°C), followed by Denpasar (+1.4°C) and Surabaya (+1.4°C). Three cities indicated the very strong thermal stress in the period 2018–2042. The strong and very strong heat stress in the future will mainly cover central areas of these cities.
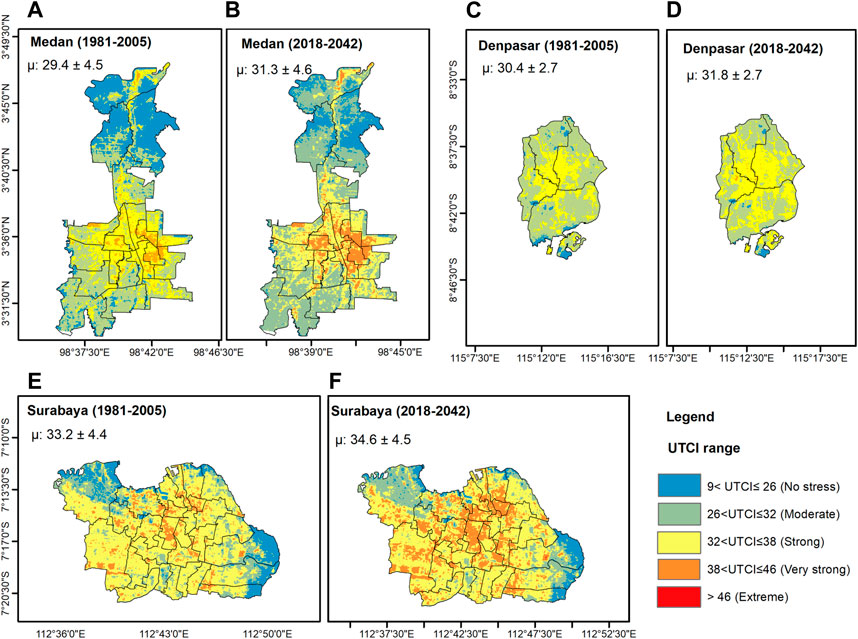
FIGURE 8. UTCI spatial distribution in Medan, Denpasar, and Surabaya, ensemble mean CC scenario. The (A, C, E) refer to the baseline period of Medan, Denpasar, and Surabaya, while (B, D, F) are the future period of Medan, Denpasar, and Surabaya under the ensemble mean CC scenario.
Figure 9 presents the projection of UTCI under the extreme climate scenario which was defined with the use of the 90th percentile of maximum temperature of all climate change scenarios (Luo and Lau 2018; Wang et al., 2019; Sulikowska and Wypych, 2020). The result stated that Medan will experience the highest average increase of UTCI (+5.9°C), followed by Denpasar (+5.6°C) and Surabaya (+4.8°C). In this scenario, Medan and Surabaya are indicated to have extreme thermal stress levels where the coverage area is less than 1%. Moreover, the very strong heat stress in the future will expand wider than that under the LC scenario. In particular, in Surabaya, the very strong thermal stress will be dominant under the extreme climate scenario.
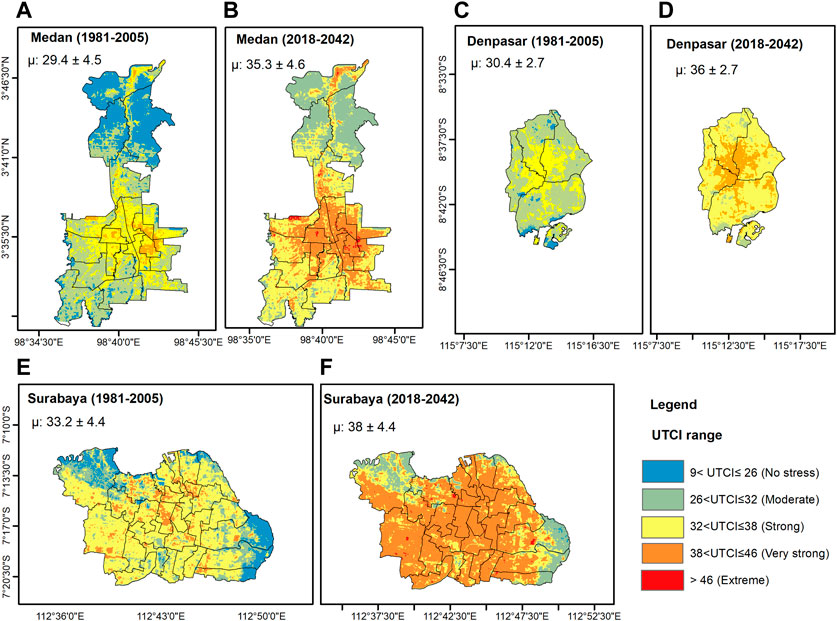
FIGURE 9. UTCI spatial distribution in Denpasar, Medan, and Surabaya cities, extreme CC scenario. The (A, C, E) refer to the baseline period of Medan, Denpasar, and Surabaya, while (B, D, F) are the future period of Medan, Denpasar, and Surabaya under extreme CC scenario.
Figure 10 presents the percentage of areas with the very strong heat stress, at baseline and under future LC, ensemble mean CC, and the extreme climate scenario, indicating different trends of heat stress change. The area with a very strong heat stress in Denpasar was not observed in the baseline period and only at 0.5% under the ensemble mean CC scenario. However, under LC and the extreme climate scenario, a very strong heat stress in Denpasar covers 8.4 and 24.3% of the area, respectively. Among three cities, Surabaya has the largest ratio of area with the very strong heat stress followed by Medan and Denpasar. However, under LC scenario, Denpasar has the highest increase in terms of the coverage area of the very strong heat stress. Meanwhile, under ensemble mean CC and the extreme climate scenario, Surabaya has the largest increase of the very strong heat stress area.
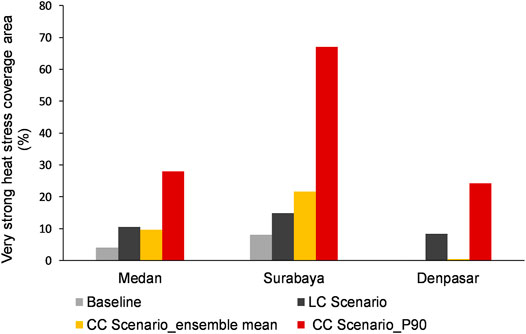
FIGURE 10. Very strong heat stress area (UTCI>38), CC scenario.
Discussion
The main purpose of the study was to investigate the spatial distribution of heat hazard through the applied UTCI index in selected cities, under projections of land-cover change and various climate change scenarios. In the current study, the spatial pattern of heat hazard varied depending on the location, indicating highest degree within central districts and lower degree in the suburbs. Higher degrees of heat hazard in the central districts clearly indicated that the UHI phenomenon was taking place. These results are the indication of UHI effect, where higher levels of heat hazard were found in the main urban center. The large contributors to the heat radiation are built-up and paved areas (Lamarino et al., 2011), and these types of area categories were found in this study to have a higher ratio among land use types (Supplementary Figure S1).
Four levels of the heat hazard have been identified in the three cities, namely, no thermal stress, moderate thermal stress, strong thermal stress, and very strong thermal stress (Figure 5). Very strong thermal stress was recorded as the highest level of UTCI in Medan and Surabaya and strong thermal stress in Denpasar during the baseline period (Figures 5A,C,E). However, mean values indicated that Surabaya has the highest spatial average of UTCI (33.2 ± 4.4°C), followed by Denpasar (30.5 ± 2.7°C) and Medan (29.4 ± 4.5°C). UTCI values classified as very strong and strong heat stress ranges can be observed mainly in the downtown areas, revealing the UHI effect (Lamarino et al., 2011). The result was consistent with build-up and bare soil land cover patterns. These areas have higher UTCI degrees than other land cover types, especially the vegetation land cover.
Future trends in the three cities are connected with the land cover change, demonstrating linkages between rapid land conversion into built-up areas (Figure 6) and the increase of UTCI degree (Figures 5B,D,F). A strong increase of heat hazard in the near future is predicted to occur, driven by urban development especially in the cities of Medan and Denpasar (Figures 5B,D). This can be attributed to the urban surface having lower albedo, higher surface roughness, and lower surface wind speed, which cause an increase in heating effect in the area. Also, anthropogenic heat released by the building contributes to the increasing heating effect. In contrast, Surabaya presented very different spatial patterns of heat hazard, and it has a decreasing trend of UTCI in the near future under LC scenario (Figure 5F). The change of heat hazard from no thermal stress into moderate and strong thermal stress was observed (Figure 5). In the future projection, we determined that the area with the strong heat stress will expand in both cities, especially in Denpasar, where the very strong thermal stress range was observed under the LC scenario. On the other hand, the bare land and built-up areas in Surabaya decreased significantly in southwestern part of the city and partially in the central part, reducing the average UTCI degree for 0.84°C in the future (Supplementary Figure S1). The bare land in Surabaya was converted into green park in the southwestern and central part of the city, from 1995 to 2016 (Figures 2, 7). The increasing vegetation coverage was a factor in decreasing the urban heat stress. In future, it is projected that Surabaya will reach 26.3% of vegetation coverage, which will contribute to reducing the heat hazard level in the city (Figure 6C, 7). These findings are consistent with analysis conducted in previous studies, stating that vegetation is able to lower the air temperature by 0.47°C and lower the thermal environment for 10°C (Wu et al., 2016). The positive mechanisms of vegetation coverage are primarily attributed to its shading effects, reduced absorbed radiation quantity by the surface, and slowering the intensity of the evapotranspiration process. These mechanisms are effectively cooling the air temperature (Mcgregor, 2012). In terms of shading, trees with dense canopy are able to enhance the outdoor thermal comfort and to reduce areas of very strong heat stress (Wu et al., 2016). Open green spaces covered by grass do not provide the same role as trees with dense canopy, but they have the ability to lower the near surface temperature than bare land/build-up areas (Wu et al., 2016), and they can be used as a recreational place during evening time with lower temperature and Sun radiation.
Adding climate scenarios for future projection significantly increases the heat hazard status in all three cities (Figures 8, 9). The result stated that three selected cities will enlarge the area of the strong and very strong heat stress status under climate change scenario. The area of very strong thermal stress will cover 0.5, 10, and 22% of Denpasar, Medan, and Surabaya, respectively, under the ensemble mean CC scenario (Figure 10), whereas under the extreme climate scenario, the coverage of the very strong heat stress will be 24.3, 28, and 67% of Denpasar, Medan, and Surabaya cities, respectively. Higher thermal stress (i.e., the strong and very strong heat stress) will be observed in central parts of these cities (Figures 8A–D, 9A–D). Consistently, our results showed that the coverage area of no thermal stress status decreased significantly in three cities in 2030. Under the CC scenario, the area of very strong heat stress expansion in Denpasar can be explained by the rapidly growing tourism industry of Bali Island where the city is located. On the other hand, in order to attract and protect tourists, there is a need for urban heat reduction in the future. Opposite to Denpasar which is a smaller city but with growing heat hazard, Surabaya is a larger city but having the opposite trend of heat hazard under the LC scenario (Figures 5E,F, 8E,F, 9E,F, 10).
This study also addressed a number of methodological challenges and advanced heat evaluation. The selected CMIP5 model itself does not count the LC change in their future projection; thus, this study included it as one of important variables. However, conducting the future LC scenarios for each specific city requires clear images of time series satellite data and raw master plan geographical data. Thus, conducting future projection of urban thermal stress for both the LC and the CC scenarios allows producing science-based guidelines on adaptation strategies, setting clear targets on urban greening in regional master plans. Identifying UTCI stress categories can also help to define appropriate preventive measures against the heat stroke (Table 2). We recommend setting such measures according to current and projected UTCI-based heat stress levels, for adaptation strategies.
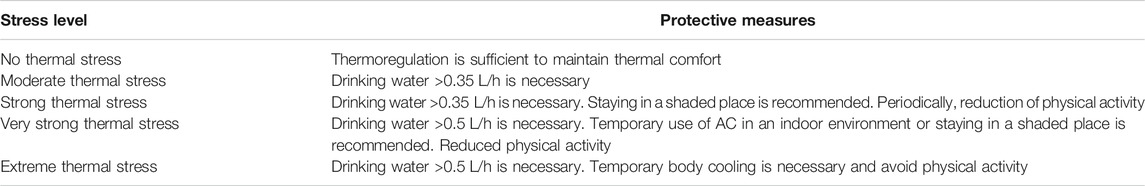
TABLE 2. UTCI stress category and its protective measure (Wu et al., 2016).
Urban greening is one of the low-regret actions that provide relatively large benefits with lower cost, under predicted future climate conditions. It can also provide other regulating, provision, and cultural ecosystem services, such as air purification, flood control, recreational space, CO2 sequestration, or food production (Farugia et al., 2013; Sioen et al., 2017; Helen and Gasparatos, 2020). Thus, considering urban greening should be a part of any development plans. In Indonesia, national regulation of urban greening follows the Law No. 26 of 2007 which states that at least 30% of urban area shall be allocated for open green spaces. This law also applies to provincial/district spatial planning (known as RTRW). The open green spaces include conservation areas, city forests, parks and green belts, reservoir areas, and commentaries(Surabaya Municipal Government, 2016).
In RTRW 2014–2034 master plan of Surabaya city, the municipal government has set a quantitative target for open green spaces, stating that the open green spaces must cover about one-third of the total urban area, of which 20% must be public space and 10% a private space. This policy was aligned with national regulation, the Law No. 26 of 2007, and efficiently implemented and enforced with the ratio of public open green space of 20.75% in 2015 (Surabaya Municipal Government, 2016). However, to achieve the national target, the private sector engagement is necessary. Surabaya municipal government has started a program called “Green Building Initiative” that provides tax reduction incentives for building meeting criteria for green building (Surabaya Municipal Government, 2016). Despite the current development planning, Surabaya municipal government did not include the “climate change adaptation,” per se however addressed the urban heat stress through urban greening, which can be defined as one of adaptation strategies at the local level.
In the case of Denpasar, the current ratio of open green space (including agricultural land) in Denpasar was estimated to be 36% (Denpasar Government, 2016). Bali provincial government has committed that additional 5% of urban area will be allocated for open green space on the Bali Island (including the city of Denpasar) (BAPPEDA Bali, 2019). This decision was made to control tourism-related urban sprawl and to reduce urban heat through various stakeholders. In this study, we demonstrated that adding regulatory measures to increase green spaces in Denpasar is necessary, as the heat stress is estimated to be very strong under the future projection.
Among the three studied cities, Medan has the lowest ratio of urban green spaces (10% as of 2015) (according to Medan Spatial Planning Agency, 2015), and this is lagging behind the national target set by the Law No. 26 of 2007. Furthermore, almost 90% of residential roof tops are made of aluminum and cement sheets that drastically decrease the urban albedo (BPS Medan, 2018). A local Act No. 522.4/1,553. X/IX 2013 that requires greening enacted in Medan was enacted, but it has not been translated into clear technical guidelines, resulting with no proper implementation.
Urban climate adaptation measures have not yet been embedded into both national and regional policies and planning documents including Jakarta as a benchmark of mega cities in Indonesia. Thus, urban climate adaptation is experiencing a difficult path to find its operationalization and implementation, leaving it as a responsibility of provincial governments or city authorities. Therefore, we expect this assessment to be beneficial in the context of local-level risk management for urban heat hazard. This is a necessary step to support local adaptation planning to heat-related stress and reducing impact on human health.
Conclusion
The UTCI-based urban heat stress assessment performed in this study under climate change and land-cover change scenarios in three cities, namely, Medan, Surabaya, and Denpasar, included in the National Adaptation Plan of Indonesian government demonstrated that under future projections, Medan is the most vulnerable city in terms of increasing the UTCI level, followed by Denpasar and Surabaya. These results demonstrated that the highest level of UTCI identified in the three cities was classified as very strong thermal stress due to the contribution of climate change and urban development. However, this can vary, depending on the city, climate, and land use planning. Under the land-cover scenario, we found that urban greening in Surabaya city was a factor reducing the area of high heat stress level. Visualizing the spatial distribution of UTCI as one of human-centric assessments of outdoor thermal comfort can facilitate planning the adaptive measures deployment, especially to areas of strong and very strong thermal risk. Urban greening, green building incentives, rising awareness of the heat-related risk, and health protective measures are among the most important adaptation measures that can be more efficiently implemented after UTCI analysis. These approaches also give the opportunity to study about the linkage among climate condition, urban structures, and human physiological response. Thus, delivering to policy-makers and to regional and local governments, the science-based evidence on the actual and projected heat risk can support national, regional, and local planning necessary adaptation strategies. It can protect human health and reduce economic damages under climate change. However, our assessment also had limitations on the sample number of collected satellite images in three pilot sites, and this could have been a source of uncertainties in the results. Thus, considering a slightly higher cloud covering percentage threshold of Landsat satellite images or using the daily Level 3 LST product from the moderate resolution imaging spectroradiometer (MODIS) could be an option to increase the sample number of satellite images. Moreover, other spatial data distributions are needed for other potentially relevant indicators of the UTCI as the hazard index.
Data Availability Statement
The datasets presented in this study can be found in online repositories. The names of the repository/repositories and accession number(s) can be found below: Meteorological Data in Indonesia (http://dataonline.bmkg.go.id/home), modeled daily wind speed data (https://apps.ecmwf.int/datasets/data/interim-full-daily/levtype=sfc/?fbclid=IwAR0gRRJb6HuoheqOzmREpMAjeoKk9l5K3yurvSYX-gU6KAb2JyL1SbeD), and Landsat satellite data (https://earthexplorer.usgs.gov/).
Author Contributions
MS, MJ, MG-G, and KF conceptualized the article. MS conducted data collection, data analysis, and wrote the draft manuscript. MS, MJ, and MG-G contributed equally to the review and editing. All authors contributed to the article and approved the submitted version.
Funding
This study was supported by JSPS KAKENHI with the grant number 19H01144 and JSPS Core-to-Core Program B under Asia–Africa Science Platforms “Center of Excellence in Health Risk Assessment for Adaptation to Climate Change.”
Conflict of Interest
MG-G was employed by the company Nippon Koei R&D Center.
The remaining authors declare that the research was conducted in the absence of any commercial or financial relationships that could be construed as a potential conflict of interest.
Acknowledgments
We would like to thank dataonline BMKG (Indonesia Meteorological Agency), ECMWF, and USGS for providing climate in situ data, modeled daily wind speed data, and satellite LANDSAT data. The climate model output was processed with the help of Dr Kiyoshi Takahashi of the National Institute for Environmental Studies and Daikichi Ogawada and Akiko Matsumura of Nippon Koei Co., Ltd. Finally, we would like to thank the Program for Climate Model Diagnosis and Intercomparison and the climate modeling groups responsible for producing and making the CMIP5 models available. Also, this study was conducted in collaboration with the Indonesian Ministry of National Development Planning (BAPPENAS; Badan Perencanaan Pembangunan Nasional).
Supplementary Material
The Supplementary Material for this article can be found online at: https://www.frontiersin.org/articles/10.3389/fbuil.2021.622382/full#supplementary-material.
References
Alexander, L. V., Zhang, X., Peterson, T. C., Caesar, J., Gleason, B., Klein Tank, A. M. G., et al. (2006). Global Observed Changes in Daily Climate Extremes of Temperature and Precipitation. J. Geophys. Res. 111, D05109. doi:10.1029/2005jd006290
Arifwidodo, S. D., Chandrasiri, O., Abdulharis, R., and Kubota, T. (2019). Exploring the Effects of Urban Heat Island: A Case Study of Two Cities in Thailand and Indonesia. APN Sci. Bull. 9 (1). doi:10.30852/sb.2019.539
Artis, D. A., and Carnahan, W. H. (1982). Survey of Emissivity Variability in Thermography of Urban Areas. Remote Sensing Environ. 12, 313–329. doi:10.1016/0034-4257(82)90043-8
BAPPEDA Bali (2019). Midterm Development Planning of Bali Province 2018-2023. Denpasar, Indonesian: BAPPEDA Bali.
Błażejczyk, K. (2011). Bio Klima. Ver. 2.6 software. Available at: https://www.igipz.pan.pl/Bioklima-zgik.html (Accessed May 30, 2016).
Blazejczyk, K., Epstein, Y., Jendritzky, G., Staiger, H., and Tinz, B. (2012). Comparison of UTCI to Selected Thermal Indices. Int. J. Biometeorol. 56 (3), 515–535. doi:10.1007/s00484-011-0453-2
Boeckmann, M., and Rohn, I. (2014). Is Planned Adaptation to Heat Reducing Heat-Related Mortality and Illness? A Systematic Review. BMC Public Health 14, 1112. doi:10.1186/1471-2458-14-1112
Bröde, P., Błazejczyk, K., Fiala, D., Havenith, G., Holmér, I., Jendritzky, G., et al. (2013). The Universal Thermal Climate Index UTCI Compared to Ergonomics Standards for Assessing the Thermal Environment. Ind. Health 51, 16–24. doi:10.2486/indhealth.2012-0098
Bröde, P., Fiala, D., Błażejczyk, K., Holmér, I., Jendritzky, G., Kampmann, B., et al. (2012). Deriving the Operational Procedure for the Universal Thermal Climate Index (UTCI). Int. J. Biometeorol. 56 (3), 481–494. doi:10.1007/s00484-011-0454-1
BPS Medan (2018). Medan in Figure 2017. Indonesian: Medan Statistical AgencyAvailable at: https://medankota.bps.go.id/publication.html (Accessed December 2, 2019).
IPCC (2014). “Climate Change 2014: Impacts, Adaptation, and Vulnerability” in Part A: Global and Sectoral Aspects Contribution of Working Group II to the Fifth Assessment Report of the Intergovernmental Panel on Climate Change. Editors C. B. Field, V. R. Barros, D. J. Dokken, K. J. Mach, M. D. Mastrandrea, and T. E. Bilir (Cambridge and New York: Cambridge University Press), 1132.
COST Action 730 (2012). UTCI Universal Thermal Climate Index Documents. [Online] Available at: http://www.utci.org/utci_doku.php (Accessed April 12, 2021).
Data Online BMKG (2015). Indonesia Daily Meteorological Data. Available at: http://dataonline.bmkg.go.id/home (Accessed May 30, 2016).
Denpasar Government (2016). Midterm Development Plan of Denpasar City 2016-2021. Indonesian: Denpasar City Regional Development Planning AgencyAvailable at: http://perpustakaan.bappenas.go.id/lontar/file?file=digital/166813-[_Konten_]-Konten%20D1838.pdf (Accessed July 18, 2017).
Earth Explorer USGS (2000). Data Download. Reston, VA, United States: U.S. Geological SurveyAvailable at: https://earthexplorer.usgs.gov/ (Accessed December 20, 2016).
ECMWF (2011). ERA Interim Daily. Available at: https://apps.ecmwf.int/datasets/data/interim-full-daily/levtype=sfc/?fbclid=IwAR0gRRJb6HuoheqOzmREpMAjeoKk9l5K3yurvSYX-gU6KAb2JyL1SbeD (Accessed May 30, 2016).
Farugia, S., Hudson, M. D., and McCulloch, L. (2013). An Evaluation of Flood Control and Urban Cooling Ecosystem Services Delivered by Urban Green Infrastructure. Int. J. Biodivers. Sci. Ecosyst. Serv. Manag. 9 (2), 136–145. doi:10.1080/21513732.2013.782342
Flato, G. M. (2011). Earth System Models: an Overview. Wires Clim. Change 2, 783–800. doi:10.1002/wcc.148
Gallo, K., Hale, R., Tarpley, D., and Yu, Y. (2011). Evaluation of the Relationship between Air and Land Surface Temperature under Clear- and Cloudy-Sky Conditions. J. Appl. Meteorol. Clim. 50 (3), 767–775. doi:10.1175/2010jamc2460.1
García-Herrera, R., Díaz, J., Trigo, R. M., Luterbacher, J., and Fischer, E. M. (2010). A Review of the European Summer Heat Wave of 2003. Crit. Rev. Environ. Sci. Technol. 40, 267–306. doi:10.1080/10643380802238137
Garg, H. P., and Garg, S. N. (1983). Prediction of Global Solar Radiation from Bright Sunshine Hours and Other Meteorological Data. Energ. Convers. Manage. 23 (2), 113–118. doi:10.1016/0196-8904(83)90070-5
Ge, Q., Kong, Q., Xi, J., and Zheng, J. (2016). Application of UTCI in China from Tourism Perspective. Theor. Appl. Climatol. 128, 551–561. doi:10.1007/s00704-016-1731-z
Helen, , and Gasparatos, A. (2020). Ecosystem Services Provision from Urban Farms in a Secondary City of Myanmar, Pyin Oo Lwin. Agriculture 10 (5), 140. doi:10.3390/agriculture10050140
Hempel, S., Frieler, K., Warszawski, L., Schewe, J., and Piontek, F. (2013). A Trend-Preserving Bias Correction - the ISI-MIP Approach. Earth Syst. Dynam. 4 (1), 49. doi:10.5194/esdd-4-49-2013
Jia, G., Shevliakova, E., Artaxo, P., De Noblet-Ducoudré, N., Houghton, R., House, J., et al. (2019). “Land-climate Interaction” in Climate Change and Land: An IPCC Special Report on Climate Change, Desertification, Land Degradation, Sustainable Land Management, Food Security, and Greenhouse Gas Fluxes in Terrestrial Ecosystems. Editors P. R. Shukla, J. Skea, and E. Calvo Buendia (Geneva: In press), 131–247.
Jones, G. W. (2010). The 2010 – 2035 Indonesian Population Projection: Understanding the Causes, Consequences and Policy Options for Population and Development. Available at: https://indonesia.unfpa.org/sites/default/files/pub-pdf/Policy_brief_on_The_2010_%E2%80%93_2035_Indonesian_Population_Projection.pdf (Accessed October 29, 2020).
Kjellstrom, T., Holmer, I., and Lemke, B. (2009). Workplace Heat Stress, Health and Productivity - an Increasing Challenge for Low and Middle-Income Countries during Climate Change. Glob. Health Action. 2, 2047. doi:10.3402/gha.v2i0.2047
Kjellstrom, T., Maître, N., Saget, C., Otto, M., and Karimova, T. (2019). Working on a Warmer Planet: The Impact of Heat Stress and Labor Productivity in Decent Work. Geneva: International Labour Office.
Lamarino, M., Beevers, S., and Grimmond, C. S. B. (2011). High‐resolution (Space, Time) Anthropogenic Heat Emissions: London 1970–2025. Int. J. Climatol 32 (11), 1754–1767. 10.1002/joc.2390.
Loughnan, M., Nicholls, N., and Tapper, N. (2012). Mapping Heat Health Risks in Urban Areas. Int. J. Popul. Res. 2012, 518687. 10.1155/2012/518687.
Luo, M., and Lau, N.-C. (2018). Increasing Heat Stress in Urban Areas of Eastern China: Acceleration by Urbanization. Geophys. Res. Lett. 45, 13060–13069. doi:10.1029/2018gl080306
McGregor, G. R. (2012). Special Issue: Universal Thermal Comfort Index (UTCI). Int. J. Biometeorol. 56 (3), 419. doi:10.1007/s00484-012-0546-6
Medan Spatial Planning Agency (2015). Detail Spatial Planning in Medan City 2015-2035. Indonesian: Medan City GovernmentAvailable at: https://dpmptsp.pemkomedan.go.id/userfiles/dpmptspmedan/dpmptspwebaplikasi/files/JDIH/RDTR-DAN-PERATURAN-ZONASI-KOTA-MEDAN-TAHUN-2015-2035.pdf (Accessed July 7, 2017).
Milewski, P. (2013). Application of the UTCI to the Local Bioclimate of Poland's Ziemia Kłodzka Region. Geogr. Pol. 86, 47–54. doi:10.7163/gpol.2013.6
Nassiri, P., Monazzam, M. R., Golbabaei, F., Dehghan, S. F., Rafieepour, A., Mortezapour, A. R., et al. (2017). Application of Universal Thermal Climate Index (UTCI) for Assessment of Occupational Heat Stress in Open-Pit Mines. Ind. Health 55 (5), 437–443. doi:10.2486/indhealth.2017-0018
Pantavou, K., Lykoudis, S., Nikolopoulou, M., and Tsiros, I. X. (2018). Thermal Sensation and Climate: a Comparison of UTCI and PET Thresholds in Different Climates. Int. J. Biometeorol. 62 (9), 1695–1708. doi:10.1007/s00484-018-1569-4
Park, S., Tuller, S. E., and Jo, M. (2014). Application of Universal Thermal Climate Index (UTCI) for Microclimatic Analysis in Urban Thermal Environments. Landscape Urban Plan 125, 146–155. doi:10.1016/j.landurbplan.2014.02.014
Raftery, A. E., Zimmer, A., Frierson, D. M. W., Startz, R., and Liu, P. (2017). Less Than 2 °C Warming by 2100 Unlikely. Nat. Clim Change 7, 637–641. doi:10.1038/nclimate3352
Ramachandra, T. V., Bharath, H. A., and Sowmyashree, M. V. (2013). Analysis of Spatial Patterns of Urbanisation Using Geoinformatics and Spatial Metrics. Theor. Empir. Res. Urban Manag. 8 (4), 5–24. https://www.jstor.org/stable/10.2307/24873360.
Rifkin, D. I., Long, M. W., and Perry, M. J. (2018). Climate Change and Sleep: A Systematic Review of the Literature and Conceptual Framework. Sleep Med. Rev. 42, 3–9. doi:10.1016/j.smrv.2018.07.007
Russo, S., Dosio, A., Graverssen, R. G., Sillman, J., Carrao, H., Dunbar, M. B., et al. (2014). Magnitude of Extreme Heat Waves in Present Climate and Their Projection in Warming World. J. Geophys. Res. Atmos. 119, 12500–12512. doi:10.1002/2014jd022098
Satir, O. (2016). “Mapping the Land-Use Suitability for Urban Sprawl Using Remote Sensing and GIS under Different Scenarios,” in Sustainable Urbanization. Editors M. Ergen (London: IntechOpen). doi:10.5772/63051
Sekertekin, A., and Bonafoni, S. (2020). Land Surface Temperature Retrieval from Landsat 5, 7, and 8 over Rural Areas: Assessment of Different Retrieval Algorithms and Emissivity Models and Toolbox Implementation. Remote Sensing 12 (2), 294. doi:10.3390/rs12020294
Setiawati, M. D., Jarzebski, M. P., and Fukushi, K. (2021). “Heat Vulnerability Index Development and Application in Medan City, Indonesia,” in Integrated Research on Disaster Risks, Disaster Risk Reduction. Editors R. Djalante, M. B. F. Bisri, and R. Shaw 87–110. doi:10.1007/978-3-030-55563-4_6
Singh, S., Hanna, E. G., and Kjellstrom, T. (2015). Working in Australia's Heat: Health Promotion Concerns for Health and Productivity. Health Promot. Int. 30 (2), 239–250. doi:10.1093/heapro/dat027
Sioen, G., Sekiyama, M., Terada, T., and Yokohari, M. (2017). Post-disaster Food and Nutrition from Urban Agriculture: A Self-Sufficiency Analysis of Nerima Ward, Tokyo. Ijerph 14 (7), 748. doi:10.3390/ijerph14070748
Sobrino, J. A., Jimenez-Munoz, J. C., Soria, G., Romaguera, M., Guanter, L., Moreno, J., et al. (2008). Land Surface Emissivity Retrieval from Different VNIR and TIR Sensors. IEEE Trans. Geosci. Remote Sensing 46, 316–327. doi:10.1109/tgrs.2007.904834
Sulikowska, A., and Wypych, A. (2020). Summer Temperature Extremes in Europe: How Does the Definition Affect the Results? Theor. Appl. Climatol. 141, 19–30. doi:10.1007/s00704-020-03166-8
Sun, Q., Miao, C., Hanel, M., Borthwick, A. G. L., Duan, Q., Ji, D., et al. (2019). Global Heat Stress on Health, Wildfires, and Agricultural Crops under Different Levels of Climate Warming. Environ. Int. 128, 125–136. doi:10.1016/j.envint.2019.04.025
Surabaya Municipal Government (2016). Midterm Development Planning of Surabaya City 2016-2021. Indonesian. Available at: https://bappeko.surabaya.go.id/images/File%20Upload/RPJMD-2016-2021.pdf Surabaya (Accessed July 9, 2017)
Taylor, K. E., Stouffer, R. J., and Meehl, G. A. (2012). An Overview of CMIP5 and the Experiment Design. Bull. Amer. Meteorol. 93, 485–498. doi:10.1175/bams-d-11-00094.1
Tomlinson, C. J., Chapman, L., Thornes, J. E., and Baker, C. J. (2011). Including the Urban Heat Island in Spatial Heat Health Risk Assessment Strategies: a Case Study for Birmingham, UK. Int. J. Health Geographics 10, 42. doi:10.1186/1476-072X-10-42
USGS (2019). Landsat 7 (L7) Data Users Handbook. online Available at: https://prd-wret.s3-us-west-2.amazonaws.com/assets/palladium/production/atoms/files/LSDS-1927_L7_Data_Users_Handbook-v2.pdf (Accessed on March 19, 2021).
Varquez, A. C. G., Darmanto, N. S., Honda, Y., Ihara, T., and Kanda, M. (2020). Future Increase in Elderly Heat-Related Mortality of a Rapidly Growing Asian Megacity. Sci. Rep. 10 (1), 9304. doi:10.1038/s41598-020-66288-z
Wagner, W., and Prub, A. (2002). The IAPWS Formulation 1995 for the Thermodynamic Properties of Ordinary Water Substance for General and Scientific Use. J. Phys. Chem. Ref. Data 31 (2), 387535. doi:10.1063/1.1461829
Wang, Y., Chen, L., Song, Z., Huang, Z., Ge, E., Lin, L., et al. (2019). Human-perceived Temperature Changes over South China: Long-Term Trends and Urbanization Effects. Atmos. Res. 215, 116–127. doi:10.1016/j.atmosres.2018.09.006
Weedon, G. P., Balsamo, G., Bellouin, N., Gomes, S., Best, M. J., and Viterbo, P. (2014). The WFDEI Meteorological Forcing Data Set: WATCH Forcing Data Methodology Applied to ERA-Interim Reanalysis Data. Water Resour. Res. 50, 7505–7514. doi:10.1002/2014wr015638
Wu, Z., Kong, F., Wang, Y., Sun, R., and Chen, L. (2016). The Impact of Greenspace on Thermal Comfort in a Residential Quarter of Beijing, China. Int. J. Environ. Res. Public Health 13 (12), 1217. doi:10.3390/ijerph13121217
Zander, K. K., Richerzhagen, C., and Garnett, S. T. (2019). Human Mobility Intentions in Response to Heat in Urban South East Asia. Glob. Environ. Change 56, 18–28. doi:10.1016/j.gloenvcha.2019.03.004
Zare, S., Hasheminejad, N., Shirvan, H. E., Hemmatjo, R., Sarebanzadeh, K., and Ahmadi, S. (2018). Comparing Universal Thermal Climate Index (UTCI) with Selected Thermal Indices/environmental Parameters during 12 Months of the Year. Weather Clim. Extremes 19, 49–57. doi:10.1016/j.wace.2018.01.004
Keywords: urban heating, UTCI, climate change scenario, land cover change, climate change adaptation, urban green
Citation: Setiawati MD, Jarzebski MP, Gomez-Garcia M and Fukushi K (2021) Accelerating Urban Heating Under Land-Cover and Climate Change Scenarios in Indonesia: Application of the Universal Thermal Climate Index. Front. Built Environ. 7:622382. doi: 10.3389/fbuil.2021.622382
Received: 28 October 2020; Accepted: 15 April 2021;
Published: 04 May 2021.
Edited by:
Francesco Salamone, Consiglio Nazionale delle Ricerche (CNR), ItalyReviewed by:
Ming Luo, Sun Yat-Sen University, ChinaMatteo Ghellere, Consiglio Nazionale delle Ricerche (CNR), Italy
Copyright © 2021 Setiawati, Jarzebski, Gomez-Garcia and Fukushi. This is an open-access article distributed under the terms of the Creative Commons Attribution License (CC BY). The use, distribution or reproduction in other forums is permitted, provided the original author(s) and the copyright owner(s) are credited and that the original publication in this journal is cited, in accordance with accepted academic practice. No use, distribution or reproduction is permitted which does not comply with these terms.
*Correspondence: Martiwi Diah Setiawati, bWFydGl3aTE4MDJAZ21haWwuY29t