Evolution of Pneumatic Tsunami Simulators–From Concept to Proven Experimental Technique
 Ian Chandler1
  Tiziana Rossetto
- 1HR Wallingford, Wallingford, United Kingdom
- 2William Allsop Consulting Ltd, Abingdon, United Kingdom
- 3EPICentre, Department of Civil, Environmental and Geomatic Engineering, University College London, London, United Kingdom
- 4EPICentre, Civil, Environmental and Geomatic Engineering, University College London, London, United Kingdom
This paper describes the evolution through three generations of pneumatic Tsunami Simulators for physical model tests of realistic tsunami. The pneumatic method, originally developed for tidal modeling in the Fifties, has been modernized to generate extraordinarily long waves in a controlled manner, with accurate reproduction of recorded free-surface tsunami field data. The paper describes how the simulator designs were developed and how they performed in the laboratory. Example results are presented from selected research studies that have validated their performance and then used to quantify tsunami effects. Having described each of the first, second, and third generation Tsunami Simulators, the paper discusses how to calibrate the wave generation control to model tsunami with model periods 20–240 s duration (equivalent to 2–20 min duration in prototype at 1:50 scale), many of which are far too long to “fit into the test flume.” The evolution of a composite approach to wave calibration is described with examples from second and third generation devices, demonstrated by successful simulation of both the 2004 Boxing Day, and the 2011 Great Eastern Japan (Tohoku) Tsunami at 1:50 scale.
Introduction
Accurate modeling of tsunami propagation and interaction with coastlines is vital to develop informed tsunami defense, public advice and warning systems, and to manage disaster relief. Tsunamis are generated by an earthquake, a landslide (above or below the ocean), a volcanic eruption, or a major debris slide, any of which caused a rapid displacement of a large body of water, generating a long gravity wave. Tsunami are parameterized according to period (T), wavelength (L), wave height (H) and the components of the wave height positive and negative amplitude (a+ and a−).
Tsunami waves reach the coastline in a variety of different shapes due to the long distance propagation, complex bottom and coastal bathymetry and their initial shape (Sriram et al., 2019). Tsunami reaching the shore may be broadly classified in the following three categories (e.g. Shuto, 1985):
• Non-breaking waves that act as a rapidly rising tide, often observed during small and moderate tsunami events;
• Breaking bore or hydraulic jump, observed as a result of wave breaking during large tsunami events;
• Undular bore, sometimes observed after long distance propagation (in terms of wavelength) caused by the disintegration of the tsunami into a series of solitons.
It is therefore vital for researchers to understand which type of tsunami they are representing within their experiments. The few field measurements of tsunami free-surface elevation that have been recorded in recent years, (e.g. the trace recorded by the yacht “Mercator” of the 2004 Indian Ocean Tsunami at a water depth of 14 m) show that the solitary and N-wave approximations are poor representations of real tsunami signals. This is demonstrated clearly in (Figure 2 of Schimmels et al., 2016) where they compare the trace recorded by the yacht “Mercator” and one from the 2011 East Coast tsunami with a solitary wave.
A unique advantage of the pneumatic tsunami generation method for physical modeling described here is that it enables the displacement of very large volumes of water in a controlled manner. This method makes it possible to generate waves of very long wavelength and, crucially, has been shown to accurately reproduce free surface profiles from recorded tsunami field data. This paper aims to draw together the lessons learnt from over ten years of research, designing, constructing and testing world-leading pneumatic Tsunami Simulators for scaled laboratory modeling.
This paper documents the development of a laboratory modeling technique that can reproduce at appropriate scales, subduction zone tsunami, for example, those measured in the 2004 Indian Ocean and 2011 Japan East Coast tsunami. This paper will concentrate on the pneumatic tsunami generation method, describing how designs were developed, how they work, and presenting research results validating their performance to quantify tsunami effects.
Previous Work to Generate Tsunami in Laboratories
Testing of tsunami in hydraulics laboratories has been relatively rare, so advances in tsunami generation at laboratory scale are similarly few. Previous tsunami simulation approaches can be grouped under four main headings:
• those that generate waves by reproducing the physical triggering mechanism of a tsunami, landslide or motion of the seabed;
• simulating a part of a tsunami wave trace, primarily by dam-break or similar;
• generating a much shorter wave such as a soliton;
• simulating a full time series using some form of Tsunami Simulator.
Reproduction of the Prototype Tsunami Trigger
In the past, reproducing the physical triggering of tsunami was considered the most appropriate approach to simulating tsunami-like waves. In the early 1970s at California Institute of Technology where (Hammack. 1972; 1Hammack, 1973) used a moving section (0.3 m or 0.6 m) of a test flume floor, raised or lowered suddenly by a hydraulic ram to reproduce sub-sea bed motion. Potentially a good way to simulate effects of sub-seabed movement, this approach was only ever used in relatively shallow depths, and had not been repeated until a series of recent micro-experiments at Dundee, see (Lu et al., 2017a; 2Lu et al., 2017b).
Thunsyanthan and Madabhushi, (2008) attempted to generate a scaled tsunami by dropping a 100 kg rectangular block vertically into the deeper end of an ultra-short (4.5 m) flume in an attempt to recreate a sudden sea-bed motion in reverse. The waves generated were however, equivalent to H = 2.5 m, T = 7.5 s at 1:25 scale, which is far too short a period to bear any significant similarity with realistic tsunami waves.
Practically all studies on landslide-triggered tsunami involve the tsunami waves being generated using a physically realistic (if simplified) landslide to displace the water in a flume/basin. A useful review (of work mainly in the United States) is given by Enet and Grilli, (2007). Wiegel, (1955) studied landslide-generated waves in a flume using a wedge-shaped box sliding down a plane. This “moving block” method is still the most common way of modeling landslide-triggered waves, often with sand or gravel filled boxes sliding down a slope under gravity. Buoyant wedge paddles driven/controlled by electric or hydraulic rams have been used to generate solitary waves in the Tsunami Basin under the United States Network for Earthquake Engineering Simulation (NEES) program, Yim et al. (2004), McFall and Fritz, 2016. Each sliding wedge piston (29 no.) is driven by electric motors to give wave periods of 0.5–10 s (model), and maximum wave heights of 0.8 m in up to 1 m depth. Landslide-triggered tsunami have also been modeled at the University of Rhode Island using a Gaussian shaped underwater shape sliding down a 15° slope, and similar experiments were conducted in a wave basin at Bari by Di Risio et al. (2009). A pneumatically controlled landslide generator was developed at the Swiss Federal Institute of Technology in Zurich, Switzerland, and was used to generate a high-speed granular slide at 1:675 of Lituya Bay, (Fritz et al., 2001).
A major drawback of all these approaches is that they only allow the study of tsunami or tsunami impact for near source events.
Wave Paddles
The most common and robust attempt to reproduce subduction zone tsunami waves in the laboratory has previously been a piston paddle. This has been used in various laboratories, particularly in the large Hydro-Geo Flume at Port and Air Research Institute (PARI) described by Shimosako et al. (2002), and in the Large Wave Flume (Großer Wellenkanal, GWK) described by Schimmels et al. (2016). The PARI flume used a piston paddle producing up to significant wave height, Hs = 1.4 m at T = 5.5 s, but it is understood that the capacity may have been increased in recent years. The GWK uses a piston type wave maker with a 4 m stroke. In its usual mode, it can generate wave heights of up to 2 m at typical periods between 3 s and 8 s in water depths between 4 and 5 m. The tsunami tests described by Schimmels et al. (2016) however, used a water depth reduced to 1 m to generate waves of periods up to 100 s, corresponding to typical tsunami durations of 1,000 s at 1:100 scale. The maximum achievable wave heights were about 6 cm, corresponding to 6 m at that scale.
Dam-Breaks
Several researchers have used a dam-break approach to generating tsunami bore-fronts, see particularly Nouri et al. (2010), Al-Faesly et al. (2012), Kihara et al. (2015). This method is effective in generating a violent bore-front, but few comparisons have been made with the full length of recorded tsunami profiles. This may limit the application of this method to the investigation of the initial tsunami impact loads only.
A pump-driven flow generator has been developed at Franzius-Institute at the University of Hannover, using a set of pumps to control depths and incoming/outgoing currents. Generation of different kinds of waves are claimed by Goseberg et al. (2013), Bremm et al. (2015), Drähne et al. (2016), including single cycle sinusoidal waves, solitary waves and N-waves. They present results from wave periods 20 s–100 s, with wave heights from 20 to 40 mm. Within the limitations of the system, a pumped system gives a robust way to add water volume to the test section, although installing new pump capacity in any existing facility to give the volumes and peak flows required by realistic tsunami may be extremely expensive.
Pneumatic Tanks
A 3-part tsunami generator 45 m × 4 m, has been developed at Kyoto University’s Ujikawa Open Laboratory of the Disaster Prevention Research Institute (http://www.kyoto-u.ac.jp/cutting-edge/project/page04.html) with results reported by Hiraishi et al. (2015) and Tomiczek et al. (2016a, 2016b). The generator combines a piston-based wave maker with a moderate (2.5 m) stroke, a current generator, and an overhead water tank, to allow flexibility in the profile of the waves generated. The current generator, in particular, is needed to produce the long period tsunami flows that follow initial bore-type waves. The water tank, meanwhile, can reproduce other effects of tsunami subduction zone movements, including those driven by two linked sources.
A tsunami generator was created at the Laboratory of Hydraulic Constructions (LCH) at Ecole Polytechnique Federale de Lausanne (EPFL) in Switzerland that uses a vertical release technique to generate surges and long waves, Wüthrich et al. (2018). An upper reservoir was connected to a lower reservoir, through three submerged pipes. When the generation system was activated, a difference in the head between the upper and lower reservoir was established, resulting in a gravitational flow through the pipes. Since the lower basin was completely filled with water, the incoming discharge resulted in an upward flow at the channel inlet, and subsequently, a free-surface wave formed and propagated downstream in the flume.
Early examples of pneumatic tsunami generators include (Togashi, 1986) and Palmer and Funasaki. (1967). These facilities had a very similar generation technique to the facility described within this paper, but with considerably smaller Froude-scaling.
First Generation of Pneumatic Tsunami Simulator
Introduction
The first generation of pneumatic Tsunami Simulator was conceived by HR Wallingford following the Indian Ocean tsunami in 2004. At the time, the most popular method for generating tsunami within laboratories was the paddle method, based on methods used in laboratories across the world to generate (shorter) wind waves. By increasing the stroke length of a typical paddle wind wave generator, the period of the waves could be increased so much that they might match the extraordinarily long wavelengths of tsunami.
Unfortunately, in 2004, there was a practical limit to stroke length that most laboratories could accommodate, and many researchers had tried and failed to use this method to reproduce full duration, and particularly trough-led, tsunami at that time.
In creating the pneumatic Tsunami Simulator, the HR Wallingford team intended to extend the technology of tide generation to produce an alternative tsunami generation method avoiding mechanical stroke length limitations. Rather than generating a very long wind wave, they hoped to use advancements in vacuum pump and control technologies to produce a very short tide.
The precursor of HR Wallingford (Hydraulics Research Station, HRS) developed the tide generation method over fifty years previously, Wilkie and Young (1952). In the 3 decades after its development, this method was used extensively in physical modeling at HR Wallingford, most notably within the large area model for the Third London Airport (HRS, 1974) producing a 12.5 h tide in 7.5 min. Eventually though, this method was made redundant by the advancement of large area numerical tidal models.
The 2004 Indian Ocean tsunami had a duration of approximately 20 min. At a scale of 1:50, this would require a laboratory-scale wave of just under 3 min period. If the tide generation technology of the Fifties was to be repurposed to create a tsunami wave, it would require a 3x increase of speed of that system. In discussion with the UCL researchers, the Wallingford team agreed that this was a reasonable ambition, and set to designing the first generation pneumatic Tsunami Simulator (TS).
Concept Design
The methods described by Wilkie and Young (1952) were the initial starting point for the concept design. A vacuum pump is used to draw air out continuously of a steel box or tank. An outlet underwater into the flume allows water to move into or out of the tank. An air valve on the top of the tank is then used to regulate the pressure inside the tank, raising and lowering the water level inside (Tank Water Level, TWL). In the new systems, control of this air valve, via computer software, allows the wave form generated to be closely controlled.
The wave from the TS is created by changing the relative vacuum inside the TS and hence the TWL. Raising the TWL creates a depression in the free-surface in the flume, creating a wave trough. Lowering the TWL increases the flume water level creating a wave crest. The control system involved changing the angle of the computer-controlled inlet air valve. This process is summarized in Figure 1.
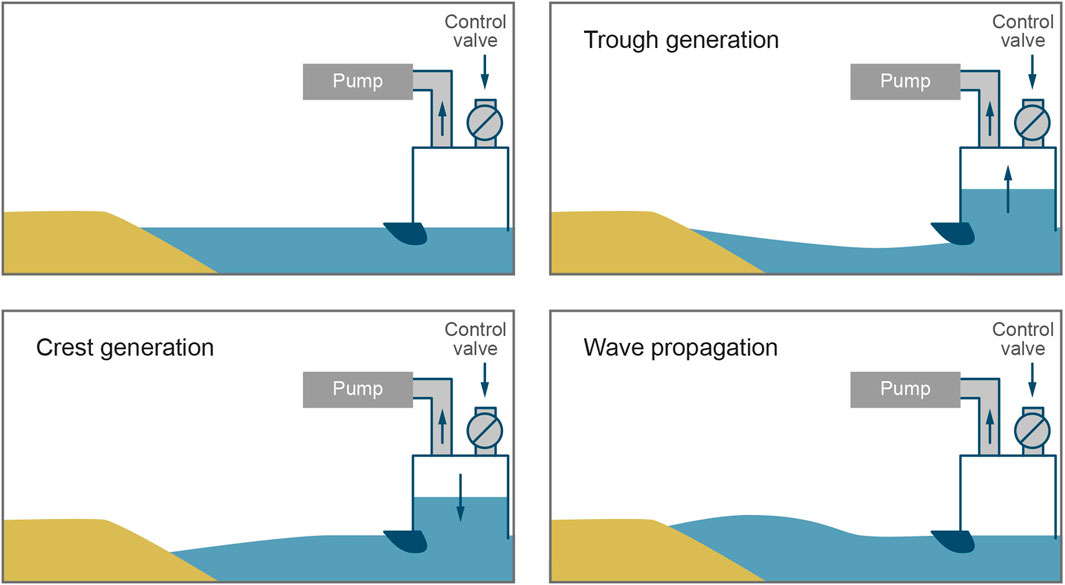
FIGURE 1. Schematic diagram of pneumatic Tsunami Simulator wave generation. From top left to bottom right: pump on and control valve open; pump on and control valve closed creating wave trough; pump on and control valve open creating wave crest; wave propagating along flume.
Detailed Design and Construction
The first generation Tsunami Simulator at Wallingford was constructed in spring 2008, funded by EPSRC through the EPICentre grant (No. EP/F012179/1). This Tsunami Simulator was designed to fit in either of HR Wallingford’s Flumes one or two in the Froude Modeling Hall. These flumes are each 45 m long and 1.2 m wide. Approach bathymetry and shoreline within the flume were formed in cement mortar on top of compacted fill. For the EPICentre experiments (Charvet, 2011), they were shaped to represent a 1:20 coastal slope followed by a horizontal “inland” inundation area (3.3 m long). The toe of the 1:20 slope was situated 15.2 m from the outlet of the TS.
The design of the first generation TS (Allsop et al., 2008; Robinson, 2009) was conducted with the aim of creating a TS tank with sufficient strength to resist the developed pressures, but also to allow rapid deployment, removal and storage. A modular system of steel panels was chosen which created a 4.8 ml x 1.8 mH × 1.15 mW tank (length x height x width). Internal bracing was included to avoid distortion under the pressure difference between inside and outside the TS. Internal baffles were also included to reduce longitudinal sloshing within the TS tank, perhaps exacerbated by the single offset air inlet and outlet. The front panel of the first generation TS was adjustable to create different outlet heights. A plastic cylinder (115 mm diameter) was placed over the bottom edge of the panel to reduce turbulence created by the sharp steel edge during peak flows.
The first generation TS tank was connected to a two-stage side-channel vacuum pump (7.5 kW Zepher™) RT-84086, and two 4 inch butterfly valves. The first valve acted as a safety valve, that was to be opened in cases of emergency to avoid the pump being flooded. The second valve was connected to a computer via a servo-motor operated by an open-loop control system, calibrated to produce the required wave profiles. The size of the valves and pump were chosen by recreating air-flow calculations by Wilkie and Young (1952). The published valve and pump performance characteristics were combined with the flume and tank dimensions to estimate pressures, water levels and flow-rates into the tank. These calculations were repeated for different configurations for optimum use of the available space.
The TS (of any generation) can theoretically be controlled by either a closed or open-loop system (Rossetto et al., 2011). With open-loop control, the user prescribes a control valve position time series during wave generation. This gives greater certainty of the wave generated, but requires calibration for each desired wave profile. A closed-loop control system uses a Proportional Integral Derivative (PID) feedback loop to update the valve position based on the difference between a measured and target variable, such as the water level inside the TS tank, Tank Water Level (TWL). The choice of the input variable is critical to the success of the feedback system (Goseberg et al., 2013). A perfect closed-loop system does not require individual wave calibrations because the system should produce the desired wave first time. An open-loop system requires an iterative calibration process in order to simulate the desired waveform. The first generation TS used an open-loop control based on the LabVIEW software. Some initial investigations into closed-loop control were conducted, but the use of “water level only” control produced some “undesired wave behavior in the flume” (Rossetto et al., 2011).
Testing
Initial testing of the first generation Tsunami Simulation was performed during the EPICentre project. It was split into two main stages: wave run-up tests; and measuring forces on a single building. The first stage included identifying the range of waves that could be simulated and their repeatability (Figure 2). Sine, solitary (elevated) and trough-led N-waves were generated, ranging in period from 5 to 18 s (model), with positive amplitudes up to 0.1 m. The ability to simulate stable trough-led waves is a unique ability of the pneumatic generation system. An attempt was made to calibrate the Mercator wave trace from the 2004 Boxing Day Tsunami at 1:50 scale (see Rossetto et al., 2011). The trough and the front face of the crest were well reproduced, however, the wave tail was not reproduced quite as well.
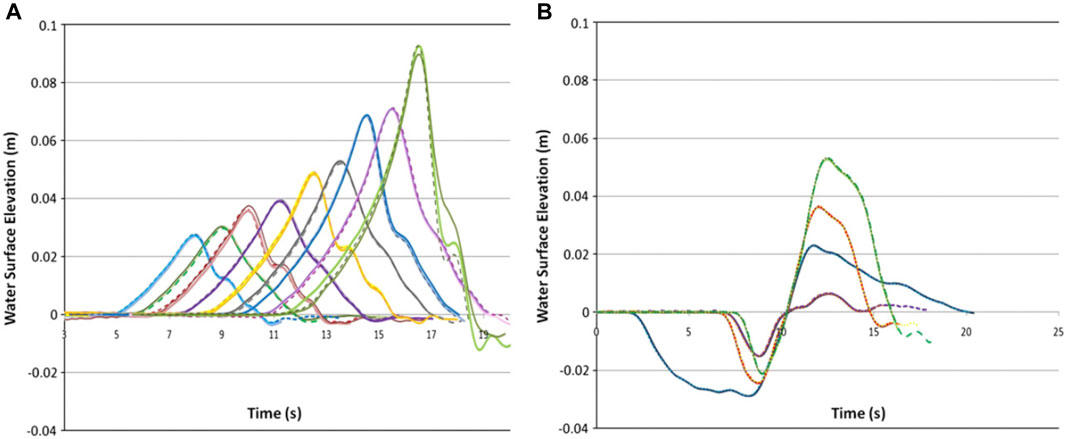
FIGURE 2. Repeatability of elevated and N-waves with the first generation TS (Rossetto et al., 2011), the profiles obtained from three tests for each of nine different solitary wave heights (A) and (B) the profiles obtained for three tests for four different N-waves. Different line styles represent different repeat tests (solid, opaque and dashed).
The first research conducted with the TS investigated the run-up of various elevated and N-waves. This work is described in Charvet. (2011), and Charvet et al. (2013), and resulted in a new predictive equation for wave run-up, perhaps now superseded by McGovern et al (2018).
The second stage of the EPICentre project measured the forces acting on a single idealized office or hotel building and are reported in Lloyd. (2016). Lloyd focused on measuring total body force and pressures acting on a square (plan) building at different orientations to the incoming tsunami wave. A range of solitary (elevated) and N-waves were used, with the body force measured using a 3-axis load-cell and arrays of pressure transducers used to measure pressures on the different faces.
Comments on the first Generation Tsunami Simulator
The work done on the TS under the EPICentre project demonstrated the capability of the pneumatic Tsunami Simulator technique, but also highlighted areas for improvement. These included the flume length (too short), the height of the TS tank (should be increased to allow greater volume and head of water to be used) and turbulence created at the outlet during wave generation, particularly crest generation. The introduction of an active wave absorption system and closed-loop control were also desirable.
Follow-Up Numerical Study and Design Improvements
Despite success with the generation of the 2004 Mercator time series at 1:50 scale using the first generation Tsunami Simulator, particular wave shapes/heights showed significant distortion. As part of HYDRALAB IV, a 2-dimensional (2D) numerical model of the Tsunami Simulator was created to:
• Identify factors and/or processes that reduced efficiency, perhaps sloshing within the tank, eddies from the outlet, or other phenomena;
• Identify inherent generation limits; and hence
• Investigate ways of increasing the generation window.
The (2D) numerical model was created using the OpenFOAM® computational fluid dynamics (CFD) platform (see Weller et al., 1998). The size and shape of the domain were created to match that of the first generation Tsunami Simulator, 4.8 m long and 1.8 m high. The model used the interFoam solver and replicated the tank control system using a time dependent pressure boundary condition at the tank roof. Further model details are described by Allsop et al (2014).
Initial testing confirmed that the CFD model could reproduce the idealized tsunami waves generated in the lab showing suitable agreement with the recorded wave gauge data. The OpenFOAM model was therefore used to investigate the limits of the Tsunami Simulator, in particular identifying the maximum height for generated waves, and the maximum steepness of wave that the tank could generate.
The numerical model simulations showed that an increase in the height of the target signal did not necessarily leads to an equivalent increase in wave height. As the steepness of the wave increased, the wave was seen to separate into a series of sharp peaks. This suggested that throttling at the outlet was imposing a limit to the outflow rate, and thus to the rate of rise of the tsunami wave.
The numerical model demonstrated that the outlet of the first tank led to substantial reverse-flow eddies at peak flow conditions. Incremental improvements to the flow-shaper in the numerical model created a smooth contraction of the flow through the outlet and a controlled expansion downstream. A further project (under HYDRALAB IV) supported validation of the numerical model by direct comparison between physical and numerical tests using pressures measured at the top of the TS tank as input to the numerical model. The tank was raised, and the flow-shaper was installed (Figure 3). The Mercator time series was generated at an undistorted Froude scale of 1:50 (Figure 4) and the improved performance characteristics were reported by Allsop. (2014).
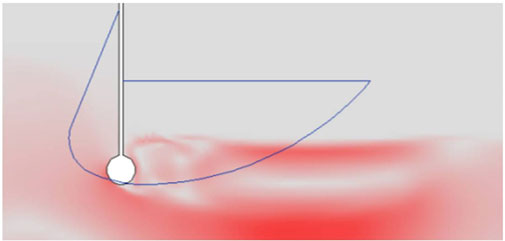
FIGURE 3. Illustration of final design of the new outlet flow shaper (blue line) superimposed on velocity field (gray to red scale where red is high velocity and turbulence) from a numerical model of the original outlet (white circle) during crest generation (flow out of the first generation TS into the flume, left to right).
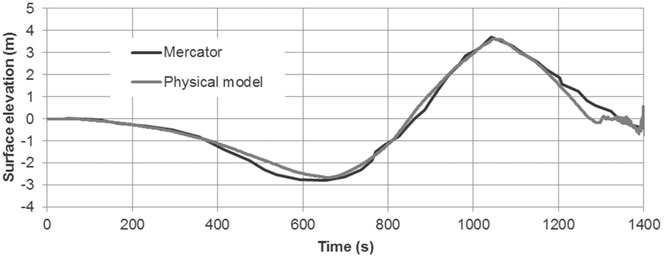
FIGURE 4. Mercator time series at 1:50 scale with measurements in improved first generation Tsunami Simulator.
Second Generation of Pneumatic Tsunami Simulator
Introduction
The second generation Tsunami Simulator was constructed in a flume ∼100 m long. This different flume had the added benefit of greater width, 1.8 m, so more 3-dimensional experiments could be run with flows through breaches in seawalls, or around groups of buildings. The construction of the second generation Tsunami Simulator within this especially long flume looked to limit (some of) the effects of wave reflection. Local limitations forced the Tsunami Simulator tank to be shorter, and coupled with the desire to increase the rate of rise, the new tank was made taller at 3.5 m vs 1.8 m. This had the significant advantage of increasing the maximum outlet flows, so (potentially) steepening the rising part of the tsunami time trace. Results from the second generation device in the 100 m long flume were presented by Chandler et al (2016) and McGovern et al (2016). Interestingly, these experiments provided insight into the 'flume length vs wave length' problem, and suggested ways by which the effects of reflections might be reduced. The research performed during this stage of research was funded by the European Research Council (ERC) URBANWAVES grant (No. 336084).
Design and Construction
The CFD model developed to design the flow shaper for the first generation TS was used extensively in the design of the second generation TS. The effect of changing tank height and length were investigated as well as the influence of the outlet height and the still water level (SWL) in the flume at the start of wave generation. The numerical model was also used to estimate the potential performance of the second generation TS. One of the findings from the numerical modeling was that for a TS tank less than 4.5 m long, there was no discernible sloshing within the tank during wave generation, even without the presence of baffles. For tanks longer than 4.5 m a longitudinal slosh could develop if baffles were not used. This gave a desirable length of TS of 4.0–4.5 m. The width of the TS is governed by the width of the flume into which it is placed. The height of the TS is governed by the available head room above the flume and the maximum head difference achievable with the vacuum pumps used. Greater head differences (partial vacuum pressures) start to require more complex and more expensive pumps.
For the second generation TS, a tank length of 4.0 m was chosen as this did not need internal baffles, simplifying design and fabrication. The headroom above the flume dictated a maximum tank height of 3.5 m. The second generation TS was designed to be deployed in HR Wallingford’s Flume 3, which is 1.8 m wide, 100 m long and 1.8 m deep, which in turn dictated the maximum width of the second generation TS at 1.8 m. Due to access constraints to Flume 3, the second generation TS required a different construction method to the first generation, which had been constructed outside the flume and lifted into position. The second generation TS was constructed in-situ from long narrow channel section panels. Each panel was 0.465 m wide and varied in length depending in its intended location (side panels were 3.5 m long; front, back and top panels were 1.5 m long). All steel design was accorded with Eurocode 3 (BS EN, 1993). The TS does not come under the Pressure Equipment Directive (Directive, 97/23/EC) as the vacuum inside it insufficient, but these regulations were still consulted during the design phase for best practice information.
Numerical modeling had demonstrated that the outlet height did not influence the wave generated unless it was too close to the SWL in the flume, and might therefore allow air into the outlet during trough generation. An outlet height of 0.4 m was chosen as this allowed the greatest range of flume depths (SWL’s) to be used. The design of the front panels allowed the outlet height to be changed in fixed increments by removing panels and moving the lowest panel up. The same design of outlet flow shaper developed for the first generation TS (see Figure 3) was used on the second generation TS. Each of the eight top panels were pre-cut with an 8 inch (0.203 m) diameter hole, which allowed instrumentation, vacuum hoses and control valves to be fitted. Un-used holes were later blanked off. A 5 inch (0.127 m) internal diameter 45° butterfly valve was used for the second Generation TS in combination with the ZepherUK RT-84086 vacuum pump from the first generation TS coupled with a new RT-95330 vacuum pump (Zepher, 2016).
The control system for the second generation TS used a Beckhoff EtherCAT based system, governed by a programmable logic controller, PLC, and a. NET application. The PLC does most of the work, and is where the main functionality was set. The. NET application was effectively used as a graphical interface for users to communicate with the PLC on the controller. The control software allowed the vacuum pumps to be switched on and off remotely and to control the angle of the air valve in two different ways. The first, and simplest method of controlling the valve was by setting a desired angle and a speed (°/s) at which the valve should move to reach this position from its current one. This was used to set the initial water level inside the TS (Tank Water Level, TWL) and during the commissioning stage to explore the response of the TS system. The second method of controlling the valve position was through a valve time series, given to the control application in a two column. csv file. Various safety protocols were implemented through the PLC, including a safe switch off procedure when an emergency stop button was pressed and procedures to prevent water from being drawn up into the vacuum pumps.
HR Wallingford’s Flume 3 has a hinged flap wave paddle mounted at the upstream end of the flume and this could not be removed for the deployment of the TS. The TS, therefore, sat downstream of that wave paddle, ∼2.0 m from the end wall of the flume, reducing slightly the available 100 m flume length. The experimental setup of the second generation TS for the initial URBANWAVES experiments is shown in Figure 5. Twin wire resistance wave gauges were placed at various distances from the front of the TS on the constant depth region of the flume and along the 1:20 bathymetry slope. Wave gauges were typically sampled at 100 Hz throughout testing.
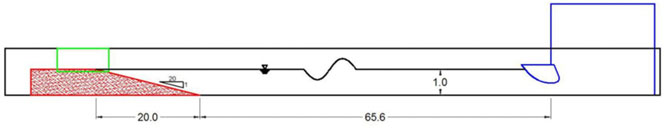
FIGURE 5. Schematic of the second generation TS for URBANWAVES phase 1 testing, bathymetry in red on the left with the flume window in green and the second generation TS in blue on the right.
Testing
A series of wave calibrations were performed and presented in (Chandler et al., 2016). This included elevated (crest only) and trough-led N-type waves. The calibrated elevated waves and N-waves are summarized in Table 1 and Figure 6. The calibration process was iterative, based on a degree of trial-and-error.
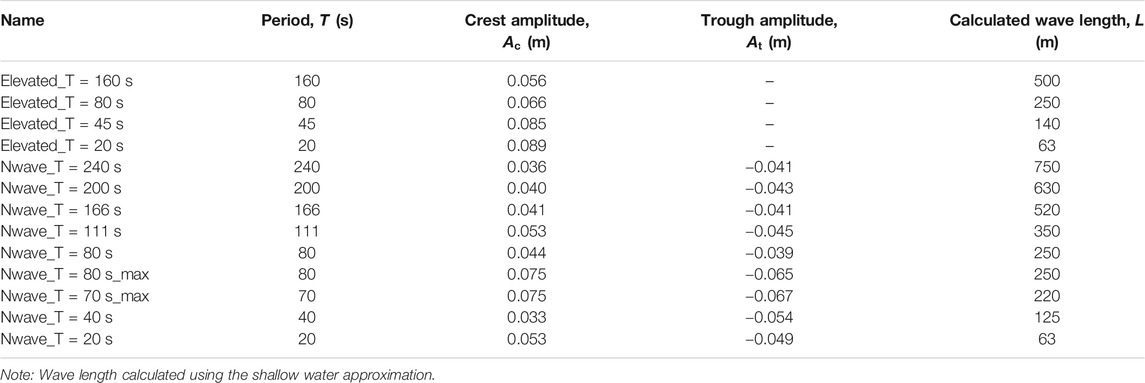
TABLE 1. Calibrated crest only (elevated) waves and N-waves using second generation TS.
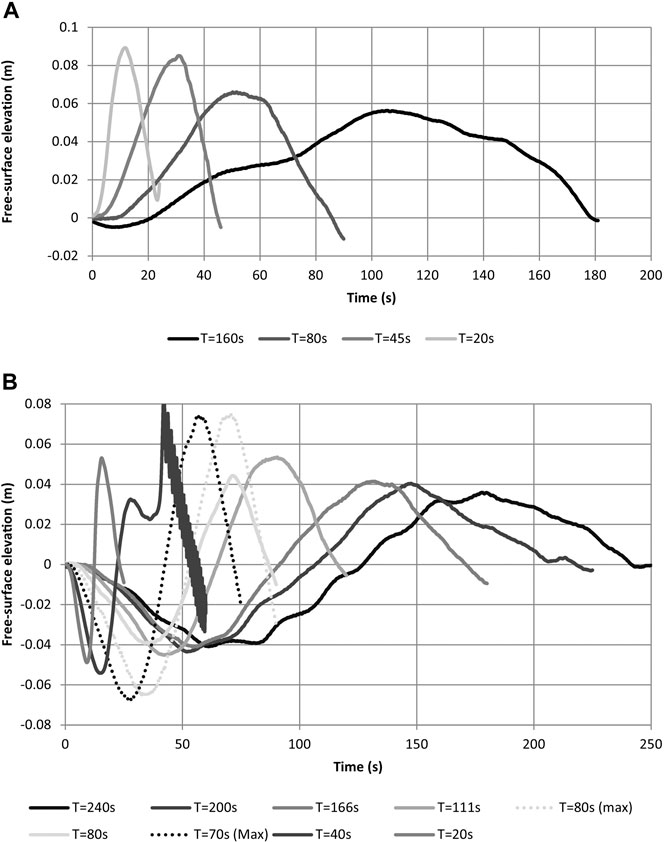
FIGURE 6. Calibrated crest only (elevated) waves (A) and N-waves (B) using the second generation TS, measured at the toe of the bathymetry.
For shorter period waves, the propagation of the waves could be tracked along the flume. The propagation of a 20 s elevated wave is shown in Figure 7. The wave was unchanged as it propagated over the area of constant depth (“offshore” region), and then shoaled when it reached the 1:20 slope (WG_05 and 06). The reflection from a vertical wall present at the top of the 1:20 slope during this test can be seen in the second half of WG_06 traveling back along the flume to WG_05, arriving at approximately 45 s. The wave fissions as it propagates against the continued arrival of the incident wave.
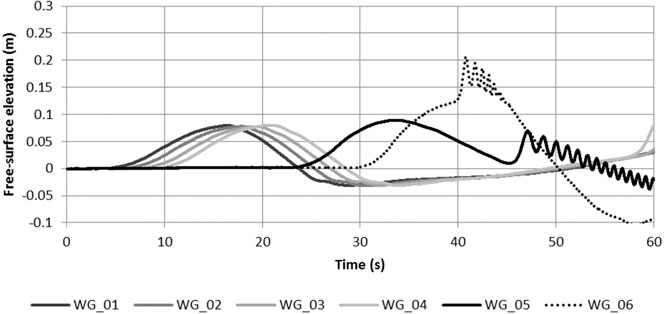
FIGURE 7. T = 20 s elevated wave propagating along the flume, WG_01 to 04 in a constant depth (7.0, 12.0, 17.0 and 22.0 m from TS respectively, h = 1.0 m), WG_05 at the toe of the 1:20 slope (65.6 m from TS, h = 1.0 m) and WG_06 on the 1:20 slope (75.6 m from TS, h = 0.5 m).
For longer period waves (T > 45 s) the generation is not complete before the reflections from the bathymetry (and any structures present) reach the TS. Through the calibration process in Flume 3, these reflections are accounted for by altering the valve motion, creating a manual, pre-defined absorption system. Due to the geometry and generation method employed by the TS, a significant amount of “self-correction” occurred during wave generation. Both “absorption” methods worked best for long period waves due to the inherent response time of the TS. The combination of these methods allowed the generation of waves significantly longer than the experimental facility, discussed at some length by McGovern et al (2018).
The presence of a 22 s period resonance within the wave flume can be seen on the longer wave periods (Figure 6). The amplitude of this resonance was 2 mm and did not influence the generated wave or the tests conducted. There was however, still a desire to remove this resonance from the long waves generated. This led to an exploratory study of active absorption on the third generation TS described in Third Generation of Pneumatic Tsunami Simulator.
There is further discussion on the validity of the waves generated by the second generation TS in McGovern et al. (2018), focusing particularly on the generation of waves that are much longer that the wave flume. The 240 s N-wave has a calculated wave length of ≈750 m, more than 10 times the distance between the TS and the bathymetry.
Discussion on Tsunami Wave Calibration Tests
The key finding that came from the calibration process was the importance of the choice of calibration point when dealing with such long waves. When using a single point to define a single wave, the position of that point relative to any reflective surfaces, such as the 1:20 slope or any tested seawall, becomes important and can significantly influence the apparent wave form and amplitude (Chandler et al., 2016). This finding is also important when looking at tsunami wave forms measured in prototype, such as the Mercator trace, as this may not itself be a “clean” signal of the incident tsunami wave alone as it has probably been influenced by reflections from the coastline, especially the later part of the signal.
Third Generation of Pneumatic Tsunami Simulator
Introduction
The third generation of pneumatic Tsunami Simulator took advantage of the availability of HR Wallingford’s new Fast Flow Facility (FFF) (Whitehouse et al., 2014). The FFF was much wider (4 m) than the flumes for generations 1 and 2. This created an opportunity to investigate three-dimensional effects onshore, but the wider tank required much greater air flow rates for operation than for the second generation TS. The generally good experience in running the two (dissimilar) pumps for the second generation device suggested that it would be simple to again mount two vacuum pumps in parallel, hence an additional RT-95330 was purchased to increase the peak flow rate. Experience of the second generation device was used to improve the control and generation of the tsunami length waves. This stage of development was funded by the ERC URBANWAVES project.
Despite using a rather different facility, design of the third generation TS was built on the developments of the previous two generations. The design of the third generation TS tank followed a similar strategy to the second generation, with multiple small bolted sections, rather than the larger panels with welded bracing used in the first generation. The tank design again obeyed Eurocode 3 (BS EN, 1993), and used lessons from the second generation to increase panel stiffness by greater reverse folding at the edges, and by reducing the number of bolts required by changing panel cross sections.
Design and Construction
The third generation TS tank was 3.96 m wide, 4.0 m tall and 4.45 m long. It was positioned on a 1:10 approach slope within the Fast Flow Facility, just in front of the existing wave maker (bottom hinge type, Figure 8). A tapered base panel created a horizontal platform from which the rest of the TS was constructed. The OpenFOAM CFD model was used to assess the impact of placing the TS on the approach slope and whether a horizontal false floor was needed inside the TS. The CFD model showed that there was no discernible difference between waves generated with a sloping floor in the TS and a horizontal floor. The third generation TS used two ZepherUK RT-95330 vacuum pumps and a 7 inch (0.178 m) internal diameter 45° butterfly valve, operated by the same Beckhoff AS1050 stepper motor used in the second generation TS (Design and Construction). The third generation TS was instrumented with a 3.5 m Temposonics magnetostrictive float gauge inside the tank, a negative (vacuum) pressure transducer in the top of the tank measuring air pressure (0 to −500 mbar), and a pressure transducer (0–0.5 bar) 0.65 m mounted at the flume floor in the center of the back panel of the TS.
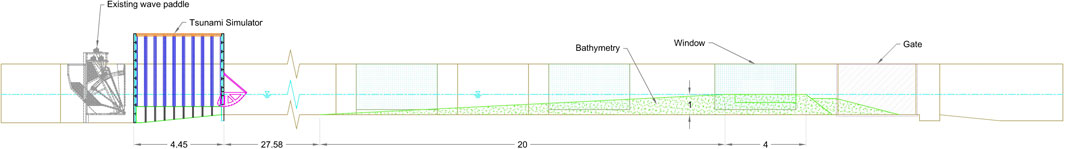
FIGURE 8. Setup of the third generation TS for URBANWAVES phase 2 testing, from left to right: flume bottom hinge wave paddle (gray), third generation TS (blue with flow shaper in magenta), bathymetry (green), flume windows (blue) and flume gate (gray hatch).
The bathymetry installed in the FFF consisted of a 1:20 slope, starting 27.6 m from the front of the TS (Figure 8). The slope rose to a height of 1.0 m above the flume floor, after which a 4.0 m horizontal area allowed building arrays, coastal defenses (at the seaward edge) and other structures to be placed and tested. The central 3.0 m section of the horizontal area could be removed to allow a mobile bed to be placed for scour experiments. Over-wash from the wave generation flowed over the back of the bathymetry and into the secondary (back) part of the “race-track” flume. Only for the largest waves does enough volume of water enter this secondary loop to create back-wash over the horizontal section back into the main part of the flume. Twin wire resistance wave gauges were placed along the flume in the constant depth region and on the 1:20 bathymetry slope.
The control system for the third generation TS was also upgraded from the second generation. The main advance was the implementation of closed-loop control using a proportional-integral-derivative (PID) feedback loop, instead of the open-loop control of the second generation TS. This is similar to the work by Goseberg et al. (2013) for their pumped Tsunami Simulator who used a “real” PID control system to control their water pumps, based on pressures measured in the flume. Goseberg et al. (2013) found that the pressure sensor needed to be placed close to the pumps, otherwise a long delay time was introduced into the system which caused unstable oscillatory behavior. They also found that the p, I and D variables needed to be tuned for each wave generated using trial-and-error. A moving average filter was applied to the pressure signal to reduce the influence of residual oscillations.
Experience with the second generation TS (Chandler et al., 2016) suggested that pressures from the transducer at the base of the TS would be a good parameter on which to base the PID feedback. This tank pressure showed a good correlation with both the free-surface elevation (FSE) in the flume and with the valve motion (Figure 9). Initial thoughts were to use either the TWL or one of the wave gauges in the flume. There is no strong correlation between the TWL and the FSE in the flume, so this was not a good parameter to use. A wave gauge in the flume would be ideal because it is directly measuring the parameter that we want to control (FSE), however, there is a time delay in the signal measured by any of the wave gauges and TS. This would lead to the problems described by Goseberg et al. (2013) when moving their pressure transducer away from the water pumps.
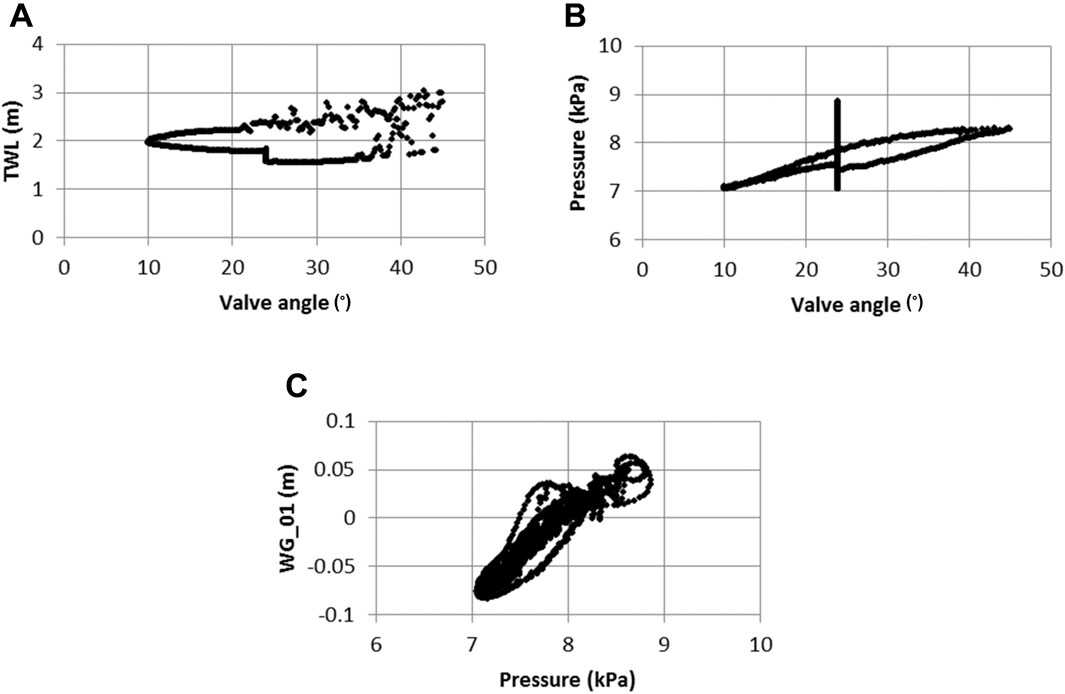
FIGURE 9. Comparison of time co-incident values for (A) valve angle and tank water level, (B) valve angle and pressure at the base of the TS and (C) pressure at the base of the TS and free-surface elevation at WG_01 (0.25 m from TS) for second generation TS.
During the commissioning phase of the third generation TS, a set of PID values was established that allowed the system to respond quickly enough to generate the desired wave form, but not to become unstable. System responses were different when the air valve closes or opens, so different PID values were prescribed depending on the valve motion.
Testing
Wave calibrations occurred in three stages:
• The first stage used the closed-loop PID control to generate the full suite of waves, with no trial-and-error to match the desired FSE. This matched the set-up used in the calibration of the second Generation TS.
• The second stage repeated this process, but without a seawall at the top of the 1:20 slope, so with lower reflections,
• The third phase of the calibration procedure required manual modification of each PID derived valve time series, where necessary, to achieve the desired free-surface elevation within the flume.
During the first stage, the closed PID control system converted the desired FSE into a pressure time series desired at the TS, which was then supplied to the control software. The PID system then determined the valve motion required to match the desired pressure. The results from this first phase of calibration were mixed. Excellent agreement was achieved between target and desired pressure time series, but this did not always result in the desired free-surface elevation at the calibration gauge. The differences were due in part to the distance between the calibration gauge and the TS, and due to the inability of the feedback system to determine the direction of the wave and consequent inability to distinguish when a reflected component is traveling back against the generated wave. This resulted in truncated crests at the calibration gauge, but apparently ‘correct’ pressure signal at the TS due to reflected earlier parts of the crest.
The removal of the seawall for the second stage of calibration did not significantly change the findings from the first phase, suggesting that most of the reflection originates from the 1:20 slope. In the first phase of calibration the seawall was reached by all waves and overtopped by the majority. A comparison of various TS instruments and flume wave gauges for the three phases of the calibration exercise are shown for the N200 wave in Figure 10, where the effectiveness of the PID system at following the desired pressure signal is clearly observable. The free-surface elevation at the toe of the slope is significantly different, particularly the trough and the rise up to the crest (Figure 10E) with the PID control compared to the target and the final calibrated time series.
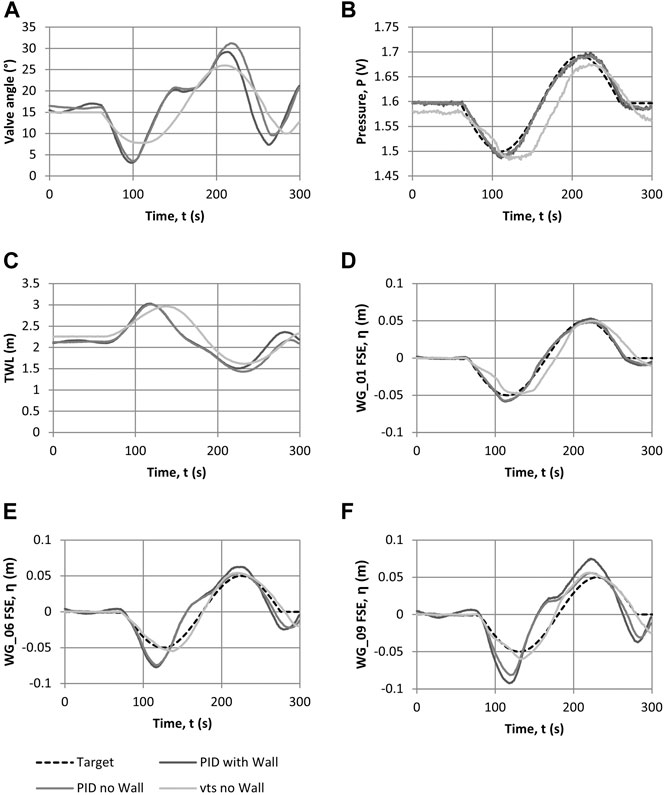
FIGURE 10. Comparison of the three calibration runs (PID control with seawall, PID control without seawall and open-loop (valve time series, vts) control) of N200 wave for (A) valve angle, (B) pressure at base of TS, (C) tank water level (TWL), (D) free-surface elevation (FSE) for WG_01 (0.25 m from TS, h = 1.0 m), e) FSE for WG_06 (toe of the bathymetry, 27.47 m from TS, h = 1.0 m) and f) FSE for WG_09 (closest to shore, 42.47 m from TS, h = 0.25 m).
The third stage enabled a better determination of the valve time series, and a much greater understanding of the system response based on the PID wave generation results. The open-loop control results are also shown in Figure 10. The difference in valve motion and in free-surface elevation is clear between open and closed-loop control. Open-loop control was used during the third Generation TS testing because it gave greater confidence in what was being generated by the TS and propagating down the flume. This method is similar to that used by Bremm et al (2015).
The family of waves calibrated is presented in Table 2 and Figure 11 for elevated waves and N-waves. The Mercator time series from the Indian Ocean Boxing Day Tsunami in 2004 was also recreated at 1:50 scale (Figure 12A) as was one of the traces from the Tohoku tsunami in 2011 (Figure 12B). As with the elevated and N-type waves, these real tsunami time series were initially generated using the closed-loop system and then refined using open-loop control.
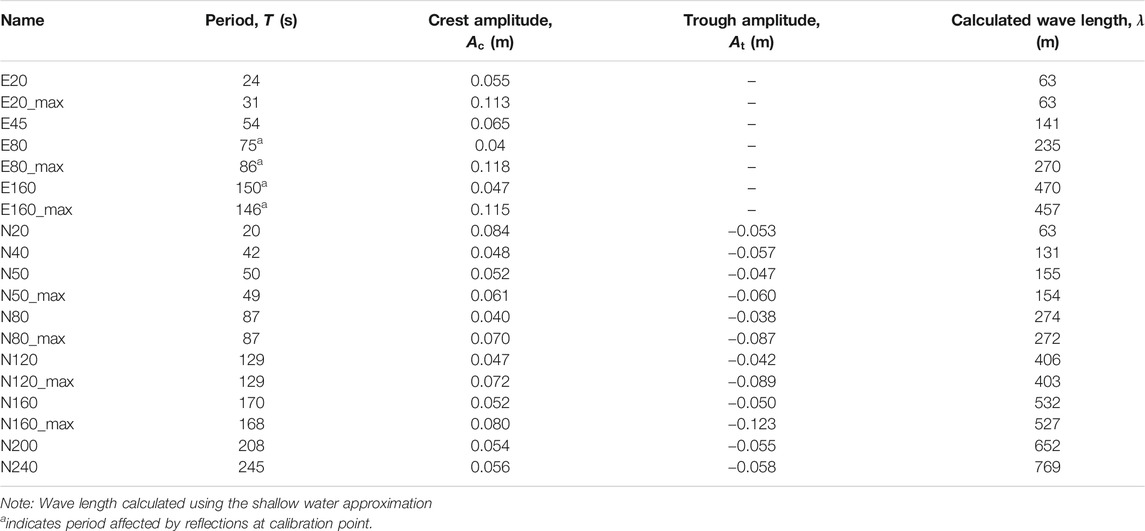
TABLE 2. Calibrated crest only (elevated) waves and N-waves using third generation TS.
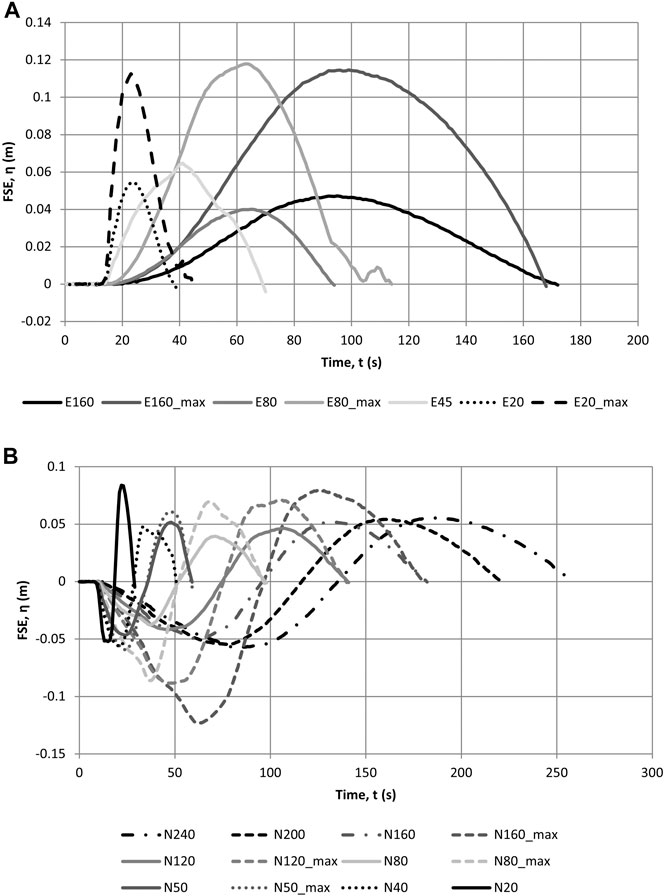
FIGURE 11. Calibrated crest only (elevated) waves (A) and N-waves (B) using third generation TS, measured at the toe of the bathymetry.
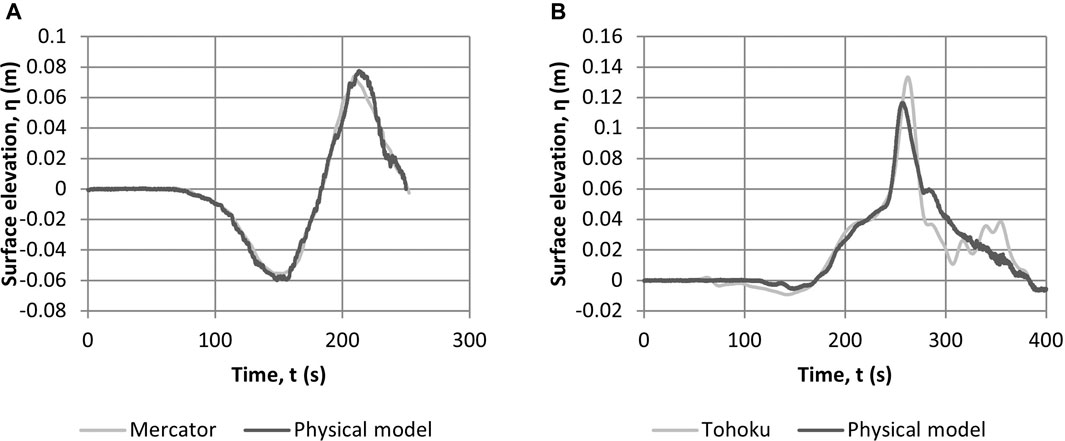
FIGURE 12. Calibrated Mercator (A) and Tohoku (B) tsunami time series at 1:50 scale using third Generation TS.
Discussion
The most striking difference between the second and third generation TS is the different system response, both in terms of the TS directly and with the flume in which it sits. The valve angle, TWL and free-surface elevation at the calibration point for and N240 waves generated with both the second and third generation TS are shown in Figure 13. The wave form generated by both TS’s closely resembles the target (with a slightly lower amplitude for the smaller third generation TS). The corresponding TWL profiles are very similar between the two generations (Figure 13B), but the valve motion used to create this TWL change is very different (Figure 13A). This is due to the different valve and pump characteristics of the second and third generation TS and the effect of the different flume lengths.
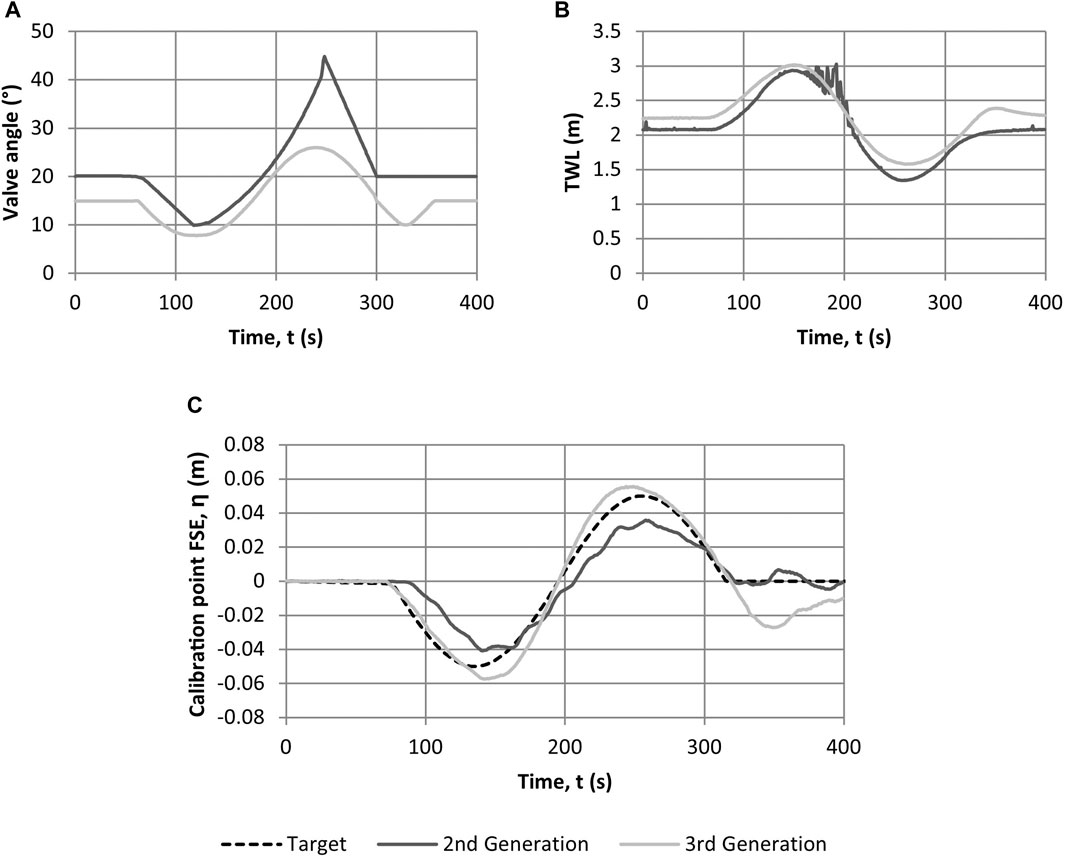
FIGURE 13. Comparison of (A) valve angle, (B) tank water level (TWL) and (C) free-surface elevation at the calibration point for second and third generation TS (N240 wave), target (desired) profile indicated with dashed line.
The combination of the length and height of each of the tanks (their cross-sectional area) is where the difference in wave amplitude seen in Figure 13C originates. A larger cross-sectional area allows greater wave amplitudes to be generated for a given period, i.e., more capacity to draw in water for the trough and more water to put into a crest. The width of the TS has much less bearing on the waves generated as the waves span the width of the flume, as does the TS, and only comes into consideration when selecting a vacuum pump (or pumps) to move the required volume of air in the required time. As long as the pumps are sufficiently capable, only the cross-sectional area of the TS and the flume length govern the size of the waves.
The flume length influences the generated waves through the travel time of the wave and therefore the interaction of any reflections that may occur with the later parts of the wave. For a very short flume, the reflections will return to the TS almost immediately and would then re-reflect (if not accounted for) from the TS. These re-reflections can be incorporated into the wave generation to enhance the amplitude of the wave. In a very long flume, reflections would not return to the TS before the wave had finished being generated, so would not be able to be incorporated in the generation to enhance the wave amplitude. Further discussion on the influence of reflections on wave generation is given in McGovern et al (2018).
As discussed in Testing, the PID control system in the third generation TS, using a single pressure measurement within the TS could not determine the direction of reflections and therefore struggled to account for them correctly when looking at the wave measured at the calibration point much further up the flume. This required manual adjustment of the valve time series and the running of the system during testing in open-loop control mode, but using the PID derived valve time series as a starting point.
Conclusion
This paper has described the development and evolution of the HR Wallingford pneumatic Tsunami Simulator (TS), which is based on a pneumatic system. A unique advantage of the method is that waves of very long wavelength can be generated, due to its ability to displace very large volumes of water in a controlled manner. The paper describes how, through an ERC grant (URBANWAVES, grant no. 336084), two EPSRC grants (EPICentre and CRUST, grant nos. EP/F012179/1 and EP/M001067/1) and internally funded research by HR Wallingford, three generations of TS have been designed, built, tested and improved within a 10 years time span. The three generations of TS reflect the increased understanding of the technology, with the development of numerical modeling to accompany the design of the TS, the flow shapers at the TS outlets, detailed studies conducted on the effects of location in the flume for calibration, and a control software for the improved damping of reflections. It is noted that the three TS developed over this period, have been upgraded to have the same control software as was developed for the third generation.
The TS has moved from a prototype to a mature technology, with proven capacity for reproducing free surface profiles of recorded tsunami field data. It can be applied directly to new and innovative research and practical design studies. In particular, the TS has unique capabilities in terms of its generation of stable trough-led waves and tsunami-like wavelengths for scales of 1:50. The latter makes the facility particularly useful for understanding tsunami inundation interaction with coastal infrastructure and especially scour phenomena, where the duration of the inundation flow plays a critical role.
Data Availability Statement
The raw data supporting the conclusion of this article will be made available by the authors, without undue reservation.
Author Contributions
WA and TR contributed to the original concepts behind tsunami simulator. TR was principal investigator on the research grants funding the tsunami simulator development over 10 years. WA led the development of the tsunami simulators. IC and DIR conducted numerical modeling and physical testing to prove the capabilities of the tsunami simulators, and contributed to optimization of the design. WA and TR contributed to physical testing of simulator, and managed the development team from HR Wallingford and research team from University College London, respectively. IC and WA took leadership in drafting the paper, which was contributed to and reviewed by DIR and TR.
Funding
The authors acknowledge European Research Council (ERC) funding for the URBANWAVES project (Grant No. 336084) and the Engineering and Physics Research Council (EPSRC) funding for the EPICentre and CRUST grants, nos. EP/F012179/1 and EP/M001067/1, respectively.
Conflict of Interest
IC was employed by the company HR Wallingford. DR was employed by the company HR Wallingford and by academic institution University College London. Professor WA is employed by WA Consulting Ltd, and donated his time to writing this paper pro bono.
The remaining author declares that the research was conducted in the absence of any commercial or financial relationships that could be construed as a potential conflict of interest.
Acknowledgments
The authors acknowledge European Research Council (ERC) funding for the URBANWAVES project (Grant No. 336084) and the Engineering and Physics Research Council (EPSRC) funding for the EPICentre project (Grant No. EP/F012179/1) and CRUST project (Grant No. EP/M001067/1). We acknowledge the support of numerous staff at HR Wallingford, particularly Dr. S Richardson, Mr O Harris and Mr I Payne: visiting researchers, particularly Pierre-Henri Bazin, Alice Barthel, Mario Zaccaria, Ignacio Barranco-Granged, and Roberta Riva; and students and staff of UCL especially Prof. Ian Eames, Dr. T Robinson, Dr. D McGovern, Dr. C. Klettner, Dr. A Foster, Dr. C Petrone, Dr. Ingrid Charvet and Dr. Tristan Lloyd.
References
Al-Faesly, T., Palermo, D., Nistor, I., and Cornett, A. (2012). Experimental Modelling of Extreme Hydrodynamic Forces on Structural Models. Int. Jo. Protective Structures 3 (4), 477. doi:10.1260/2041-4196.3.4.477
Allsop, W., Chandler, I., and Zaccaria, M. (2014). “Improvements in the Physical Modelling of Tsunami and Their Effects,” in Proc. 5th Int. Conf. on Application of Physical Modelling to Port and Coastal Protection (Varna: Coastlab14).
Allsop, W. (2014). Improving the Generation of Tsunami Waves in Physical Modelling. Report DDS0336-RT001 (Wallingford: HR Wallingford for HYDRALAB IV).
Allsop, W., Robinson, D., Charvet, I., Rossetto, T., and Abernethy, R. (2008). A Unique Tsunami Generator for Physical Modelling of Violent Flows and Their Impact. Beijing: Proc. 14th World Conf. on Earthquake Engineering.
Bremm, G., Goseberg, N., Schlurmann, T., and Nistor, I. (2015). Long Wave Flow Interaction with a Single Square Structure on a Sloping beach. J. Mar. Sci. Eng. 3, 821–844. doi:10.3390/jmse3030821
Chandler, I., Allsop, W., Barranco Granged, I., and McGovern, D. J. (2016). “Understanding Wave Generation in Pneumatic Tsunami Simulators,” in Proc. 6th Int. Conf. on Application of Physical Modelling to Port and Coastal Protection (Ottawa: Coastlab16).
Charvet, I. (2011). “Experimental Modelling of Long Elevated and Depressed Waves Using a New Pneumatic Wave Generator,” (London: University College London). PhD thesis.
Charvet, I., Eames, I., and Rossetto, T. (2013). New Tsunami Runup Relationships Based on Long Wave Experiments. Ocean Model. 69, 79–92. doi:10.1016/j.ocemod.2013.05.009
Di Risio, M., De Girolamo, P., Bellotti, G., Panizzo, A., Aristodemo, F., Molfetta, M. G., et al. (2009). Landslide-generated Tsunami Runup at the Coast of a Conical Island: New Physical Model Experiments. J. Geophys. Res. Oceans 114, 1. doi:10.1029/2008JC004858
Directive (97/23/EC). Directive 97/23/EC of the European Parliament and of the Council of 29 May 1997 on the Approximation of the Laws of the Member States Concerning Pressure Equipment. Official J. L 181, 1. Available at: https://eur-lex.europa.eu/eli/dir/1997/23/oj
Drähne, U., Goseberg, N., Vater, S., Beisiegel, N., and Behrens, J. (2016). An Experimental and Numerical Study of Long Wave Run-Up on a Plane beach. Jo. Mar. Sci. Eng. 4, 1. doi:10.1029/2008jc004858
Enet, F., and Grilli, S. T. (2007). Experimental Study of Tsunami Generation by Three-Dimensional Rigid Underwater Landslides. J. Waterway, Port, Coastal, Ocean Eng. 133, 442–454. doi:10.1061/(asce)0733-950x(2007)133:6(442)
Fritz, H. M., Hager, W. H., and Minor, H-E. (2001). Lituya Bay Case: Rockslide Impact and Wave Run-Up. Int. Jo. Tsunami Soc. 19 (1), 3–22.
Goseberg, N., Wurpts, A., and Schlurmann, T. (2013). Laboratory-scale Generation of Tsunami and Long Waves. Coastal Eng. 79, 57–74. doi:10.1016/j.coastaleng.2013.04.006
Hammack, J. L. (1972). Tsunami: A Model of Their Generation and Propagation. Pasadena: London: W.M .Keck Lab. Hydraul. and Water Res., Calif. Inst. Tech. Rep. KH-R-28.
Hammack, J. L. (1973). A Note on Tsunamis: Their Generation and Propagation in an Ocean of Uniform Depth. J. Fluid Mech. 60 (4), 769–799. doi:10.1017/s0022112073000479
Hiraishi, T., Mori, N., Yyasuda, T., Azuma, R., Mase, H., Prasteyo, A., et al. (2015). Characteristics of Tsunami Generator Newly Implemented with Three Generation Modes. J. Jpn. Soc. Civil Eng. Ser. B2 (Coastal Engineering) 71 (2), I_349.
HRS (1974). Maplin Investigation – Report on the Outer Thames Physical Model Studies. Report EX 657 (Wallingford: Hydraulics Research Station).
Kihara, N., Niida, Y., Takabatake, D., Kaida, H., Shibayama, A., and Miyagawa, Y. (2015). Large-scale Experiments on Tsunami-Induced Pressure on a Vertical Tide wall. Coastal Eng. 99, 46–63. doi:10.1016/j.coastaleng.2015.02.009
Lloyd, T. (2016). “An Experimental Investigation of Tsunami Forces on Coastal Structures,” (London: University College London). PhD thesis.
Lu, H., Park, Y. S., and Cho, Y-S. (2017a). Investigation of Long Waves Generated by Bottom-Tilting Wave Maker. Coastal Eng. J. 59 (4), 1750018-1–1750018-23. doi:10.1142/s0578563417500188
Lu, H., Park, Y. S., and Cho, Y.-S. (2017b). Modelling of Long Waves Generated by Bottom-Tilting Wave Maker. Coastal Eng. 122, 1–9. doi:10.1016/j.coastaleng.2017.01.007
McFall, B. C., and Fritz, H. M. (2016). Physical Modelling of Tsunamis Generated by Three-Dimensional Deformable Granular Landslides on Planar and Conical Island Slopes. Proc. R. Soc. A. 472, 20160052. doi:10.1098/rspa.2016.0052
McGovern, D. J., Chandler, I., and Rossetto, T. (2016). “Experimental Study of the Runup of Tsunami Waves on a Smooth Sloping beach,” in Proc. 6th Int. Conf. on Application of Physical Modelling to Port and Coastal Protection (Ottawa: Coastlab16).
McGovern, D. J., Robinson, T., Chandler, I. D., Allsop, W., and Rossetto, T. (2018). Pneumatic Long-Wave Generation of Tsunami-Length Waveforms and Their Runup. Coastal Eng. 138, 80–97. doi:10.1016/j.coastaleng.2018.04.006
Nouri, Y., Nistor, I., Palermo, D., and Cornett, A. (2010). Experimental Investigation of Tsunami Impact on Free Standing Structures. Coastal Eng. J. 52 (1), 43–70. doi:10.1142/s0578563410002117
Palmer, R. Q., and Funasaki, G. T. (1967). The Hilo Harbor Tsunami Model. Coastal Eng. 1966, 1227–1248.
Robinson, D. (2009). “Development of the HRW Tsunami Generator: Conceptual Design and Preparatory Modelling Studies,” Report IT585 (Wallingford: HR Wallingford).
Rossetto, T., Allsop, W., Charvet, I., and Robinson, D. I. (2011). Physical Modelling of Tsunami Using a New Pneumatic Wave Generator. Coastal Eng. 58 (6), 517–527. doi:10.1016/j.coastaleng.2011.01.012
Schimmels, S., Sriram, V., and Didenkulova, I. (2016). Tsunami Generation in a Large Scale Experimental Facility. Coastal Eng. 110, pp32–41. doi:10.1016/j.coastaleng.2015.12.005
Shimosako, K., Takahashi, S., Suzuki, K., and Kang, Y. K. (2002). Large Hydro-Geo Flume and its Use for Coastal Engineering Research. Tech. Note Natl. Inst. Land Infrastructure Manage 41, 81–89.
Shuto, N. (1985). The Nihonkai-Chubu Earthquake Tsunami on the North Akita Coast. Coastal Eng. Jpn. 28, 255–264. doi:10.1080/05785634.1985.11924420
Sriram, V., Didenkulova, I., Sergeeva, A., and Schimmels, S. (2019). Tsunami Evolution and Run-Up in a Large Scale Experimental Facility. Coastal Eng. 111, 1–12. doi:10.1016/j.coastaleng.2015.11.006
Thusyanthan, N. I., and Madabhushi, S. P. G. (2008). Tsunami Loading on Coastal Houses: a Model Approach. Proc. ICE 161, 77–86. doi:10.1680/cien.2008.161.2.77
Togashi, H. (1986). Wave Force of Tsunami Bore on a Vertical Wall. Nagasaki: Reports of the Faculty of Engineering, Nagasaki University, 16–26.
Tomiczek, T., Prasetyo, A., Mori, N., Yasuda, T., and Kennedy, A. (2016b). “Experimental Modelling of Macro-Roughness Effects on Tsunami-Induced Pressure in Idealized Urban Environments,” in Proc. 6th Int. Conf. Physical Modelling in Coastal and Port Eng (Ottawa: Coastlab16).
Tomiczek, T., Prasetyo, A., Mori, N., Yasuda, T., and Kennedy, A. (2016a). Physical Modelling of Tsunami Onshore Propagation, Peak Pressures, and Shielding Effects in an Urban Building Array. Coastal Eng. 117, 97–112. doi:10.1016/j.coastaleng.2016.07.003
Weller, H. G., Tabor, G., Jasak, H., and Fureby, C. (1998). A Tensorial Approach to Computational Continuum Mechanics Using Object-Oriented Techniques. Comput. Phys. 12 (6), 620. doi:10.1063/1.168744
Whitehouse, R., SutherlandPowell, J. K., and Harris, J. (2014). “Fast Flow Facility for Sediment and Morphology Testing,” in Proc. 5th Int. Coast. Editors V. Penchev, and F. T. Pinto (Bulgaria: Lab Conf. Varna), 104–113.2.
Wiegel, R. L. (1955). Laboratory Studies of Gravity Waves Generated by the Movement of a Submerged Body. Trans. AGU 36 (5), 759–774. doi:10.1029/TR036i005p00759
Wilkie, M. J., and Young, G. A. J. (1952). Pneumatic Tide Generator, 25, 133–137. London: The Engineer.
Wüthrich, D., Pfister, M., Nistor, I., and Schleiss, A. J. (2018). Experimental Study of Tsunami-like Waves Generated with a Vertical Release Technique on Dry and Wet Beds. Proc. Asce, Jo. Waterway, Port, Coastal, Ocean Eng. 144, 4. doi:10.1061/(asce)ww.1943-5460.0000447
Yim, S., Yeh, H., Cox, D., and Pancake, C. (2004). “A Shared-Used Large-Scale Multidirectional Wave basin for Tsunami Research, Paper 1517,” in Proc. 13th World Conf. on Earthquake Eng (Vancouver: International Association for Earthquake Engineering (IAEE)). doi:10.1061/40733(147)75
Zepher (2016). Product Brochure. Available at: http://zepher-uk.com/side_channel/side_channel.html (Accessed March 15, 2016).
Keywords: tsunami, physical modeling, wavemaker, tsunami simulator, N-waves
Citation: Chandler I, Allsop W, Robinson D and Rossetto T (2021) Evolution of Pneumatic Tsunami Simulators–From Concept to Proven Experimental Technique. Front. Built Environ. 7:674659. doi: 10.3389/fbuil.2021.674659
Received: 29 March 2021; Accepted: 18 May 2021;
Published: 11 June 2021.
Edited by:
Spyros Hirdaris, Aalto University, FinlandReviewed by:
Ahmet Cevdet Yalciner, Middle East Technical University, TurkeyVanessa Katsardi, University of Thessaly, Greece
Copyright © 2021 Chandler, Allsop, Robinson and Rossetto. This is an open-access article distributed under the terms of the Creative Commons Attribution License (CC BY). The use, distribution or reproduction in other forums is permitted, provided the original author(s) and the copyright owner(s) are credited and that the original publication in this journal is cited, in accordance with accepted academic practice. No use, distribution or reproduction is permitted which does not comply with these terms.
*Correspondence: Tiziana Rossetto, t.rossetto@ucl.ac.uk