 Resat A. Oyguc
- Earthquake Engineering Department, Institute of Disaster Management, Istanbul Technical University, Istanbul, Turkey
Assessing the structural capacity of an irregular structure requires an appropriate and robust representation of the analytical model. Conventional procedures are flawed because they lack the reversal effects of higher modes. Therefore, more robust procedures have been tested to accurately capture the capacity of irregular building-type structures. Some of these may be classified as adaptive pushover techniques in which the lateral load vector is revised instantaneously. These adaptive techniques generally refer to SRSS as a modal combination rule to superpose the maximum values of the modal quantities. However, this results in an overestimated capacity value. Furthermore, the reversal effects of the modes are not included in the evaluation process. Hence, in this research, a force-based adaptive multimode pushover method was tested on a plan-irregular building using a code developed and implemented into ZEUS-NL. First, an eigenvalue analysis was used to obtain the modal quantities of the considered building, and subsequently, the modal story shear forces were obtained using the modal story forces. Furthermore, the lateral load patterns were calculated at each iterative step. Finally, the structure was pushed using this calculated lateral load pattern up to a previously calculated target displacement value using a three-step adaptive pushover analysis. The first step is to run an adaptive single-mode pushover analysis considering the first mode. After comparing the fundamental period with a constant threshold limit, it is then decided whether to run an adaptive multimode pushover analysis considering the first two modes or to run two adaptive multimode pushover analyses considering the contribution of both the second and third modes. Neither SRSS nor CQC was used to obtain the maximum response quantities; instead, the use of the envelope response is suggested. After evaluating the capacity diagram of the considered building, the story drifts were determined. The outcomes of the adaptive pushover analyses were later checked with the nonlinear dynamic results. It can be concluded that the result of the tested procedure is in good correlation with the dynamic results. Furthermore, the top displacement–time traces were plotted to check which ground motion record reveals the maximum values. Using the ground motion record, interstory drift ratio–time graphs were developed for each story level and compared with the code limit. Base shear–time history traces were then obtained and compared with the tested FAP. Lastly, story shear–interstory drift relations were plotted to investigate the absorbed energy level as an indicator of damage. As a result, for irregular RC structures, the tested procedure was found to be more accurate. However, in its current form, the procedure reflects the seismic behavior of irregular midrise buildings.
1 Introduction
Performance-based design (PBD) methodologies rely on proper representation of the inelastic seismic response of the considered structure and aim to determine the structural capacity via non-linear static analyses. Although these types of analyses lack consideration of the sign changes and the reversal effects of the higher modes, they are widely used because they require less computational time and engineering effort. This may also be the reason for these techniques being implemented in assessment guidelines worldwide.
In the last two decades, assessing the performance of a structure using non-linear static procedures (NSPs) has become very popular. These procedures rely on the fact that the considered multi-degree-of-freedom (MDOF) system may be transformed into an equivalent single-degree-of-freedom (SDOF) system. In these methodologies, the capacity values of the SDOF system are calculated first, and later, by means of transformation coefficients, the capacity value of the real MDOF system is estimated. Outcomes are generally evaluated in terms of the maximum deformations. The main parameter for obtaining an accurate NSP result is to estimate a robust lateral load distribution vector. Depending on the type of lateral force distribution, conventional and adaptive pushover techniques have been reported in the literature, where the force pattern is maintained constantly and simultaneously updated, respectively. Furthermore, conventional methods are suitable for regular structures where the fundamental mode is the first mode. In contrast, adaptive techniques are preferred for capturing the higher mode effects of irregular structures and estimating their capacities. Numerous pushover methods have been reported in the literature, including N2, extended N2, modal, multimodal, and force- and displacement-based adaptive techniques.
Conventional pushover methods were mainly developed by Freeman et al. (1978), who later implemented a graphical technique in their original proposal to enhance the sensitivity of their method, known as the capacity spectrum method (CSM), wherein the structure is pushed up to a previously determined target displacement value, and the capacity curve is obtained. Subsequently, the derived capacity curve is transformed into a capacity spectrum by means of participation factors to graphically intersect the reduced demand spectrum. The point where the capacity spectrum intersects the demand spectrum is called the performance point of the considered building; hence, it is much easier to determine the structural capacity using this modified procedure.
Krawinkler and Seneviratna (1998) stated that despite their deficiencies, conventional pushover procedures shed light on different response parameters that could not be predicted by dynamic analyses. However, in a recent study by Ruggieri and Uva (2020), it was stated that the conventional procedures neglect the variation of the structural dynamic properties (periods, fundamental modes, shape, etc.). Spectral shape, duration, etc. can also not be predicted by means of conventional procedures (Ruggieri et al., 2022). In addition, conventional pushover procedures are flawed when plan- or height-wise irregularities arise in the structure, owing to the lack of consideration of torsional effects, which makes it significantly more complex to determine the structural response. Moreover, it was highlighted that conventional procedures may underestimate the deformation response on the stiff side of a torsionally flexible structure. Furthermore, on condition of irregularities, where higher mode effects along the elevation arise, the procedure should be applied with some modifications according to Eurocode (EC8) (Eurocode 8, 2004).
To overcome these drawbacks, more studies were managed to enhance the applicability of conventional methodologies. Paret et al. (1996) and Sasaki et al. (1998) proposed a multimode pushover (MMP) technique in which numerous pushover analyses are performed by considering different lateral load patterns; additionally, this technique considers the reversals of the modes. Notably, the results of individual pushover analyses need to be combined precisely, failing at which may result in an overestimation of the capacity of the considered system and mislead the engineer. Moghadam and Tso (2002) proposed the pushover results combination (PRC) procedure, where results of several modal pushover analyses were used to calculate the maximum values of the seismic response.
Following this, modal pushover analysis (MPA) was proposed by Chopra and Goel (2002), whose core idea is not significantly different from that of Paret et al. (1996). In this method, the MDOF system is first converted into an equivalent SDOF, and then the capacity spectrum curve is represented bilinearly. Moreover, the individual modal responses are superposed using the square-root-of-the-sum-of-squares (SRSS) to obtain the overall response of the structure. Although the MPA procedure is easy to apply, it was later observed that it does not consider the reversal effects and interactions of the modes. Therefore, Chopra et al. (2004) modified and extended their proposal to include the inelastic response of modal pushover analyses with the elastic response of higher modes. Later, Reinhorn (1997) proposed a spectral-based approach that enabled the evaluation of the inelastic response of SDOF and MDOF systems using an inelastic response spectrum. In this approach, the maximum displacement is evaluated as a function of the considered inelastic response.
Because the aforementioned efforts were not sufficient to enhance the precision and accuracy of the conventional pushover techniques, researchers continue to develop more sophisticated methodologies. Especially for structures in which the fundamental mode is torsional, researchers have proposed new techniques to incorporate the torsional components into the analyses. Kosmopoulos and Fardis (2008), Barros and Almeida (2005), Fajfar et al. (2005), Adhikari and Pinho (2010), Stefano and Pintucchi (2008), Perus and Fajfar (2005), Fajfar (2000), Kappos and Penelis (2000), and Jeong and Elnashai (2004) investigated the torsional response in pushover analyses. Furthermore, in a study by Jan et al. (2004), an upper-bound contribution ratio was proposed, and it was concluded that considering the first two modes will give robust results in terms of the higher modes. Furthermore, in a mass-proportional procedure, the effects of the higher modes were defined in terms of the seismic masses of each story (Kim and Kurama, 2008). Poursha et al. (2011) proposed a consecutive modal pushover (CMP) procedure for use in the capacity assessment of tall buildings. Panyakapo (2014) studied a cyclic pushover method, where the lateral load pattern is purely obtained from the modal response of the considered structure. More efforts to consider the higher mode effects were also carried out in studies by Behnamfar et al. (2016), Poursha and Amini (2015), Poursha and Amini (2016), and Vafaee and Saffari (2017). More details on these techniques can be obtained from the respective publications.
Adaptive methodologies accounting for the variation in modal properties are considered promising alternatives. A fully story force-based adaptive procedure (FAP) was first proposed by Bracci et al. (1997). Accordingly, the lateral load vector was instantaneously adapted using the inelastic story forces introduced in the previous step. Satyarno et al. (1998) developed a single-mode FAP, which cannot capture the higher mode effects. Requena and Ayala (2000) proposed an adaptive procedure in which the effects of higher modes may be considered in the analyses. Another story FAP procedure proposed by Gupta and Kunnath (2000) uses a response spectrum to obtain the applied lateral load pattern, which is updated at each iterative step. Both the former and latter procedures require eigenvalue analysis as the first step. The results of the eigenvalue analysis are later used to derive the story forces at each level for each individual mode. Subsequently, the modal base shear values are combined and superposed using SRSS.
Jeong and Elnashai (2004) introduced a FAP procedure where the lateral load pattern was simultaneously updated according to the instantaneous tangent stiffness matrix. An energy-based adaptive pushover procedure was later proposed by Albanesi et al. (2002), where the kinetic energy properties are evaluated at each step. A single-run FAP procedure was proposed by Antoniou and Pinho (2004a), where plasticity was assumed to be distributed throughout the cross-section. The procedure can consider both the degradations on the stiffness and higher mode responses. Furthermore, the lateral load vector was revised based on the momentaneous mode shapes. Modal combination rules were then applied to consider the effects of individual modes. Because the use of the quadratic modal combination rule dampens the effect of sign reversal in the higher modes, seismic demands were not accurately predicted.
When the pros and cons of the aforementioned FAP procedures are considered, it is concluded that FAP procedures are not much superior to conventional pushover procedures. To enhance the accuracy of the adaptive analysis, Antoniou and Pinho (2002b) developed the displacement-based adaptive pushover (DAP) analysis, in which the structure is subjected to displacement traces. Kalkan and Kunnath (2006) proposed a new multimode technique using an adaptive modal combination (AMC) procedure. In a recent study by Jalilkhani et al. (2020), a multimode adaptive displacement-based pushover procedure was introduced to the literature. Furthermore, studies by Shakeri et al. (2010) and Amini and Poursha (2018) should also be highlighted among the others. Many adaptive and non-adaptive procedures have been proposed in the last two decades to accurately estimate the structural responses. However, the majority of these procedures consider the torsional effects on 2D structural models to reduce computational time and effort. It should also be noted that executing these 2D adaptive procedures is not easy because many structural engineering software applications lack an adaptive algorithm.
In this study, an FAP procedure was tested on a plan irregular reinforced concrete (RC) building using a code developed and implemented into ZEUS-NL (Elnashai et al., 2002) which is fiber-based finite element software and can run both adaptive pushover and dynamic analyses. It enables the user to incorporate the deterioration effects both in material and geometry in the 3D model. Moreover, it is also possible to develop a code and implement it in the software. First, the modal story shear forces were calculated using an eigenvalue analysis. Then, the first mode and two modes adaptive pushover analyses were run to evaluate the capacity curve, respectively. Then, story drifts were determined and compared with the nonlinear dynamic analyses, which were found to have a good correlation.
2 Conceptual background
In this study, the adaptive lateral load pattern is solely obtained by following the principles of structural dynamics. The second-order differential equation that governs the equation of motion of an MDOF system has been presented in Eq 1. Parameters m, c, and k, which are given on the left side of the equation, refer to the mass, damping, and stiffness matrixes, respectively. On the right side, i is the influence vector that concerns the direction of the ground motion, and
If Equation 1 is rewritten in terms of
The lateral force distribution for the nth mode,
In this study, the corresponding modal load vector has been determined by following Eq 6. Different from Eq 5, in Eq 6,
Herein, the lateral force distribution has been determined following the procedure explained in the study by Shakeri et al. (2010) by algebraically adding the modal story forces. This procedure considers the sign reversals in the story forces of higher modes which SRSS or CQC would not be able to. Accordingly, in Eq 11,
To estimate the seismic demands of tall buildings, Poursha et al. (2009) considered four steel buildings and worked on a consecutive modal pushover procedure. Their study concluded that the number of required stages in a multi-stage pushover analysis solely depends on the fundamental period of the building. A threshold limit of
Hence,
Once the lateral load vector is determined, it has to be updated at each adaptive step. The nominal load vector
In a recent study by Antoniou and Pinho (2004a), two possible procedures have been introduced, which may be used to update the load vector: total and incremental updating. In the former one, the load vector is obtained by following Equation 16. Here,
Different from the use of the conventional combination procedures SRSS or CQC, the peak results of the adaptive pushover analyses are later enveloped to compute the seismic demands. Hence, the envelopes may be determined by using Equation 19 (Amini and Poursha, 2018).
The flowchart of the previously explained procedure has been given presented in Figure 1. The developed code, which follows the given routine, is later implemented in ZEUS-NL (Elnashai et al., 2002). At each iterative step, ZEUS-NL performs eigenvalue analysis including the stiffness results of the former step using the Jacobi method. In the conventional procedure of the software, the next step is to superpose the modal responses by using SRSS or CQC. However, this part is altered to follow the previously explained procedure in the implemented code, owing to the fact that the algorithm ZEUS-NL follows enables different options to be tested. Furthermore, the newly obtained forces are subjected to the system and the total stiffness matrix of the structure is evaluated.
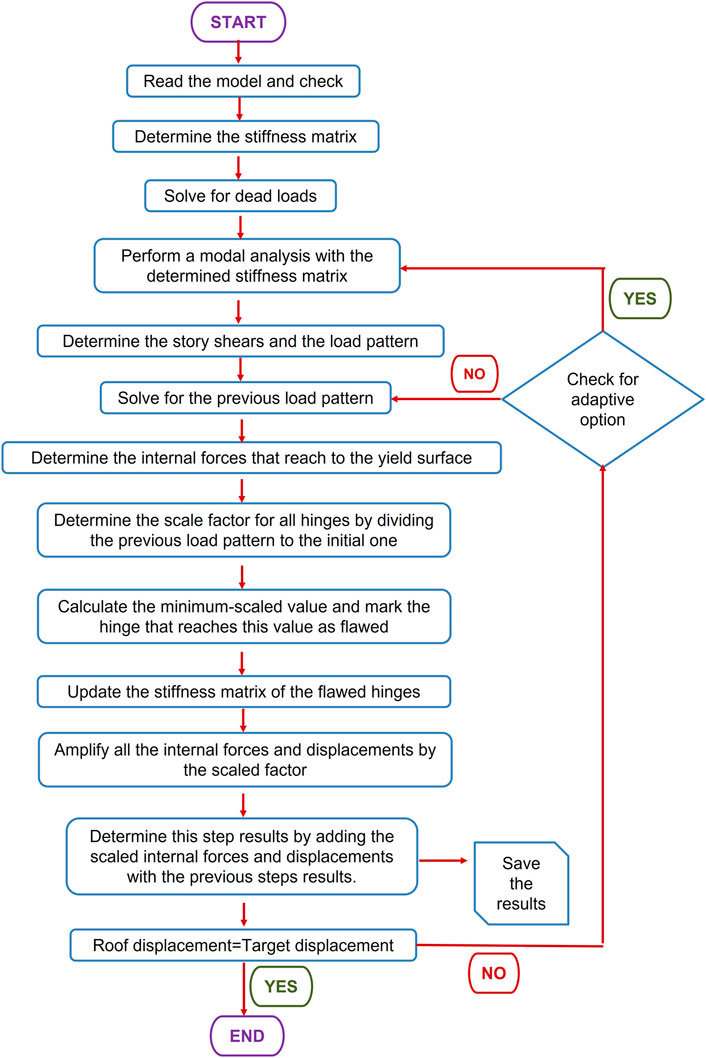
FIGURE 1. Flowchart of the developed code implemented in ZEUS-NL (Elnashai et al., 2002).
3 Strong ground motion selection
In this study, to conduct non-linear time history analyses, suites of real records were carefully selected considering magnitude range, peak ground acceleration (PGA) range, source distance, fault mechanism, and average shear-wave velocity. The Pacific Earthquake Engineering Research Center (PEER) Strong Ground Motion Database (PGMD) (PEER, 2014) was used to properly select the ground motions. In this study, seven hazard-compatible strong ground motions were selected. The specific properties of the selected ground motions are given in Table 1. In this table, Rjb is the Joyner–Boore distance and Rrup refers to the closest distance. Vs,30 refers to the average velocity of a shear-wave propagation in a 30 m depth layer, and amax is the maximum acceleration value. The selected events were generated by trust faulting.
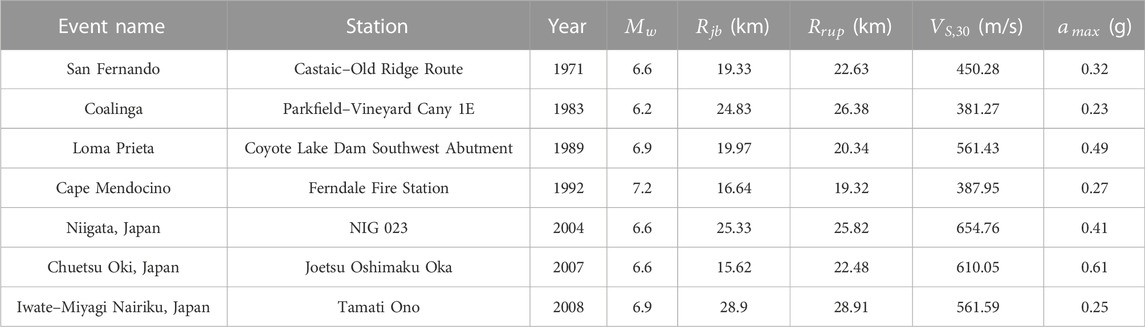
TABLE 1. Selected strong ground motion data.
In the literature, scaling the selected input ground motion records with respect to PGA has been widely used. Tönük et al. (2014) recommend the use of an amplitude scaling procedure which is called as spectrum scaling procedure. The procedure is processed by scaling each individual ground motion record to obtain the best match with the target acceleration spectrum where an optimization routine has to be used. The optimization routine uses peak acceleration values as the scaling factor and does not alter the frequency content of the motion. The advantage of this methodology is that it uses smaller scaling factors and better matches with the target spectrum having limited scatter. Furthermore, in the study by Bazurro and Cornell (2004), it was reported that the scaling of the selected records with respect to spectral acceleration would yield more consistent results. Hence, in this study, the selected ground motion records were then scaled to 0.2 g PGA to match the EC8 (Eurocode 8, 2004) Type 1 design spectrum for Type B soil and 5% damping, as illustrated in Figure 2.
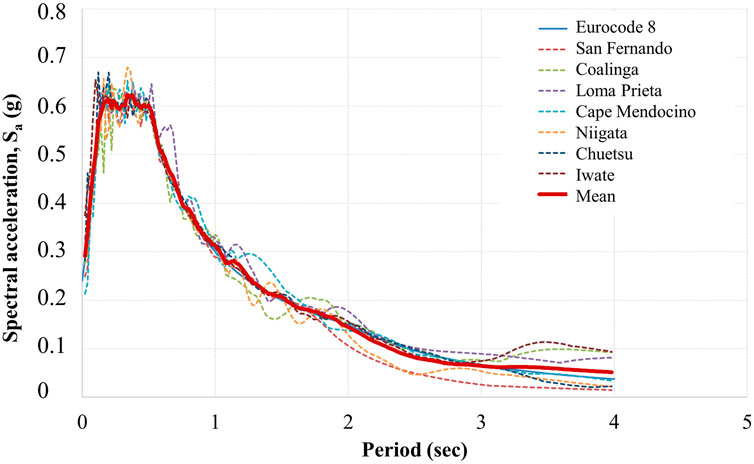
FIGURE 2. 0.2 g scaled response spectrum to be used in adaptive pushover analyses.
4 Case-studied building and modeling assumptions
The quality of building stock in Mediterranean countries is generally similar. It would not be wrong to generalize that most buildings in this region were aseismically designed and lacked engineering principles. To represent the situation in Turkey, an irregular test building built at the European Laboratory for Structural Assessment (ELSA) by Fardis and Negro (2005) in 2002 was selected as the case study structure. The three-storied irregular RC building is aseismically designed. Aseismically designed buildings are generally designed only for gravity loads, and they follow neither the requirements of the seismic codes nor the principles of capacity design. They have stronger beam elements and weaker column elements, and the transverse reinforcements in the columns do not comply with the confinement limits of present-day seismic design codes. Furthermore, the beam–column joints are sensitive to shear failure owing to the lack of transverse reinforcement (Stratan and Fajfar, 2002; Stratan and Fajfar, 2003). It should be emphasized that the capacities of these structures should be enhanced immediately, especially in earthquake-prone regions.
Figure 3 shows the schematics of the plan and elevation of the pseudo-dynamically tested irregular building. The structure has plan irregularities and a 3-m story height. As illustrated in Figure 4, the cross-sectional dimensions of all columns were 25 cm × 25 cm, except for column C6, which had dimensions of 75 cm × 25 cm and made the structure stiffer and stronger along the y-direction. The longitudinal reinforcement of the beam elements was composed of four ø12 mm plain bars that were placed at the top and anchored at the end of the column element. The bottom reinforcement of the beam element was composed of two ø12 mm plain bars. The transverse reinforcement used in the beams was ø8/200 mm. A schematic of the structural elements is presented in Figure 4. Non-structural components, such as infills, were not considered in the finite element model. Moment–curvature graphs were obtained from XTRACT (XTRACT software, 2002) models.
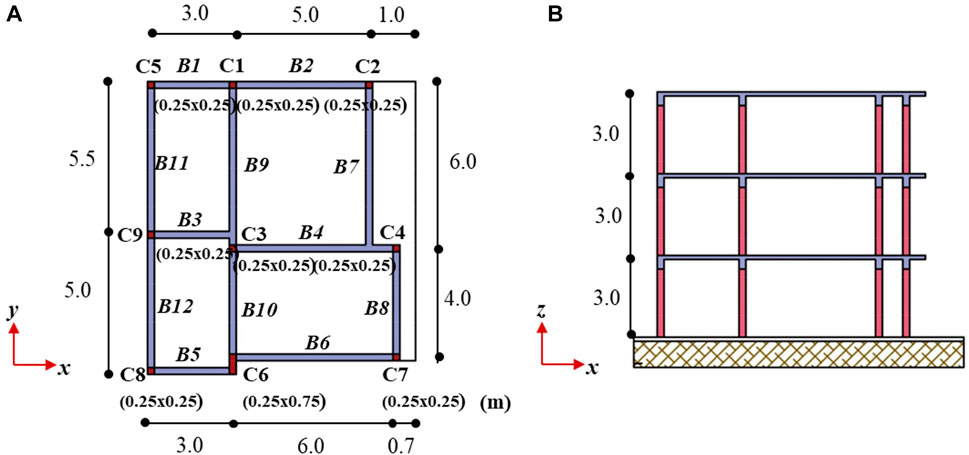
FIGURE 3. (A) Plan and (B) elevation.
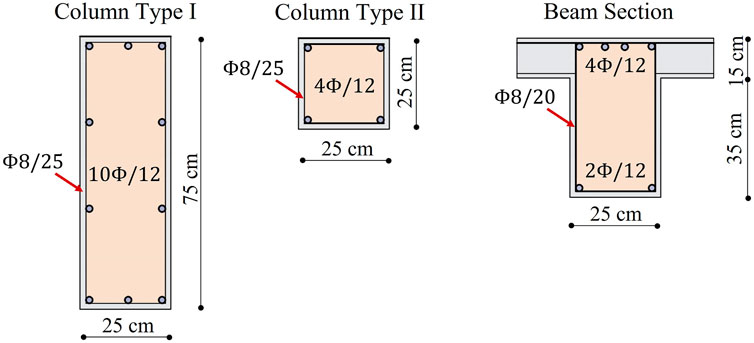
FIGURE 4. Reinforcement layouts of column and beam elements.
Martinez-Rueda and Elnashai (1997) tested the robustness of the model of Mander et al. (1998) with software that follows a fiber-based approach, where they concluded that the model lacks numerical stability in terms of stiffness, especially under large displacements. Hence, a new concrete model which predicts cyclic degradation of strength and stiffness was developed. Though the proposed model mainly follows the model of Mander et al. (1998), the rules for considering cyclic degradation of strength, inelastic strain, and shape of the unloading branches were newly defined. This material model was then implemented into ZEUS-NL and labeled as (con2). In its current form, four parameters are required to properly define the material model: compressive strength
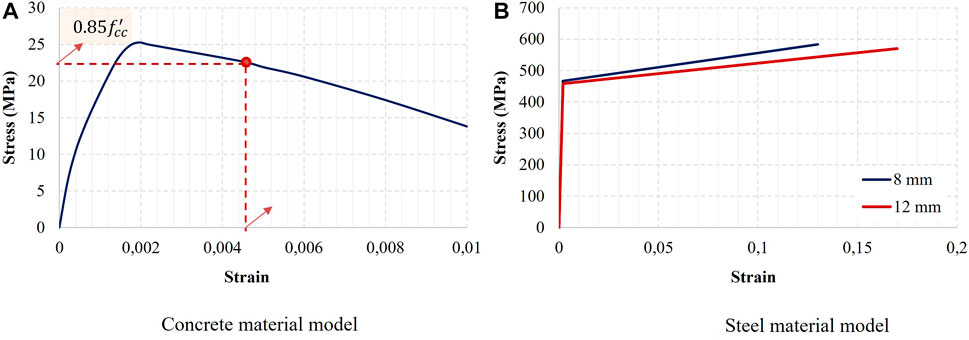
FIGURE 5. Material models: (A) steel and (B) concrete.
Comprehensive element libraries are included in ZEUS-NL (Elnashai et al., 2002). 3-D cubic elastic-plastic beam elements that were formulated by Izzuddin and Elnashai (1989) following the Euler–Bernoulli formulation (Elnashai and Izzuddin, 1993) were used to model both the beams and columns. These elements have 200 monitoring points, enable further inelastic modeling, and can account for the spread of inelasticity along the length of the member. For each beam and column member, a mesh of four elements was used. To accurately estimate the plasticity induced near the beam–column joints, smaller-sized elements were used at the beginning and end points of members. For the outer and inner segments of the beams and columns, 0.15L and 0.35L were selected as the lengths of the elements, respectively, where L refers to the length of the considered member. The rigidity matrix of an element was then derived at two Gaussian integration points which were located at 0.3L distance from the mid-point. Furthermore, these sections were divided into fibers, and a stiffness matrix was constructed considering the contribution of each individual fiber. This integration scheme formed the tangent stiffness matrix, which was later transformed into the global stiffness matrix. In addition, to satisfy the rigid diaphragm assumption, diagonal elements having quite thin and wide cross-sections were introduced at the floor level. The 3-D finite element model of the considered building is presented in Figure 6.
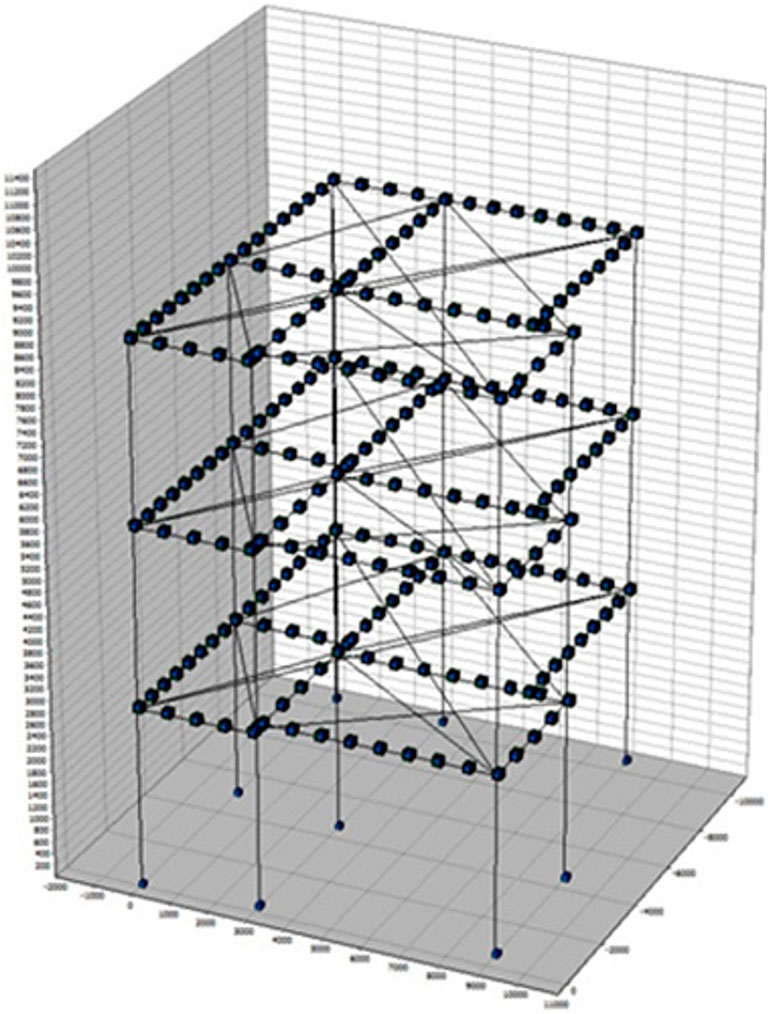
FIGURE 6. Finite element model of the SPEAR building.
According to EC8 (Eurocode 8, 2004), Eqs 20, 21 should be satisfied for a building to be considered regular. In these equations,

TABLE 2. Calculated irregularity parameters.
According to Fajfar et al.(2005), the ratio of the uncoupled translational period,

TABLE 3. Torsional-to-lateral frequency ratio.
5 Analytical study and results of the analyses
To calculate the design load, live loads were reduced by 30%, and dead loads were considered as they were. The self-weight of concrete was set to 25 kN/m3. Subsequently, the previously determined gravity loads were distributed to the nearest beams and columns. Moreover, both the dead (D) and reduced live (Q) loads were considered to calculate the mass of the considered irregular building, and those masses were assigned to the nodes of the structural elements. The live load reduction factor was set at 0.3. Accordingly, the masses of the first two stories were found as
To estimate the modal behavior of the considered building, eigenvalue analyses were conducted. Determined mode shapes are illustrated in Figure 7, and the outcomes of calculated modal quantities are given in Table 4. Herein, in the table,
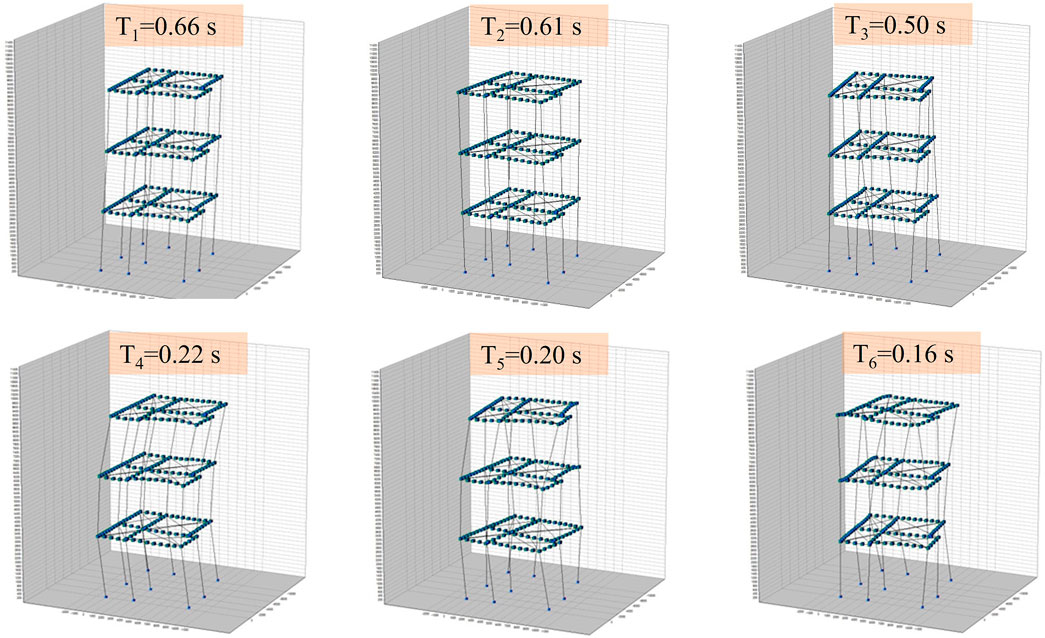
FIGURE 7. Modal response of the SPEAR building.
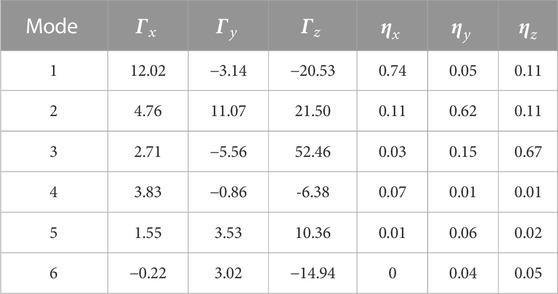
TABLE 4. Modal parameters.
As stated in the study by Amini and Poursha (2018), modal story shear forces were calculated by running eigenvalue analyses. Throughout the adaptive analyses, story shear forces were used instead of base shears to evaluate the lateral load vector. Following this, first mode and two modes adaptive pushover analyses were run to determine the capacity curves, respectively. As brought forward in the Introduction, the tested FAP procedure is capable of both considering the effects of higher modes and stiffness degradation effects, including the reversal effects of the modes. The load pattern was later obtained by the principles explained in the study by Amini and Poursha (2018). The calculated modal story shear profiles for the x- and y-direction for each story are shown in Figure 8. It can be deduced that the calculated modal story shear forces in the y-direction are above those in the x-direction, which may be because the structure is much stiffer in the former direction.
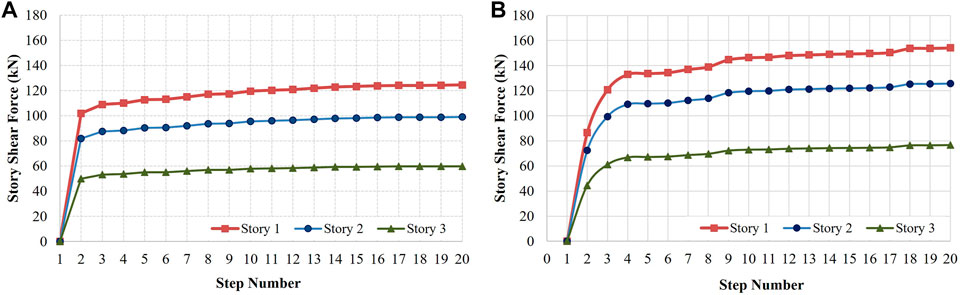
FIGURE 8. Story shear profiles: (A) x- and (B) y-direction.
After evaluating the modal story shear profiles, the load pattern used in the adaptive analyses was derived. The calculated load pattern versus the step number is given in Figures 9A, B. Considering both the x- and y-direction, the distribution of the calculated load pattern through the height of the structure is illustrated in Figures 9C, D for each story.
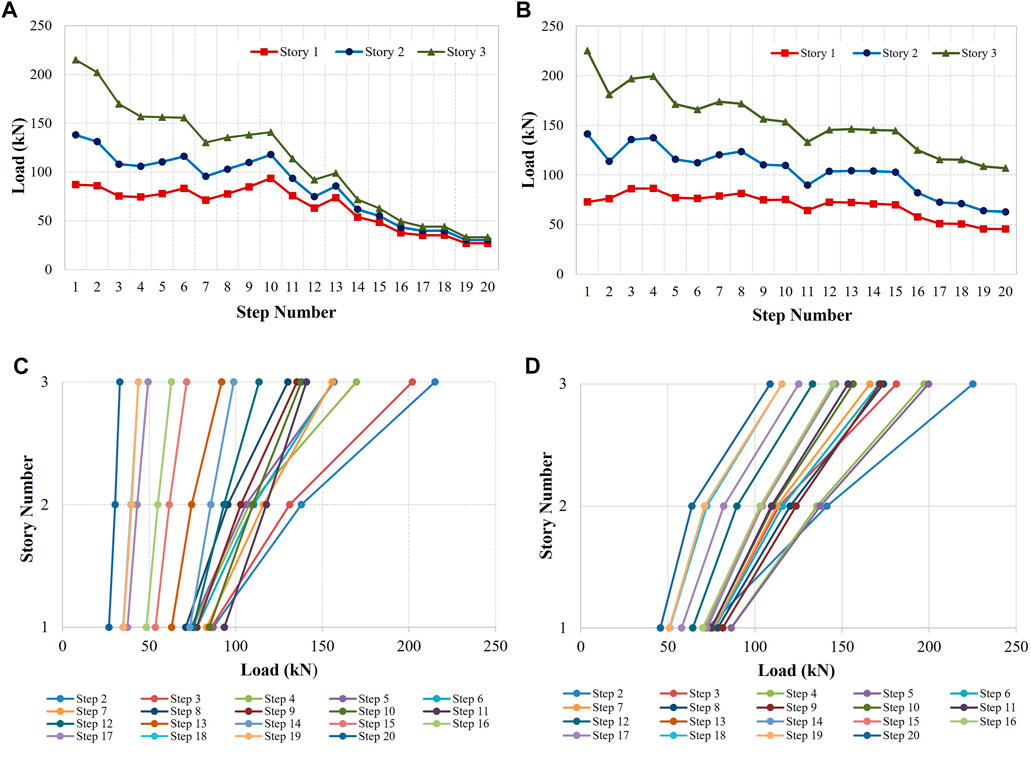
FIGURE 9. Derived load pattern versus step number: (A) x- and (B) y-direction. Height-wise distribution of the load pattern: (C) x- and (D) y-direction.
Using the previously determined height-wise lateral load pattern, the building was pushed in both the x- and y-direction. In Figure 10, the obtained base shear–top displacement curve is presented for the considered two directions. The target displacement values were calculated following FEMA (FEMA 440, 2005) as 0.042 m and 0.047 m in the x- and y-direction, respectively.
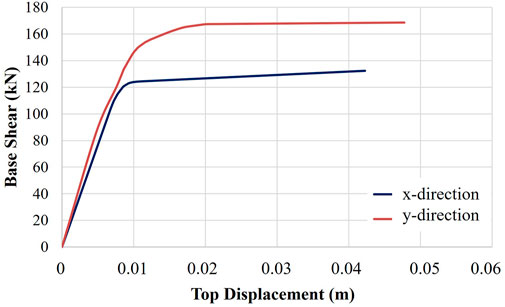
FIGURE 10. Obtained pushover curves both in x- and y-direction.
Following the preceding discussion, the story drift values obtained from the FAP procedure were compared with the results of the nonlinear time–history analyses and plotted in Figure 11. It can be concluded that the adaptive results correlate well with the results of the dynamic analyses.
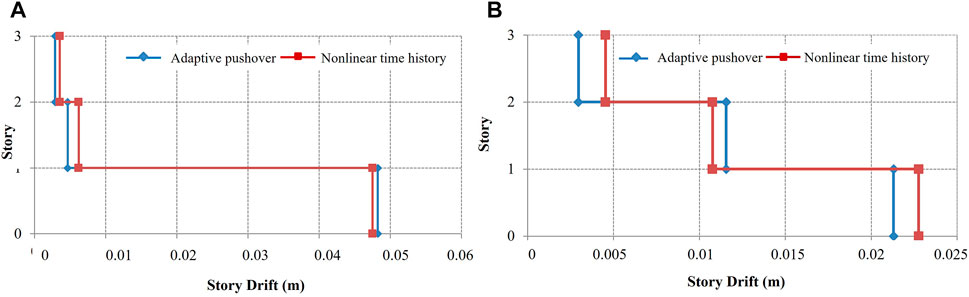
FIGURE 11. Story drifts for (A) x- and (B) y-direction.
Di Sarno et al. (2013) stated that interstory drifts may be used as an effective damage control measure. Furthermore, in EC8 (Eurocode 8, 2004), a code threshold limit of 0.5% was defined to indicate a damage state for the interstory drift ratios. Hence, for each individual record presented in Table 1, top displacement–time traces are first obtained. It is observed that among seven ground motions, the Chuetsu Oki (Japan) record resulted in the maximum top displacement values. Top displacement–time traces are illustrated in Figure 12 both for x- and y-direction.
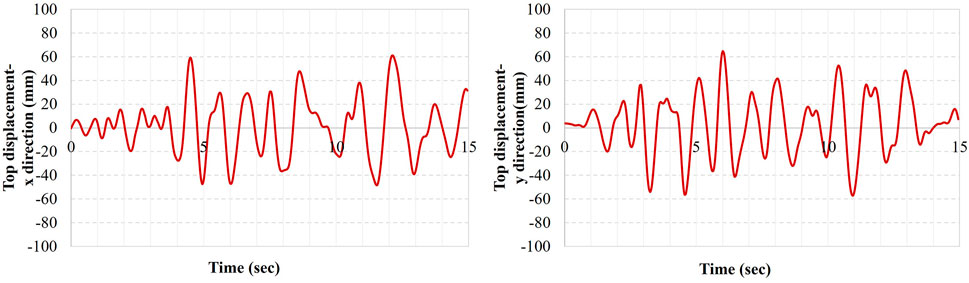
FIGURE 12. Top displacement–time traces in x- and y-direction for the Chuetsu Oki (Japan) record.
For the mentioned ground motion record, interstory drift ratios for both x- and y-direction are then determined and plotted in Figure 13 for each story. The threshold limit was also plotted on the graphs for comparison. It can easily be inferred from the graph that damage is unavoidable.
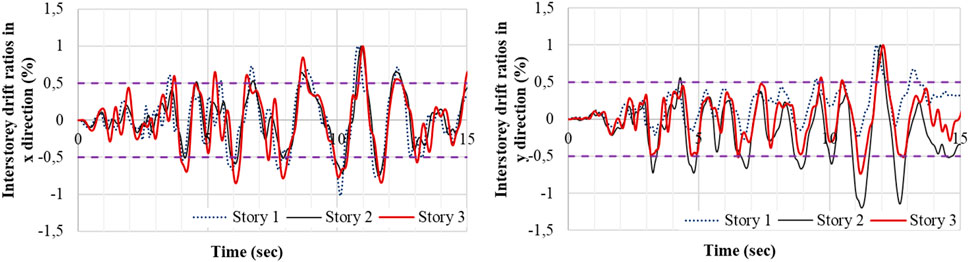
FIGURE 13. Interstory drift ratios for the Chuetsu Oki (Japan) record.
The base shear–time history traces of the considered building are plotted in Figure 14 for the previously considered earthquake record. The capacity results of the tested FAP are also marked on the given plots for comparison. It can be concluded that the calculated capacity values are exceeded under the mentioned ground motion.
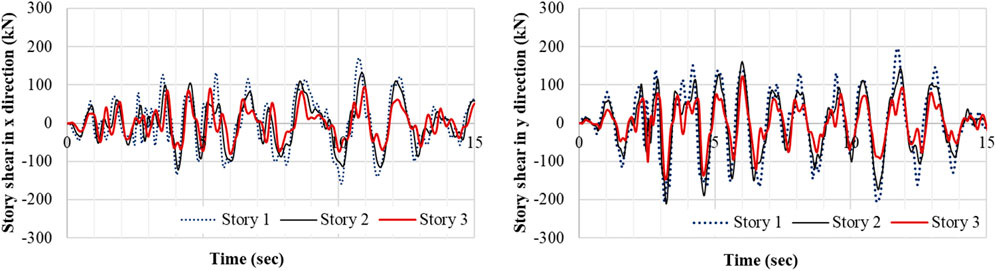
FIGURE 14. Base shear–time history traces.
It was previously mentioned by Elnashai and Di Sarno (2015) that high energy absorption is a function of high-level damage. It can be concluded that the area under the action–deformation curves will correspond to the level of absorbed energy for a specific deformation level. For that, the hysteretic behavior of the building was aimed to be examined to assess the damage level for the considered ground motion. In Figure 15, for each story level, story shear–interstory drift plots are presented for both x- and y-direction. It is found from the figure that the absorbed energy is greater at the second story level.
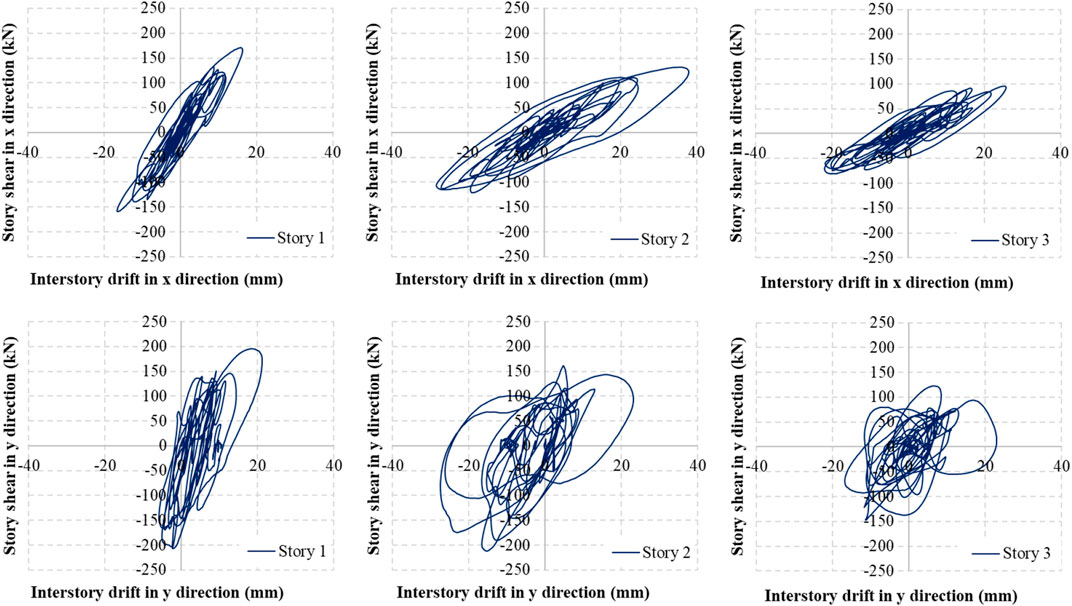
FIGURE 15. Story shear–interstory drift graphs.
6 Conclusion
In this study, an adaptive force-based multimode pushover analysis procedure was tested on an aseismically designed 3D irregular RC building to assess its capacity and drift values. For that, a computer code has been developed and implemented into ZEUS-NL, which is powerful finite element software. It enables the designer to run many different types of analyses, such as adaptive pushover and non-linear time history.
First, an eigenvalue analysis was run to determine the modal properties of the considered irregular structure. Then, the modal story shear forces were calculated using the results of the eigenvalue analysis. Subsequently, the modal story shear forces were evaluated to calculate the lateral load distribution. Finally, a three-step adaptive technique was applied using the obtained lateral load vector. Accordingly, the decision on the number of modal contributions depends on the given threshold limit of the fundamental period. First, an adaptive single-mode pushover analysis is used considering the first mode. Following this, if
The results of the adaptive pushovers were then used to determine the capacity curves. After evaluating the capacity diagram of the considered plan irregular building, the story drifts were determined. The results of the adaptive pushover were tested with the non-linear dynamic results. It should be emphasized that combination procedures of SRSS or CQC were not used to obtain the maximum response. Instead, the envelope response is determined as the maximum of the two modal responses calculated previously. It was then concluded that the result of the applied procedure well correlates with the dynamic results.
Furthermore, top displacement–time traces for all the considered ground motions were obtained individually, and the record that reveals the maximum top displacement was specified. Later, for the same record, interstory drift ratio–time graphs were developed for each story level. The threshold limit of the design code was also plotted on the same graphs to interpret the amount of damage for a specific value of deformation. Base shear–time history traces of the considered building were then developed for the mentioned ground motion. The results of the tested FAP were implemented into graphs to conclude that the determined capacity values are exceeded. Moreover, story shear–interstory drift relations were plotted to investigate the absorbed energy level, which is a good indicator of damage. The result indicated that absorbed energy at the second story level was higher.
Furthermore, the results of the analyses revealed that for irregular RC structures, the tested procedure is more accurate in terms of estimating structural capacity and drifts. The applied procedure was also found to enhance the sensitivity of the results. However, in its current form, the procedure reflects the seismic behavior of irregular midrise buildings. For the procedure to be applicable to high-rise buildings, it should be developed more.
Data availability statement
The original contributions presented in the study are included in the article/Supplementary Material; further inquiries can be directed to the corresponding author.
Author contributions
RO developed the method applied in the manuscript. He obtained the data, ran the analyses, and wrote the manuscript. The results were presented by the author.
Conflict of interest
The author declares that the research was conducted in the absence of any commercial or financial relationships that could be construed as a potential conflict of interest.
Publisher’s note
All claims expressed in this article are solely those of the authors and do not necessarily represent those of their affiliated organizations, or those of the publisher, the editors, and the reviewers. Any product that may be evaluated in this article, or claim that may be made by its manufacturer, is not guaranteed or endorsed by the publisher.
References
Adhikari, G., and Pinho, R. (2010). Development and application of nonlinear static procedures for plan-asymmetric buildings. Italy: Rose School ReportRose School, IUSS Pavia. ROSE-2010/01.
Albanesi, T., Biondi, S., and Petrangeli, M. (2002). Proceedings of the 12th European Conference on Earthquake Engineering. London, UK, Elsevier Science Ltd.Pushover analysis: An energy based approach.
Amini, M. A., and Poursha, M. (2018). Adaptive force-based multimode pushover analysis for seismic evaluation of midrise buildings. J. Struct. Eng. (N. Y. N. Y). 144 (8). doi:10.1061/(ASCE)ST.1943-541X.0002070
Antoniou, S., and Pinho, R. (2004). Advantages and limitations of adaptive and non-adaptive force-based pushover procedures. J. Earthq. Eng. 8 (4), 497–522. doi:10.1080/13632460409350498
Antoniou, S., and Pinho, R. (2004). Development and verification of a displacement-based adaptive pushover procedure. J. Earthq. Eng. 8 (5), 643–661. doi:10.1080/13632460409350504
Barros, R. C., and Almeida, R. (2005). Pushover analysis of asymmetric three dimensional building frames. J. Civ. Eng. Manag. 11 (1), 3–12. doi:10.3846/13923730.2005.9636327
Bazzurro, P., and Cornell, A. C. (2004). Nonlinear soil-site effects in probabilistic seismic-hazard analysis. Bull. Seismol. Soc. Am. 94 (6), 2110–2123. doi:10.1785/0120030216
Behnamfar, F., Taherian, S. M., and Sahraei, A. (2016). Enhanced nonlinear static analysis with the drift pushover procedure for tall buildings. Bull. Earthq. Eng. 14 (11), 3025–3046. doi:10.1007/s10518-016-9932-5
Bhatt, C., and Bento, R. (2011). Assessing the seismic response of existing RC buildings using the extended N2 method. Bull. Earthq. Eng. 9, 1183–1201. doi:10.1007/s10518-011-9252-8
Bracci, J. M., Kunnath, S. K., and Reinhorn, A. M. (1997). Seismic performance and retrofit evaluation of reinforced concrete structures. J. Struct. Eng. 123 (1), 3–10. doi:10.1061/(asce)0733-9445(1997)123:1(3)
Chopra, A. K., and Goel, R. K. (2002). A modal pushover analysis procedure for estimating seismic demands for buildings. Earthq. Eng. Struct. Dyn. 31, 561–582. doi:10.1002/eqe.144
Chopra, A. K., Goel, R. K., and Chintanapakdee, C. (2004). Evaluation of a modified MPA procedure assuming higher modes as elastic to estimate seismic demands. Earthq. Spectra 20 (3), 757–778. doi:10.1193/1.1775237
Di Sarno, L., Yenidogan, C., and Erdik, M. (2013). Field evidence and numerical investigation of the $$\text{ M}_\mathrm{w}= 7.1$$ October 23 Van, Tabanlı and the $$\text{ M}_\mathrm{W}> 5.7$$ November earthquakes of 2011. Bull. Earthq. Eng. 11, 313–346. doi:10.1007/s10518-012-9417-0
Elnashai, A. S., and Di Sarno, L. (2015). Fundamentals of earthquake engineering: From source to fragility. 2nd edn. West Sussex: Wiley.
Elnashai, A. S., and Izzuddin, B. A. (1993). Modelling of material non-linearities in steel structures subjected to transient dynamic loading. Earthq. Eng. Struct. Dyn. 22, 509–532. doi:10.1002/eqe.4290220604
Elnashai, A. S., Papanikolaou, V., and Lee, D. (2002). ZEUS-NL – a system for inelastic analysis of structures. Urbana-Champaign Program Release: Mid-America Earthquake Center.
Eurocode 8, (2004). Design of structures for earthquake resistance. Washington, DC: British Standards.
Fajfar, P. (2000). A Nonlinear analysis method for performance based seismic design. Earthq. Spectra 16 (3), 573–592. doi:10.1193/1.1586128
Fajfar, P., Marusic, D., and Perus, I. (2005). Torsional effects in the pushover-based seismic analysis of buildings. J. Earthq. Eng. 9 (6), 831–854. doi:10.1080/13632460509350568
Fardis, M., and Negro, P. A. (2005). Proceedings of the International Workshop: Institute for the protection and security of the citizen European laboratory for Structural.Seismic performance assessment and rehabilitation of existing buildings (SPEAR). ItalyAssessment (ELSA) I-21020 Ispra
Fema 440, (2005) Improvement of nonlinear static seismic analysis procedures. Washington, DC: Federal Emergency Management Agency.
Freeman, S. A. (1978). Proceedings of douglas McHenry international symposium on concrete and concrete structures. Michigan: Publication SP-55.Prediction of response of concrete buildings to severe earthquake motion
Gupta, B., and Kunnath, S. K. (2000). Adaptive spectra-based pushover procedure for seismic evaluation of structures. Earthq. Spectra 16 (2), 367–391. doi:10.1193/1.1586117
Izzuddin, B. A., and Elnashai, A. S. (1989). ADAPTIC-A program for adaptive largedisplacement elastoplastic dynamic analysis of steel, concrete and composite frames. in Research Report ESEE Report No, 89/7. London: Imperial College.
Jalilkhani, M., Ghasemi, S. H., and Danesh, M. (2020). A multi-mode adaptive pushover analysis procedure for estimating the seismic demands of RC moment-resisting frames. Eng. Struct. 213, 110528. doi:10.1016/j.engstruct.2020.110528
Jan, T. S., Liu, M. W., and Kao, Y. C. (2004). An upper-bound pushover analysis procedure for estimating the seismic demands of high-rise buildings. Eng. Struct. 26 (1), 117–128. doi:10.1016/j.engstruct.2003.09.003
Jeong, S. H., and Elnashai, A. S. (2004). Analytical assessment of an irregular RC full scale 3D test structure, Mid-America Earthquake Center Technical Report. 9(1):95–128. Urbana, Illinois: EEC-9701785J. Earthq. Eng.
Kalkan, E., and Kunnath, S. K. (2006). Adaptive modal combination procedure for nonlinear static analysis of building structures. J. Struct. Eng. (N. Y. N. Y). 132 (11), 1721–1731. doi:10.1061/(asce)0733-9445(2006)132:11(1721)
Kappos, A. J., and Penelis, Gr.G. (2000). Proceedings of the Twelfth World Conference on Earthquake Engineering. Auckland, New Zealand. No. 2109.3D pushover analysis: The issue of torsion
Kim, S. P., and Kurama, Y. C. (2008). An alternative pushover analysis procedure to estimate seismic displacement demands. Eng. Struct. 30 (12), 3793–3807. doi:10.1016/j.engstruct.2008.07.008
Kosmopoulos, A. J., and Fardis, M. N. (2008). Simple models for inelastic seismic analysis of asymmetric multistory RC buildings. J. Earthq. Eng. 12 (5), 704–727. doi:10.1080/13632460701673126
Krawinkler, H., and Seneviratna, G. D. P. K. (1998). Pros and cons of a pushover analysis of seismic performance evaluation. Eng. Struct. 20 (4-6), 452–464. doi:10.1016/s0141-0296(97)00092-8
Mander, J. B., Priestley, J. N., and Park, R. (1988). Theoretical stress-strain model for confined concrete. J. Struct. Eng. (N. Y. N. Y). 114 (8), 1804–1826. doi:10.1061/(asce)0733-9445(1988)114:8(1804)
Martínez-Rueda, J. E., and Elnashai, A. S. (1997). Confined concrete model under cyclic load. Mat. Struct. 30, 139–147. doi:10.1007/BF02486385
Moghadam, A. S., and Tso, W. K. (2002). Proceedings of the 12th European Conference on Earthquake Engineering. London, UK, Elsevier Science Ltd.A pushover procedure for tall buildings.
Panyakapo, P. (2014). Cyclic pushover analysis procedure to estimate seismic demands for buildings. Eng. Struct. 66, 10–23. doi:10.1016/j.engstruct.2014.02.001
Paret, F. T., Sasaki, K. K., Eilbeck, D. H., and Freeman, S. A. (1996). Approximate inelastic procedures to identify failure mechanisms from higher mode effects. Mexico: Eleventh World Conference on Earthquake EngineeringAcapulco.
Peer, (2014). Strong motion database. Pacific earthquake engineering research center. (Accessed May 15, 2022).
Perus, I., and Fajfar, P. (2005). On the inelastic torsional response of single-storey structures under bi-axial excitation. Earthq. Eng. Struct. Dyn. 34 (8), 931–941. doi:10.1002/eqe.462
Poursha, M., and Amini, M. A. (2016). A non-adaptive displacement-based pushover procedure for the nonlinear static analysis of tall building frames. Eng. Struct. 126, 586–597. doi:10.1016/j.engstruct.2016.08.009
Poursha, M., and Amini, M. A. (2015). A single-run multi-mode pushover analysis to account for the effect of higher modes in estimating the seismic demands of tall buildings. Bull. Earthq. Eng. 13 (8), 2347–2365. doi:10.1007/s10518-014-9721-y
Poursha, M., Khoshnoudian, F., and Moghadam, A. (2009). A consecutive modal pushover procedure for estimating the seismic demands of tall buildings. Eng. Struct. 31 (2), 591–599. doi:10.1016/j.engstruct.2008.10.009
Poursha, M., Khoshnoudian, F., and Moghadam, A. S. (2011). A consecutive modal pushover procedure for nonlinear static analysis of one-way unsymmetric-plan tall building structures. Eng. Struct. 33 (9), 2417–2434. doi:10.1016/j.engstruct.2011.04.013
Reinhorn, A. M. (1997). Workshop on inelastic analysis techniques in seismic evaluations. Slovenia: Bled.Seismic design methodologies for the next generation of code.
Requena, M., and Ayala, A. G. (2000). Proceedings of the Twelfth World Conference on Earthquake Engineering. Auckland, New Zealand. No. 2109.Evaluation of a simplified method for the determination of the nonlinear seismic response of RC frames.
Ruggieri, S., Chatzidaki, A., Vamvatsikos, D., and Uva, G. (2022). Reduced-order models for the seismic assessment of plan-irregular low-rise frame buildings. Earthq. Eng. Struct. Dyn. 51, 3327–3346. doi:10.1002/eqe.3725
Ruggieri, S., and Uva, G. (2020). Accounting for the spatial variability of seismic motion in the pushover analysis of regular and irregular RC buildings in the New Italian Building Code. Buildings 10 (10), 177–199. doi:10.3390/buildings10100177
Sasaki, K. K., Freeman, S. A., and Paret, T. F. (1998). Seattle.Multimode pushover procedure (MMP) – a method to identify the effects of higher modes in a pushover analysis, Proceedings of the U.S. National Conf. on Earthquake Engineering.
Satyarno, I., Carr, A. J., and Restrepo, J. (1998). Refined pushover analysis for the assessment of older reinforced concrete buildings. Proc. NZSEE Technol. Conf.
Shakeri, K., Shayanfar, M. A., and Kabeyasawa, T. (2010). A story shear-based adaptive pushover procedure for estimating seismic demands of buildings. Eng. Struct. 32 (1), 174–183. doi:10.1016/j.engstruct.2009.09.004
Stefano, M. D., and Pintuchhi, B. (2008). A review of research on seismic behaviour of irregular building structures since 2002. Bull. Earthq. Eng. 6, 285–308. doi:10.1007/s10518-007-9052-3
Stratan, A., and Fajfar, P. (2002). Influence of modelling assumptions and analysis procedure on the seismic evaluation of reinforced concrete old frames. Ljubljana: IKPIR Laboratory Technical Report.
Stratan, A., and Fajfar, P. (2003). Seismic assessment of the spear test structure. Ljubljana: IKPIR Laboratory Technical Report.
Tönük, G., Ansal, A., Kurtulus¸, A., and Çetiner, B. (2014). Site specific response analysis for performance based design earthquake characteristics. Bull. Earthq. Eng. 12, 1091–1105. doi:10.1007/s10518-013-9529-1
Vafaee, M., H., and Saffari, H. (2017). A modal shear-based pushover procedure for estimating the seismic demands of tall building structures. Soil Dyn. Earthq. Eng. 92, 95–108. doi:10.1016/j.soildyn.2016.09.033
Keywords: adaptive pushover, earthquake, irregular buildings, story drifts, nonlinear time history analysis
Citation: Oyguc RA (2022) A case study on an innovative seismic performance evaluation procedure for irregular RC buildings. Front. Built Environ. 8:1058983. doi: 10.3389/fbuil.2022.1058983
Received: 30 September 2022; Accepted: 30 November 2022;
Published: 15 December 2022.
Edited by:
Arturo Tena-Colunga, Autonomous Metropolitan University, MexicoReviewed by:
Sergio Ruggieri, Politecnico di Bari, ItalyShinta Yoshitomi, Ritsumeikan University, Japan
Copyright © 2022 Oyguc. This is an open-access article distributed under the terms of the Creative Commons Attribution License (CC BY). The use, distribution or reproduction in other forums is permitted, provided the original author(s) and the copyright owner(s) are credited and that the original publication in this journal is cited, in accordance with accepted academic practice. No use, distribution or reproduction is permitted which does not comply with these terms.
*Correspondence: Resat A. Oyguc, b3lndWNAaXR1LmVkdS50cg==