Spatial Variations of Commuting Behavior and Their Impact Factors in Shanghai Metropolitan Area
 Kaiming Li
 Liying Yue2*
 - 1College of Architecture and Urban Planning, Tongji University, Shanghai, China
- 2School of Social Development, East China Normal University, Shanghai, China
- 3Antai College of Economics and Management, Shanghai Jiao Tong University, Shanghai, China
Exploring the spatial variations and the impact of spatial and social factors on commuting behavior is vital to promote cities’ sustainable development and improve residents’ daily lives. Based on 2015 1% Population Sample Survey data in Shanghai, this study constructs an improved accessibility index to evaluate the jobs–housing spatial relationship and compares spatial variations and factors of commuting duration and commuting distance at the sub-district level by using spatial autocorrelation analysis, spatial lag model, and spatial error model. In terms of spatial variations, the median commuting distance and commuting duration are 6.32 km and 28.37 min, respectively. Both of them have significant spatial autocorrelation, and the latter is higher. The high–high agglomeration areas of commuting distance scatter between the outer ring road and the outer suburbs. The high–high agglomeration areas of commuting duration are mainly distributed between the middle and the outer ring roads. In terms of affecting factors, the impacts of social factors on the commuting level are more significant than spatial factors. Ignoring the former will overestimate the effects of the latter. Commuting distance is more significantly correlated with spatial factors, and job accessibility is the most critical factor, while commuting duration is more significantly associated with social factors, and education level is the essential factor. There is significant intra-urban heterogeneity and spatial autocorrelation of commuting distance and duration in the metropolis. Social factors are more influential than spatial factors on commuting behavior.
1 Introduction
With urban spatial expansion and economic development, residents’ travel distance and the proportion of motorized travel keep increasing (Haixiao et al., 2009; Zhao, 2013; Sun and Dan, 2015; Sun et al., 2017). Meanwhile, urban problems are increasingly prominent, such as traffic congestion and environmental pollution (Shen and Zhang, 2020). Green travel has become the focal point of urban governance and development to cope with urban traffic issues. Shanghai, Beijing, and other cities have written the jobs–housing balance into the urban master plan in recent years. Cutting commuting distance and reducing commuting duration has become the primary demand for residents to improve the quality of life and the inevitable choice of sustainable urban development. Commuting is the product of the separation of work and residential location (Hu et al., 2016; Li et al., 2018). It can reflect urban spatial structure to a certain extent (Yang, 2008; Yang and Ferreira, 2008). It is a critical perspective to analyze the logic of urban spatial organization (Acker and Witlox, 2011; Shen and Zhang, 2020). Commuting difficulty is a typical urban problem faced by all major cities in the world today (Fan et al., 2010). Therefore, revealing the spatial variations of intra-urban commuting behavior and its driving factors can help systematically understand the causes of urban problems, such as traffic congestion, and provide policy suggestions for transportation optimization.
As the most common behavior of urban transportation, under the constraints of individual socioeconomic characteristics and urban spatial structure (Shen and Zhang, 2020), commuting results from trade-offs and choices on travel distance and residence preferences (Alonso, 1964). Commuting involves various development issues, such as the urban economy, traffic, and environment (Schleith et al., 2016). The quantitative characterization and assessment of commuting is the primary prerequisite for urban governance and development. Studies on individual and regional scales are equally important, but the latter has more pertinence and application value for formulating and optimizing relevant public policies (Wang, 2001; Zhao, 2013; Su et al., 2021).
Regarding the spatial variations of commuting behavior, different scholars based on countries (Alonso, 1964), cities (Levinson and Wu, 2005; Sun et al., 2016; Li and Lu, 2018; Yin et al., 2018), counties (Giuliano and Small, 1993), traffic zones (Shen, 2000; Wang, 2000; Kawabata and Shen, 2016), and finer scales conduct extensive research (Liu et al., 2019; Pan and Wang, 2020). At the national level, the travel distance of developed countries and regions is longer, and motorized travel is much higher than those of developing countries. Global motorized travel is predicted to continue to grow (Schafer and Victor, 2000). Scholars have investigated the spatial variations of commuting behavior based on different spatial units. Supporters of the stability law of commuting duration believe that commuting duration does not increase significantly with the expansion of city size. This argument has been demonstrated by many scholars (Anas, 2014). Some scholars also found that there are significant spatial variations in urban commuting duration—for example, the commuting duration of cities in central and western China is longer than those of eastern developed regions (Li and Lu, 2018; Yin et al., 2018). In order to test the effectiveness of polycentric strategy based on job centers within the city, studies show that the farther away from the central business district (CBD), the shorter the average commuting time in employment centers, but there was no significant change in the average commuting distance (Sun et al., 2013). This suggests that the reduction in commuting duration is not due to jobs–housing balance but to high travel speed under car commute and loose road conditions (Sultana, 1990; Sun et al., 2013). In addition, based on the township scale in Boston (Shen, 2000), Columbus (Wang, 2001), San Francisco (Kawabata and Shen, 2016), and others, some studies find that there are significant spatial variations of commuting duration and distance within a city. The commuting duration in low-income areas of the inner city is significantly higher than those in other areas. The commuting duration of public transportation is longer, and its spatial variations are much greater than those of cars.
The factors affecting commuting behavior are also an important issue, mainly including urban spatial and social dimensions. In spatial dimension, compared with minimum commuting, in jobs–housing ratio (Giuliano and Small, 1993), job accessibility has the highest negative correlation with commuting distance and commuting duration (Shen, 2000; Kawabata and Shen, 2016). Some studies also find that the jobs–housing ratio has a high explanatory level to commuting duration and commuting distance (Yang and Ferreira, 2008; Hu and Wang, 2016). The further the place is from the CBD, the more relaxed the traffic conditions will be, and the higher the proportion of car commuting. Thus, the higher the travel speed, the shorter the commuting duration (Sun et al., 2013; Hu and Wang, 2016). However, the conclusions are not entirely consistent (Wang, 2001). The bigger the population size is, the more traffic congestion will occur, which will lead to slower travel speed and further lengthening of the commuting duration. However, areas with high population and employment density tend to pursue the compact development of mixed land use, and better public transport conditions can improve job accessibility, thus shortening the commuting duration (Sun et al., 2016). At the same time, commuting behavior is also affected by other socioeconomic factors, such as regional development level, population, and occupation composition. Economic development and industrial structure positively affect commuting duration (Li and Lu, 2018). There is a significant positive correlation between the proportion of highly skilled labor and commuting duration (Sultana, 1990). The higher the ratio of public transport trips, the higher the commuting duration (Kawabata and Shen, 2016).
Previous studies lay a solid foundation for understanding commuting behavior and its spatial variations. However, existing studies mainly concentrated at the city level in developed countries. The attention to intra-urban spatial variations of commuting is primarily in western developed countries (Growth and Change, 2004). China has its unique urban spatial structure. On the one hand, Chinese cities are defined in terms of administrative districts, and their geographic area is much larger than those of cities in western countries (Li K. et al., 2021)—for example, the area of Shanghai is 6,340 km2, while such a geographic area in western countries can be cities, regions, or metropolitan areas. On the other hand, cities in China have lower levels of employment suburbanization and polycentricity than cities in western countries (Hu et al., 2019). Differences in urban connotation and structure determine that the experience of Western countries cannot be directly applied. It is urgent to research commuting behavior and its spatial variations in Chinese cities. Furthermore, there is a lack of geographic study on commuting behavior from the integrated perspective of social and spatial dimensions in developing countries. Previous studies have investigated social factors or spatial factors separately. However, they have not considered both social and spatial influences in one study and failed to compare the difference in the degree of influence of the two types of factors. In addition to the traditional spatial mismatch theory, some scholars have proposed non-geographic spatial mismatches, such as vehicle mismatch and skill mismatch (Taylor and Ong, 1995; Ong and Miller, 2005; Stoll, 2005). It indicates that, as essential factors of commuting behavior, non-spatial variables cannot be ignored. Lastly, as location is a crucial factor affecting commuting, using ordinary regression and ignoring spatial autocorrelation may underestimate or overestimate the effect of some factors, causing specific impacts on result authenticity.
The contribution of this study to the literature includes providing empirical evidence for spatial variations of intra-urban commuting behavior in China, including both commuting time and commuting distance, exploring the impact of both spatial factors and social factors on commuting behavior while examining their relative importance. Moreover, this paper constructed a spatial econometric model to assess the spatial autocorrelation of commuting behavior instead of the ordinary least squares (OLS) model.
The following section provides the study areas, data sources, and methods. Section 3 demonstrates the results. Section 4 discusses four commuting categories and their implications. Section 5 summarizes the conclusions.
2 Data and Methods
2.1 Study Areas and Data Sources
Shanghai has 25 million permanent residents, which makes it the biggest city in China (Li K. et al., 2021). It is also home to heavy traffic and long commuting duration (Figure 1). Given regional continuity, the study area is limited to the 196 sub-districts (Jiedao or Town) in Shanghai metropolitan area other than Chongming District (Figure 2). Our commuting data comes from the 1% National Population Sample Survey in 2015, which, for the first time, targets the population of prefecture-level cities and municipalities divided into districts and adds a survey item on the workplace. This survey takes Shanghai as a whole and each district as a sub-group, adopting the stratified, multi-stage, and cluster probabilistic sampling method. The sample population of the survey is nearly 0.7 million residents, accounting for nearly 3% of the total population in Shanghai. The purpose of this study is to analyze intra-urban commuting behavior, so the individuals studied in this paper include people who live and work in Shanghai, while individuals who only work and do not live in Shanghai are not included in the scope of the study. The count of employed people living in Shanghai was 12.47 million, among which 12.39 million are working here. Due to the absence of some data from the Songjiang Industrial Zone, the final sample size is 195 sub-districts.
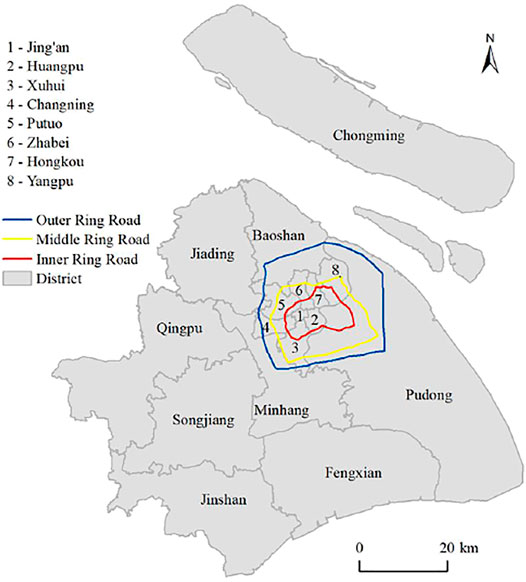
FIGURE 1. The division of Shanghai at district level.
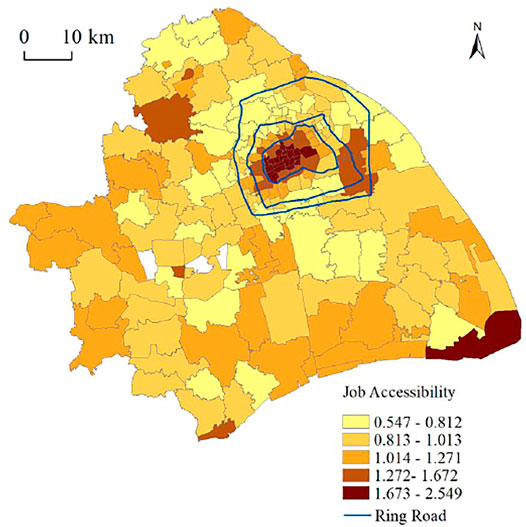
FIGURE 2. Job accessibility of Shanghai at sub-district level.
Table 1 shows the dependent and independent variables. The dependent variable is the average commuting distance and average commuting duration of each sub-district. A comprehensive reference for previous studies and related data, there are two main types of variables—first, spatial variables: job–housing spatial relationship is one of the crucial factors affecting commuting behavior. At the same time, jobs have the characteristics of agglomeration distribution, which is generally distributed in the downtown area and suburban job centers. Therefore, this study adopts five variables, namely, job density, worker density, distance from the CBD, job accessibility, and sub-area (central city/suburb), to represent the spatial dimension of Jiedao; second, social dimension variables: commuting is affected by socioeconomic attributes, both at the individual level and the city level. At the individual level, the commuting behavior has been extensively researched (Ma and Banister, 2006), and a series of theoretical models have been generated, such as job search models (Rouwendal, 2004). Recent studies showed that employees spend 7.22 more minutes per day commuting than their self-employed counterparts in the United States (Gimenez-Nadal et al., 2018). At the city level, studies in western developed countries showed that commuting duration is closely related to socioeconomic variables, such as average income level (Shen, 2000), average education level (Watts, 2009), occupation composition (Sang et al., 2011), gender (McQuaid and Chen, 2012), etc. Six variables were used to represent the social dimension of Jiedao, including average education level, the proportion of families with private cars, the ratio of local workers with Hukou, the proportion of workers who rent a house, and the proportion of highly skilled occupations. Hukou is a system of household registration used in China. A household registration record officially identifies a person as a permanent resident of an area and includes identifying information, such as name, parents, spouse, and date of birth (Afridi et al., 2015). Among the above-mentioned independent variables, job density and worker density, average education level, and the ratio of high-skilled occupations have a high collinearity, so the two variables of worker density and the proportion of high-skilled occupations are deleted.
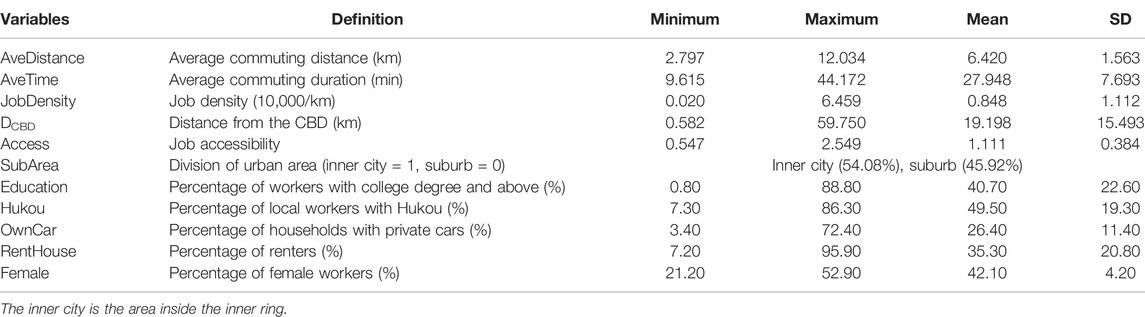
TABLE 1. Descriptive statistics of variables.
2.2 Methods
2.2.1 Job Accessibility
Accessibility refers to the degree to which it is easy for a location to obtain spatial distribution opportunities (Hansen, 1959). Various measurement methods are based on spatial separation opportunity accumulation and spatial interaction (Liu and Gu, 2008). Compared with shopping malls, jobs are spatially competitive (A.Merlin and Hu, 2017). Therefore, this study is based on the improved measurement method of the Hansen Model proposed by Shen (Shen, 1998). Its expression is as follows:
where
2.2.2 Spatial Autocorrelation Analysis
1) Global Moran’s I is used to describe commuting behavior’s overall spatial distribution pattern to judge whether it has agglomeration in space (Anselin, 1995). The formula is as follows:
where n is the count of Jiedao,
2)Local spatial autocorrelation analysis (local Moran’s I) can effectively describe the spatial correlation between Jiedao and its neighbors. It is a local spatial autocorrelation statistic that identifies local clusters or local outliers to understand their contribution to the “global” clustering statistic (Anselin, 1995). It offers insight into the behavior of data at local levels by providing a decomposition of the Moran’s I global statistic into the degree of spatial association associated with each observation. The spatial clusters detected by the local Moran’s I can be divided into four types: high–high (HH, high-density units surrounded by high-density units), high–low (HL, high-density units surrounded by low-density units), low–high (LH, low-density units surrounded by high-density units), and low–low (LL, low-density units surrounded by low-density units). The formula is as follows, and the meanings of all variables are the same as those in Eq. 4.
2.2.3 Spatial Regression Analysis
There are four types of spatial econometric models applied to compare the spatial interaction of driving factors among spatial units, namely, spatial lag model (SLM), spatial error model (SEM), spatial Durbin model (SDM), and spatial Durbin error model (SDEM), which are linked with different setting modes of spatial interaction (LeSage and Pace, 2009). The SLM emphasizes more on the spatial correlation of the variables among the spatial units and inspects its spatial spillover effect, while the SEM inspects mainly the influencing degree of variable error on observation values. The SDM and SDEM combine the characters of SLM and SEM (LeSage, 2014). They can inspect the spatial effect and influence of variable error on observation values then achieve a better estimation effect (LeSage and Pace, 2009). The advantage of SDM and SDEM is that they can provide the estimative value of the coefficients of indirect and direct effects. However, because SDM and SDEM are embedded in explanatory variables and explained variable of spatial lag, they cannot reflect the marginal effect (spillover effect) directly and cannot measure the direct impact of the independent variables on the dependent variable (LeSage and Pace, 2009; Elhorst, 2014). Since the spatial distribution of commuting behavior has solid spatial dependence and it is significantly affected by spatial and social factors (Lee and Yu, 2010), this paper chose SLM and SEM to identify the impact of different factors on commuting behavior.
The SLM model is used to test whether a variable has a spatial spillover effect. The dependent variable of a spatial unit is affected by the independent variable within the unit and related to the dependent variable of adjacent spatial units. The model is as follows:
where
The SEM model is a spatial autoregressive model based on the standard regression model, which deals with the spatial dependence of error terms. The model is as follows:
where λ is the spatial autoregressive coefficient of the error term, which measures the spatial dependence of the error term, and μ is a random error term.
3 Results
3.1 The Spatial Variations of Commuting Distance
At the sub-district scale, the average commuting distance in Shanghai Metropolitan Area is 6.40 km. The median is 6.32 km, the standard deviation is 1.56 km, and the minimum is 2.79 km in East Nanjing Road Jiedao. The maximum is 12.03 km of Nicheng town, 52% Jiedao below average. From Figure 3A, Jiedao within the inner ring road benefited from abundant job opportunities and higher accessibility, and the value of their commuting distance is low. By contrast, due to the excess of workers and low job accessibility, the commuting distance value of sub-districts near the outer ring road is high. The commuting distances on most outer suburban remained relatively high. This result indicated a significant spatial variation of commuting distance within the city, which is also observed in the study in San Francisco (Kawabata and Shen, 2016).
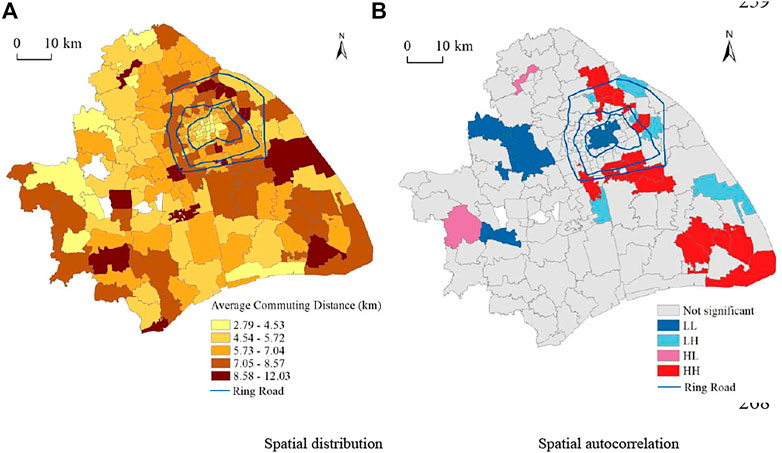
FIGURE 3. Spatial pattern of commuting distance in Shanghai Metropolitan Area. (A) Spatial distribution and (B) spatial autocorrelation.
Global Moran’s I is 0.342, significant at 0.01 level, indicating that commuting distance has a critical spatial positive correlation at the sub-district scale. Figure 3B is the result of local autocorrelation analysis. High–high agglomeration areas are scattered across Yangpu, Baoshan, and Pudong District. These are primarily residential areas, and job accessibility is lower than the average level in Shanghai. The employed population size in these areas is far more significant than the job size, so the surplus employed population is forced to commute long distances, increasing their average commuting distance. Low–high agglomeration areas are mainly distributed in suburban job centers near high–high regions, such as Wujing Town and Jinqiao Town. Abundant job opportunities are located in these areas compared with the surrounding sub-districts. Workers of these Jiedao were mainly employed in their own Jiedao, while excess jobs also attract workers from the surrounding high–high-type Jiedao into commuting. Low–low type areas are primarily concentrated in sub-districts within the inner ring road with higher job accessibility. The scale of work is much larger than the scale of workers. Most of these areas are renters engaged in production, living, and service industries and employed near residential areas.
3.2 The Spatial Variations of Commuting Duration
The average commuting duration at the sub-district scale in Shanghai Metropolitan Area is 27.94 min, the median is 28.37 min, and the standard deviation is 7.69 min. The minimum is 8.88 min in Xinbang Town, and the maximum is 44.17 min in Linfen Jiedao, and 48% of the sub-districts are lower than the average. As shown in Figure 4A, the sub-districts with short commuting duration are mainly distributed in areas beyond 20 km from the CBD. Commuting duration in areas within 15 km from the CBD shows a rapid increase, and it rapidly drops to the lowest level from the outer to the inner within 10–20 km, but it still shows a slowly declining trend in areas beyond 20 km. Among them, sub-districts with higher commuting duration than the average are mainly distributed in the range of 3–18 km. The high-value areas are located near the middle ring road; taken as the cutoff point from anywhere to the inner city and the periphery, commuting duration presents an apparent downward trend. This result is different from the previous study, which emphasized that, as the distance from the CBD increases, the proportion of cars commuting will increase and the commuting duration will be shortened (Sun et al., 2013; Hu and Wang, 2016). These sub-districts with high commuting duration belong to high-density agglomeration areas of jobs and workers, a typical traffic jam place.
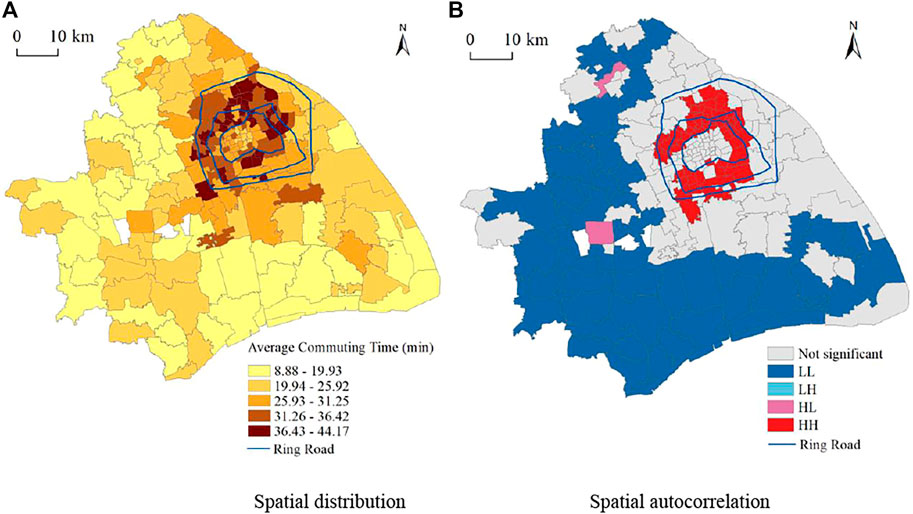
FIGURE 4. Spatial variations of commuting duration in Shanghai Metropolitan Area. (A) Spatial distribution and (B) spatial autocorrelation.
Global Moran’s I is 0.678 higher than that of commuting distance, which indicates that the distribution of commuting duration has a very high spatial agglomeration feature. Figure 4B is the result of the Lisa diagram; high–high agglomeration areas are located near the middle ring road, and we can divide them into two types. The first type has slow travel speed caused by traffic congestion, such as Yichuan Jiedao, Kongjiang Jiedao, and Jiangpu Jiedao. Such areas have lower commuting distances but higher population and job density. The other type has low job accessibility caused by long commuting distance, such as Songnan Town and New Jiangwan Jiedao. This type focuses on living functions, its job density is low, and its commuting distance exceeds 9 km. Low–low aggregation areas are continuously distributed in outer suburbs, such as Songjiang, Qingpu, and Fengxian districts, where the commuting distance is lower than the average, coupled with the calm traffic conditions and private car commuting so that commuting duration is short. The other two categories have no prominent distribution areas.
3.3 The Impact Factors of Commuting Distance
The OLS model results of commuting distance are shown in Table 2. OLS 1 and 2 models, respectively, discuss the impacts of spatial and social factors. From R2, LL, and Akaike information criterion (AIC), it can be seen that social factors have a higher explanatory power, which indicates that social factors are essential factors that cannot be ignored in urban commuting distance analysis. The error of Moran’s I in the OLS 3 model, considering both spatial and social factors, is 5.576, which is significant at 1% level, indicating that residuals have a certain level of spatial dependence and do not conform to the traditional OLS assumptions. Therefore, it is necessary to use a spatial econometric model. All test statistics of the SEM are better than those of the SLM, such as (LM), R2, LL, and AIC (Table 3).
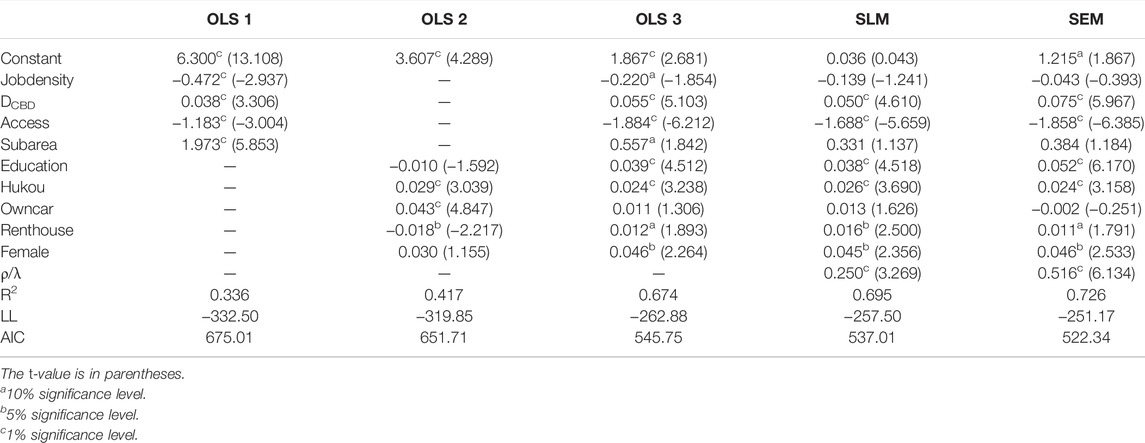
TABLE 2. Model results of commuting distance.

TABLE 3. Model results of commuting duration.
As for the impact factors of commuting distance, these are negatively correlated with job accessibility while positively correlated with distance from the CBD. By comparing the t-value, job accessibility is an essential negative spatial factor affecting commuting distance. Job accessibility means more job opportunities, making it easier to obtain local employment and thus shortening the commuting distance. Distance from the CBD is the most critical positive spatial factor. On the one hand, from the CBD to the outskirts, the population and employment decentralization is more prominent, showing a high level of job–housing separation. On the other hand, most residents living in the outer areas still commute centripetally, which means that the farther away from the CBD, the longer the workers commute.
Except for the variable of OwnCar and RentHouse, other social factors are significantly positively correlated with commuting distance, while education level is the most critically positive social factor. According to existing studies (Cassel et al., 2013), high-quality jobs are more concentrated, and those with a high education level need to search for employment in a broader space to find satisfactory work. Meanwhile, because of the high income, commuting distance is not the primary consideration for well-educated workers. Hukou is also a significant factor, which is not observed in western countries. Compared with local workers with Hukou, the migrant population has a lower cost of intra-city relocation. To save commuting costs, they are more inclined to live near the place of employment, so the commuting distance is shorter (Chai et al., 2000; Liu and Yan, 2007; Wu et al., 2019). According to the SEM model, RentHouse is not a significant factor. The percentage of renters is slightly positively correlated with commuting distance, which is significant at 10% level. This is because renting behavior is not only related to commuting distance but also influenced by other factors such as rental costs (Li Y. et al., 2021).
3.4 The Impact Factors of Commuting Duration
All test indicators in the social factor model (OLS 5) are superior to the spatial factor model (OLS 4); R2 is 0.623 and 0.768, LL is −585.64 and −537.65, and AIC is 1,181.30 and 1,087.31, respectively. Meanwhile, comparing OLS 3 of commuting distance and OLS 6 of commuting duration, the impact of factors has more explanatory power due to LM and robust LM of SEM not passing the significance test, while that of SLM is significant. Combining R2, LL, and AIC, we analyze the results of SLM in the following discussion.
Except for the SubArea variable, other spatial variables have significantly negative impacts on commuting duration. Among them, job accessibility is the most critical factor. The higher the job accessibility, the shorter the commuting duration, which is consistent with the explanation of the commuting distance model. Regarding distance from the CBD, traffic congestion significantly reduces travel speed and thus increases the commuting duration for the central city with short commuting distance. This is consistent with previous studies which showed that the farther away from the CBD, the shorter the average commuting time in employment centers (Sun et al., 2013). In some other areas, long commuting distance is the cause of long commuting duration. However, most suburban residents work in their Jiedao, which have a short commuting distance.
Meanwhile, good traffic conditions provide higher travel speed and then shorten the commuting duration. This is similar to the findings of previous studies which emphasized that the commuting duration is due to high travel speed under car commuting and loose road conditions (Sultana, 1990; Sun et al., 2013). It is worth noting that the proportion of families with cars is positively correlated with commuting distance and negatively with commuting duration. This result indicates that, although car ownership can increase commuting distance, it can significantly reduce commuting duration, reflecting the city–individual commuting cost paradox. Under urban suburbanization and motorization, Shanghai’s commuting space expansion and long commuting distances bring severe problems, such as traffic congestion, and air pollution. However, for individual residents, commuting duration and cost borne by individuals do not increase significantly.
4 Discussion
4.1 The Similarities and Differences of the Impact Factors
The commuting distance and commuting duration are affected by many factors, and the influence of each factor reflects both similarities and differences (Table 4). The variables access, education, Hukou, and female have consistent effects on commuting distance and duration. On the one hand, education, Hukou, and female are significantly positively correlated with commuting distance and duration. People with a higher education level usually search for employment in a broader space to find satisfactory work, thus leading to the increase of commuting distance and duration. Compared with the migrant population, local workers with Hukou have a higher cost on housing relocation and a lower cost on job relocation, so they formed the dispersion of residences, leading to an increase in commuting distance and duration (Liu and Yan, 2007; Wu et al., 2019). A higher proportion of females at the sub-district level is positively correlated with an increase of commuting distance and duration. This is inconsistent with the findings of previous research (Li and Liu, 2016). One reason is that there are more single women in Shanghai who do not need to take responsibility for taking care of their families. On the other hand, access is significantly negatively correlated with commuting distance and duration. With the increase in employment opportunities, people are more inclined to work within a shorter spatial distance, resulting in a reduction in commuting distance and duration.
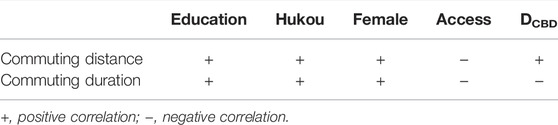
TABLE 4. The impact factors between commuting distance and commuting duration.
The distance from the CBD is positively correlated with commuting distance while negatively correlated with commuting duration. From CBD to the outskirts, the population and employment decentralization is more prominent; people living in the outer areas still commute centripetally, which means that the farther away from the CBD, the longer the commute distance. However, the traffic conditions and traffic structure in the suburb are good, and the commuting speed is higher than the average; thus, the commuting duration is relatively short (Sun et al., 2013).
The above-mentioned results fully demonstrate that there are significant spatial differences in commuting distance and duration within megacities. At the same time, this difference is affected by a variety of factors. Therefore, it is necessary to delineate commuting units according to the different commuting distances and duration in megacities and then take targeted optimization measures.
4.2 Policy Recommendations
According to the spatial heterogeneity of commuting behavior, policymakers can take targeted action strategies according to regional conditions to achieve urban traffic optimization. Using median commuting distance and duration, we try to classify Shanghai’s metropolitan areas into four categories (Figure 5): short distance and short duration (called friendly type), short distance and long duration (called congestion type), long distance and long duration (called sprawl type), and long distance and short duration (called suburban type). The friendly type is mainly distributed in sub-districts within the inner ring road and scattered in suburban sub-districts dominated by non-motorized commuting. The congestion type is primarily distributed in the periphery of the former type, while within the inner ring road, and caused by traffic congestion and slow travel speed. The sprawl type is located between the middle and outer ring roads. They are primarily residential areas with low job accessibility and centric commuting. The suburban type is mainly distributed in external suburban areas because traffic conditions are relatively better, and private cars account for many trips.
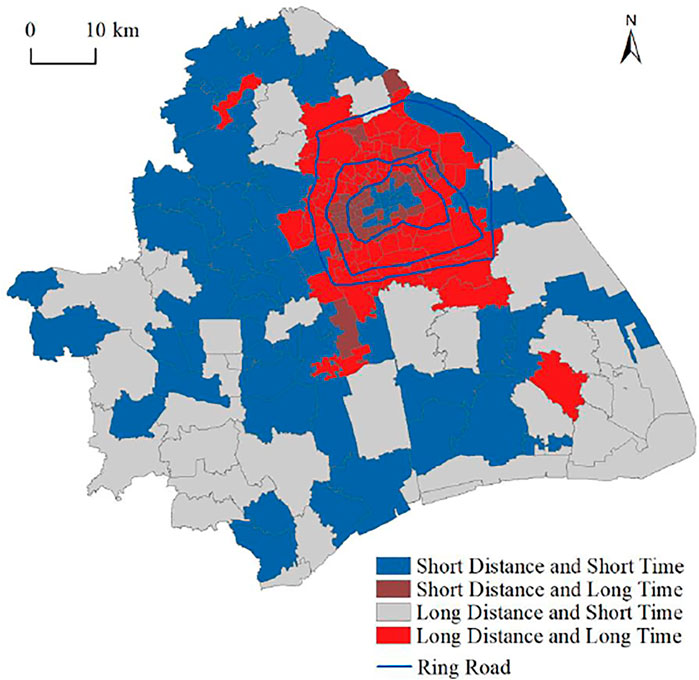
FIGURE 5. Classifications of commuting level in Shanghai Metropolitan Area.
Therefore, it is necessary to improve job accessibility in sub-districts with long commuting distances and achieve commuting optimization by shortening the commuting distance. Meanwhile, the spatial variations of the social dimension should also be fully taken into account. The social factor model indicates that high job accessibility is not sufficient for short commuting, and social factors will interfere with its effectiveness. For areas with short commuting distances but long commuting duration, policymakers should stick to “people-oriented” rather than “car-oriented”, convert from a single mode to a multi-mode of a complimentary transportation system, and increase the opportunities for residents to choose commuting modes, giving full play to the advantages of walking and cycling and creating a safe and comfortably built environment for non-motorized commuting.
4.3 Limitation and Future Research
There are still some limitations in this study. Because the selected spatial analysis unit is a relatively large sub-district, it ignores the heterogeneity of the built environment and the social and economic attributes of the population at the community scale. Since commuting behavior is affected by roads and transportation infrastructure, future research should add more relevant indicators. In addition, the commute distance uses a straight line distance rather than an actual distance. In future research, we will combine big data and survey data to evaluate the influencing factors of commuting behavior. What is more, the SLM model is based on the assumption that the ratio of indirect to direct effects is the same for each explanatory variable; it will be a certain error between the obtained result and the actual condition (LeSage and Pace, 2009; Elhorst, 2014; LeSage, 2014). In future research, we will use other methods to analyze the impact of different factors more accurately.
5 Conclusion
The surge in commuting duration and commuting distance will affect cities’ sustainable development and negatively impact residents’ daily lives. Since commuting duration and distance have different sensitivities to urban spatial patterns and social factors, their spatial variations and the impact of factors being studied will help develop more effective and reasonable transportation optimization policies and measures. Using spatial autocorrelation analysis and spatial econometric model, this study compares the spatial variations of commuting behavior and the impact of different factors on commuting duration and commuting distance based on 2015 1% Population Sample Survey data in Shanghai. The results are presented in the following discussion.
Firstly, the median commuting distance and commuting duration are 6.32 km and 28.37 min, respectively. Both of them have significant spatial autocorrelation, and the latter is higher. The high-value agglomeration areas of commuting distance scatter between the outer ring road and the outer suburbs. In contrast, the low-value agglomeration areas are mainly distributed in suburban job centers near high-value areas. The high-value agglomeration areas of commuting duration are primarily distributed between the middle ring road and the outer ring road. In contrast, the low-value agglomeration areas are widely located in the outer suburbs.
Secondly, social factors had a high degree of explanation for commuting behavior, and the influence of spatial factors will be overestimated if social factors were ignored. According to test statistics, SEM is more suitable for commuting distance, and SLM is ideal for commuting duration. Job accessibility is the most critical spatial factor for commuting distance, while education level is the most important social factor. For the commuting duration, the proportion of local workers and education level are the most critical factors. This shows that spatial factors mainly affect commuting distance, while social factors primarily influence commuting duration.
Thirdly, according to the median value of commuting distance and duration, four commuting categories are classified: the friendly type, the congestion type, the sprawl type, and the suburban type.
The conclusions of this study confirm the intra-urban heterogeneity and spatial autocorrelation of commuting distance and duration in the metropolis. Besides spatial factors, social factors are considered to analyze their impact on commuting distance and duration. Four commuting categories are classified, and these can provide a reference for urban traffic planning and policy formulation and promote the jobs–housing balance.
Data Availability Statement
The original contributions presented in the study are included in the article/Supplementary Material, further inquiries can be directed to the corresponding author.
Author Contributions
As the lead author, KL initiated this study with an original idea, conducted the overall analysis, and wrote this article. LY, as the corresponding author, suggested appropriate methodologies for the global study. HG and KL provided help for data collection and data analyses. All authors have conducted data processing and other related work.
Funding
This research was funded by China Scholarship Council (grant 201806260232).
Conflict of Interest
The authors declare that the research was conducted in the absence of any commercial or financial relationships that could be construed as a potential conflict of interest.
Publisher’s Note
All claims expressed in this article are solely those of the authors and do not necessarily represent those of their affiliated organizations or those of the publisher, the editors, and the reviewers. Any product that may be evaluated in this article or claim that may be made by its manufacturer is not guaranteed or endorsed by the publisher.
Acknowledgments
We appreciate greatly the constructive comments and suggestions from reviewers.
References
Afridi, F., Li, S. X., and Ren, Y. (2015). Social Identity and Inequality: The Impact of China's Hukou System. J. Public Econ. 123, 17–29. doi:10.1016/j.jpubeco.2014.12.011
Alonso, W. (1964). Location and Land Use: Toward a General Theory of Land Rent. Cambridge Massachusetts: Harvard University Press.
Anas, A. (2014). Why Are Urban Travel Times So Stable? J. Reg. Sci. 55 (2), 1–32. doi:10.1111/jors.12142
Cassel, S. H., Macuchova, Z., Rudholm, N., and Rydell, A. (2013). Willingness to Commute Long Distance Among Job Seekers in Dalarna, Sweden. J. Transport Geogr. 28, 49–55. doi:10.1016/j.jtrangeo.2012.10.011
Chai, Y., Hu, Z., and Wu, Z. (2000). On Characteristics and Mechanism of Intra-urban Residents' Migration in Tianjin City. Geographical Res. 19 (4), 391
Fan, Y., Khattak, A., and Rodríguez, D. (2010). Household Excess Travel and Neighbourhood Characteristics. Urban Stud. 48 (6), 1235–1253. doi:10.1177/0042098010369712
Giuliano, G., and Small, K. A. (1993). Is the Journey to Work Explained by Urban Structure? Urban Stud. 30 (9), 1485–1500. doi:10.1080/00420989320081461
Haixiao Pan, P., Qing Shen, S., and Ming Zhang, Z. (2009). Influence of Urban Form on Travel Behaviour in Four Neighbourhoods of Shanghai. Urban Stud. 46 (2), 275–294. doi:10.1177/0042098008099355
Hansen, W. G. (1959). How Accessibility Shapes Land Use. J. Am. Inst. Planners 25, 73–76. doi:10.1080/01944365908978307
Hu, L., Yang, J., Yang, T., Tu, Y., and Zhu, J. (2019). Urban Spatial Structure and Travel in China. J. Plann. Lit. 35 (1), 6–24. doi:10.1177/0885412219853259
Hu, Y., and Wang, F. (2016). Temporal Trends of Intraurban Commuting in Baton Rouge, 1990–2010. Ann. Am. Assoc. Geogr. 106 (2), 470. doi:10.1080/00045608.2015.1113117
Hu, Y., Wang, F., and Wilmot, C. G. (2016). Commuting Variability by Wage Groups in Baton Rouge, 1990-2010. Pap. Appl. Geogr. 3 (1), 14–29. doi:10.1080/23754931.2016.1248577
Ignacio Gimenez-Nadal, J., Molina, J. A., and Velilla, J. (2018). The Commuting Behavior of Workers in the United States: Differences between the Employed and the Self-Employed. J. Transport Geogr. 66, 19–29. doi:10.1016/j.jtrangeo.2017.10.011
Jiawen Yang, J. (2008). Policy Implications of Excess Commuting: Examining the Impacts of Changes in US Metropolitan Spatial Structure. Urban Stud. 45 (2), 391–405. doi:10.1177/0042098007085969
Kawabata, M., and Shen, Q. (2016). Commuting Inequality between Cars and Public Transit: The Case of the San Francisco Bay Area, 1990-2000. Urban Stud. 44 (9), 1759–1780. doi:10.1080/00420980701426616
Lee, L.-f., and Yu, J. (2010). Some Recent Developments in Spatial Panel Data Models. Reg. Sci. Urban Econ. 40 (5), 255–271. doi:10.1016/j.regsciurbeco.2009.09.002
LeSage, J. P. (2014). What Regional Scientists Need to Know about Spatial Econometrics. Available at SSRN 44 (1), 13–32. doi:10.52324/001c.8081
Levinson, D., and Wu, Y. (2005). The Rational Locator Reexamined: Are Travel Times Still Stable? Transportation 32 (2), 187–202. doi:10.1007/s11116-004-5507-4
Li, J., and Lu, M. (2018). Will More People Increase Congestion in Cities?: An Empirical Study on Population and Commuting and Comparison between China and USA. Shanghai, China: World Economic Papers.
Li, K., Geng, H., Yue, L., Li, K., and Huang, L. (2021a). Spatial Differentiation Characteristics and Driving Mechanism of Rural Settlements Transformation in the Metropolis. Shanghai: A Case Study of Pudong District. doi:10.3389/fenvs.2021.755207
Li, M., Kwan, M.-P., Wang, F., and Wang, J. (2018). Using Points-Of-Interest Data to Estimate Commuting Patterns in central Shanghai, China. J. Transport Geogr. 72, 201–210. doi:10.1016/j.jtrangeo.2018.09.004
Li, S.-m., and Liu, Y. (2016). The Jobs-Housing Relationship and Commuting in Guangzhou, China: Hukou and Dual Structure. J. Transport Geogr. 54, 286–294. doi:10.1016/j.jtrangeo.2016.06.014
Li, Y., Geertman, S., Hooimeijer, P., Lin, Y., and Yang, H. (2021b). Do migrants and Locals Differ in Commuting Behavior? A Case Study of Xiamen, China. Transport Policy 108, 1–10. doi:10.1016/j.tranpol.2021.04.020
Liu, W., and Yan, X. (2007). Comparison of Influencing Factors for Residential Mobility between Different Household Register Types in Transitional Urban China: A Case Study of Guangzhou. Geographical Res. 26 (5), 1055–1066. doi:10.11821/yj2007050022
Liu, X., and Gu, C. (2008). Decoding Urban Land-Use Spatial Structure: A Case Study on the City of Nanjing. Urban Plann. Forum, 90. doi:10.16361/j.upf.200805078
Liu, Y., Chen, L., An, Z., and Liu, C. (2019). Research on Job-Housing and Commuting in Wuhan Based on Bus Smart Card Data. Econ. Geogr. 39 (2), 93. doi:10.15957/j.cnki.jjdl.2019.02.011
Ma, K. R., and Banister, D. (2006). Excess Commuting: A Critical Review. Transport Rev. 26 (6), 749–767. doi:10.1080/01441640600782609
McQuaid, R. W., and Chen, T. (2012). Commuting Times - the Role of Gender, Children and Part-Time Work. Res. transportation Econ. 34 (1), 66–73. doi:10.1016/j.retrec.2011.12.001
Merlin, L., and Hu, L. (2017). Does Competition Matter in Measures of Job Accessibility? Explaining Employment in los angeles. J. Transport Geogr. 64, 77. doi:10.1016/j.jtrangeo.2017.08.009
Ong, P. M., and Miller, D. (2005). Spatial and Transportation Mismatch in Los Angeles. J. Plann. Educ. Res. 25 (1), 43–56. doi:10.1177/0739456x04270244
Pan, H., and Wang, Z. (2020). The Effects of Spatial Measurement Choice and Multidimensional Factors on Jobs-Housing Balance. Urban Plann. Forum (2), 25. doi:10.16361/j.upf.202002003
Rouwendal, J. (2004). Search Theory and Commuting Behavior. Growth and Change 35 (3), 391–418. doi:10.1111/j.1468-2257.2004.00254.x
Sang, S., O’Kelly, M., and Kwan, M.-P. (2011). Examining Commuting Patterns. Urban Stud. 48 (5), 891–909. doi:10.1177/0042098010368576
Schafer, A., and Victor, D. G. (2000). The Future Mobility of the World Population. Transportation Res. A: Pol. Pract. 34 (3), 171–205. doi:10.1016/s0965-8564(98)00071-8
Schleith, D., Widener, M., and Kim, C. (2016). An Examination of the Jobs-Housing Balance of Different Categories of Workers across 26 Metropolitan Regions. J. Transport Geogr. 57, 145–160. doi:10.1016/j.jtrangeo.2016.10.008
Shen, J., and Zhang, K. (2020). An Empirical Analysis of Factors Leading to Typical Urban Problems in China. Prog. Geogr. 39 (1), 1–12. doi:10.18306/dlkxjz.2020.01.001
Shen, Q. (1998). Location Characteristics of Inner-City Neighborhoods and Employment Accessibility of Low-Wage Workers. Environ. Plann. B 25, 345–365. doi:10.1068/b250345
Shen, Q. (2000). Spatial and Social Dimensions of Commuting. J. Am. Plann. Assoc. 66 (1), 68–82. doi:10.1080/01944360008976085
Stoll, M. A. (2005). Geographical Skills Mismatch, Job Search and Race. Urban Stud. 42 (4), 695–717. doi:10.1080/00420980500060228
Su, T. Y., Renda, M. E., and Zhao, J. H. (2021). Examining the Discrepancies between Self-Reported and Actual Commuting Behavior at the Individual Level. Transportation Res. Rec. 2676 (2), 118–131. doi:10.1177/03611981211037240
Sultana, S. (1990). Some Effects of Employment Centers on Commuting Times in the Atlanta Metropolitan Area. Southeast. Geographer 41 (2), 225.
Sun, B., and Dan, B. (2015). Impact of Urban Built Environment on Residential Choice of Commuting Mode in Shanghai. Acta Geographica Sinica 70 (10), 1664. doi:10.11821/dlxb201510010
Sun, B., Ermagun, A., and Dan, B. (2017). Built Environmental Impacts on Commuting Mode Choice and Distance: Evidence from Shanghai. Transportation Res. D: Transport Environ. 52, 441–453. doi:10.1016/j.trd.2016.06.001
Sun, B., He, Z., Zhang, T., and Wang, R. (2016). Urban Spatial Structure and Commute Duration: An Empirical Study of China. Int. J. Sustain. Transportation 10 (7), 638–644. doi:10.1080/15568318.2015.1042175
Sun, B., Tu, T., Shi, W., and Zhang, T. (2013). Test on the Performance of Polycentric Spatial Structure as a Measure of Congestion Reduction in Megacities: The Case Study of Shanghai. Urban Plann. Forum (02), 63–69. doi:10.16361/j.upf.2013020063
Taylor, B. D., and Ong, P. M. (1995). Spatial Mismatch or Automobile Mismatch? an Examination of Race, Residence and Commuting in US Metropolitan Areas. Urban Stud. 32 (9), 1453–1473. doi:10.1080/00420989550012348
Van Acker, V., and Witlox, F. (2011). Commuting Trips within Tours: How Is Commuting Related to Land Use? Transportation 38 (3), 465–486. doi:10.1007/s11116-010-9309-6
Wang, F. (2001). Explaining Intraurban Variations of Commuting by Job Proximity and Workers' Characteristics. Environ. Plann. B Plann. Des. 28 (2), 169–182. doi:10.1068/b2710
Wang, F. (2000). Modeling Commuting Patterns in Chicago in a GIS Environment: A Job Accessibility Perspective. The Prof. Geographer 52 (1), 120–133. doi:10.1111/0033-0124.00210
Watts, M. J. (2009). The Impact of Spatial Imbalance and Socioeconomic Characteristics on Average Distance Commuted in the Sydney Metropolitan Area. Urban Stud. 46 (2), 317–339. doi:10.1177/0042098008099357
Wu, X., Ning, Y., and Qiang, H. (2019). Residential Mobility Mode of Migrant Worker in Commercial Service Industry in Nanjing City: Based on the Integration Degree and Evolution Degree. Econ. Geogr. 39 (7), 39. doi:10.15957/j.cnki.jjdl.2019.07.006
Yang, J., and Ferreira, J. (2008). Choices versus Choice Sets: A Commuting Spectrum Method for Representing Job - Housing Possibilities. Environ. Plann. B Plann. Des. 35 (2), 364–378. doi:10.1068/b3326
Yin, C., Sun, B., He, Z., and Zhang, T. (2018). Influence of Urban Built Environment on Commuting Time and its Planning Implications. Urban Plann. 42 (8), 83. doi:10.11819/cpr20180813a
Keywords: commuting duration, commuting distance, intra-urban variations, spatial econometric model, impact factors, Shanghai
Citation: Li K, Yue L, Geng H and Li K (2022) Spatial Variations of Commuting Behavior and Their Impact Factors in Shanghai Metropolitan Area. Front. Built Environ. 8:789024. doi: 10.3389/fbuil.2022.789024
Received: 05 October 2021; Accepted: 17 February 2022;
Published: 12 April 2022.
Edited by:
Tao Liu, Peking University, ChinaReviewed by:
Shenjun Yao, East China Normal University, ChinaJiejing Wang, Renmin University of China, China
Copyright © 2022 Li, Yue, Geng and Li. This is an open-access article distributed under the terms of the Creative Commons Attribution License (CC BY). The use, distribution or reproduction in other forums is permitted, provided the original author(s) and the copyright owner(s) are credited and that the original publication in this journal is cited, in accordance with accepted academic practice. No use, distribution or reproduction is permitted which does not comply with these terms.
*Correspondence: Liying Yue, 52183500010@stu.ecnu.edu.cn