Assessing Wave Attenuation With Rising Sea Levels for Sustainable Oyster Reef-Based Living Shorelines
 Reza Salatin
 Hongqing Wang
 Qin Chen
 Ling Zhu1
- 1Department of Civil and Environmental Engineering, Northeastern University, Boston, MA, United States
- 2U.S. Geological Survey, Wetland and Aquatic Research Center, Baton Rouge, LA, United States
- 3Department of Marine and Environmental Sciences, Northeastern University, Boston, MA, United States
In densely populated coastal areas with sea-level rise (SLR), protecting the shorelines against erosion due to the wave impact is crucial. Along with many engineered structures like seawalls and breakwaters, there are also green structures like constructed oyster reefs (CORs) that can not only attenuate the incident waves but also grow and maintain pace with SLR. However, there is a lack of data and understanding of the long-term wave attenuation capacity of the living shoreline structures under SLR. In this study, we used the phase-resolving Boussinesq model, FUNWAVE-TVD, to examine the hydrodynamics including wave height and wave-induced currents around the CORs in the Gandys Beach living shoreline project area in the upper Delaware Bay, United States. Waves were measured at six locations (offshore to onshore, with and without CORs) in the Gandys Beach living shoreline project area for two winter months, during which four nor’easters occurred. We selected three cases that represent prevailing wind, wave, and tide conditions to examine the fine spatial and temporal changes in wave height and current velocity by the construction of the reefs. Wave heights and wave energy spectra generated from FUNWAVE-TVD were then validated with field observations. It is found that FUNWAVE-TVD is capable of simulating waves and associated hydrodynamic processes that interact with CORs. The model results show that wave attenuation rates vary with the incident wave properties and water depth, and wave-induced circulation patterns are affected by the CORs. The wave attenuation capacity of CORs over the next 100 years was simulated with the incorporation of the oyster reef optimal growth zone. Our study found that sustainable wave attenuation capacity can only be achieved when suitable habitat for COR is provided, thus it can vertically grow with SLR. Suitable habitat includes optimal intertidal inundation duration, current velocity for larval transport and settlement, on-reef oyster survival and growth, and other environmental conditions including salinity, temperature, and nutrient availability. Furthermore, the model results suggest that it would take CORs approximately 9 years after construction to reach and maintain the maximum wave attenuation capacity in sustainable living shorelines.
Introduction
Wind waves are one of the critical forces that cause shoreline erosion and retreat along coasts (Marani et al., 2011; Leonardi et al., 2016). With climate change and increasing sea levels, the threat of erosion and flooding along the coastlines is looming (Morris, et al., 2018). To prevent coastal shoreline retreat, traditional methods, such as seawalls, bulkheads, groins, and revetments have been used. These structures may not be sustainable because they are likely to be either overtopped or submerged as the sea-level rises and consequently lose their functionality as shoreline protection structures. An increasing number of green infrastructure or living shoreline structures (LSS) have been proposed and applied in coastal shoreline protection (Manson et al., 2018; Chowdhury et al., 2019; Morris et al., 2021; Polk et al., 2022). The specific LSS types include coastal vegetation, oyster reefs, seagrass, and coral reefs. These nature-based approaches can provide not only shoreline protection but also improve habitat suitability for fish and native wildlife species.
However, there is a lack of data on wave attenuation by LSS. Our understanding of LSS effects on wave processes and the controlling factors of sustainability remains incomplete, thus limiting the effectiveness of living shoreline projects for adaptive monitoring and management (Wang et al., 2021). Such data gaps and incomplete understanding of wave dynamics along living shorelines can be attributed to 1) insufficient wave monitoring stations along the shoreline to measure wave processes such as wave shoaling, reflection, refraction, diffraction, and breaking across LSS and detect local wave energy changes induced by individual structures over the project area with varying topography and bathymetry, and 2) short wave monitoring period (e.g., hours to a few days) that may not cover the critical wind, wave, and tide conditions (e.g., storms). Therefore, the project level and long-term effects of LSS on wave attenuation, or the sustainable wave attenuation capacity of LSS under climate change, could not be robustly assessed.
Oyster reef-based living shorelines are becoming increasingly popular because they can provide both wave attenuation and suitable habitats for oysters, fish, and other species (Rodriguez et al., 2014; Morris et al., 2019; Wang et al., 2021). They can artificially be built by stacking concrete blocks and letting the oysters grow on these blocks (Theuerkauf et al., 2015; Wang et al., 2021). Moreover, they are believed to be an effective alternative to the traditional and unsustainable coastal erosion defense structures (Morris et al., 2018, 2019). However, a growing number of coastal scientists and managers have noted the value of both engineering and ecological benefits in the design and implementation of living shoreline projects to achieve sustainable living shorelines (Morris et al., 2019; Fivash et al., 2021; Morris et al., 2021). Because, on one hand, constructed oyster reefs (CORs) need to maintain their height at an emergent elevation to ensure maximum wave attenuation, since wave attenuation capacity is closely related to the freeboard (the difference between water surface elevation and COR crest elevation) (Wiberg et al., 2019; Zhu et al., 2020). On the other hand, COR needs to grow vertically to maintain pace with SLR and maintain its crest elevation in the optimal growth zone (OGZ), which is the elevation range for oyster reefs with inundation duration of 60–80% (or 20–40% exposure) of the time (Ridge et al., 2015; Morris et al., 2021). Ridge et al. (2015) found that oyster reef growth is unimodal, relative to emergence with greatest growth rates occurring at 60–80% inundation duration, and zero-growth at >90% and <45% inundation duration. Thus, oyster life cycles including larval movement, recruitment, on-reef growth, reproduction, and mortality are considerations in these restoration plans (La Peyre et al., 2021).
In addition to the OGZ, current velocity is closely associated with LSS and would affect the oyster life cycle from larval transport, and settlement to on-reef survival and growth Currents affect sediment transport, eventually leading to sediment deposition and erosion along the shorelines. In addition, current velocity was found to be a critical factor affecting oyster larval transport and settlement, nutrient availability, oyster filtration, and oyster growth and mortality (Harsh and Luckenbach, 1999; Smith et al., 2009; Campbell and Hall, 2019; Theuerkauf et al., 2019; La Peyre et al., 2021; Lipcius et al., 2021). LSS-induced circulation patterns and current velocity changes are rarely investigated in assessing the effectiveness of oyster reef-based living shoreline projects. Although the impact of current velocities on various oyster life stages is still debated, it is found that a current velocity below 15 cm/s would be optimal for required nutrient delivery and oyster filtration (Theuerkauf et al., 2019).
Overall, the effectiveness of CORs as an alternative to traditional breakwaters is unclear due to the potential disconnects between the ecological and engineering functions of the reefs which may result in failure to optimize either of these goals (Morris et al., 2019). Moreover, the processes and mechanisms of oyster reef–induced wave attenuation are still not clear and therefore put a constraint on the assessment of their effectiveness for shoreline protection (Zhu et al., 2020; Wang et al., 2021). Zhu et al. (2020) and Wang et al. (2021) conducted field observations and analyzed the effectiveness of CORs based on field data. They obtained valuable insights into the wave attenuation capacity of CORs along a specific transect with a few in situ measurements for 2 months in 2018. Wang et al. (2022a) used the scientific machine learning techniques to extend the 2-month field observations in Gandys Beach to multiple years, allowing for an estimate of annual wave power to correlate with marsh edge erosion. No physics-based numerical model was used in their study. This study investigates the effectiveness of CORs through numerical modeling using FUNWAVE-TVD and quantifies the wave height changes in the entire simulation domain, including the area protected by CORs, under representative wave conditions. Field measurements are necessary and extremely valuable albeit at a limited number of locations. However, the phase-resolving model results provide insights into both the wave and current fields at any point of the domain with and without the presence of CORs. The validated numerical model can be used as a tool to isolate the effects of local bathymetric changes or structures like CORs on wave processes from other factors like wave shoaling and diffraction and thus, provide a holistic view of wave attenuation capacity of CORs compared to field measurements.
In this study, our objectives are to 1) calibrate and validate a numerical wave model with high spatial and temporal resolution for wave and current simulations in the Gandys Beach living shoreline area within upper Delaware Bay, United States; 2) quantify local wave attenuation with and without CORs; 3) examine wave-induced circulation patterns and current velocity changes with and without CORs; and 4) determine if the wave attenuation capacity of COR can be maintained under SLR by taking the OGZ and current velocity into consideration. Data and information from this study could be helpful for adaptive monitoring and management of the design and implementation of sustainable living shorelines under climate change and rising sea levels.
Materials and Methods
Study Area
A total of 914 m of living shoreline was constructed in 2016 to withstand future storms and reduce erosion along the shoreline between Money Island Marina and Gandys Beach, New Jersey, in upper Delaware Bay, United States (Wang et al., 2021). The study site is located near Gandys Beach as shown in Figures 1A,B. CORs (also called oyster castles, made of prefabricated concrete blocks) were constructed as a critical part of the living shoreline project. The CORs provide a segmented line of protection (Figures 1C,D) for the shoreline with blocks of 2.4–7.0 m in length, 0.5–0.9 m in width, 0.4–0.8 m in height, and an average gap of 3.9 m between the segments (Zhu et al., 2020). Fortescue Creek, NJ (Station ID: 8536931) is the closest tide station located 7 km to the southeast of the site. Considering the mean low water (MLW) as the datum, elevations of mean sea level (MSL), North American Vertical Datum (NAVD88), and mean high water (MHW) are 0.92, 0.93, and 1.78 m, respectively. Thus, the mean tidal range at this site is 1.78 m and the average elevation of the COR base is −0.01 m (MLW), meaning that CORs are emergent only in low tide conditions.

FIGURE 1. (A) Map showing the location of Delaware Bay between New Jersey and Delaware in the United States, (B) map showing the location of Gandys Beach and the Fortescue Creek station in Delaware Bay, (C) topography of Gandys Beach (NAVD88) and location of six wave gauges, and (D) detailed view of the CORs in Gandys Beach. CORs are named COR 1 to COR 5 from the uppermost COR downward. Six additional numerical wave gauges are placed around the CORs including Gap1–4, SeW, and ShW in FUNWAVE-TVD. Gap 1 to Gap 4 refer to the gaps between the COR segments, SeW is seaward of COR 2, and ShW is behind COR 2.
Field Data and Test Cases
Six wave gauges (Ocean Sensors Systems Inc., OSSI-010-003C) were deployed on the bed at the study site in 2018 (Wang et al., 2020). As illustrated in Figure 1C, wave gauge 3 (WG3) was the most offshore wave gauge used as the offshore boundary condition for the numerical experiment. Wave gauge 6 (WG6) was midway between WG3 and concrete blocks. Wave gauge 5 (WG5) was immediately behind the COR and was lying on the mud floor to assess the change in the energy of the waves passing over the concrete blocks. Wave gauge 1 (WG1) was also located shoreward of the concrete blocks on a marsh platform and was the least submerged wave gauge at the site. Wave gauge 2 (WG2) and wave gauge 4 (WG4) formed a reference transect parallel to the monitoring transect across CORs. Topography of the study area and the COR geometry were also surveyed during the deployment, checkup, and retrieval phases with a static global navigation satellite system (GNSS). The horizontal and vertical accuracies of the survey are 0.015 and 0.03 m, respectively.
Water pressure was recorded in 20-min bursts once every 30 min with a sampling frequency of 10 Hz. The pressure data were then converted to wave energy spectra using OCEANLYZ (Karimpour and Chen, 2017). The spectra computed from the measured data were used to obtain the zero-moment wave height
where
We selected three cases that represent prevailing wind, wave, and tide conditions to examine the fine spatial and temporal changes in wave height and current velocity by the construction of reefs. The three representative cases are selected from the measured time series in 2018 with nor’easters and are provided in Table 1. The peak wave period (
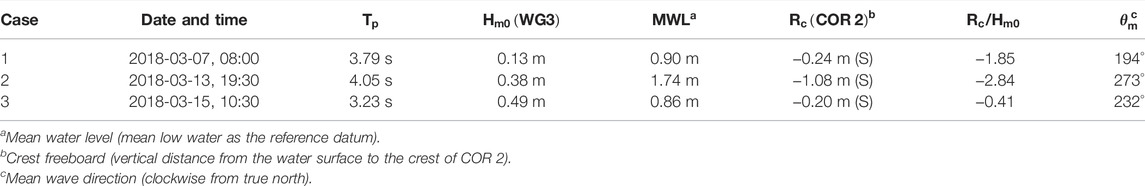
TABLE 1. Representative study cases.
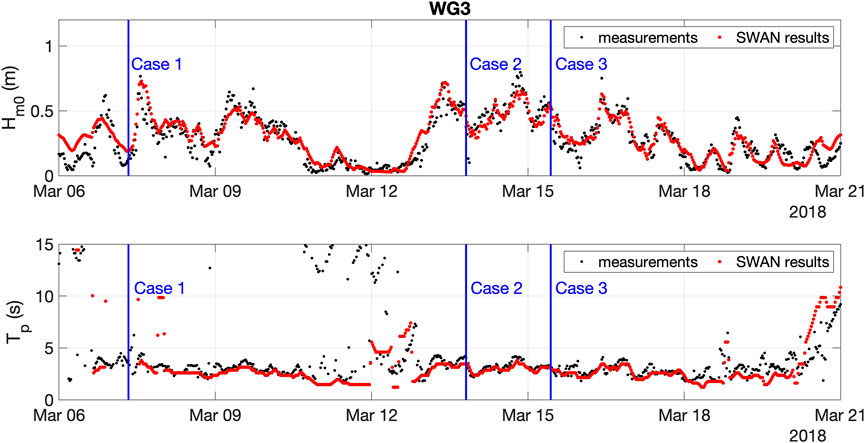
FIGURE 2. Time series of the measured and modeled (SWAN) Hm0 and Tp at offshore wave gauge (WG3). Three representative cases are denoted by the blue lines.
The selected cases are from March 2018, where energetic waves are due to nor’easters with heavy precipitation, destructive winds, and coastal flooding. The cumulative distribution functions for the zero-moment wave height as well as the peak wave period for the year 2018 are depicted in Figure 3. The selected
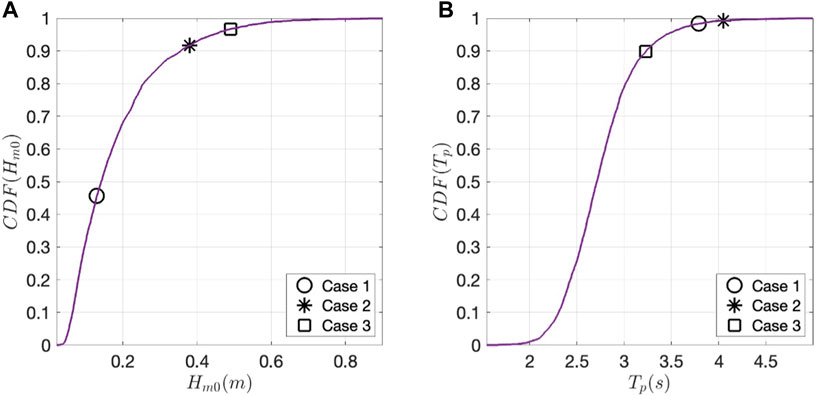
FIGURE 3. Cumulative probability distribution functions (CDF) for the (A) zero-moment wave height and (B) peak wave period for the year 2018 with the representative cases marked on the figure.
FUNWAVE-TVD
For living shorelines, wave processes interact with LSS (e.g., CORs), resulting in complex wave and current dynamics that occur across multiple temporal and spatial scales. Previous studies on wave attenuation along living shorelines (Wiberg et al., 2019; Wang et al., 2020; Zhu et al., 2020; Wang et al., 2021) did not provide detailed information on wave dynamics and circulation patterns affected by the living shoreline (e.g., salt marshes and oyster reefs). This is mainly due to the lack of data in field measurements. In the current study, we provide high spatial and temporal resolution information and analyses on nearshore wave processes along the living shoreline in Gandys Beach to understand the complicated flow field near CORs using the total variation diminishing (TVD) version of the fully nonlinear Boussinesq wave model, FUNWAVE-TVD (Shi et al., 2012). FUNWAVE-TVD integrates high-fidelity Boussinesq-type modeling of wave transformation, interaction, and response with a range of coastal structure properties; thus, it can be a robust and computationally efficient tool for the design of LSS in the context of wave and current energy attenuation. In this study, FUNWAVE-TVD is used to simulate the three representative cases.
The depth-integrated continuity equation of FUNWAVE-TVD is given as follows:
where
where
The outputs from FUNWAVE-TVD include high temporal and spatial resolution water surface elevation, wave height, and current field. The model inputs for this study were taken from the offshore wave gauge (WG3) deployed in Gandys Beach to record wave data over 2 months in the year 2018. This nearly 2-month period from February to March had four nor’easters (Zhu et al., 2020), allowing us to investigate the wave processes in the presence of CORs under storm conditions. Directional wave energy spectra for the representative cases are shown in Figure 4. These spectra are given as input to FUNWAVE-TVD. The input wave spectra are discretized with the method described in Salatin et al. (2021), which is a modified version of the Wei et al. (1999) wavemaker to avoid longshore variation of wave height due to wave coherence in the wave field.
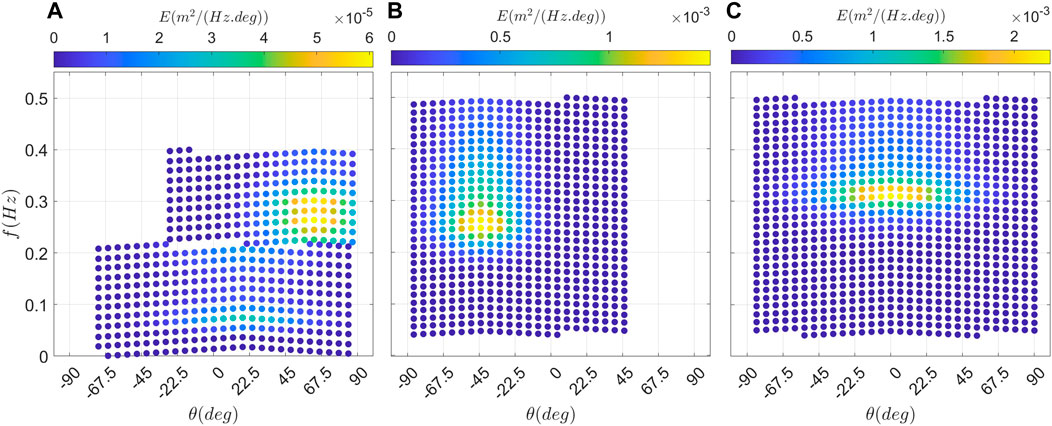
FIGURE 4. Wave energy spectra at the offshore boundary for (A) Case 1, (B) Case 2, and (C) Case 3.
In FUNWAVE-TVD, the simulation domain uses the bathymetry surveyed during the deployment and retrieval phases, which also includes the CORs as impermeable bathymetric features. The bathymetry is discretized with a grid size of 0.2 m in both directions. Lateral boundaries are set to periodic and the offshore boundary behind the wavemaker is equipped with sponges of 15 m length to dissipate the outgoing waves and prevent them from reflecting into the domain. Friction sponge with
The numerical simulation of FUNWAVE-TVD is run for 30 min for each case. The first 10 min of the simulation is considered as the spin-up to let the high-frequency waves arrive at the shoreline. Moreover, nearshore circulation also matures within the spin-up interval as the wave field becomes fully developed, thus giving a more accurate mean current field at the end of the simulation. Then, mean properties are obtained in the last 20 min of simulation, and that is equal to 317, 296, and 371 peak periods for Case 1, 2, and 3, respectively. In addition, to replicate the physical field setup of actual wave gauges, six numerical wave gauges are also included in the numerical model domain to obtain the water surface elevation and orbital velocities at the same locations of WG1-6. Like the field wave gauges, model wave gauges are also set to a sampling frequency of 10 Hz. The model results, including output wave energy spectra and wave heights, are then compared to field measurements for model validation. Since the current velocity in the field is composed of tidal- and wave-induced currents, and FUNWAVE-TVD only generates wave-induced currents, current velocity is not considered in model validation.
To investigate the effects of CORs on wave attenuation and the wave-induced current fields upon model validation against the measured field data, numerical experiments are conducted under the same offshore wave conditions and modified bathymetries, in which the CORs are intentionally removed. The two bathymetry settings are analyzed and wave heights and current fields in both bathymetry settings are compared. FUNWAVE-TVD’s ability to resolve the CORs and the wave-structure interaction with high resolution makes it possible to assess the wave height variations around CORs. Because FUNWAVE-TVD outputs the wave height and current field all over the domain with a high spatial and temporal resolution, it helps to understand the potential of CORs in wave height attenuation and nearshore circulation variations in a way that is not possible through in situ measurements with wave gauges and current meters deployed at a few locations.
FUNWAVE-TVD provides the spatial distributions of water surface elevation and wave-induced current in the whole domain. Root mean square wave height (
Optimal Growth Zone of Oyster Reefs
The OGZ is the best vertical elevation for the placement of COR for a successful growth of the oysters (Ridge et al., 2015; Morris et al., 2021). Figure 5 illustrates five cross-shore transects of the bathymetry with the COR segments. The green-shaded area refers to the OGZ (60–80% inundation duration) based on the water level data in 2018 (Wang et al., 2020). Pink-shaded areas refer to the range between the OGZ and critical exposure boundary (CEB), beyond which no oyster growth is expected (Ridge et al., 2015). CEB limits are 50 and 95% inundation time. MSL and MLW are also depicted with dash and dash-dotted lines, respectively. Based on the water level data in 2018, the upper half of CORs 1–4 and the lower half of COR 5 are within the OGZ.
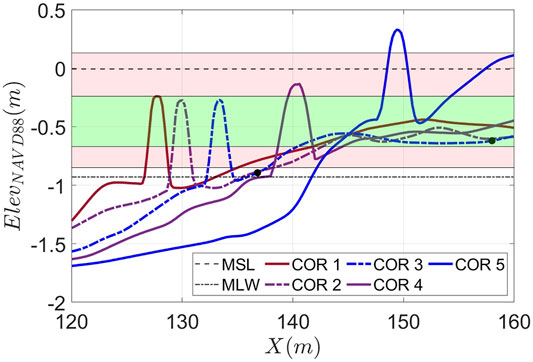
FIGURE 5. Cross-sectional view of the five COR segments, water levels (MSL and MLW), OGZ (green area), and the interval between OGZ and CEB (red area). Black dots denote the locations of WG5 (left) and WG1 (right).
To assess the wave attenuation capacity of CORs in 100 years with rising sea levels, multiple one-dimensional simulations using FUNWAVE-TVD are carried out with the bathymetry transect for COR 5 as shown in Figure 5. The simulations are carried out with the offshore wave properties of Case 3, since it has the largest wave height among the cases. Moreover, three water levels are used for the simulations, MSL, MHW, and the water level between MSL and MHW. Three different water levels help to assess the wave height attenuation capacity of COR with different freeboards. Since in one-dimensional simulations, waves would be completely blocked by COR under MLW conditions, this water level is not considered here. Then, to assess the effects of SLR on wave attenuation capacity of COR, these water levels are increased by the SLR rate of 0.5 cm/year (Rahmstorf, 2010) for 100 years. Each year’s simulation is run separately with constant wave properties, but with increased static water levels.
In addition, an alternative design for COR 5 is also proposed. In this design, COR 5 is removed from the bathymetry transect and a low-lying COR base with a height of 15 cm and width of three times COR 5’s width is placed in COR 5’s location. This alternative COR base is completely within the OGZ. According to Rodriguez et al. (2014), this alternative COR base would be an ideal location for the larval settlement and will allow the oysters to grow and flourish by itself. This COR base is designed to imitate the low-lying wide natural reefs. The water level and the new COR segment’s height and width increase each year in 100 years in the new bathymetry configuration. It is believed that the proposed oyster reef configuration would grow fast with a vertical growth rate of 9 cm/year in the initial year of construction and would reach the MSL in about 8 years (Rodriguez et al., 2014). Then, COR would vertically grow at the rate of the SLR (Rodriguez et al., 2014).
Results
Model Validation
To investigate the accuracy of the modeled result, measured wave data are compared to the FUNWAVE-TVD outputs of the three representative cases. The wave energy spectra obtained from the measured data and FUNWAVE-TVD are illustrated in the Supplementary Figures S2–S4 for Case 1–3, respectively. Moreover, the wave height to offshore wave height ratio for measured and modeled data in three cases are demonstrated in Figure 6. These wave heights correspond to the swell (0.04 < f < 0.14 Hz) and wind sea (0.14 < f < 0.5 Hz) bands of the spectra. In addition, the wave height to offshore wave height ratio for infragravity (0.004 < f < 0.04 Hz), swell, and wind sea bands of the spectra are also decomposed and shown in Supplementary Figure S5. For Case 1, the simulated wave heights are overestimated at WG1, 3, 5, and 6, by 19, 8, 29, and 16%, respectively, due to higher swell energy in the numerical model. Modeled wave heights at WG2 and 4 are underestimated by 6 and 22%, respectively, because of underestimated wind seas. For Case 1, the infragravity band is underestimated for all wave gauges. In Case 2, WG1 and WG5 are underestimated by 18, and 30%, respectively. WG2 and WG6 are overestimated by 7 and 40%, respectively. The inaccuracy in the modeled results is mainly because of the wind sea energy band. For Case 2, infragravity and swell band energies are underestimated in all wave gauges. Finally, in Case 3, wave energy in WG1, 2, 4, and 5 are underestimated by 16, 7, 13, and 4%, respectively. In this case, WG3 and WG6 are also overestimated by 4%.
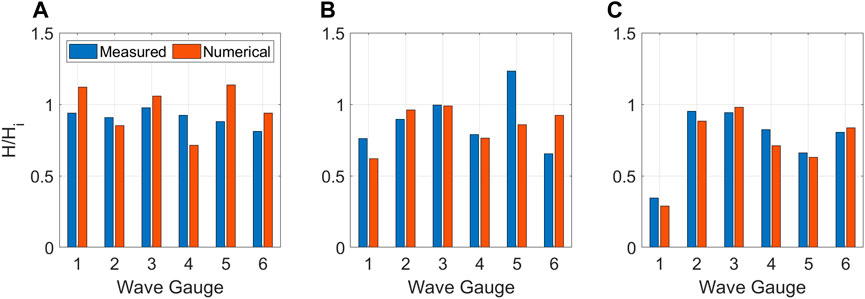
FIGURE 6. Comparison of wave height to offshore wave height ratio at WG1–6 between measured and modeled data for (A) Case 1, (B) Case 2, and (C) Case 3.
It should be noted that the mean wave direction and directional spreading of the input wave spectrum play an important role in nearshore wave processes. For this study, these properties were not gathered in the field work and thus, they are obtained from the SWAN model and might not be accurate. Recently, there have been some attempts to improve SWAN modeling with artificial neural networks (e.g., Wang et al., 2022b). The discrepancy between wave directions in field conditions and SWAN outputs can be one of the reasons for the difference between the measured and Boussinesq model wave heights. Measuring the wave directional spreading during the field work and using it as model inputs can increase the accuracy of the model in simulating the measured wave data.
Effects of COR on Wave Field
The original bathymetry used in this study includes CORs as impermeable bathymetric features. To better evaluate the effects of CORs on nearshore wave processes, the original topography is modified, and the CORs are removed from the bathymetry. The model is run with both bathymetries (original bathymetry and modified bathymetry without the CORs) and the results are illustrated in Figures 7–9. Figures 7A–C demonstrate the water surface elevation snapshots in the presence of CORs, whereas Figures 7D–F depict the water surface elevation snapshots in the absence of CORs at the end of 30-min simulation. Dark red lines in water surface elevation snapshots denote wave breaking. For Case 1, because wave height is small, waves do not break in the vicinity of CORs, and therefore, there is no significant difference between the two scenarios. In Case 2, due to higher water levels, waves do not break before reaching the shallower area close to WG4. Case 3 shows a notable difference between the two scenarios. For Case 3 with the CORs, as illustrated in Figure 7C, wave breaking is delayed compared to the same case without CORs in Figure 7F.
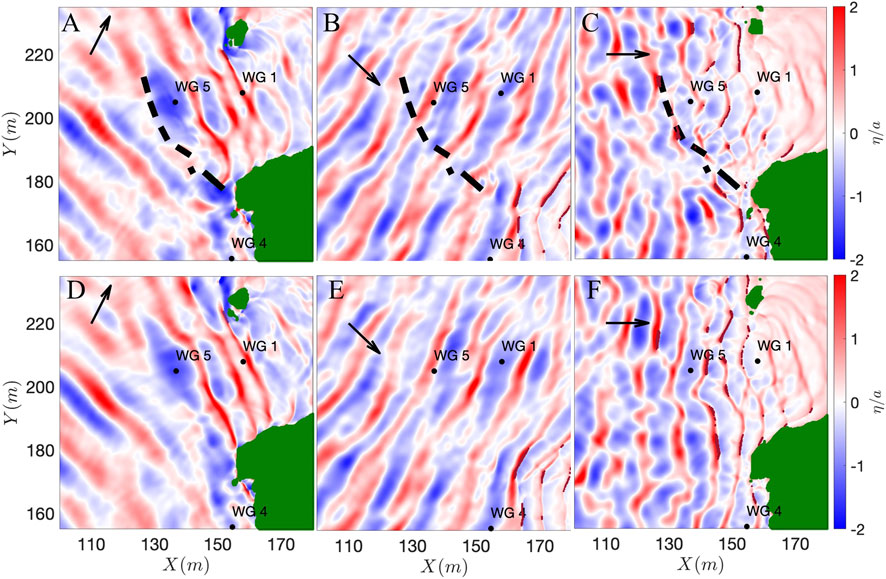
FIGURE 7. Water surface elevation snapshot to wave amplitude ratio for (A,D) Case 1, (B,E) Case 2, and (C,F) Case 3. In panels (A–C) CORs are present in the domain, while in panels (D–F) CORs are removed from the domain. Dark red lines on the figures denote wave breaking at those locations.
Field measurements show that wave attenuation strongly depends on the ratio between crest freeboard and the offshore wave height (Zhu et al., 2020). This ratio is illustrated for the three test cases in Table 1. For cases with ratios lower than -1.6, either a wave attenuation of 35% or wave amplification of 70% was observed from WG3 to WG5 in the field measurements since both wave breaking and wave shoaling concurrently occur. From WG5 to WG1, further wave attenuation also happened owing to depth-limited wave breaking. For the cases with the freeboard ratio larger than −1.6, an average wave attenuation of 41% was measured from WG3 to WG5 because of wave breaking and reflection. In this modeling study, Cases 1 and 2 fall within the first category with the ratios of −1.85 and −2.84, respectively. Case 3 corresponds to the latter with a ratio of −0.41. Note that Zhu et al. (2020) used the measured data along two cross-shore transects to estimate the wave attenuation rates from offshore to the nearshore, like the assumption made in simple one-dimensional (1D) models. Such an assumption is valid when the wave direction is parallel to the transects. However, if the incident waves propagate in a direction different from the monitoring and reference transects, a direct comparison of the wave height variations along the monitoring and reference transects might not give a correct estimation of the CORs’ efficacy in wave attenuation. The present modeling study reveals the complexity of the wave and current fields around the CORs.
Instead of assessing the CORs’ efficacy along cross-shore transects, wave height changes in an area with and without CORs are investigated in this study. Figures 8A–F demonstrate the spatial distributions of wave heights in the modeling area for Case 1–3. Figures 8G–I illustrate the ratio of the wave height change in the presence of CORs to the wave height in the absence of CORs in the study area. The red and blue colors mean an increase and decrease in wave height, respectively, when the CORs are present in the modeling domain. For Case 1 in Figure 8G, among the five COR segments, four of them have resulted in wave height increases in the protected area. The wave height amplifications at WG5 and WG1 locations are 10 and 5%, respectively. However, incident waves to COR 5, which was emergent, were reflected, and therefore, a 40% decrease in wave height behind it is seen. For Case 2 in Figure 8H, there is a 16% increase in wave height at WG5. However, at WG1, wave height decreases at a similar rate. In this case, wave direction is obliquely incident to the monitoring transect. Therefore, estimating the wave attenuation along the monitoring transect can lead to inaccurate attenuation rates. This illustrates the limitation of simple 1D models under field conditions. For Case 3 in Figure 8I, the COR reflects the incident waves and results in a 17% decrease of wave height at WG5. Wave height at WG1 remains roughly unchanged and behind COR 5, a 50% of wave height reduction is seen. Overall, the phase-resolving model validated by the in situ measurements provides a holistic estimation of the CORs’ efficacy in wave attenuation. In addition, the model can isolate the effect of CORs on the wave field from other nearshore processes included in the field data, such as wave refraction, reflection, diffraction, and depth-limited breaking. However, a larger number of cases will need to be simulated, which requires considerable computational costs.

FIGURE 8. Wave height to offshore wave height ratio for (A,D) Case 1, (B,E) Case 2, and (C,F) Case 3. In panels (A–C) CORs are present in the domain, while in panels (D–F) CORs are removed from the domain. Panels (G–I) illustrate the change of root mean square wave height due to CORs.
Effects of COR on Current Field
Figure 9 depicts the current field for three cases in two bathymetries with and without CORs. The colors of the figures denote the current velocity, and the arrows show the current velocity with directions. Current velocity plays an important role in the growth of the oysters. However, excessive current velocity might damage the oysters. Therefore, the threshold of 15 cm/s (Theuerkauf et al., 2019) is considered the limit of current velocity in Figure 9, and current velocities above this limit are shown with the same color as the limit.
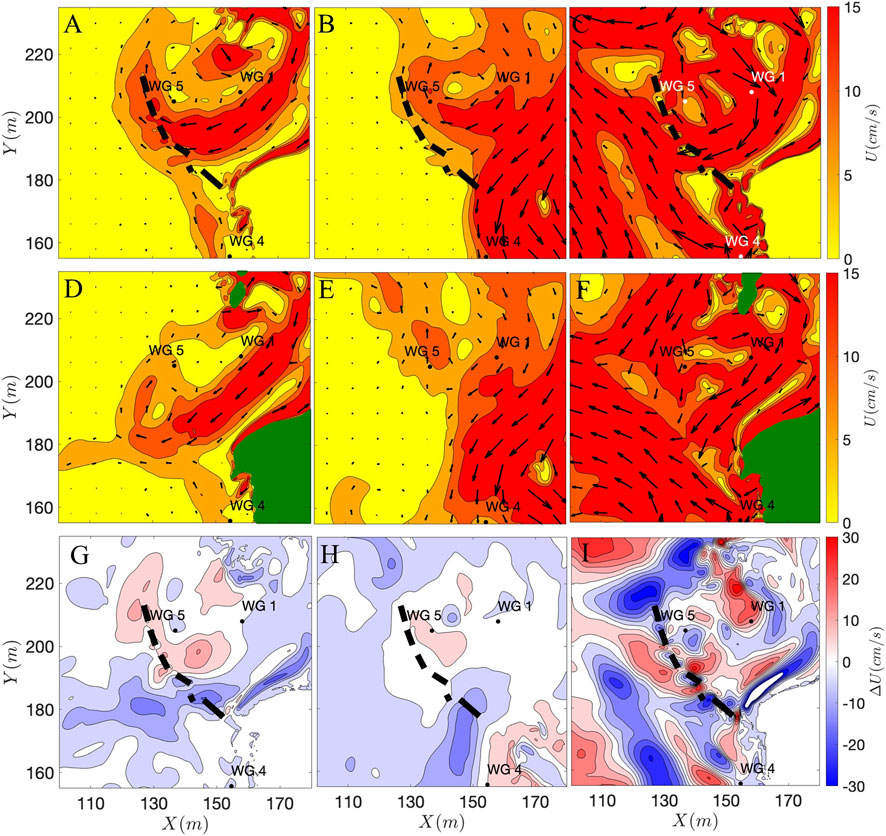
FIGURE 9. Wave-driven current velocity for (A,D) Case 1, (B,E) Case 2, and (C,F) Case 3. In panels (A–C) CORs are present in the domain, while in panels (D–F) CORs are removed from the domain. Panels (G–I) illustrate the change of wave-driven current velocity due to CORs.
For Case 1 in Figure 9A, CORs have resulted in the formation of a clockwise circulation pattern inside the protected area. For Case 1 in Figure 9D, current would flow seaward in the absence of CORs. Therefore, CORs increase the wave-induced current velocity inside the protected area close to WG5 and WG1 and decrease the wave-induced current velocity seaward of CORs as shown in Figure 9G. For Case 2 in Figure 9B, CORs have resulted in a similar clockwise circulation pattern with increased current velocity inside the protected area. From the current velocity change in Figure 9H, COR 5 blocks the current flow, and other COR segments generate the circulation pattern. However, negligible change of current velocity can be observed around the COR segments. Case 3 with flow patterns illustrated in Figure 9C and Figure 9F is complicated because of higher current velocities around CORs. Like Case 2, COR 5 again redirects the flow field into the protected area. Moreover, current velocity for Case 3 potentially exceeds the current velocity threshold for optimal oyster reefs growth. It is interesting to note that the wave-driven circulation behind CORs is clockwise regardless of different wave directions and water levels in the three cases.
While Figure 9 provides an overview of the current field, to better understand the effects of the CORs on the current velocity and circulation patterns in the protected area behind CORs, some numerical current meters are defined in addition to the numerical current meters at the locations of WG1 and WG5. These current meters are named Gap 1–4, SeW, and ShW, and are marked in Figure 1D. Gaps 1–4 refer to the current meters in gaps between COR segments and demonstrate the velocity of current flowing out of the protected area through the gaps. The high current velocity at these locations can damage the oysters settling in the vicinity of the gaps between COR segments. SeW and ShW refer to the current meters on seaward and shoreward of COR 2, respectively and illustrate the current velocity change in both sides of COR 2.
Figure 10 provides the current velocity for the three representative cases at these numerical current meters for two bathymetry configurations (with and without CORs). For Case 1 in Figure 10A, while CORs have increased current velocity in SeW, ShW, and Gap 1–3, compared to the bathymetry without CORs, current velocity hardly exceeds 15 cm/s limit. For Case 2 in Figure 10B, except for WG1 and WG2, current velocity is less than 5 cm/s for all other current meters. For WG1 and WG2, current velocity is higher than 10 cm/s but does not exceed the limit like Case 1. Moreover, CORs have not affected the current velocity at these locations significantly. For Case 3 in Figure 10C, current velocities in the gaps vary between 5 and 45 cm/s and can potentially be destructive to the oysters. In fact, except Gap 1 and WG5, current velocity exceeds the limit at all other current meters. At these locations, CORs have increased the current velocity. For example, in WG1 current velocity has doubled. Overall, CORs can either increase or decrease the wave-induced current velocity at different locations and sometimes, this increase can be large, harming the oyster reefs.
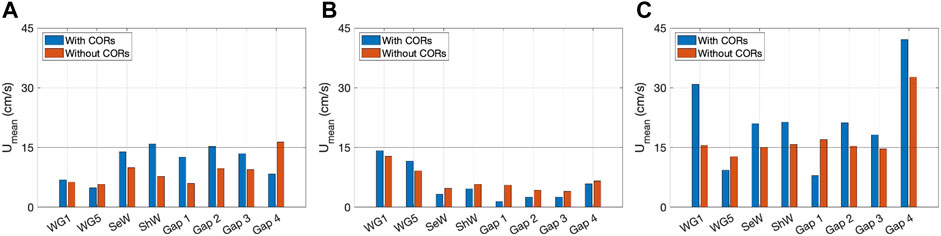
FIGURE 10. Comparison of the wave-driven current velocity averaged for 20 min for (A) Case 1, (B) Case 2, and (C) Case 3 for two bathymetry configurations.
Long-Term Wave Attenuation With SLR
To assess the long-term protection provided by the CORs, COR 5’s wave attenuation capability over 100 years with changing water levels is investigated. Moreover, an alternative reef configuration, as a sustainable design, is also proposed and is illustrated in Supplementary Figure S6. As mentioned earlier, sustainability of CORs is determined based on its ability to grow and maintain pace with SLR. Thus, it can maintain its efficacy in shoreline protection in the future. The wave attenuation capability of each reef design under different water levels is demonstrated in Figure 11. Wave attenuation is calculated by the wave height difference at both sides of COR 5. For the MSL in Figure 11A, since COR 5 is emergent for the unsustainable design with limited potential of oyster growth, a good degree of protection at about 80% of wave height reduction is seen under current conditions. However, it would lose its protection in about 30 years after getting submerged. The sustainable design for this water level, though, takes about 10 years to reach a constant level of protection of about 75%. This level of protection is then maintained for the next 90 years. For the water level between the MSL and MHW illustrated in Figure 11B, the unsustainable design has initial protection of 60% and loses its protection in about 25 years, while the sustainable design also gains about 45% protection in approximately 8 years. For the MHW in Figure 11C, the previous design has 25% protection at the initial phase and then its protection is gradually reduced to less than 20%. The sustainable design also reaches 20% protection in about 8 years. For the MHW, both designs provide limited protection in the long term and the only difference between the two designs is a slight loss of protection in the unsustainable design. This suggests that CORs, regardless of their sustainability, do not provide significant wave attenuation benefits if they are deeply submerged under extreme water level conditions.
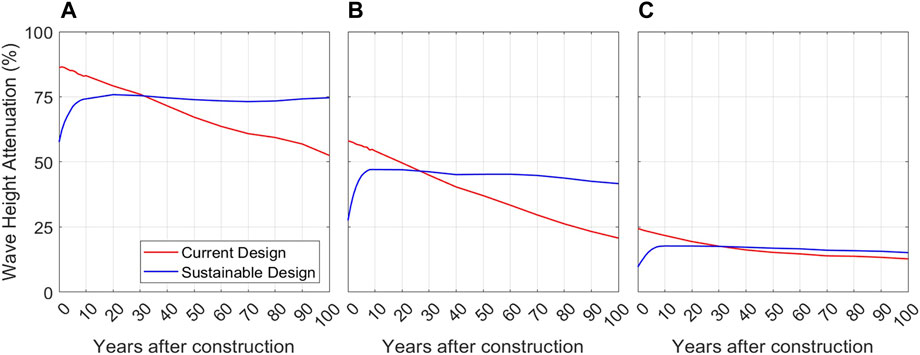
FIGURE 11. Long-term wave height attenuation with the sustainable and current design of CORs under SLR for three water levels (A) MSL, (B) between MSL and MHW, and (C) MHW.
Discussion
High Spatial and Temporal Variability of Wave Processes Along Living Shorelines
Our modeling results indicate that wave height change by CORs in Gandys Beach is complex. Wave height in the protected area can decrease or increase compared to the wave height without CORs depending on the offshore wave height, mean wave direction, and water depth conditions. Previous studies might likely overestimate the wave attenuation capacity of living shorelines if only simple 1D models or limited data were used. This could be attributed to 1) a lack of wave measurements under the representative wind, wave, and water depth conditions (e.g., measurements were short and taken from non-storm conditions), 2) a large model domain in wave modeling with a coarse grid size or obsolete bathymetry data that could not represent the local bathymetry conditions, and 3) making wave height and current comparisons between locations with false equivalence.
The present study is among the first investigations to address these issues by 1) using the bathymetry data which is a combination of the comprehensive U.S. Geological Survey Coastal National Elevation Database (CoNED, 1 m resolution) and our field survey in this project, 2) employing the phase-resolving wave model with high temporal and spatial resolution as well as an updated bathymetry from CoNED and recent survey carried out during 2017–2018 after oyster castle construction at Gandys Beach living shoreline, and 3) comparing the wave height and the current field between a bathymetry with CORs and a bathymetry without CORs. The rich field data and the state-of-the-art phase-resolving wave model reveal the changes in the wave field and the wave-driven flow field due to CORs. Wave models with high spatial and temporal resolution are therefore recommended for the study of wave attenuation by CORs. Thus, we can determine the difference in the flow field and wave height caused by CORs using the high-resolution phase-resolving wave model that can appropriately resolve the bathymetric and geometric features of CORs.
Local Wave-Induced Current Pattern Changes Across Living Shorelines
For the modeling part, three representative wind–wave conditions were selected from a series of combinations of wind and wave data for Gandys Beach. For Case 1 with the lowest wave energy among the cases and with near emergent CORs, we found that CORs increase wave height behind them. Circulation patterns inside the protected area may also increase wave height if the current is opposite to the wave direction. For Case 1, COR 5 is emergent with the negligible current behind it and attenuates the incident waves. For Case 2, with intermediate wave energy and with the highest water level among the three cases, CORs increase the wave height in the protected area as well. For this case, waves are roughly parallel to CORs. Since waves are not blocked by CORs, a possible reason for the modeled wave height increase can also be the current pattern behind CORs in the protected area like Case 1. For Case 3, with the highest wave energy and with a water level like Case 1, we found that the wave height is blocked by CORs. Looking at the wave energy spectra for Case 3, a reduction of wave energy in higher frequencies and a transfer of energy to the lower frequencies can be observed. Thus, one can infer that the swell energies have passed through CORs, though most of the higher frequency waves are blocked, which has also been observed by Zhu et al. (2020).
There is a lack of simultaneous measurements of wave and current dynamics in existing studies on wave attenuation by LSS. This numerical study simultaneously examines both wave and current dynamics across LSS under representative wave conditions including strong nor’easters along the upper Delaware Bay. By having an accurate map of the current pattern inside the protected area, we can confirm the role of CORs on the formation of a circulation pattern behind CORs. This circulation can trap the incoming sediment in the protected area behind the oyster castles and increase the total suspended solids concentration around the CORs. It can also result in sediment deposition and reduction of vertical and horizontal erosion of shorelines (Colden et al., 2016; Wang et al., 2021).
It should be noted that the current field simulated by our model is purely wave-driven and does not take the tidal currents into account. The current velocity measured in the field is a combination of wave-induced and tidal currents, and the Boussinesq model only provides us with the wave-induced current velocity fields. Thus, more work on the separation of tidal- and wave-induced current in the measured data is needed to make a reasonable comparison between the simulated and measured current data. Simulated wave-induced current velocities in the vicinity of CORs varied with the incident waves and water levels. While the current velocities were less than 15 cm/s for Case 1 and 2, they exceeded the threshold value for Case 3. In some cases, these wave-driven currents may not be suitable for oyster optimal growth, even though oyster filtration and food ingestion will not stop (Wang et al., 2017, 2021).
Sustainable Living Shorelines Under Sea-Level Rise
The existing CORs in this study are slanted tall structures composed of five stacked layers of concrete blocks. It has been reported that the oyster settlement on these blocks has not been successful (Wang et al., 2021). While salinity, temperature, and nutrient concentrations are in the range for oyster survival and growth in Gandys Beach, engineering factors like the placement of these blocks in the OGZ as well as their geometrical design could be among the reasons for the low oyster settlement and growth on these oyster castles. Moreover, current velocity behind CORs and through the gaps was seen to be over the optimal range for oyster growth under energetic wave conditions.
Generally, existing LSS designs do not consider long-term (>5 years) environmental factors. Though these structures might trap some sediment inside the protected area, attenuate the wave height (Zhu et al., 2020; Wang et al., 2021), and consequently reduce the shoreline erosion, their protection will likely diminish with SLR. Thus, the design of sustainable LSS that can maintain pace with SLR can help to achieve long-term benefits (Rodriguez et al., 2014; Ridge et al., 2017; Morris et al., 2019). To achieve this, engineering aspects, ecological benefits, and their interaction are design considerations. For oyster reef living shorelines like Gandys Beach, oyster reef’s vertical growth via shell and biomass growth is needed to maintain the wave attenuation capacity of oyster castles in the future.
Future Studies
While this study provides valuable information on the sustainability of living shoreline structures, it can be further improved. The oyster growth rates should be site-specific and applying the oyster growth rates of Rodriguez et al. (2014) on Gandys Beach might not yield accurate results. In addition, these analyses were made in 1D settings with only one COR segment. The results would be more reliable if a 2D bathymetry was run with two bathymetry configurations (with and without CORs in the domain). Thus, in addition to the wave height, current field could also be obtained. Current fields can also affect the wave height, and therefore, a 2D analysis would give more reliable information on the efficacy of the sustainable oyster design. However, 2D analyses would significantly increase the computational time. Another shortcoming of the current design is the lack of information on the projection of future wave and water level conditions. The mean sea level is assumed to rise 0.5 cm/year due to SLR; however, wave properties can also change with the changing climate. Thus, wave height changes in the 100-years range should be considered for the COR’s long-term sustainability analyses.
Results of wave modeling incorporating the OGZ under SLR indicate that sustainable living shorelines can be achieved if the living shorelines were designed for the oysters with long-term vision instead of designing them for just wave attenuation to protect the shoreline from erosion. Incorporating oyster reef vertical growth into the sustainable living shoreline design is a critical component in sustaining long-term wave attenuation under future SLR. We found that it will take about 8–10 years for a sustainable oyster reef-based shoreline to reach its maximum wave attenuation capacity. Then, it will maintain this maximum wave attenuation capacity by growing at the same pace as SLR. It was found that it will take approximately 9 years for oyster reefs in Winyah Bay, South Carolina, United States, to grow from establishment to maximum reef height from shells and live oysters based on oyster reef mechanics and self-organization theory (Yurek et al., 2021). Therefore, maintaining CORs wave attenuation capacity with reef vertical growth to maintain pace with SLR, suggests prolonged protection of the shoreline and habitat maintenance without human intervention or additional investments.
Though our model results demonstrate the current field altered by the CORs with high spatial and temporal resolution, it is limited to simulating wave-driven currents. Models could be further refined by including tidal currents. In addition, natural oyster reefs are wider and lower in height than the man-made oyster castle substrates. Replicating similar designs to the natural reefs in numerical models with an appropriate roughness coefficient for the increased friction may shed new light on the optimal design of oyster reefs for better protection of the shorelines. Furthermore, continuous monitoring of wave data including mean wave direction, sediment concentration, and sediment budget (deposition and erosion on the shoreline with oyster castle protection) could provide a rich bank of measured data for future modeling. Oyster biological studies, including transport and settlement of larvae and growth of oysters with different sizes (spat, juvenile, and markable) at the crest and base of the reefs under various current velocity conditions could also help to improve model accuracy. An integrated modeling system of hydrodynamics and ecology of oyster growth could help to predict the shoreline morphology and to better understand the oyster population dynamics under future climate change and rising sea levels.
Summary and Conclusion
Living shorelines need to be sustainable both in terms of wave energy attenuation to protect the shoreline from erosion and maintaining native species habitat under future climate change and SLR. In this study, wave dynamics around CORs, in Gandys Beach, New Jersey, in the upper Delaware Bay, United States were examined using the phase-resolving Boussinesq wave model, FUNWAVE-TVD. To our knowledge, this is the first study on assessing wave and current dynamics along living shorelines using fine temporal and spatial resolution wave modeling. Field wave data collected from six wave gages across the CORs for two winter months in 2018 with four nor’easters were used to calibrate some of the input parameters and validate the wave model, showing good agreement between simulated and observed wave heights and wave energy spectra. To assess the effects of CORs on the wave and current fields, using simulations with oyster castles on and off the bathymetric data, three cases that represent the prevailing wind, wave, and tide conditions along the Gandys Beach shoreline based on field measurements and phase-averaged wave model outputs were selected.
It was found that oyster castles do not always attenuate the waves, and in some special events, oyster castles even result in wave height amplification, as well. Wave attenuation capacity of living shorelines including constructed oyster reefs tends to be overestimated by one-dimensional empirical formulas for submerged breakwaters or phase-averaged wave models with coarse spatial resolutions. These models neither resolve local bathymetry variations across the LSS nor the local wave processes such as wave reflection, diffraction, and breaking over the narrow reef crest. Furthermore, it was found that oyster castles alter the wave-driven flow and generate a circulation pattern behind them, which increases current velocity at and near the oyster castles. This affects oyster larval transport and settlement, nutrient delivery, and oyster filtration. Current velocity adjacent to the oyster castles under some representative cases exceeds the threshold of 15 cm/s for nutrient delivery and oyster filtration, indicating that the current oyster castle design might not provide suitable current velocity for on-reef oyster growth.
The COR’s wave attenuation capacity along Gandys Beach shoreline under future SLR conditions in the next 100 years was evaluated in current and sustainable designs. In a sustainable design, oyster reef vertical growth within the OGZ was incorporated in a representative case. It was found that the COR’s wave attenuation capacity can be maintained over the next 100 years, but this long-term benefit can only be achieved when the COR is placed inside the OGZ and grows at the same rate as SLR. It was found that one of the COR segments in Gandys Beach living shoreline may not be designed for long-term protection and may lose its protection with SLR because of being located outside the OGZ. The model results suggest that it would take approximately 9 years for a sustainably designed COR after the construction to reach and maintain the maximum wave attenuation capacity. Within this period, the oyster reef grows fast, reaches its maximum elevation, and eventually evolves at an equilibrium stage with the physical environment like natural oyster reefs.
Data Availability Statement
The raw data supporting the conclusion of this article will be made available by the authors, without undue reservation.
Author Contributions
RS: conceptualization, software, formal analysis, validation, visualization, and writing—original draft; HW: conceptualization, supervision, methodology, resources, and writing—review and editing; QC: conceptualization, supervision, methodology, writing—review and editing, and project administration; LZ: conceptualization, resources, data curation, software, formal analysis, validation, visualization, and writing—review and editing.
Funding
Funding for the study has been provided by the U.S. Coastal Research Program (USCRP, W912HZ-20-2-0046) and the National Fish and Wildlife Foundation (NFWF, Project #55032).
Conflict of Interest
The authors declare that the research was conducted in the absence of any commercial or financial relationships that could be construed as a potential conflict of interest.
Publisher’s Note
All claims expressed in this article are solely those of the authors and do not necessarily represent those of their affiliated organizations, or those of the publisher, the editors, and the reviewers. Any product that may be evaluated in this article, or claim that may be made by its manufacturer, is not guaranteed or endorsed by the publisher.
Acknowledgments
We would like to thank Cody Johnson and two reviewers for their constructive reviews of an earlier version. Any use of trade, firm, or product names is for descriptive purposes only and does not imply endorsement by the U.S. Government.
Supplementary Material
The Supplementary Material for this article can be found online at: https://www.frontiersin.org/articles/10.3389/fbuil.2022.884849/full#supplementary-material
References
Booij, N., Ris, R. C., and Holthuijsen, L. H. (1999). A Third-Generation Wave Model for Coastal Regions: 1. Model Description and Validation. J. Geophys. Res. 104 (C4), 7649–7666. doi:10.1029/98jc02622
Campbell, M. D., and Hall, S. G. (2019). Hydrodynamic Effects on Oyster Aquaculture Systems: a Review. Rev. Aquacult 11 (3), 896–906. doi:10.1111/raq.12271
Chen, Q. (2006). Fully Nonlinear Boussinesq-type Equations for Waves and Currents over Porous Beds. J. Eng. Mech. 132 (2), 220–230. doi:10.1061/(asce)0733-9399(2006)132:2(220)
Chen, Q., Kirby, J. T., Dalrymple, R. A., Shi, F., and Thornton, E. B. (2003). Boussinesq Modeling of Longshore Currents. J. Geophys. Res. Oceans 108 (C11). doi:10.1029/2002jc001308
Chen, Q., Madsen, P. A., and Basco, D. R. (1999). Current Effects on Nonlinear Interactions of Shallow-Water Waves. J. Waterw. port, Coast. ocean Eng. 125 (4), 176–186. doi:10.1061/(asce)0733-950x(1999)125:4(176)
Chowdhury, M. S. N., Walles, B., Sharifuzzaman, S. M., Shahadat Hossain, M., Ysebaert, T., and Smaal, A. C. (2019). Oyster Breakwater Reefs Promote Adjacent Mudflat Stability and Salt Marsh Growth in a Monsoon Dominated Subtropical Coast. Sci. Rep. 9 (1), 1–12. doi:10.1038/s41598-019-44925-6
Colden, A. M., Fall, K. A., Cartwright, G. M., and Friedrichs, C. T. (2016). Sediment Suspension and Deposition across Restored Oyster Reefs of Varying Orientation to Flow: Implications for Restoration. Estuaries coasts 39 (5), 1435–1448. doi:10.1007/s12237-016-0096-y
Deltares, D. (2013). Delft3D-FLOW Simulation of Multi-Dimensional Hydrodynamic Flows and Transport Phenomena, Including Sediments. Delft: Delft Hydraulics.
Fivash, G. S., Stüben, D., Bachmann, M., Walles, B., van Belzen, J., Didderen, K., et al. (2021). Can We Enhance Ecosystem-Based Coastal Defense by Connecting Oysters to Marsh Edges? Analyzing the Limits of Oyster Reef Establishment. Ecol. Eng. 165, 106221. doi:10.1016/j.ecoleng.2021.106221
Harsh, D. A., and Luckenbach, M. W. (1999). Materials Processing by Oysters in Patches: Interactive Roles of Current Speed and Seston Composition.
Karimpour, A., and Chen, Q. (2017). Wind Wave Analysis in Depth Limited Water Using OCEANLYZ, A MATLAB Toolbox. Comput. Geosciences 106, 181–189. doi:10.1016/j.cageo.2017.06.010
Kennedy, A. B., Chen, Q., Kirby, J. T., and Dalrymple, R. A. (2000). Boussinesq Modeling of Wave Transformation, Breaking, and Runup. I: 1D. J. Waterw. port, Coast. ocean Eng. 126 (1), 39–47. doi:10.1061/(asce)0733-950x(2000)126:1(39)
La Peyre, M. K., Marshall, D. A., and Sable, S. E. (2021). Oyster Model Inventory: Identifying Critical Data and Modeling Approaches to Support Restoration of Oyster Reefs in Coastal US Gulf of Mexico Waters (No. 2021-1063). Reston, VA: US Geological Survey. doi:10.3133/ofr20211063
Larsen, J., and Dancy, H. (1983). Open Boundaries in Short Wave Simulations - A New Approach. Coast. Eng. 7 (3), 285–297. doi:10.1016/0378-3839(83)90022-4
Leonardi, N., Ganju, N. K., and Fagherazzi, S. (2016). A Linear Relationship between Wave Power and Erosion Determines Salt-Marsh Resilience to Violent Storms and Hurricanes. Proc. Natl. Acad. Sci. U.S.A. 113 (1), 64–68. doi:10.1073/pnas.1510095112
Lipcius, R. N., Zhang, Y., Zhou, J., Shaw, L. B., and Shi, J. (2021). Modeling Oyster Reef Restoration: Larval Supply and Reef Geometry Jointly Determine Population Resilience and Performance. Front. Mar. Sci. 8, 1395. doi:10.3389/fmars.2021.677640
Manson, T., Gilman, J. F., Perkol-Finkel, S., Sella, I., and Marrone, J. F. (2018). “Multi-Purpose Breakwaters,” in Coasts, Marine Structures and Breakwaters 2017: Realising the Potential (London, United Kingdom: ICE Publishing), 449–458. doi:10.1680/cmsb.63174.0449
Marani, M., D'Alpaos, A., Lanzoni, S., and Santalucia, M. (2011). Understanding and Predicting Wave Erosion of Marsh Edges. Geophys. Res. Lett. 38 (21). doi:10.1029/2011gl048995
Morris, R. L., La Peyre, M. K., Webb, B. M., Marshall, D. A., Bilkovic, D. M., Cebrian, J., et al. (2021). Large-scale Variation in Wave Attenuation of Oyster Reef Living Shorelines and the Influence of Inundation Duration. Ecol. Appl. 31 (6), e02382. doi:10.1002/eap.2382
Morris, R. L., Bilkovic, D. M., Boswell, M. K., Bushek, D., Cebrian, J., Goff, J., et al. (2019). The Application of Oyster Reefs in Shoreline Protection: Are We Over‐engineering for an Ecosystem Engineer? J. Appl. Ecol. 56 (7), 1703–1711. doi:10.1111/1365-2664.13390
Morris, R. L., Konlechner, T. M., Ghisalberti, M., and Swearer, S. E. (2018). From Grey to Green: Efficacy of Eco-Engineering Solutions for Nature-Based Coastal Defence. Glob. Change Biol. 24 (5), 1827–1842. doi:10.1111/gcb.14063
Polk, M. A., Gittman, R. K., Smith, C. S., and Eulie, D. O. (2022). Coastal Resilience Surges as Living Shorelines Reduce Lateral Erosion of Salt Marshes. Integr Envir Assess Manag 18 (1), 82–98. doi:10.1002/ieam.4447
Rahmstorf, S. (2010). A New View on Sea Level Rise. Nat. Clim. Change 1 (1004), 44–45. doi:10.1038/climate.2010.29
Ridge, J. T., Rodriguez, A. B., Joel Fodrie, F., Lindquist, N. L., Brodeur, M. C., Coleman, S. E., et al. (2015). Maximizing Oyster-Reef Growth Supports Green Infrastructure with Accelerating Sea-Level Rise. Sci. Rep. 5 (1), 14785–14788. doi:10.1038/srep14785
Ridge, J. T., Rodriguez, A. B., and Fodrie, F. J. (2017). Evidence of Exceptional Oyster-Reef Resilience to Fluctuations in Sea Level. Ecol. Evol. 7 (23), 10409–10420. doi:10.1002/ece3.3473
Rodriguez, A. B., Fodrie, F. J., Ridge, J. T., Lindquist, N. L., Theuerkauf, E. J., Coleman, S. E., et al. (2014). Oyster Reefs Can Outpace Sea-Level Rise. Nat. Clim. Change 4 (6), 493–497. doi:10.1038/nclimate2216
Salatin, R., Chen, Q., Bak, A. S., Shi, F., and Brandt, S. R. (2021). Effects of Wave Coherence on Longshore Variability of Nearshore Wave Processes. J. Geophys. Res. Oceans 126 (11), e2021JC017641. doi:10.1029/2021jc017641
Shi, F., Kirby, J. T., Harris, J. C., Geiman, J. D., and Grilli, S. T. (2012). A High-Order Adaptive Time-Stepping TVD Solver for Boussinesq Modeling of Breaking Waves and Coastal Inundation. Ocean. Model. 43-44, 36–51. doi:10.1016/j.ocemod.2011.12.004
Smith, K. A., North, E. W., Shi, F., Chen, S.-N., Hood, R. R., Koch, E. W., et al. (2009). Modeling the Effects of Oyster Reefs and Breakwaters on Seagrass Growth. Estuaries Coasts 32 (4), 748–757. doi:10.1007/s12237-009-9170-z
Suanda, S. H., Perez, S., and Feddersen, F. (2016). Evaluation of a Source-Function Wavemaker for Generating Random Directionally Spread Waves in the Sea-Swell Band. Coast. Eng. 114, 220–232. doi:10.1016/j.coastaleng.2016.04.006
Theuerkauf, S. J., Burke, R. P., and Lipcius, R. N. (2015). Settlement, Growth, and Survival of Eastern Oysters on Alternative Reef Substrates. J. Shellfish Res. 34 (2), 241–250. doi:10.2983/035.034.0205
Theuerkauf, S. J., Eggleston, D. B., and Puckett, B. J. (2019). Integrating Ecosystem Services Considerations within a GIS-Based Habitat Suitability Index for Oyster Restoration. PloS one 14 (1), e0210936. doi:10.1371/journal.pone.0210936
Wang, H., Capurso, W. D., Chen, Q., Zhu, L., Niemoczynski, L., and Snedden, G. (2021). Assessment of Wave Attenuation, Current Patterns, and Sediment Deposition and Erosion during Winter Storms by Living Shoreline Structures in Gandys Beach. New Jersey: US Geological Survey. (No. 2021-1040). doi:10.3133/ofr20211040
Wang, H., Chen, Q., La Peyre, M. K., Hu, K., and La Peyre, J. F. (2017). Predicting the Impacts of Mississippi River Diversions and Sea-Level Rise on Spatial Patterns of Eastern Oyster Growth Rate and Production. Ecol. Model. 352, 40–53. doi:10.1016/j.ecolmodel.2017.02.028
Wang, H., Zhu, L., Chen, Q., Capurso, W., Niemoczynski, L., Hu, K., et al. (2020). Field Observations and Spectral Evolution of Wind Waves in Upper Delaware Bay with Living Shorelines. Reston, VA: U.S. Geological Survey data release. doi:10.5066/P9YEUNTM
Wang, N., Chen, Q., Zhu, L., and Sun, H. (2022b). Integration of Data-Driven and Physics-Based Modeling of Wind Waves in a Shallow Estuary. Ocean. Model. 172, 101978. doi:10.1016/j.ocemod.2022.101978
Wang, N., Chen, Q., Zhu, L., and Wang, H. (2022a). Data-driven Modeling of Wind Waves in Upper Delaware Bay with Living Shorelines. Ocean. Eng. In press.
Wei, G., Kirby, J. T., and Sinha, A. (1999). Generation of Waves in Boussinesq Models Using a Source Function Method. Coast. Eng. 36 (4), 271–299. doi:10.1016/s0378-3839(99)00009-5
Wiberg, P. L., Taube, S. R., Ferguson, A. E., Kremer, M. R., and Reidenbach, M. A. (2019). Wave Attenuation by Oyster Reefs in Shallow Coastal Bays. Estuaries Coasts 42 (2), 331–347. doi:10.1007/s12237-018-0463-y
Yurek, S., Eaton, M. J., Lavaud, R., Laney, R. W., DeAngelis, D. L., Pine, W. E., et al. (2021). Modeling Structural Mechanics of Oyster Reef Self-Organization Including Environmental Constraints and Community Interactions. Ecol. Model. 440, 109389. doi:10.1016/j.ecolmodel.2020.109389
Keywords: constructed oyster reef, current velocity, FUNWAVE-TVD model, living shoreline, optimal growth zone, sea-level rise, wave attenuation
Citation: Salatin R, Wang H, Chen Q and Zhu L (2022) Assessing Wave Attenuation With Rising Sea Levels for Sustainable Oyster Reef-Based Living Shorelines. Front. Built Environ. 8:884849. doi: 10.3389/fbuil.2022.884849
Received: 27 February 2022; Accepted: 09 May 2022;
Published: 17 June 2022.
Edited by:
Jane McKee Smith, Engineer Research and Development Center (ERDC), United StatesReviewed by:
Matt Malej, Engineer Research and Development Center (ERDC), United StatesAlec Torres-Freyermuth, Instituto de Ingeniería, Universidad Nacional Autónoma de México, Mexico
Copyright © 2022 Salatin, Wang, Chen and Zhu. This is an open-access article distributed under the terms of the Creative Commons Attribution License (CC BY). The use, distribution or reproduction in other forums is permitted, provided the original author(s) and the copyright owner(s) are credited and that the original publication in this journal is cited, in accordance with accepted academic practice. No use, distribution or reproduction is permitted which does not comply with these terms.
*Correspondence: Qin Chen, q.chen@northeastern.edu