Impacts of Coastal Infrastructure on Shoreline Response to Major Hurricanes in Southwest Louisiana
 Jack A. Cadigan1*
  Jasmine H. Bekkaye2,3
  Navid H. Jafari2,3
  Ling Zhu4 Ashley R. Booth5
  Qin Chen4,6
  Britt Raubenheimer7 Brian D. Harris1 Chris O’Connor8
  Robert Lane9
  G. Paul Kemp10 Jason N. Day9
  John W. Day10
  Hanssel Omar Ulloa2
- 1Coastal Hydraulics Laboratory, U.S. Army Corps of Engineers Research and Development Center, Vicksburg, MS, United States
- 2Department of Civil and Environmental Engineering, Louisiana State University, Baton Rouge, LA, United States
- 3Coastal Studies Institute, Louisiana State University, Baton Rouge, LA, United States
- 4Department of Civil and Environmental Engineering, Northeastern University, Boston, MA, United States
- 5School of Renewable Natural Resources, Louisiana State University, Baton Rouge, LA, United States
- 6Department of Marine and Environmental Sciences, Northeastern University, Boston, MA, United States
- 7Department of Applied Ocean Physics and Engineering, Woods Hole Oceanographic Institution, Falmouth, MA, United States
- 8Department of Marine Sciences, University of North Carolina at Wilmington, Wilmington, NC, United States
- 9Comite Resources, Inc., Baton Rouge, LA, United States
- 10Department of Oceanography and Coastal Sciences, Louisiana State University, Baton Rouge, LA, United States
The Rockefeller Wildlife Refuge, located along the Chenier Plain in Southwest Louisiana, was the location of the sequential landfall of two major hurricanes in the 2020 hurricane season. To protect the rapidly retreating coastline along the Refuge, a system of breakwaters was constructed, which was partially completed by the 2020 hurricane season. Multi-institutional, multi-disciplinary rapid response deployments of wave gauges, piezometers, geotechnical measurements, vegetation sampling, and drone surveys were conducted before and after Hurricanes Laura and Delta along two transects in the Refuge; one protected by a breakwater system and one which was the natural, unprotected shoreline. Geomorphological changes were similar on both transects after Hurricane Laura, while after Delta there was higher inland sediment deposition on the natural shoreline. Floodwaters drained from the transect with breakwater protection more slowly than the natural shoreline, though topography profiles are similar, indicating a potential dampening or complex hydrodynamic interactions between the sediment—wetland—breakwater system. In addition, observations of a fluidized mud deposit in Rollover Bayou in the Refuge are presented and discussed in context of the maintenance of wetland elevation and stability in the sediment starved Chenier Plain.
Introduction
During the hurricane season of 2020, the sequential landfalls of Hurricane Laura (27 August 2020) and Hurricane Delta (09 October 2020) in southwest Louisiana caused widespread damage and led to estimated economic losses in excess of $7 billion USD (Xi and Lin, 2021). These storms led to devastating impacts in a region that is already subject to environmental stressors such as altered hydrology, shoreline erosion, wetland loss, and saltwater intrusion (Gary, 1979; Shiner Mosley and Associates, 2002; Penland et al., 2005; Morton and Barras, 2011; (LACPRA, 2017). Prior to the 2020 hurricane season, to conserve ecosystem and infrastructure integrity, breakwaters were installed along portions of the southwest Louisiana shoreline (Campbell et al., 2005; Jafari et al., 2020; Reid, 2021). The landfalls of Hurricane Laura and Hurricane Delta led to a unique opportunity to examine the effects of two major hurricanes impacting the same location, half of which was protected by a system of breakwaters by the time of the 2020 hurricane season.
Both Hurricanes Laura and Delta underwent a process known as rapid intensification, i.e., an increase in the maximum sustained winds of at least 56.3 km/h over a 24-h period, prior to landfall (Eley et al., 2021; Zhou et al., 2021; Zhu et al., 2021). Rapid intensification is a highly dangerous process that is difficult to forecast, but which seems to be increasing in frequency for Atlantic storms and worldwide (Balaguru et al., 2018). Hurricane Laura rapidly intensified from being a Category 1 hurricane the day prior to landfall, to a Category 4 hurricane at landfall and the strongest hurricane to strike Louisiana since Hurricane Camille in 1969 (Pasch et al., 2021). Hurricane Delta rapidly intensified from a tropical depression to a Category 4 hurricane over a 30-h period. However, it weakened while passing over the tip of the Yucatan Peninsula before then re-strengthening and making landfall as a Category 2 near Creole, Louisiana, six weeks after and only 19 kms east of the landfall location of Hurricane Laura (Cangialosi and Berg, 2021; Pasch et al., 2021).
Southwest Louisiana is home to significant oil and gas infrastructure (Martin Associates, 2021) and supports a large portion of the state’s agriculture and fisheries industries (LACPRA, 2017). The part of southwest Louisiana in which these storms made direct landfall notably features the Cameron Liquified Natural Gas facility and a variety of other industrial shipping terminals on the Calcasieu Ship Channel, estimated to have provided $39 billion USD in economic value in 2020 to the United States and supported 53,722 jobs (Martin Associates, 2021). Impacts from the 2020 hurricane season on the fishing-related businesses in Louisiana including commercial fishers, marinas, charters, etc., are estimated on the lower bound to be $117 million, on the upper bound to be $205 million, and estimated on average to be on the order of $161 million (Caffey et al., 2022). The region is also home to several state and federal wildlife refuges, including the Rockefeller Wildlife Refuge (RWR or Rockefeller). Located proximal to the Calcasieu Ship Channel in southwest Louisiana, and having experienced direct landfall impacts from Hurricanes Laura and Delta, RWR and adjacent areas provided a unique case study to monitor the response of coastal wetlands using field observations to sequential major hurricane passage. In addition, at the time of the 2020 hurricane season, approximately half of Rockefeller’s Gulf of Mexico shoreline was protected by an artificial breakwater system with the remainder slated for construction, providing the opportunity to evaluate differences in wetland system response to the storms and help provide guidance to stakeholders and practitioners in the coastal engineering community.
Study Site: Rockefeller Wildlife Refuge
The Rockefeller Wildlife Refuge (Figure 1) is a state-managed wildlife refuge in Cameron and Vermillion Parishes, Louisiana, located in the Chenier Plain, a geographic feature that spans much of coastal southwest Louisiana and southeast Texas (Oscar et al., 2001). The Chenier Plain is one of two distinct geomorphological zones in Louisiana; the Mississippi River Delta Plain is located in the southeastern portion of Louisiana while the Chenier Plain resides in the southwestern portion of Louisiana (Roberts, 1997; McBride et al., 2007; McBride et al., 2013) Considered one of the most biologically diverse refuges in the nation, RWR has 43 km of shoreline and covers 287 km2 of chenier ridges and a range of fresh, brackish, and salt marshes (LDWF, 2021). Due to its location at the southern terminus of the Mississippi and Central Flyways, RWR hosts hundreds of thousands of birds annually, serving as a critical seasonal stop-over for tropical passerines, a wintering ground for migratory waterbirds, and a year-round habitat for resident species - including species of concern like western Gulf Coast Mottled Ducks (Anas fulvigula)(Selman et al., 2011; LDWF, 2021).
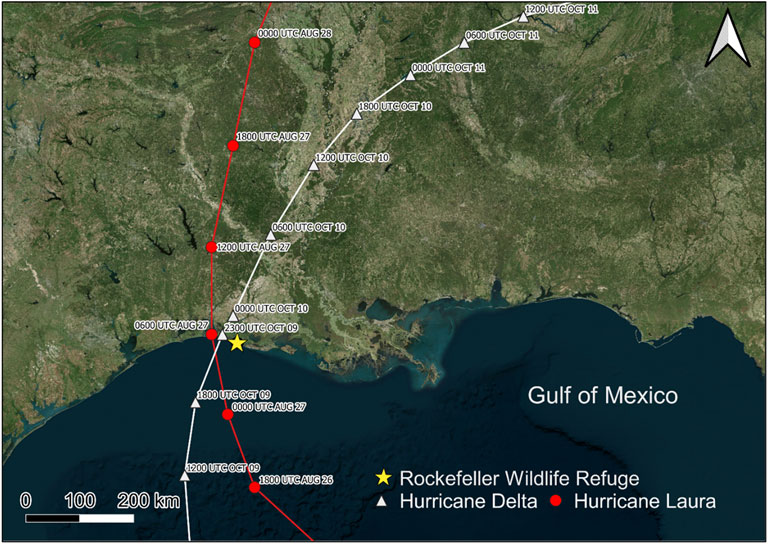
FIGURE 1. Location of the study site, Rockefeller Wildlife Refuge (yellow star), on the Louisiana coastline and the time-stamped (UTC) paths of Hurricane Delta (white triangles) and Hurricane Laura (red circles) (Basemap: Satellite imagery courtesy of the U.S. Geological Survey, Google Earth Engine).
When the land was donated to the state of Louisiana by the Rockefeller Foundation in 1919, Rockefeller Wildlife Refuge encompassed an area of approximately 348 km2; due to rapid coastal erosion this area was reduced to 309 km2 by 2004, 294 km2 by 2011, and by more recent estimates, approximately 287 km2 (Wise et al., 2004; Selman et al., 2011; LDWF, 2021). The average rate of erosion-driven shoreline retreat derived by remote sensing has been measured at approximately 14.5 m/yr between 1998–2017, with extreme rates of 19 m/yr and 25.5 m/yr during the years Hurricanes Rita (2005) and Ike (2008) struck (Yao et al., 2018). In fact, Yao et al. (2018) estimated a total erosion of approximately 300 m of shoreline between 1998 and 2017. Aerial imagery between 1998 and 2002 indicate an approximate erosion rate of 17 m/yr (Wise et al., 2004). Comparisons between shoreline positions from U.S. Department of Agriculture (USDA) National Agricultural Imagery Program (NAIP, +/− 1 m resolution) images from 2009 to 2019 (Figures 2A,B) show an approximate shoreline retreat of 170 m over the ten-year period, yielding similar results to the aforementioned Wise et al. (2004) erosion rate of 17 m/yr.
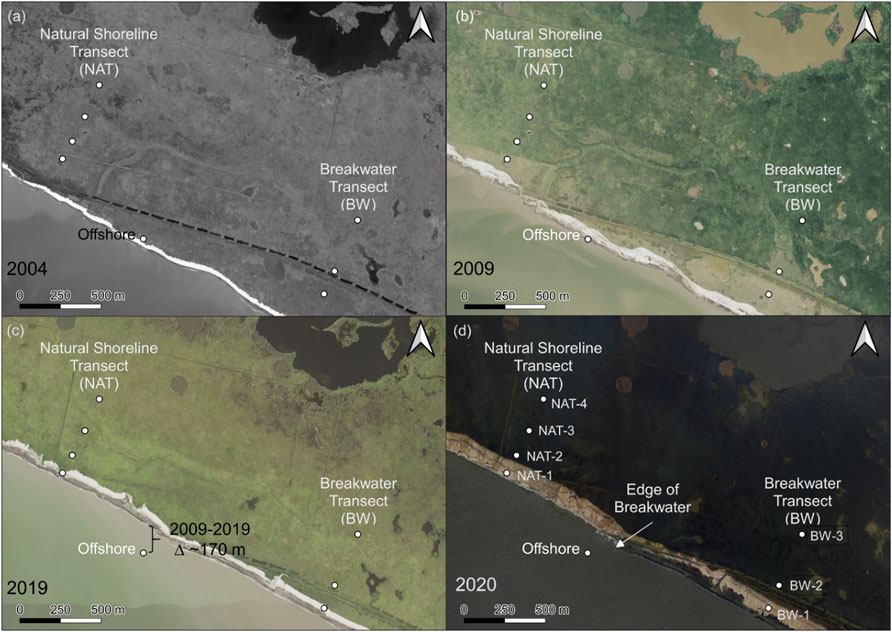
FIGURE 2. USDA NAIP imagery of the study site in 2004 (A), in 2009 (B), in 2019 showing ∼170 m of shoreline retreat (C), and NOAA post-Delta aerial imagery in 2020 (D) showing the location of the two transects in relation to the breakwater structure.
To protect the shoreline in this region from these high rates of retreat, extensive systems of breakwaters have been placed along the shoreline of southwest Louisiana (Reid, 2021). The breakwaters are part of a shoreline stabilization effort that has been discussed since at least 2001 (Hill and Belhadjali, 2005). The system was a collaboration between the National Oceanographic and Atmospheric Association (NOAA), the Louisiana Coastal Protection and Restoration Authority (CPRA), Louisiana Department of Wildlife and Fisheries (LDWF), and the National Marine Fisheries Service, with $34 million of funding secured from the Coastal Wetlands Planning, Protection and Restoration Act (CWPPRA) to construct a 6.4 km transect of emergent breakwaters along the RWR shoreline designed for Category 1 conditions (Jafari et al., 2020; Cohen et al., 2021; Reid, 2021). Funded as “ME-18,” the multi-million-dollar project incorporated a Light Weight Aggregate Concrete (LWAC) breakwater system. The extremely soft subsurface sediments that extend for nearly 12 m below the ground surface make employing traditional shoreline stabilization structures difficult (Shiner Mosley and Associates, 2002), and thus the breakwaters were designed specifically to function atop the ultra-soft sediments offshore of the RWR shoreline through the use of lightweight aggregates enclosed in a geotextile fabric, which local engineers refer to as “pillows.” During an experimental period in which various breakwater systems were placed along the RWR shoreline, the LWAC pillow system performed very well, and the protected shoreline lost approximately one meter of land while the unprotected shoreline eroded by nearly fourteen meters (Wise et al., 2004; Hill and Belhadjali, 2005; Geesey et al., 2011; Shows, 2019). The construction of the original 6.4 km reach of breakwaters was completed by June 2020, just prior to the period of major storm activity in Southwest Louisiana.
Instrumentation and Data Collection Plan
Prior to the landfall of Hurricane Laura, a collaborative team of members from Louisiana State University (LSU), Northeastern University (NEU), Woods Hole Oceanographic Institution (WHOI), and the University of North Carolina at Wilmington planned and rapidly mobilized to deploy instrumentation as part of a National Science Foundation Nearshore Extreme Events Reconnaissance (NEER) effort. The team repeatedly deployed along coastal Louisiana to monitor the effects of the devastating 2020 hurricane season on the fragile and rapidly eroding Louisiana shoreline. Due to the inherent time-restraints imposed by extreme event reconnaissance, namely the uncertainty in exact landfall location, site access, instrumentation, and crew availability, as well as the logistical and health concerns due to the timing of field work and the COVID-19 pandemic, data reconnaissance methods were restricted to instruments and equipment that could be rapidly deployed by a small crew. Post-Laura reconnaissance was performed at RWR on 04 September 2020. Due to the short time period between arrival of major storms in the Gulf of Mexico, the post-Laura reconnaissance also acted as pre-storm reconnaissance for Hurricane Delta. Prior to the landfall of Hurricane Delta (07 October 2020), a pre-storm reconnaissance was performed in the wetlands of Terrebonne Bay, near Houma, Louisiana, where the storm track was originally projected to make landfall. Post-Delta reconnaissance was performed at RWR on 26 October 2020. Two transects within RWR were the primary interest for this study: one termed the natural shoreline (not fully protected by the breakwater) and one in an area with a protected shoreline (protected by the breakwater). The two transects were visited for instrumentation staging and data reconnaissance on 25 August 2020 before the landfall of Hurricane Laura, on 4 September 2020 after the landfall of Hurricane Laura, and on 26 October 2020 after the landfall of Hurricane Delta.
USDA National Agricultural Imagery Program (NAIP) aerial imagery of the study site in 2004 (Figure 2A), 2009 (Figure 2B), and 2019 (Figure 2C), and NOAA Hurricane Delta (2020) post-storm aerial imagery (Figure 2D) are shown in Figure 2. Each of the four aerial images are geo-referenced and cropped to display the same region, and each show the locations of the two study transects and the eight monitoring stations which were implemented in the pre-storm deployment. All eight monitoring stations were located on land in 2004 (Figure 2A) and 2009 (Figure 2B). The shoreline monitoring stations, NAT-1 and BW-1 were both located in vegetated saltmarsh wetlands well inland of the shoreline in 2004 and 2009. Between 2009 and 2019, the shoreline experienced approximately 170 m of retreat (Figure 2C) as evidenced by the transition of the offshore monitoring station from wetland to open-water. No significant pond expansion is visible inland, suggesting that wetland elevation and vegetation health in the saltmarsh in this system are relatively stable until directly affected by processes such as shoreline retreat (Cadigan et al., 2020). The location of the edge of the breakwater noted in Figure 2D corresponds to the progress made towards construction of the breakwater system between 2019–2020 prior to the 2020 hurricane season.
During each of these field explorations, the breakwater and natural transects were surveyed with a GPS-RTK system to monitor elevation profiles from the shoreline inland to infer geomorphological changes and sediment deposition on the marsh platform. To avoid issues with identifying the shoreline location in the dynamic environment of RWR, each transect featured a consistent location across all three site visits from which distance inland was measured. In the natural shoreline transect, wave gauges were placed at four (4) locations at equal spacing from the shoreline inland. In the breakwater transect, gauges were placed at three (3) locations from the shoreline inland. In addition, a wave gauge was placed offshore in water depth of 3.3 m. At each wave gauge location apart from the offshore gauge, above-ground biomass samples were collected by randomly placing a 0.25 m × 0.25 m PVC square on the ground, cutting, removing and bagging all vegetation within the square. To help preserve the quality of the above-ground biomass during transport back to the laboratory, all samples were kept cool in an ice-chest from collection until transfer to a cold-storage room at Louisiana State University. Site instrumentation is depicted in Figure 3.
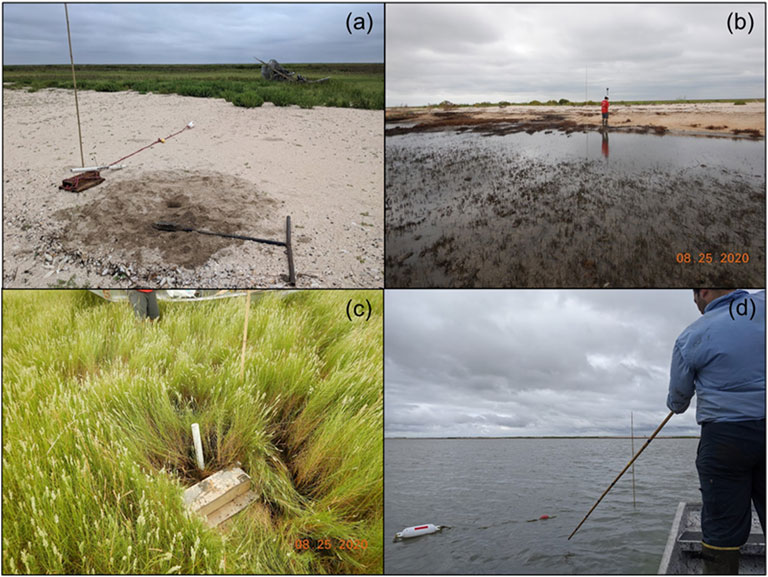
FIGURE 3. Placing wave gauge and burying piezometers along beach shoreline (A), conducting GPS-RTK measurements from the shoreline-inland (B), typical study site layout with wave gauge, cane-pole marker, and PVC pipe attached to buried piezometers (C), and deploying wave gauge offshore (D).
At each wave gauge site, TruBlue piezometer arrays were placed with one piezometer located just beneath the root mat (∼30 cm below surface) and another approximately 1 m below surface. The wave gauges and piezometers recorded pressure hourly. Unfortunately, due to faulty equipment only two of the total twenty TruBlue sensors placed along the two main transects (as well as those further inland near buildings which house RWR’s research facilities) retained recorded data. To rapidly capture high-resolution aerial products of the sites, two different UAVs were deployed; the DJI Mavic Pro 2 and the DJI Matrice 210. While the DJI Mavic Pro 2 was used to capture aerial imagery to be processed into high-resolution orthorectified images (orthomosaic), the DJI Matrice 210 was flown with a MicaSense Altum multispectral sensor attached to collect multispectral imagery that could be utilized to calculate Normalized Difference Vegetation Index (NDVI) (Broussard et al., 2018; Klemas 2013). All UAV surveys were planned using Pix4Dcapture, a commercial software application developed for creating and executing autonomous UAV flight plans (Pix4D). The DJI Mavic Pro 2 was flown in a grid pattern of parallel flight lines with 80% frontal overlap and 70% side overlap from an approximate altitude of 40 m and a camera angle set at 70°. The DJI Matrice 210 was flown with all of the same flight settings as the DJI Mavic Pro except for the camera angle, which was set at 90°. Images were geotagged during capture through the UAVs’ on-board GPS. Image processing was executed using Pix4Dmapper, a commercial software designed to be compatible with Pix4Dcapture and built for processing UAV imagery and data (Pix4D). Multispectral imagery was radiometrically calibrated in the program using images captured of a calibrated reflectance panel prior to the DJI Matrice 210 surveys. The resulting NDVI maps were compared to NDVI values calculated from Sentinel-2 satellite imagery retrieved and processed using Google Earth Engine (Gorelick et al., 2017). Cone penetrometer tests (CPT) were performed using a modified sleeve designed to better capture the effects of vegetation in the soil column after Hurricane Delta on 26 October 2020 along both transects to measure sediment shear strength and to identify any stratigraphic changes (Jafari et al., 2019a; Harris B. D. et al., 2020; Cadigan et al., 2020; Harris et al., 2021). Multispectral imagery at both transects was collected through DJI Matrice 210 surveys on 4 September 2020 and 26 October 2020 and true-color aerial imagery at both transects was captured via DJI Mavic Pro 2 surveys after Hurricane Delta on 26 October 2020. In addition to instrumentation placed along the natural and breakwater-protected transects, observations were made of a large, fluidized mud deposit at Rollover Bayou. Sediment density observations and deposition thickness measurements were made on-the-ground by researchers from Comite Resources, Inc. Drone surveys using similar methodology to the aforementioned transects were also conducted on the fluidized mud deposit.
Wave Characteristics
The wave gauges were sampled at 10 Hz to take continuous absolute pressure data. The recorded pressure (
where
The temporal variations of water level,
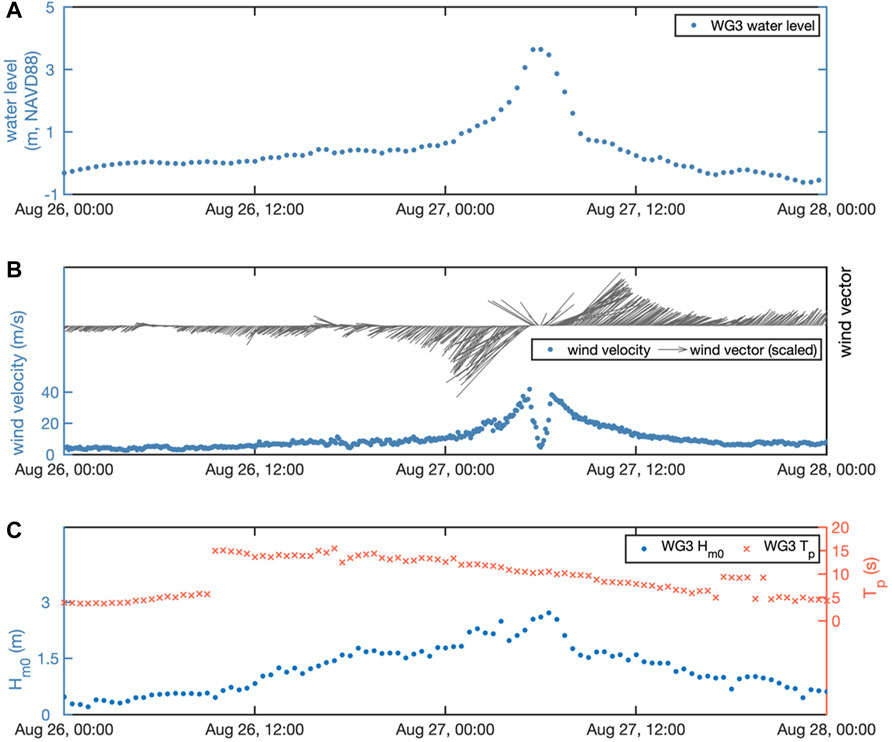
FIGURE 4. Time series of water level at the offshore wave gauge (A), wind speed and direction at NOAA station 8768094 (B), and zero-moment wave height
The wave height reductions along the two transects are quantified and demonstrated in Figure 5. The wave height reduction rate is calculated as
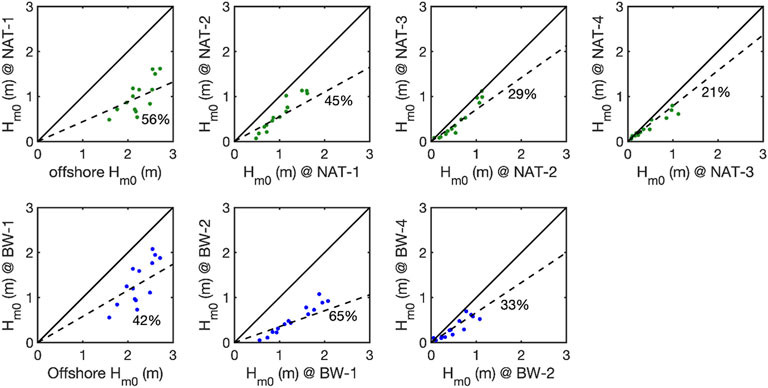
FIGURE 5. Comparison of measured zero-moment wave heights at neighboring wave gauges along the two transects.
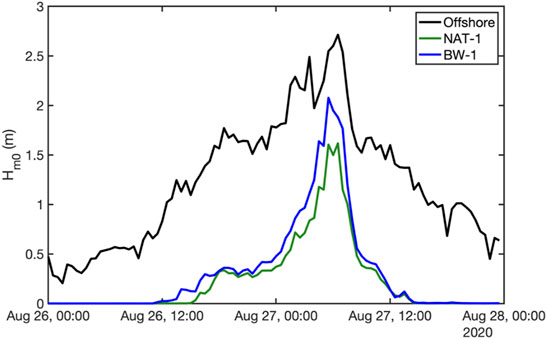
FIGURE 6. Comparisons of zero-moment wave heights at the offshore wave gauge, NAT-1 and BW-1.
Compared with
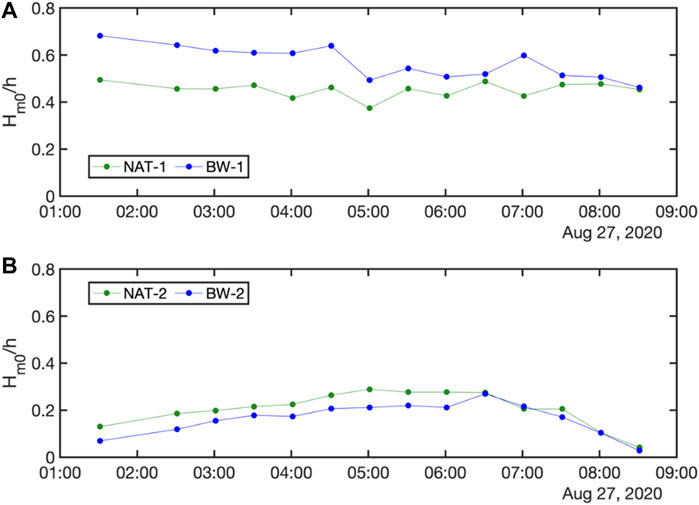
FIGURE 7. Time series of wave height to water depth ratio at wave gauges near the shoreline, i.e., NAT-1 and BW-1 (A), and at inland wave gauges NAT-2 and BW-2 (B).
The wave height reduction rate per meter, denoted as
On both transects, once the waves reach the interior wetlands, the wave height reduction rate per meter is essentially identical. Between sites BW-1 and BW-2,
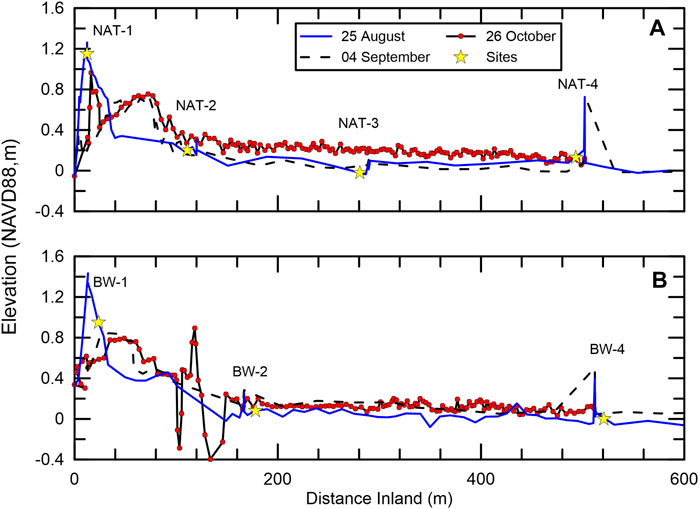
FIGURE 8. RTK-GPS elevation transects from the shoreline inland for the natural shoreline (A) and the (B) breakwater protected shoreline showing the locations of study sites on 25 August 2020, 4 September 2020, and 26 October 2020.
Shoreline Geomorphological Impacts
The coupled effects of erosive removal of overlying sediments by storm-driven overwash, inland deposition of suspended sediments, and consolidation of the soft wetland sediments characteristic of RWR can create significant differences in the forecasted surface elevation over long time periods. These differences become critically important to predicting the viability of shoreline protection projects in coastal Louisiana, where an estimated $50 billion worth of restoration projects are underway or planned (LACPRA, 2017; Harris B. D. et al., 2020). Therefore, there is an important economic and engineering rationale for understanding if and how the geomorphological effects of major storms differ between shorelines protected by engineered systems such as breakwaters and natural unprotected shorelines. The elevation profiles for the breakwater protected shoreline and natural shoreline on 25 August 2020, 4 September 2020, and 26 October 2020, are presented in Figure 8. The August 25th profile represents a pre-storm baseline with which the post-storm effects of Laura and Delta can be compared. Following Hurricane Laura, there is a significant loss of elevation at the shoreline in both the natural Figure 8A and breakwater-protected Figure 8B transects.
The material which composed this elevation appears to have been pushed inland, rather than eroded and transported offshore. After the storms, both transects show a more shallow, rounded ridge at the shoreline than in the pre-storm condition when the ridges were very steep on the side facing the Gulf of Mexico, and slightly less steep on the landside. The high elevation peak present near the shoreline prior to storm landfall is characteristic of elevation profiles at RWR. The natural transect appears to feature more severe overwash and rounding of the beach ridge, as well as more in-land deposition. The half-width of the ridge on the natural transect prior to the passage of Hurricane Laura is approximately 20 m. Following the passage of Hurricane Laura, the half-width of the ridge on the natural transect broadened to 50 m. For the breakwater-protected transect, the half-width of the ridge broadened to 40 m. The location of the high elevation point on the shoreline is located 80 m inland from the shoreline following Hurricane Laura on the natural transect, indicating that the high point was pushed 60 m inland. The location of the high elevation point on the shoreline for the breakwater transect was located 40 m inland, indicating that the high point was pushed 20 m inland after Hurricane Laura.
To better compare the elevation changes after both storms, the RTK-GPS elevation data were processed by linearly interpolating the transects at regularly spaced intervals using MATLAB. The elevation data at the regularly spaced intervals can be directly subtracted from the pre-storm baseline elevations to determine the total elevation changes after Hurricane Laura in September and the total elevation changes after the combined effects of Hurricanes Laura and Delta in October. Using the elevation profiles measured after Hurricane Laura (Aug-Sept) and Delta (Aug-Oct), the differences between the breakwater-protected and natural shoreline transects are shown in Figure 9. The majority of elevation change on both transects at the shoreline occurred following the landfall of Hurricane Laura. For the natural, unmodified shoreline shown in Figure 9A, the elevation loss as the beach is overwashed inland is approximately 1 m between 24 August 2020, and 4 September 2020. In both transects, the elevation loss shown at the shoreline transitions to elevation gain 40 m inland from the shoreline as the low-lying wetlands undergo storm-driven deposition. Following Hurricane Delta, the elevation profile at this site seems to suggest that some material from offshore was deposited along the shoreline. The breakwater transect profile shown in Figure 9B exhibited a similar, but lesser decrease in elevation of about 80 cm at the shoreline ridge.
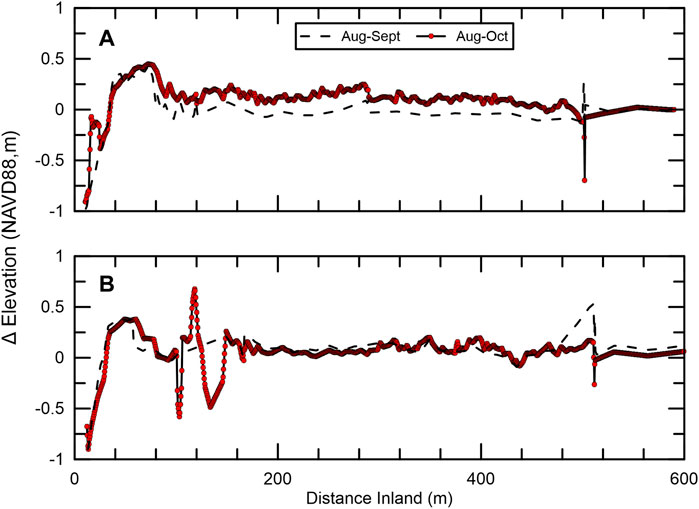
FIGURE 9. Change in elevation from pre-storm baseline after Hurricanes Laura (Aug-Sept) and Delta (Aug-Oct) for the natural transect (A) and the breakwater transect (B).
The overwashed sediment forms a mound which extends approximately 20 m further inland on the natural transect (Figure 9A) when compared to the breakwater-protected transect (Figure 9B). Interestingly, while the inland deposition following Hurricane Laura appears to be similar on both the breakwater-protected and natural shorelines, the breakwater-protected transect exhibits less inland deposition following Hurricane Delta than the natural shoreline transect. Following Delta, approximately 25 cm of sediment was deposited broadly across the interior wetlands behind the beach ridge over a distance of 400 m. The breakwater protected transect exhibits no significant elevation change between the post-Delta and post-Laura surveys apart from the interior ridge located between 80–120 m inland. As the interior ridge is bordered to the landside by a depression, the ridge is inferred to be composed of sediments which were deposited as floodwaters retreated from the interior back to the Gulf of Mexico, though the mechanisms behind this potential erosion and deposition event and the reasons why this process is observed in the breakwater transect but not the natural shoreline transect are not well-understood.
Surge and Inundation
The water depths measured across an array of field sensors and the nearby NOAA station located in Calcasieu Pass are displayed in Figure 10. The piezometer measurements for the three piezometers which retained data are shown in Figure 10A. All piezometers which retained data were embedded approximately 30 cm below the marsh surface and are assumed to transmit the full hydrological load from the inundation on the marsh surface. The piezometers which retained data were located at sites NAT-3 and NAT-4, as well as the furthest inland site on the breakwater-protected transect BW-4. The rise in inundation recorded at all three sites is nearly identical as Hurricane Laura began to make landfall at RWR, reaching a peak of just under 4 m. As the eye of the storm passes over the measurement stations, there is a visible drop in ponded depth above the wetland surface (Figure 10A-inset) commiserate with the lowered pressure within the center of the storm (Willoughby, 1998). The drop in measured water levels which corresponds to a decrease in pressure, is approximately 20 cm at each of the three sites. Following passage of the eye, water levels immediately recover to the peak achieved prior to the eye passage before rapidly decreasing as the storm moves inland. The offshore site and water levels measured at station NOAA 8768094 are compared in Figure 10B. The levels measured by the offshore site achieve a much higher peak than the NOAA site located within Calcsieu Pass. The difference of approximately 1.5 m is inferred to be caused by the lcoation of the NOAA station on the weaker western side of the storm, while the offshore site was located in the path of the stronger wind and waves associated with the eastern section of the hurricane. Following the passage of the storm, the water levels begin to again converge, however the NOAA site water levels are slightly lower likely as the station is located further to the north and protected within the shipping channel whereas the offshore site is directly exposed to the Gulf of Mexico. The water levels above the ground surface measured at each of the three sites on the breakwater transect are presented in Figure 10C. Accounting for ground surface elevation, the site at BW-1 measured a greater surge (Figure 10), however the measurements above ground surface for the interior sites provide insight into the period of time which the interior wetlands remain inundated following the passage of the storm. At both interior breakwater sites, BW-2 and BW-4, even while the surge caused by the passage of the hurricane subsides quickly, the sites remain inundated for days after the event. The long inundation period may induce stress on the wetland vegetation within the interior of the wetland, weakening the wetland at the same time that the shoreline is eroded towards those locations. The exposure of site BW-1 directly to the Gulf of Mexico following the drastic elevation change and inland migration of the beach ridge (Figures 8, 9) can be readily observed by comparing the observations recorded at the offshore site and NOAA station in Figure 10B. Similar observations were made along the natural shoreline transect (Figure 10D), though the response to tidal variations in the Gulf of Mexico is more muted and is observed to be delayed by approximately a 12 h period. Again, a numerical model is likely required to determine the observed time delay, though one inference is that the delay may be due to floodwaters draining more rapidly from the interior wetlands out to the Gulf of Mexico on the natural transect, dampening the ability of the shallow tidal variations to be measured by the wave gauge NAT-1.
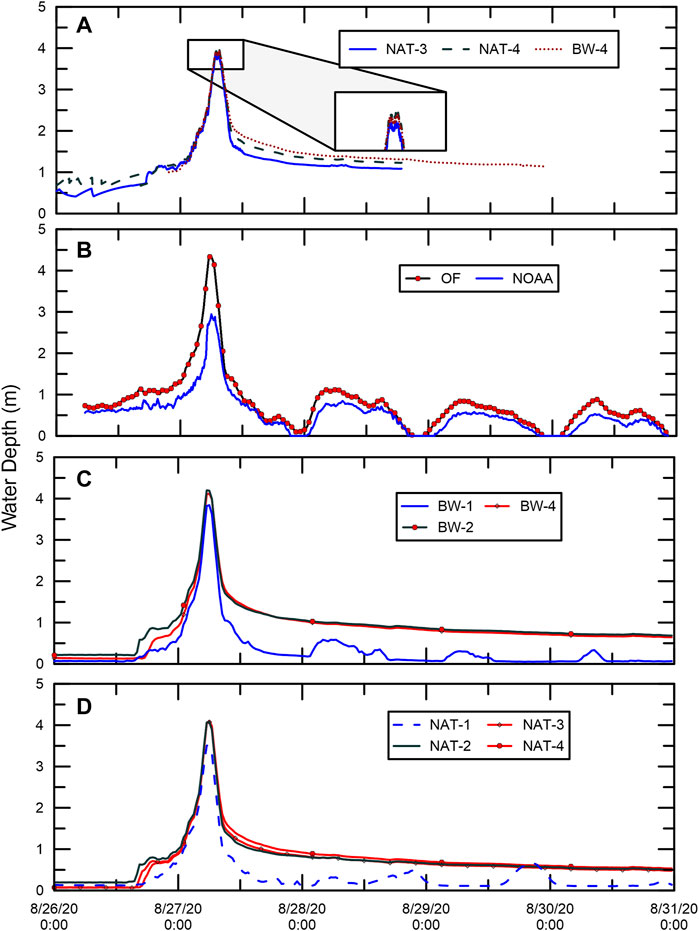
FIGURE 10. Piezometer water levels above surface from Hurricane Laura on (A), Offshore (OF) and NOAA Calcasieu Pass water levels (B), water levels above surface from wave gauges on the breakwater transect (C) and on the natural transect (D).
A comparison showing the water levels above the ground surface at four sites which occur across both transects is shown in Figure 11. This comparison allows for better insight into the time that the interior wetlands remained inundated after the storm passed, as well as the rate at which the inundated wetlands drained as sites NAT-2 and BW-2 and sites NAT-4 and BW-4 are located at similar distances from the shoreline, respectively. As the storm passes, the sites all record nearly identical increases in water depth to approximately 4.1 m. As the storm passes and flood waters retreat, clear differences begin to emerge. Comparing sites NAT-2 and NAT-4, a total time difference of four hours is required for the inundation depth at NAT-4 to drain to a similar depth as NAT-2 (12:00 p.m. 08/27/20, cross-mark in Figure 11). The inundation difference of 30 cm over a period of four hours gives an initial drainage rate of 1.8m/day from the interior wetlands to the shoreline on the natural shoreline, and a hydraulic slope of 0.078% from the interior of the wetlands to the shoreline. The breakwater transect drains at nearly the same rate at both locations of the transect, however for BW-2 to reach the same inundation depth as NAT-2 took eight hours. Taking the difference between the two transects as approximately 1750 m, a hydraulic slope from east-to-west in the interior wetlands of 0.029%. For both transects, the long term drainage rate is 0.20 m/day, however the breakwater transect drained more slowly and thus remains inundated for a longer period of time. The longer inundation period may place more stress on the interior vegetation, leading to long-term differences in vegetative health along the two transects. Given the similar elevation profiles (Figure 8) between the two transects, the observed difference between the time for the floodwaters to retreat seem to indicate that the presence of engineered systems within the wetlands (Figure 2) and the breakwater structure acted to dampen the floodwater retreat in some way.
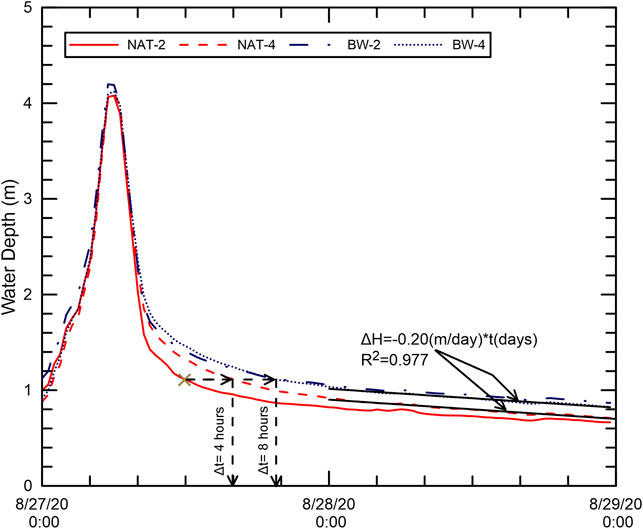
FIGURE 11. Water depth with time at BW-2 and BW-4, and NAT-2 and NAT-4.
Vegetation
The results of above-ground biomass (AGB) measurements, processed according to the procedure in Snedden et al. (2015), at each location along both transects are displayed in Figure 12. The AGB values are initially lowest at site BW-1, and highest at site NAT-2, with the remaining sites falling within a range of 1,500–2000 g/cm2. Following Hurricane Laura, there is a sharp decrease in AGB for site NAT-2, and moderate decreases in all other sites except for BW-1. The increase in AGB at site BW-1 is likely due to experimental error and is not reflective of field observed conditions. Between Hurricanes Laura and Delta, the vegetation appears to have recovered somewhat, as the post-Delta measurements are marginally higher at each study site apart from NAT-2, which endured the most severe degradation following Hurricane Laura. The most in-land sites exhibit the strongest recovery and highest AGB following delta, while there is no clear or discernable trends between the remaining sites or transects apart from site NAT-2 which endured the most severe damage following Hurricane Laura.

FIGURE 12. Above-ground biomass measurements pre-Laura, Post-Laura, and Post-Delta.
NDVI measurements taken from drones (UAV) during field reconnaissance and claculated from satellite measurements along the two transects before Hurricane Laura (August 23), after Laura (September 4) and after Hurricane Delta (October 26) are presented in Figure 13. The NDVI values for the natural shoreline transect (Figure 13A) increase from a value near zero at the shoreline to 0.25 at a distance of 20 m inland. At a distance of 40 m inland, the NDVI values level off and indicate similar vegetative health in the interior wetlands. A similar trend is shown for the breakwater-protected transect (Figure 13B). In both transects, the NDVI values dropped significantly following Hurricane Laura, indicating severe damage to the vegetation in the interior wetlands. The drop in NDVI corresponds to a drop in ABG in Figure 12. The inferred damage to the vegetation in the interior wetlands decreases with distance inland from the shoreline, leading to a trend of increasing NDVI with increasing distance inland. Neither transect displays a significant difference in NDVI after Laura across the entire time period of study.
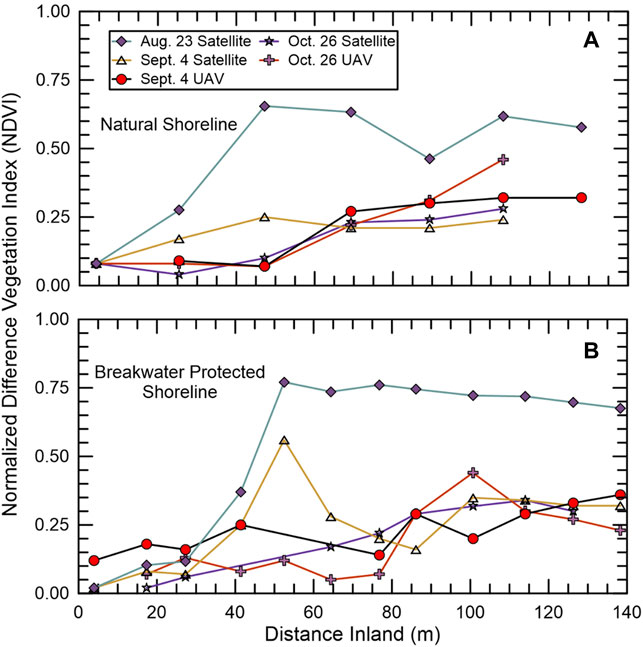
FIGURE 13. NDVI from satellite and UAV on 23 August 2020, 04 September 2020, 26 October 2020, and for the natural (A) and breakwater protected (B) shorelines.
Wetland Strength
The results from the modified cone penetrometer sleeve testing taken following Hurricane Laura using a modified cone designed to more effectively characterize the shear strength of the vegetated upper-most layer of the wetlands are shown in Figure 14. The sites closest to the shoreline, Figure 14A, show very little shearing resistance in the upper 30 cm of the soil column. A slight peak, indicative of a layer of vegetated soil, can be seen at a depth of approximately 40 cm in both the breakwater-protected and natural transects. Moving further inland, the vegetated peak can be seen at a shallower depth in the soil column (Figure 14B). A double-peak shape can be seen in the curve, with the first, weaker peak present in the upper 10–20 cm of the column. This first peak is likely due to sediments deposited on top of the original wetland surface. At this location, coarse grained deposits were not as prevalent as they were close to the shoreline, and the double peak may be due to re-worked and re-deposited vegetative material. The breakwater-protected transect shows a higher resistance value at the deeper peak in the soil column, indicative of the original soil profile prior to storm deposition atop of the soil surface. The higher resistance value at this site for the breakwater-protected transect may be due to the protection provided to the inland wetlands here from smaller-scale inundation events in which higher-salinity waters from the Gulf of Mexico may stress and decrease the health of the inland vegetation of the natural transect. The furthest inland tests, Figure 14C, display similar resistance curves with depth, and a single, sharp peak in the upper soil column. The shape of the resistance with depth curve is similar to other Louisiana wetlands, where the vegetative root depth extends to depths of approximately 20–30 cm (Jafari et al., 2019a; Jafari et al., 2019b; Harris B. D. et al., 2020; Cadigan et al., 2020). The identical profiles, and singular-peaks of the resistance curves, indicate that the furthest inland sites are likely unaffected by the storms to a significant degree as compared to the sites closer to the shoreline. The profiles would also indicate, unlike those in Figure 14B, that the protection afforded to more typical inundation events by the breakwater system to interior wetlands is negated at the distances inland of the shoreline that these tests were taken.
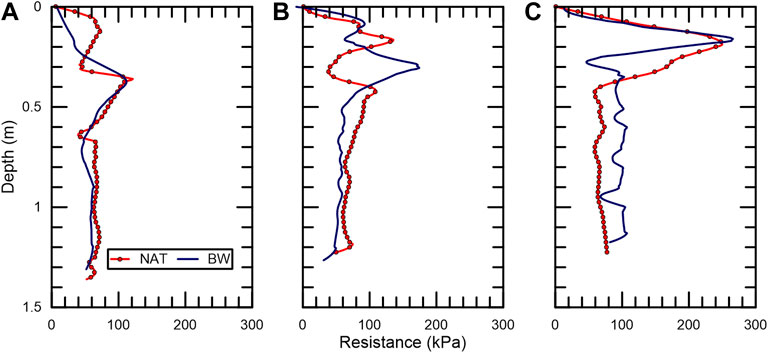
FIGURE 14. Modified cone-penetrometer resistance values with depth for (A) sites closest to the shoreline, (B) the locations at the midpoint between shoreline and furthest inland site, and (C) furthest inland site.
Observations of the Mud Deposit at Rollover Bayou
The storm driven sediment deposition on the interior of the wetlands (Figures 8, 9) is also of great interest as wetland elevation is strongly tied to vegetative health and wetland stability (Cahoon et al., 2006; Chambers et al., 2019; Cadigan et al., 2020). The highest accretion values in RWR by far were found at the mouth of Rollover Bayou, which experienced a major depositional event consisting of a very large lens (in the order of 2.5 km2) of fine grained mud deposit with a thickness of approximately 1800 mm (1.8 m or 6 ft) in the middle and tapering off towards the edges. Surrounding sites had accretion ranging from 1.0 ± 0.1 mm to 446.7 ± 3.3 mm. These observations are similar to previous observations of storm-driven mud deposits on the Chenier Plain. Hurricane Audrey made landfall in June 1957, near the Texas-Louisiana border and generated a 3–4 m storm surge in the study area. Morgan et al. (1958) reported about “a mass of fluid mud that was transported by the storm tide and deposited as a unit”. In the mid-1960s, Coleman (1966) found little change with respect to the distribution of mud in the study area, but added much new information on the physical and biological properties of the mudflat sediments (Kemp, 1986). Coleman (1966) X-rayed mudflat cores which, to the unaided eye, appeared almost featureless and found multiple sets of parallel laminations relatively undisturbed by biological reworking.
Kemp (1986) studied fluid mud dynamics along a 30 km section of the Louisiana coast west of the Southwest Pass of Vermilion Bay on the eastern margin of the Louisiana chenier plain about 10 miles east of Rollover Bayou. There Kemp reported a depositional feature of highly fluid mud with dimensions of 300 m × 1,500 m and a maximum thickness of 2 m. Initial measurements of the elevation of the deposit at Rollover Bayou indicated elevations ranging between 0.44 and 1.8 m. The soil had a bulk density of 1.1 g/cm3, moisture content of 32.7%, and was 10.2% organic matter. Previous observations of fluid mud deposits on the Chenier Plain by Kemp (1986) indicate bulk densities of 1.2 g/cm3 at the surface to 1.4 g/cm3 a meter below. More recent surveys conducted after Hurricane Rita in 2005 by Turner et al. (2006) reported an average bulk density of the newly deposited material of 0.37 g/cm3 with a range of zero to 1.78 g/cm3, which was highest near the coastline and decreased inland. Turner et al. (2006) reported that Hurricane Rita deposited mud with a thickness of 5.18 cm, with deposition greatest near the center of the storm track and along the eastern side of the hurricane path. The western side of the storm track had lower sediment deposition thicknesses corresponding to the lower surge and inundation times from west to east. The observations of Kemp (1986), together with the sedimentological data provided by Coleman (1966), and the observations presented here, indicate that chenier plain mudflats are deposited rapidly under the highest energy conditions this coast experiences (Kemp, 1986).
Conclusion
The results of multi-institutional and multi-disciplinary field observations made in Rockefeller Refuge during the intense 2020 hurricane season indicate key differences and similarities between a section of wetlands protected by a breakwater system and a natural, unprotected section. In addition, observations of a storm-driven fluidized mud deposit in Rockefeller Refuge provide key insight into the energy required for the wetlands along the Chenier Plain to receive sediment deposition which may allow for the maintenance of interior wetland stability. Several differences in the response of the protected and natural shorelines to major hurricanes became apparent over the 2020 hurricane season:
• The breakwater protected shoreline drained more slowly following the passage of Hurricane Laura. The difference in drainage times may be due to the engineered water features in the breakwater transect, however a numerical model is required to fully understand the processes and causes behind this observed difference.
• On both transects, once the waves reach the interior wetlands, the wave height reduction rate per meter is essentially identical and seems to be controlled primarily by vegetation.
• The difference in inundation period between the two transects may have implications for long-term marsh health, as prolonged flooding and exposure to sea-strength saltwater may negatively impact plant productivity and marsh elevation.
Several similarities in the response of the protected and natural shorelines to major hurricanes became apparent over the 2020 hurricane season:
• The storm induced surge on the wetlands reached similar values at the same time on both the protected and natural shorelines.
• Vegetative health measured remotely using NDVI seem to have responded similarly in both the breakwater protected and natural shorelines. However as there may be a latent effect caused by differing inundation periods, long-term NDVI measurements are required to confirm this conclusion.
• NDVI analysis the following years which may show greater differences among the natural and hybrid transects as some vegetation effects are latent. For example, if vegetation roots were killed by prolonged inundation in the breakwater transect, vegetation regrowth the following year may be less extensive and make the area more susceptible to erosion/ponding/etc.
• No significant difference is present between the CPT resistance profiles with depth at each site between the two transects.
• Double-peaks in the CPT resistance curve with depth may be indicative of reworked vegetation or storm deposition atop the now-buried, previous wetland surface.
• Furthest inland sites show curves characteristic of vegetated Louisiana wetlands, though are much higher than sites in the Terrebonne Basin.
Observations of the fluid mud deposit at Rollover Bayou in Rockefeller Refuge indicates that:
• Massive deposits of fluid mud are driven onto the wetland platform on the more energetic, western side of hurricanes.
• The effect of breakwater systems on the deposition of this fluidized mud is still unclear.
• The majority of mudflat deposits, and interior deposits which control the elevation and in turn the health of the sediment-starved wetland system in the Chenier Plain, are deposited by only the highest energy storm events which strike the coastline.
Data Availability Statement
The raw data supporting the conclusion of this article will be made available by the authors, without undue reservation.
Author Contributions
JC: Selection of study site, supervision, methodology, field deployment, data collection, data analysis, writing; JB: Selection of study site, design of instrumentation transects, methodology, data analysis, writing; NJ: Selection of study site, supervision, methodology, field deployment, data collection, writing—review and editing; LZ: Wave and surge data analysis, data curation, writing—review and editing; AB: Selection of study site, design of instrumentation transects, methodology, resources, writing, reviewing and editing; QC: Selection of study site, design of instrumentation transects, methodology, resources, writing—review and editing; BR: Selection of study site, design of instrumentation transects, methodology, resources, writing—review and editing; BH: Methodology, resources, writing—review and editing; CO: Selection of study site, design of instrumentation transects, methodology, resources, writing—review and editing; RL: Selection of study site, design of instrumentation transects, methodology, resources, writing—review and editing; GPK: Selection of study site, design of instrumentation transects, methodology, resources, writing—review and editing; JND: Selection of study site, design of instrumentation transects, methodology, resources, writing—review and editing; JWD: Selection of study site, design of instrumentation transects, methodology, resources, writing—review and editing; HU: Selection of study site, design of instrumentation transects, field deployment.
Funding
Funding for the study has been partially provided by the National Science Foundation through grants NSF 2139882, 2139883, 1829136, 1848650, and 1939275, as well as through the United States Army Corps of Engineers Regional Sediment Management program. Student support provided through the National Science Foundation Graduate Research Fellowship Program and the Louisiana Coastal Science Assistantship Program.
Conflict of Interest
Authors RL and JD were employed by Comite Resources, Inc.
The remaining authors declare that the research was conducted in the absence of any commercial or financial relationships that could be construed as a potential conflict of interest.
Publisher’s Note
All claims expressed in this article are solely those of the authors and do not necessarily represent those of their affiliated organizations, or those of the publisher, the editors and the reviewers. Any product that may be evaluated in this article, or claim that may be made by its manufacturer, is not guaranteed or endorsed by the publisher.
Acknowledgments
The authors are grateful to T. Baker Smith for providing boat and logistical support, to the NSF RAPID instrumentation depot and team, and to Phillip “Scooter” Trosclair for facilitating access to Rockefeller Wildlife Refuge.
References
Balaguru, K., Foltz, G. R., and Leung, L. R. (2018). Increasing Magnitude of Hurricane Rapid Intensification in the Central and Eastern Tropical Atlantic. Geophys. Res. Lett. 45, 4238–4247. doi:10.1029/2018gl077597
Cadigan, J., Stagg, C. L., Jafari, N., Harris, B., and Laurenzano, C. (2020). December)Geotechnical Characterization of a Saline Wetland with Implications towards Quantifying Peat Collapse. AGU Fall Meet. Abstr. 2020, 0577–B106.
Caffey, R., Wang, H., Niu, H., Froeba, J., and Isaacs, J. (2022). Projected Infrastructure, Revenue and Resource Losses to Louisiana Fisheries from the Hurricanes of 2020 and 2021. Baton Rouge, United States: Louisiana State University, Louisiana Sea Grant & Louisiana Department of Wildlife and Fisheries.
Cahoon, D. R., Hensel, P. F., Spencer, T., Reed, D. J., McKee, K. L., and Saintilan, N. (2006). “Coastal Wetland Vulnerability to Relative Sea-Level Rise: Wetland Elevation Trends and Process Controls,” in Wetlands and Natural Resource Management (Berlin, Heidelberg: Springer), 271–292.
Campbell, T., Benedet, L., and Finkl, C. W. (2005). Regional Strategies for Coastal Restoration along the Louisiana Chenier Plain. J. coastal Res., 268–283.
Cangialosi, J. P., and Berg, R. (2021). National Hurricane Center Tropical Cyclone Report: Hurricane Delta. Miami, FL: National Hurricane Center.
Chambers, L. G., Steinmuller, H. E., and Breithaupt, J. L. (2019). Toward a Mechanistic Understanding of “Peat Collapse” and its Potential Contribution to Coastal Wetland Loss. Ecology 100 (7), e02720. doi:10.1002/ecy.2720
Cohen, M. C. L., De Souza, A. V., Liu, K.-B., Rodrigues, E., Yao, Q., Pessenda, L. C. R., et al. (2021). Effects of Beach Nourishment Project on Coastal Geomorphology and Mangrove Dynamics in Southern Louisiana, USA. Remote Sensing 13, 2688. doi:10.3390/rs13142688
Coleman, J. M. (1966). RECENT COASTAL SEDIMENTATION: CENTRAL LOUISIANA COAST. Baton Rouge, LA, United States: LOUISIANA STATE UNIV BATON ROUGE COASTAL STUDIES INST.
Eley, E. N., Subrahmanyam, B., and Trott, C. B. (2021). Ocean-Atmosphere Interactions during Hurricanes Marco and Laura (2020). Remote Sensing 13, 1932. doi:10.3390/rs13101932
Gary, D. L. (1979). Recreational Dwellings in the Louisiana Coastal Marsh. Baton RougeCenter for Wetland Resources: Louisiana State University.
Geesey, B. L., Heilman, D. J., and Mcpherson, R. L. (20112011). “Rockefeller Refuge Gulf Shoreline protection Demonstration,” in Coastal Engineering Practice, 658–671. doi:10.1061/41190(422)55
Harris, B. D., Day, D. J., Cadigan, J. A., Jafari, N. H., Bailey, S. E., and Tyler, Z. J. (2021). Establishment of Soil Strength in a Nourished Wetland Using Thin Layer Placement of Dredged Sediment. PLoS ONE 16, e0251420. doi:10.1371/journal.pone.0251420
Harris, B. D., Cadigan, J., Day, D., and Jafari, N. (2020b). “Geotechnical Characterization of an Eroding Wetland,” in Geo-Congress 2020, 740–748. doi:10.1061/9780784482810.077
Harris, B. D., Johnson, C., Jafari, N. H., Chen, Q., and Ozdemir, C. E. (2020a). Effects of Coupled Consolidation and Overwash Processes on a Low-Lying headland System. Coastal Eng. 160, 103746. doi:10.1016/j.coastaleng.2020.103746
Hill, S., and Belhadjali, K. (2005). “Rockefeller Refuge Gulf Shoreline Stabilization Ecological Review (ME-18),” in Cwppra (Baton Rouge: Louisiana Department of Natural Resources Restoration Technology Section).
Jafari, N. H., Chen, Q., and Cadigan, J. (2020). Rapid Deployment and post-storm Reconnaissance of hurricane Laura. Int. Conf. Coastal. Eng., 60. doi:10.9753/icce.v36v.waves.60
Jafari, N. H., Harris, B. D., Cadigan, J. A., and Chen, Q. (2019a). Piezocone Penetrometer Measurements in Coastal Louisiana Wetlands. Ecol. Eng. 127, 338–347. doi:10.1016/j.ecoleng.2018.12.012
Jafari, N. H., Harris, B. D., Cadigan, J. A., Day, J. W., Sasser, C. E., Kemp, G. P., et al. (2019b). Wetland Shear Strength with Emphasis on the Impact of Nutrients, Sediments, and Sea Level Rise. Estuarine, Coastal Shelf Sci. 229, 106394. doi:10.1016/j.ecss.2019.106394
Karimpour, A., and Chen, Q. (2017). Wind Wave Analysis in Depth Limited Water Using OCEANLYZ, A MATLAB Toolbox. Comput. Geosciences 106, 181–189. doi:10.1016/j.cageo.2017.06.010
Kemp, G. P. (1986). Mud Deposition at the Shoreface: Wave and Sediment Dynamics on the Chenier Plain of Louisiana, LSU Historical Dissertations and Theses. Avaliable At: https://digitalcommons.lsu.edu/gradschool_disstheses/4305.
LACPRA (2017). Coastal Master Plan (Louisiana's Coastal Protection and Restoration Authority). Avaliable at: https://coastal.la.gov/our-plan/2017-coastal-master-plan/ (Accessed November 1, 2021).
Louisiana Department of Wildlife and Fisheries (2021). Rockefeller Wildlife Refuge. Available: https://www.wlf.louisiana.gov/page/rockefeller-wildlife-refuge.
Martin Associates (2021). The Economic Impacts of the Calcasieu Ship Channel conducted for the Port of Lake Charles. Avaliable at: https://portlc.com/wp-content/uploads/2021/12/PORT.Executive-Summary-2021-POLC-Economic-Impact-Study.pdf
Mcbride, R. A., Anderson, J. B., Buynevich, I. V., Cleary, W., Fenster, M. S., Fitzgerald, D. M., et al. (2013). “10.8 Morphodynamics of Barrier Systems: A Synthesis,” in 10.8 Morphodynamics of Barrier Systems: A SynthesisTreatise on Geomorphology. Editor J. F. Shroder (San Diego: Academic Press), 166–244. doi:10.1016/b978-0-12-374739-6.00279-7
Mcbride, R. A., Taylor, M. J., and Byrnes, M. R. (2007). Coastal Morphodynamics and Chenier-Plain Evolution in Southwestern Louisiana, USA: A Geomorphic Model. Geomorphology 88, 367–422. doi:10.1016/j.geomorph.2006.11.013
Morton, R. A., and Barras, J. A. (2011). Hurricane Impacts on Coastal Wetlands: A Half-Century Record of Storm-Generated Features from Southern Louisiana. J. Coastal Res. 275, 27–43. doi:10.2112/jcoastres-d-10-00185.1
Oscar, K. H., Walker, N. D., and Christopher, M. (2001). Sedimentation along the Eastern Chenier Plain Coast: Down Drift Impact of a Delta Complex Shift. J. Coastal Res. 17, 72–81.
Pasch, R. J., Berg, R., Roberts, D. P., and Papin, P. P. (2021). National Hurricane Center Tropical Cyclone Report: Hurricane Laura. Miami, FL: N.H. Center. NOAA.
Penland, S., Connor, P. F., Beall, A., Fearnley, S., and Williams, S. J. (2005). Changes in Louisiana's Shoreline: 1855–2002. J. Coastal Res. 21, 7–39.
Roberts, H. H. (1997). Dynamic Changes of the Holocene Mississippi River delta plain: The delta Cycle. J. Coastal Res. 13, 605–627.
Seabrook, S. R., and Hall, K. R. (1998). Wave Transmission at Submerged Rubble mound Breakwaters. Coastal Eng. Proc. 1, 26. doi:10.9753/icce.v26.%25p
Selman, W., Salyers, B., Salyers, C., Perry, G., Elsey, R., Hess, T., et al. (2011). in Rockefeller Wildlife Refuge Management Plan. Editor L. D. O. W. A. Fisheries (Grand Chenier, LA: Rockefeller Wildlife Refuge).
Shiner Moseley and Associates (2002). Geotechnical Study (Part I of II) Gulf Shoreline Stabilization Project, Rockefeller Refuge. Cameron Parish, Louisiana: Corpus Christi, TX: Fugro South.
Shows, H. (2019) Living Shorelines as Alternative Methods of Shoreline Protection. Baton Rouge, LA: Louisiana State University. MS Thesis.
Snedden, G. A., Cretini, K., and Patton, B. (2015). Inundation and Salinity Impacts to above- and Belowground Productivity in Spartina Patens and Spartina Alterniflora in the Mississippi River Deltaic plain: Implications for Using River Diversions as Restoration Tools. Ecol. Eng. 81, 133–139. doi:10.1016/j.ecoleng.2015.04.035
Turner, R. E., Baustian, J. J., Swenson, E. M., and Spicer, J. S. (2006). Wetland Sedimentation from Hurricanes Katrina and Rita. Science 314 (5798), 449–452. doi:10.1126/science.1129116
Willoughby, H. E. (1998). Tropical Cyclone Eye Thermodynamics. Mon. Wea. Rev. 126 (12), 3053–3067. doi:10.1175/1520-0493(1998)126<3053:tcet>2.0.co;2
Wise, L. A., Mclellan, T. N., and Byrnes, M. R. (2004). “Feasibility Analysis of Shore Protection Alternatives for Rockefeller Wildlife Refuge in the Chenier Plain of Southwestern Louisiana (USA),” in Coastal Structures 2003, Portland Oregon, 2003-8-26 to 2003-8-30 (United States: American Society of Civil Engineers), 1142–1154. doi:10.1061/40733(147)94
Xi, D., and Lin, N. (2021). Sequential Landfall of Tropical Cyclones in the United States: From Historical Records to Climate Projections. Geophys. Res. Lett. 48, e2021GL094826. doi:10.1029/2021gl094826
Yao, Q., Liu, K.-B., and Ryu, J. (2018). Multi-proxy Characterization of Hurricanes Rita and Ike Storm Deposits in the Rockefeller Wildlife Refuge, Southwestern Louisiana. J. Coastal Res. 85, 841–845. doi:10.2112/si85-169.1
Zhou, S., Kan, P., Huang, Q., and Silbernagel, J. (2021). A Guided Latent Dirichlet Allocation Approach to Investigate Real-Time Latent Topics of Twitter Data during Hurricane Laura. J. Inf. Sci. doi:10.1177/01655515211007724
Zhu, L., Chen, Q., Wang, H., Capurso, W., Niemoczynski, L., Hu, K., et al. (2020). Field Observations of Wind Waves in Upper Delaware Bay with Living Shorelines. Estuaries and Coasts 43 (4), 739–755. doi:10.1007/s12237-019-00670-7
Keywords: hurricane impact, wave attenuation and erosion control, storm surge, chenier plain, breakwater, field measured data, natural infrastructure, shoreline retreat
Citation: Cadigan JA, Bekkaye JH, Jafari NH, Zhu L, Booth AR, Chen Q, Raubenheimer B, Harris BD, O’Connor C, Lane R, Kemp GP, Day JN, Day JW and Ulloa HO (2022) Impacts of Coastal Infrastructure on Shoreline Response to Major Hurricanes in Southwest Louisiana. Front. Built Environ. 8:885215. doi: 10.3389/fbuil.2022.885215
Received: 27 February 2022; Accepted: 08 April 2022;
Published: 27 April 2022.
Edited by:
Jens Figlus, Texas A&M University, United StatesReviewed by:
Stephanie M. Smallegan, University of South Alabama, United StatesTakayuki Suzuki, Yokohama National University, Japan
Jon Miller, Stevens Institute of Technology, United States
Copyright © 2022 Cadigan, Bekkaye, Jafari, Zhu, Booth, Chen, Raubenheimer, Harris, O’Connor, Lane, Kemp, Day, Day and Ulloa. This is an open-access article distributed under the terms of the Creative Commons Attribution License (CC BY). The use, distribution or reproduction in other forums is permitted, provided the original author(s) and the copyright owner(s) are credited and that the original publication in this journal is cited, in accordance with accepted academic practice. No use, distribution or reproduction is permitted which does not comply with these terms.
*Correspondence: Jack A. Cadigan, Jack.A.Cadigan@usace.army.mil